Cloud Computing Infographic
PowerPoint Template and Google Slides Theme


Features
- 6 Unique slides
- Fully editable and easy to edit in Microsoft Powerpoint, Keynote and Google Slides
- 16:9 widescreen layout
- Clean and professional designs
- Export to JPG, PDF or send by email
- Remove from favorites
Powerpoint Template
1 MB
Google Slides Template
External link
Keynote Template
1 MB
Recommend
- Remove from favorites
Powerpoint Template
1 MB
Google Slides Template
External link
Keynote Template
1 MB
5 slides
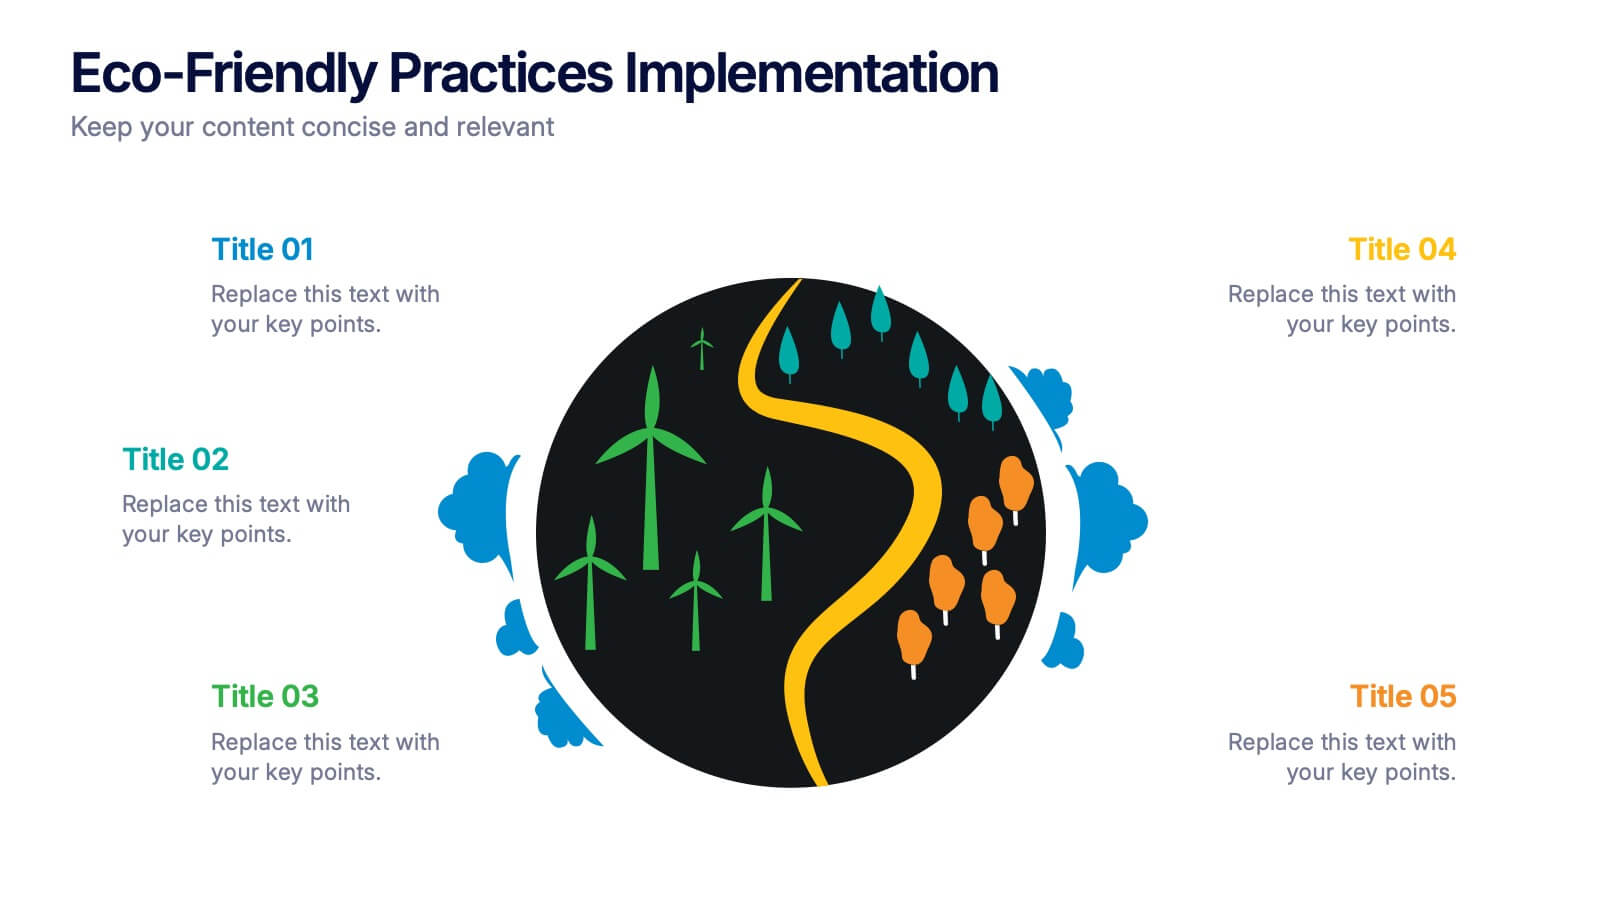
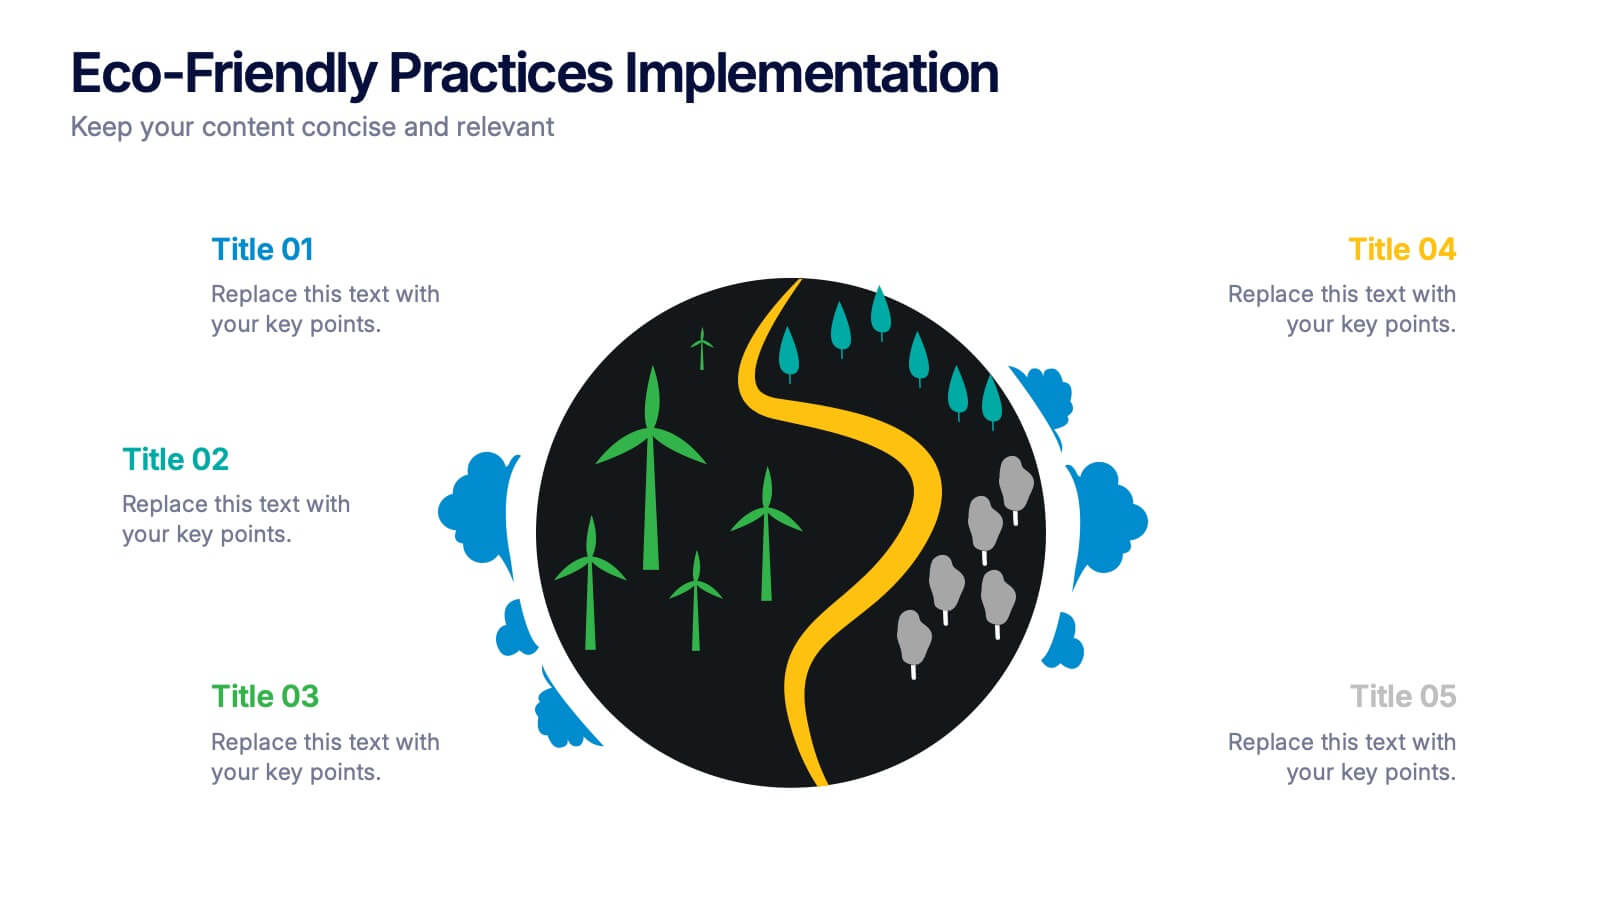
Eco-Friendly Practices Implementation Presentation
Brighten your message with a clean, circular design that maps out every green initiative step-by-step. This visual template illustrates key eco-conscious actions, helping you present sustainable practices with ease. Perfect for environmental reports, team strategies, or policy pitches. Fully compatible with PowerPoint, Keynote, and Google Slides for flexible editing.
- Remove from favorites
Powerpoint Template
8 MB
Google Slides Template
External link
Keynote Template
9 MB
6 slides
International Business Strategy World Map Presentation
Showcase your company’s global presence and strategic insights with this dynamic International Business Strategy World Map slide. Each marker corresponds to key business regions, linked to five customizable titles for region-specific data, objectives, or metrics. Clean design with a vertical legend layout keeps the focus on your insights. Fully editable and compatible with PowerPoint, Keynote, and Google Slides.
- Remove from favorites
Powerpoint Template
1 MB
Google Slides Template
External link
Keynote Template
1 MB
5 slides
Natural Sources of Energy Infographics
The importance of Natural Energy lies in its ability to reduce environmental impact, promote energy security, and create economic benefits. This vertical infographic template showcases the various types of renewable energy sources. It has a modern and clean design that highlights the importance of using sustainable energy sources. The template features customizable photo layouts and charts, along with icons and illustrations related to the energy sector. With this template, you can easily create an infographic that educates your audience about the importance of renewable energy sources and encourages them to adopt sustainable practices.
- Remove from favorites
Powerpoint Template
2 MB
Google Slides Template
External link
Keynote Template
3 MB
5 slides
Regional Economic Growth in Asia Map Presentation
Explore economic landscapes with the "Regional Economic Growth in Asia Map" template, an essential tool for visualizing economic data across Asia. Designed for business strategists and policymakers, it offers detailed insights and regional analysis to support informed decision-making. Compatible with PowerPoint and Google Slides, this template is flexible for both academic and professional uses.
- Remove from favorites
Powerpoint Template
1 MB
Google Slides Template
External link
Keynote Template
1 MB
7 slides
IT Architecture Services Infographic Presentation
An IT Architecture Infographic presents information related to the design, structure, and components of an organization's architecture. IT Architecture refers to the overall framework of an organization's IT systems and infrastructure. This template is designed to communicate the design, structure, and components of your organization's IT architecture. The template features a modern design with a blue color scheme, giving your presentation a professional and sleek look. It is compatible with Powerpoint, Keynote, and Google Slides, making it simple for you to create a professional presentation.
- Remove from favorites
Powerpoint Template
1 MB
Google Slides Template
External link
Keynote Template
2 MB
5 slides
Visual Data Representation Bubble Map
Display complex data in a clean, engaging format with this Visual Data Representation Bubble Map. Ideal for highlighting key points, data clusters, or relationships, each bubble can be customized to match your topic. Perfect for presentations in business, research, or strategy—fully editable in PowerPoint, Keynote, and Google Slides.
- Remove from favorites
Powerpoint Template
1 MB
Google Slides Template
External link
Keynote Template
1 MB
5 slides
Energy and Natural Resources Infographics
Energy and natural resources are essential components of modern societies and economies. These vertical infographics are designed to showcase key information about energy sources, natural resources, and their impact on the environment. This template is ideal for educational purposes, awareness campaigns, environmental organizations, and companies in the energy sector. The visuals display the different types of renewable energy, such as solar, wind, hydro, geothermal, and biomass, along with their benefits and growth potential. This is fully customizable and compatible with Powerpoint, Keynote, and Google Slides.
- Remove from favorites
Powerpoint Template
1 MB
Google Slides Template
External link
Keynote Template
1 MB
6 slides
Six Sigma Process Improvement Presentation
Dive into efficiency with our Six Sigma Process Improvement template! This presentation guide maps out each step from Define to Control, ensuring your project targets are met with precision. Ideal for quality assurance and process optimization, it's compatible with PowerPoint, Keynote, and Google Slides. Perfect for professionals keen on streamlining operations and enhancing productivity.
- Remove from favorites
Powerpoint Template
1 MB
Google Slides Template
External link
Keynote Template
1 MB
7 slides
Sales Cycle Infographic
A sales cycle, refers to the series of stages or steps that a salesperson or a sales team follows to convert a prospective customer into a paying customer. This infographic template is a structured approach to lead a potential customer from the initial contact to making a purchase. Compatible with Powerpoint, Keynote, and Google Slides. This is an illustrative guide to the fundamental stages of the sales journey. Equip yourself with an understanding of how sales progress, from prospecting to closing the deal, enabling you to optimize your strategies and drive success in the dynamic world of sales.
- Remove from favorites
Powerpoint Template
1 MB
Google Slides Template
External link
Keynote Template
2 MB
10 slides
Human Resources Process Diagram
The "Human Resources Process Diagram" presentation template is designed to streamline the visualization of the HR process from analysis to evaluation. This template allows for a detailed display of the stages involved in HR processes, such as analyzing, designing, developing, implementing, and evaluating, making it ideal for training sessions, strategic HR presentations, and management meetings. The circular flow of the diagram emphasizes the continuous and interconnected nature of HR activities, facilitating better understanding and communication of complex processes. Each segment is color-coded for easy identification and reference, enhancing both the aesthetic appeal and the functionality of the presentation.
- Remove from favorites
Powerpoint Template
1 MB
Google Slides Template
External link
Keynote Template
1 MB
6 slides
Project Management Responsibility Assignment Matrix Infographics
Effectively assign responsibilities in your projects with our Project Management Responsibility Assignment Matrix (RAM) infographic template. This template is fully compatible with popular presentation software like PowerPoint, Keynote, and Google Slides, allowing you to easily customize it to illustrate and communicate the roles and responsibilities of team members in your project. The Project Management RAM infographic template offers a visually engaging platform to outline the key tasks, deliverables, and responsibilities of project team members. Whether you're a project manager, team leader, or involved in project planning, this template provides a user-friendly canvas to create informative presentations and project management materials. Optimize your project management processes with this SEO-optimized Project Management RAM infographic template, thoughtfully designed for clarity and ease of use. Customize it to showcase the matrix structure, define roles (RACI), and ensure that everyone on the team understands their responsibilities, ensuring efficient project execution. Start crafting your personalized infographic today to excel in project management responsibility assignment.
- Remove from favorites
Powerpoint Template
1 MB
Google Slides Template
External link
Keynote Template
2 MB
5 slides
Business Decision-Making Questions
Streamline critical thinking with this interactive Business Decision-Making Questions template. Featuring a creative circular diagram and visual cues, it helps structure questions around options, evaluations, and outcomes. Ideal for brainstorming, strategic planning, and executive decision sessions. Fully editable in PowerPoint, Keynote, and Google Slides.
- Remove from favorites
Powerpoint Template
1 MB
Google Slides Template
External link
Keynote Template
1 MB
7 slides
Network Solutions Infographics
The Network Solutions Infographic is designed to showcase the complexities and interconnectivity of network systems in a clear, visual format. It is perfect for IT professionals, educators, and students to communicate the intricacies of network architecture, pathways, and protocols. This infographic can be tailored to highlight various network types, such as LAN, WAN, or VPN, and to illustrate the flow of data through different network layers and devices. It can also be used to explain concepts like network security, data management, and the impact of emerging technologies on networking. Whether used for training purposes, presentations, or as part of a marketing strategy for tech companies, the Network Solutions Infographic simplifies the transfer of detailed network information and engages the audience with its visual appeal.
- Remove from favorites
Powerpoint Template
1 MB
Google Slides Template
External link
Keynote Template
2 MB
4 slides
Regional Business Focus on Asia Presentation
Showcase your company’s strategic footprint with the Regional Business Focus on Asia Presentation. This clean, icon-labeled map layout helps illustrate key markets, logistics routes, or development hubs across Asia. Ideal for business expansion plans, investment updates, or regional performance overviews. Fully editable in PowerPoint, Keynote, Google Slides, and Canva.
- Remove from favorites
Powerpoint Template
1 MB
Google Slides Template
External link
Keynote Template
1 MB
7 slides
Change Management Presentation Template
Our Change Management Infographic is designed to visually present your information. This infographic presentation comes with a seven page layout, all neatly arranged into a well-organized structure, which shows the steps of a change management process. This can be used for any kind of presentation purpose, education, employees, new product launch or even for training executives, managers and supervisors. With this template the variety of elements included are to help you create your own personalized content, you can make your own presentations for any business or industry in just minutes!
- Remove from favorites
Powerpoint Template
1 MB
Google Slides Template
External link
Keynote Template
2 MB
10 slides
Revenue Growth Strategies and Metrics Presentation
Highlight your key success drivers with the Revenue Growth Strategies and Metrics Presentation. This upward arrow-based layout is perfect for showcasing growth phases, financial KPIs, or strategic revenue initiatives. Clean, professional, and fully editable in PowerPoint, Keynote, and Google Slides—ideal for business reviews, sales pitches, and quarterly updates.
- Remove from favorites
Powerpoint Template
1 MB
Google Slides Template
External link
Keynote Template
1 MB
5 slides
Search Engine Marketing Analysis Presentation
Showcase your SEM insights with a presentation slide that’s as sharp as your strategy. This layout helps you break down ad performance, keyword data, and campaign elements clearly and visually. Perfect for marketers presenting to clients or teams, and fully compatible with PowerPoint, Keynote, and Google Slides.


