


Features
- 6 Unique slides
- Fully editable and easy to edit in Microsoft Powerpoint, Keynote and Google Slides
- 16:9 widescreen layout
- Clean and professional designs
- Export to JPG, PDF or send by email


Do you have any questions?
Recommend


21 slides
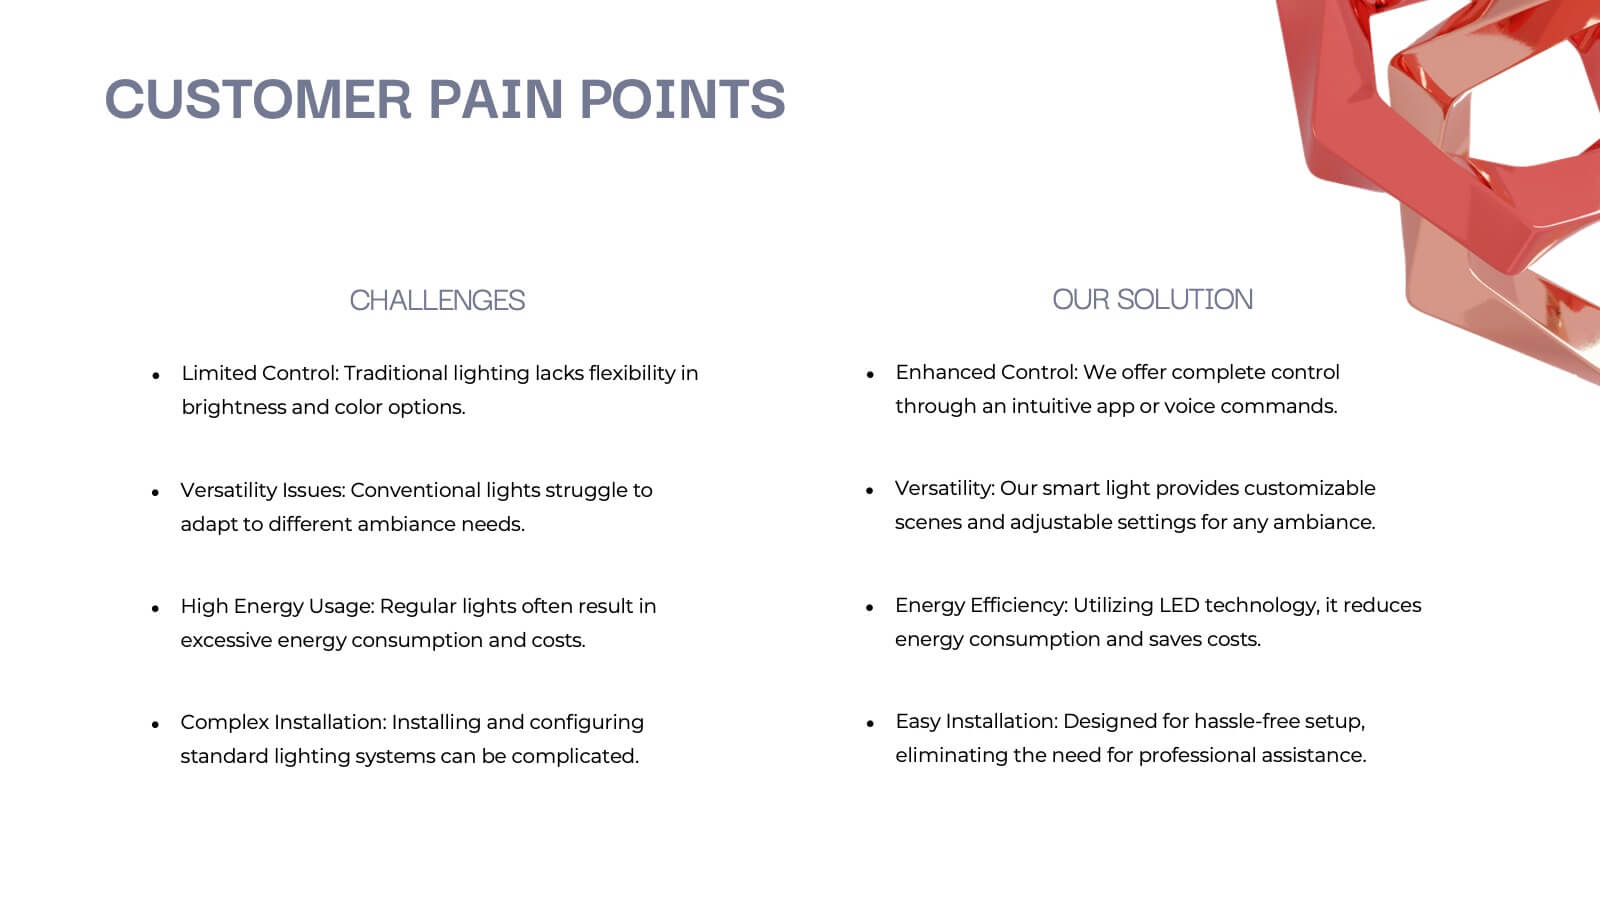
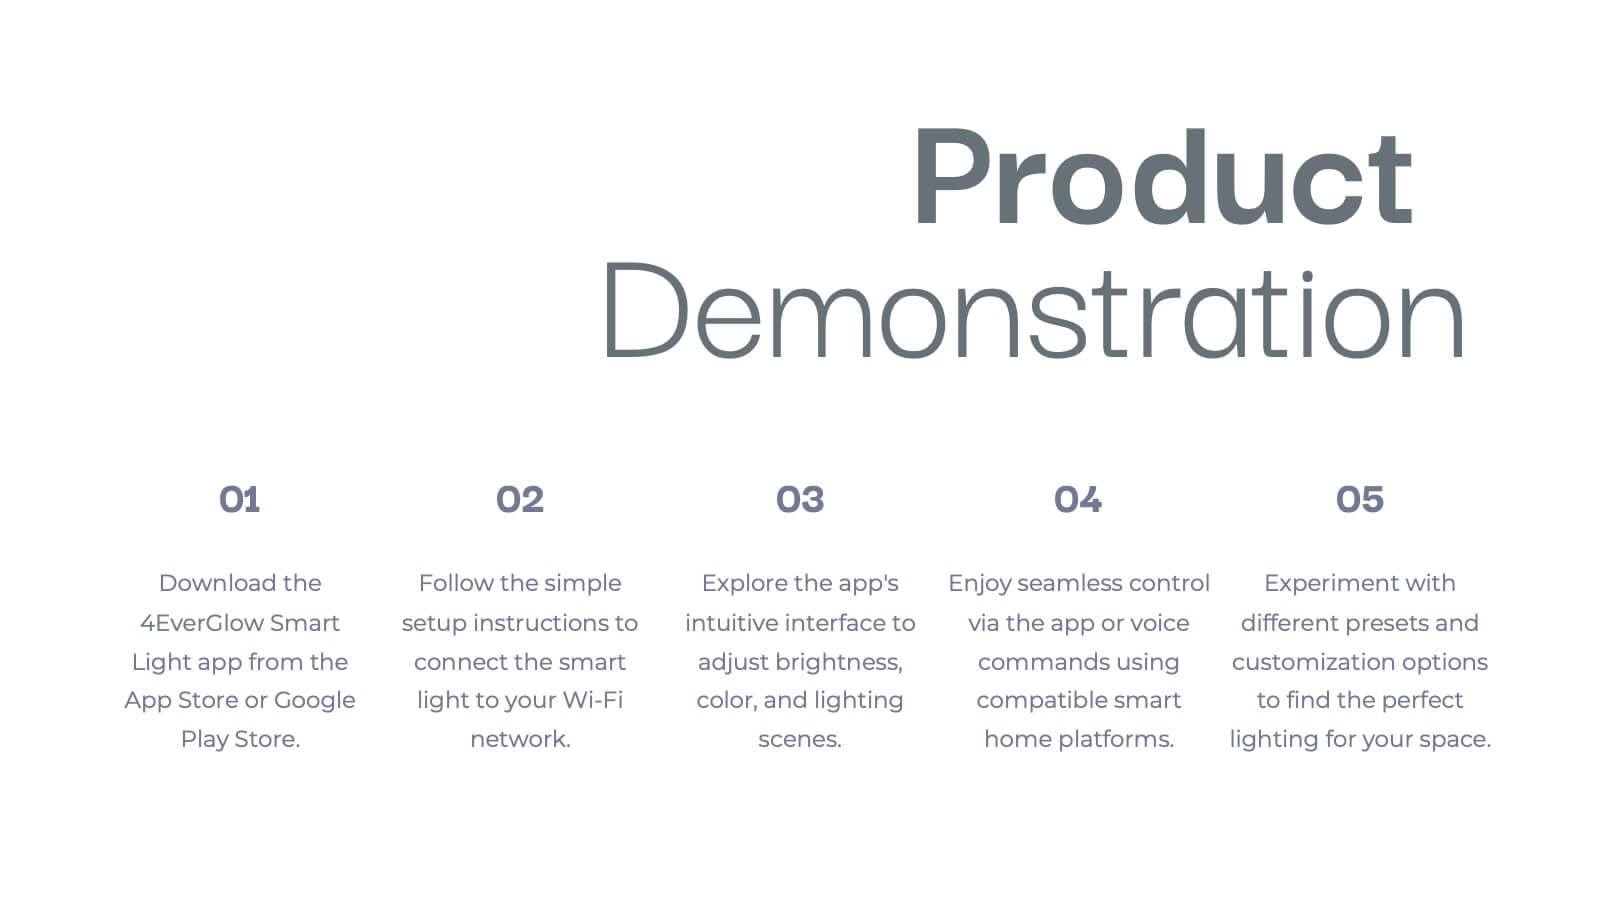
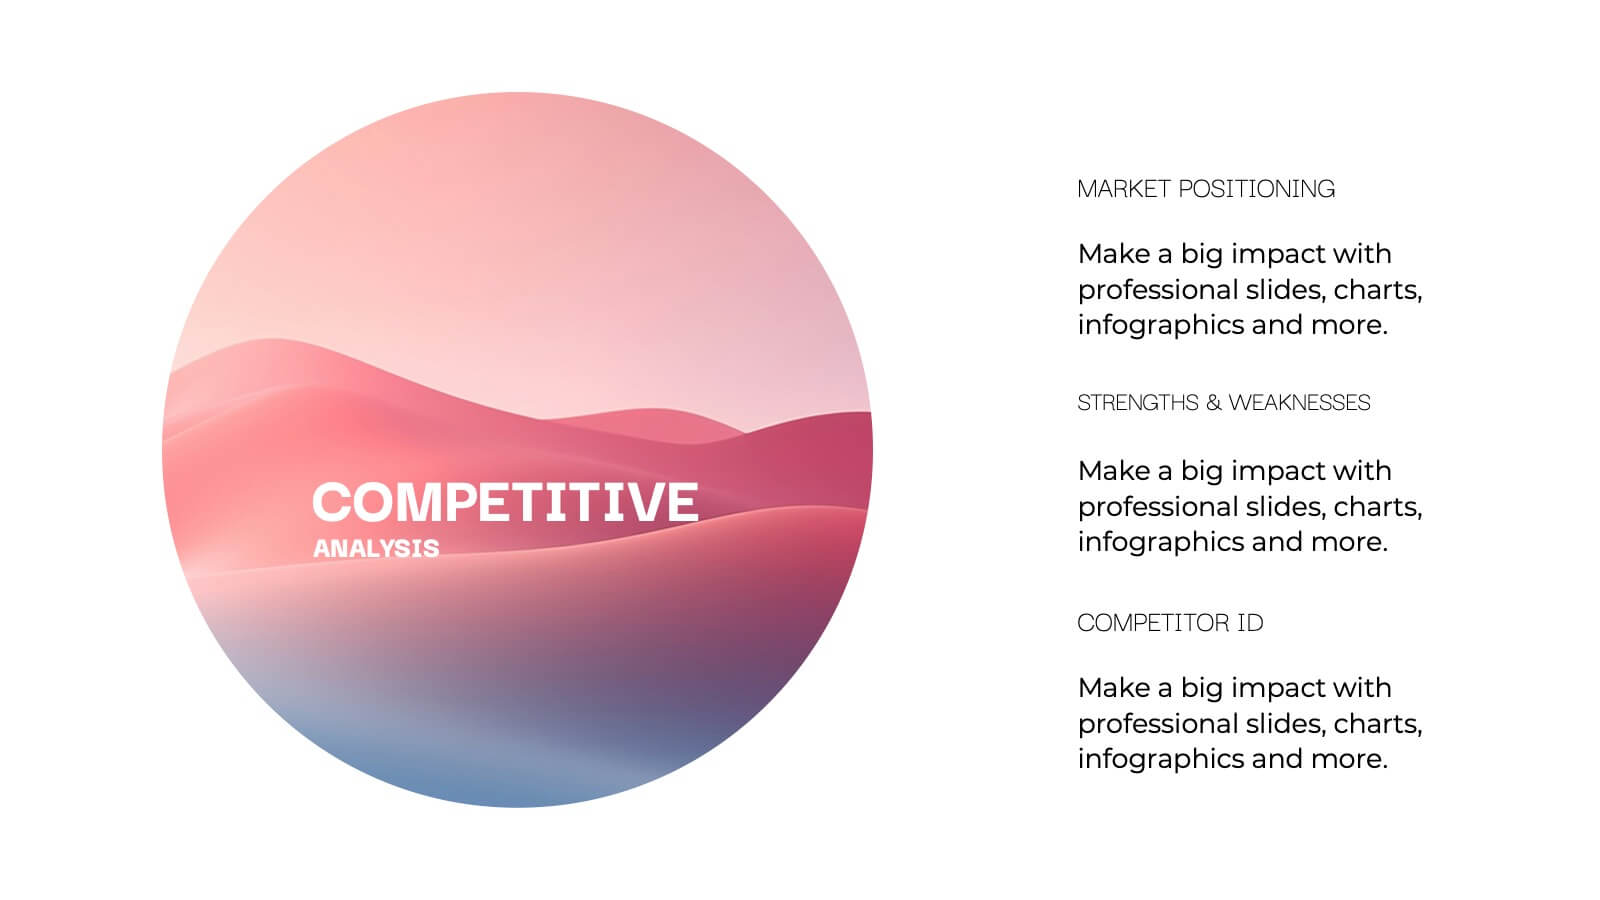
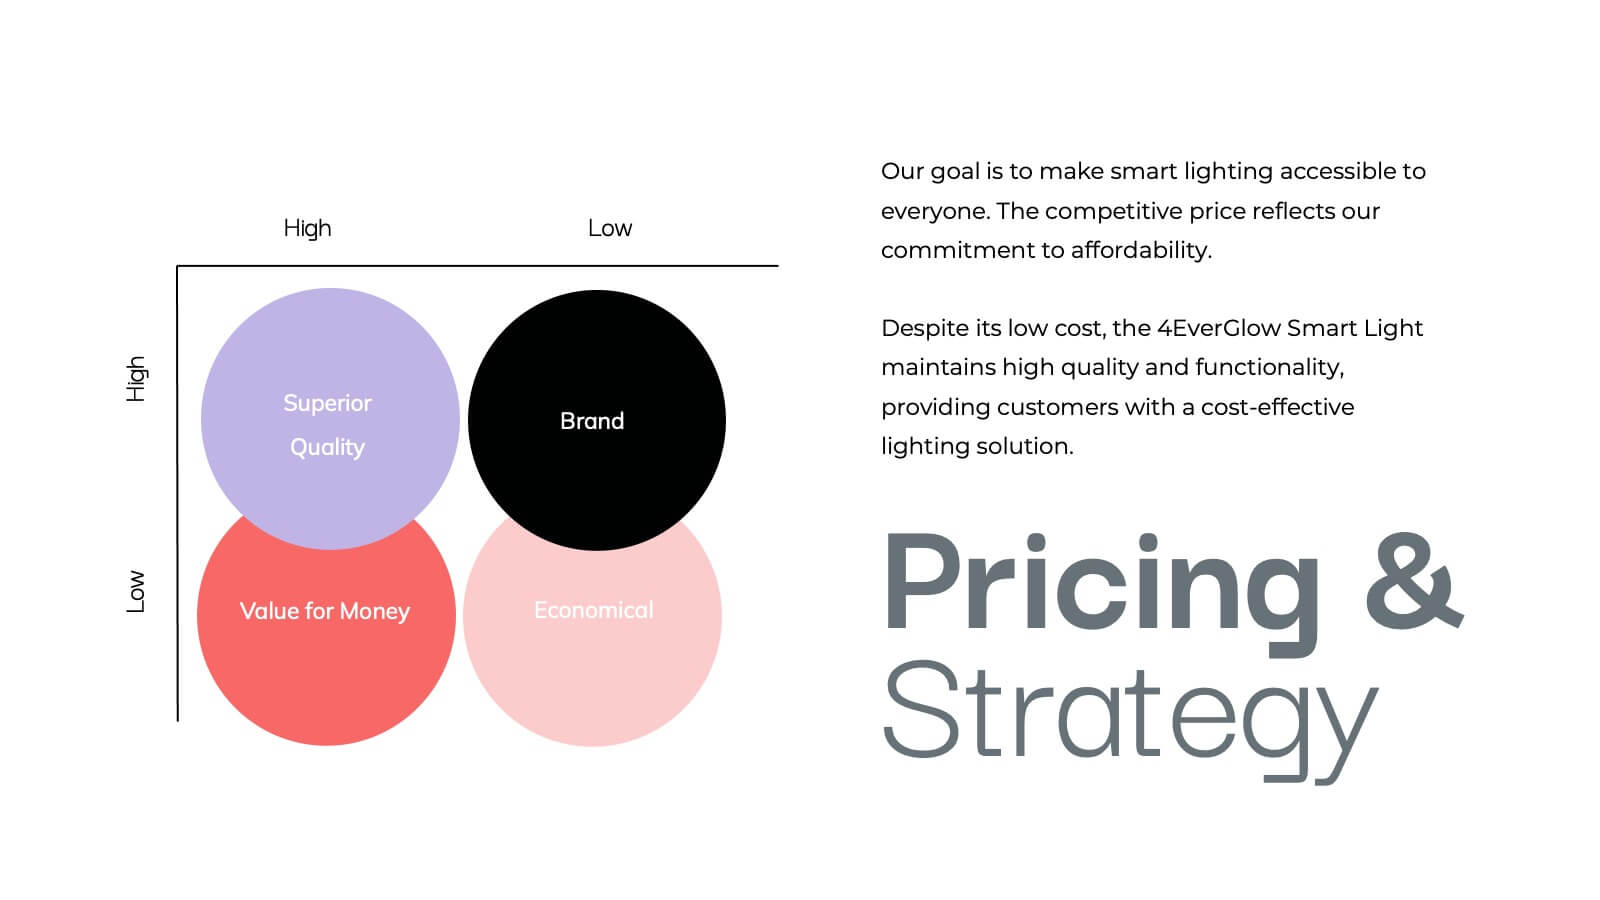
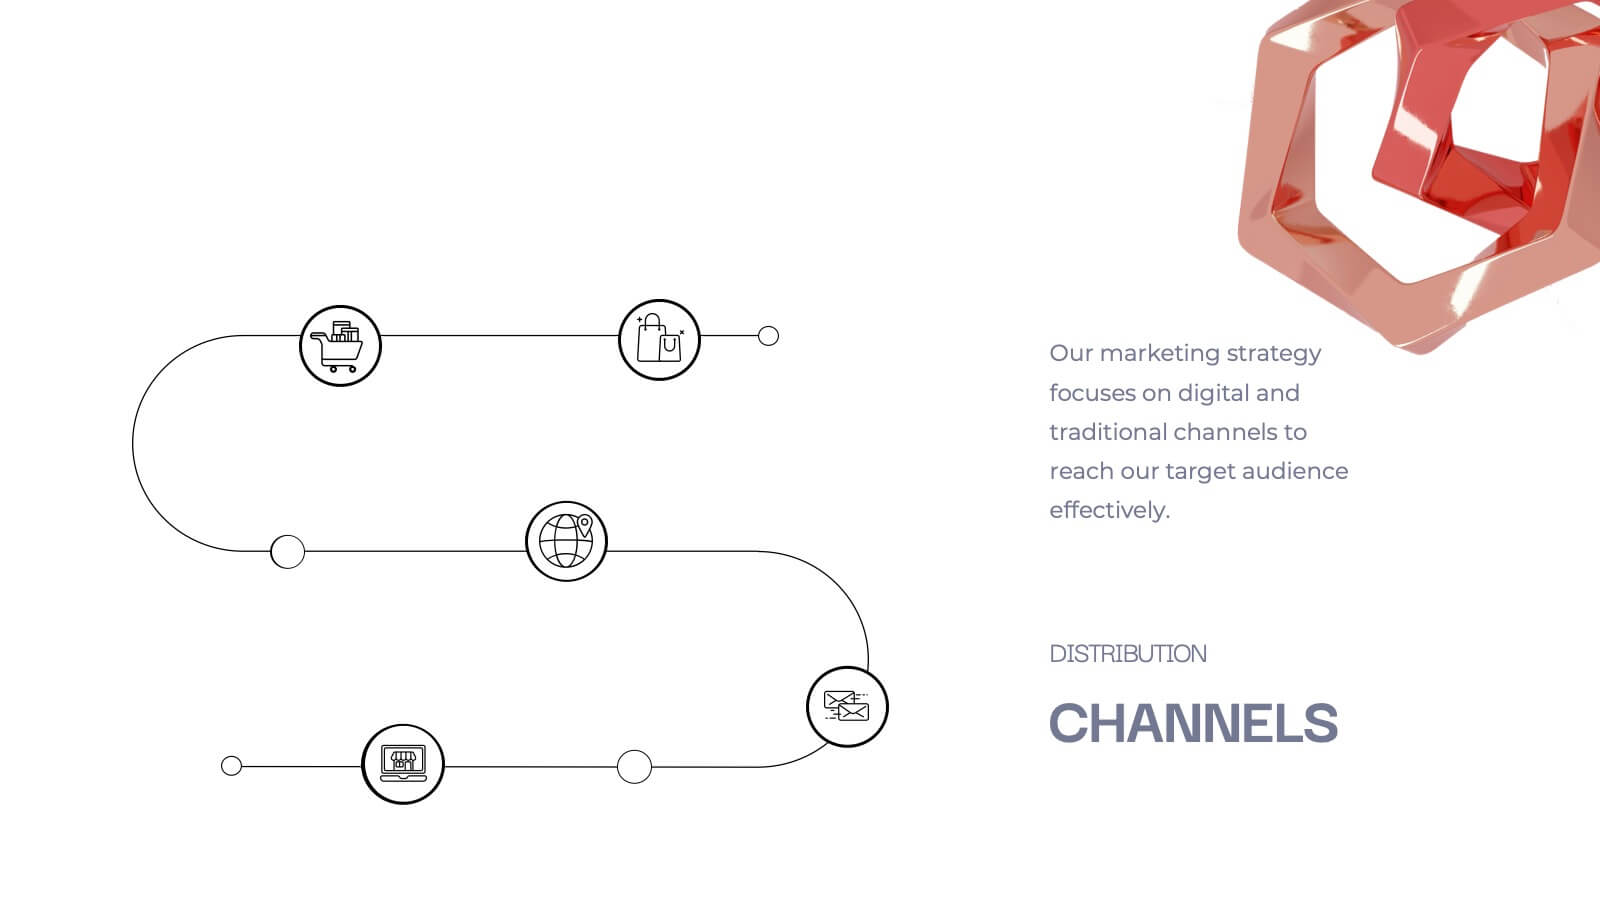
Vulcan New Product Proposal Presentation
Launch your next product with confidence using this comprehensive presentation template! Covering everything from product features and target market to pricing strategy and customer pain points, this template ensures a smooth and engaging flow for your audience. It’s ideal for product proposals, demonstrations, and marketing strategies. Compatible with PowerPoint, Keynote, and Google Slides for seamless presentations.


5 slides
Investment Strategy Planning
Make your strategy as calculated as a chess move. This sleek presentation design uses chess pieces to symbolize planning stages, critical decisions, or stakeholder roles in investment strategy. Perfect for finance, business growth, or corporate leadership topics. Editable in PowerPoint, Keynote, and Google Slides.


4 slides
Educational Infographic Slide Presentation
Ignite curiosity from the very first slide with a clear, classroom-style visual that makes explanations feel simple and engaging. This presentation helps break down lessons, key concepts, or training points in a way audiences instantly understand. Clean layouts keep the focus on your message. Fully compatible with PowerPoint, Keynote, and Google Slides.


26 slides
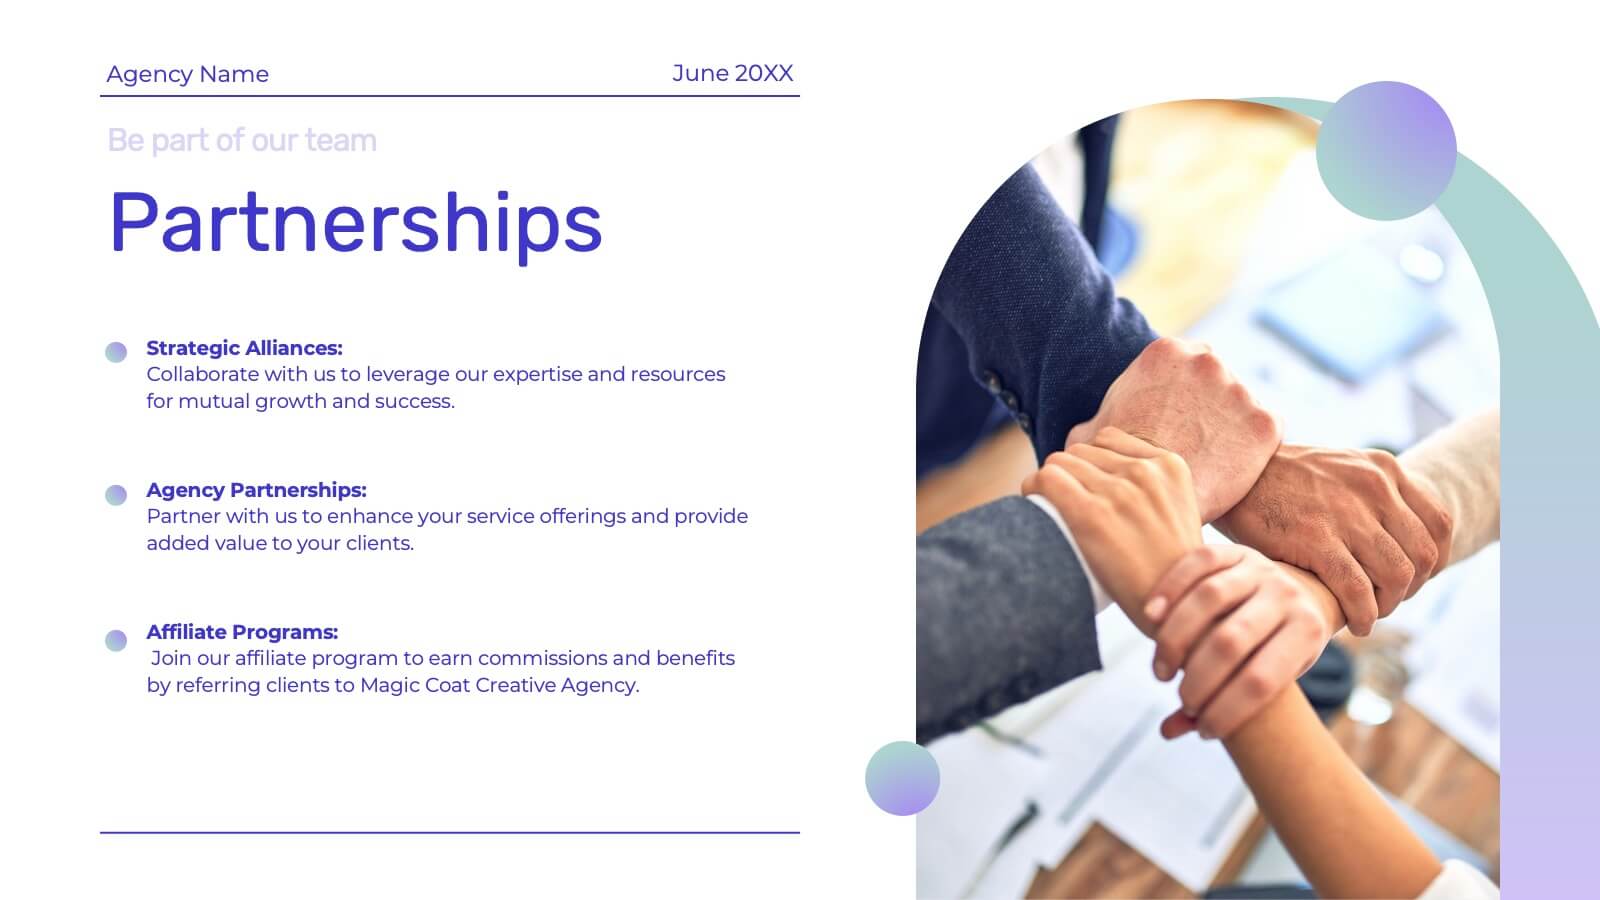
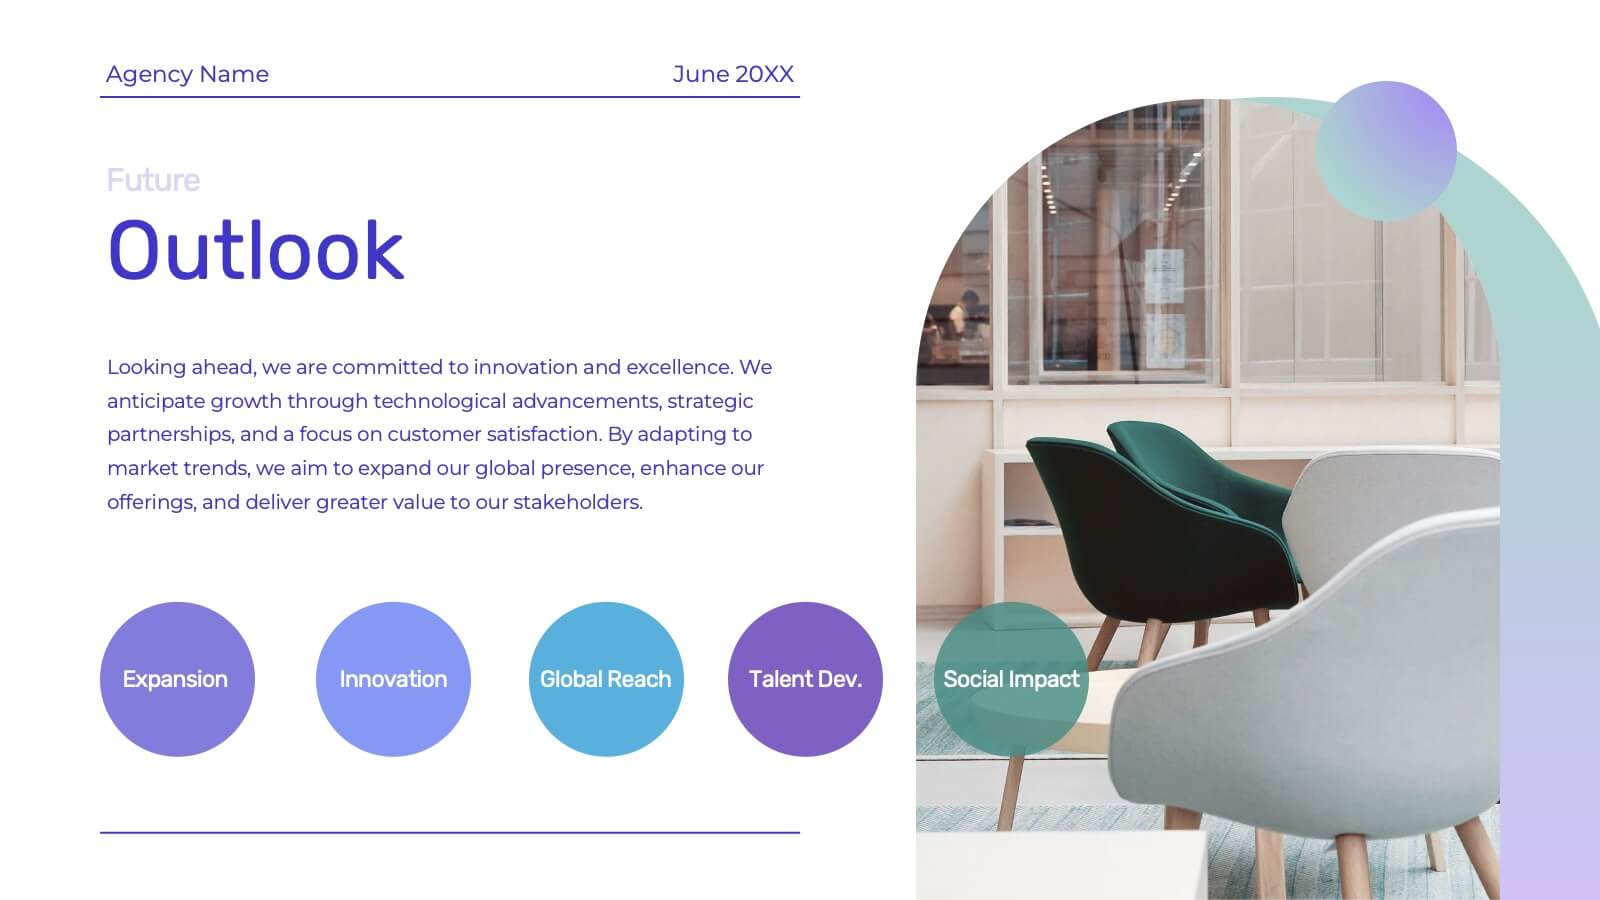
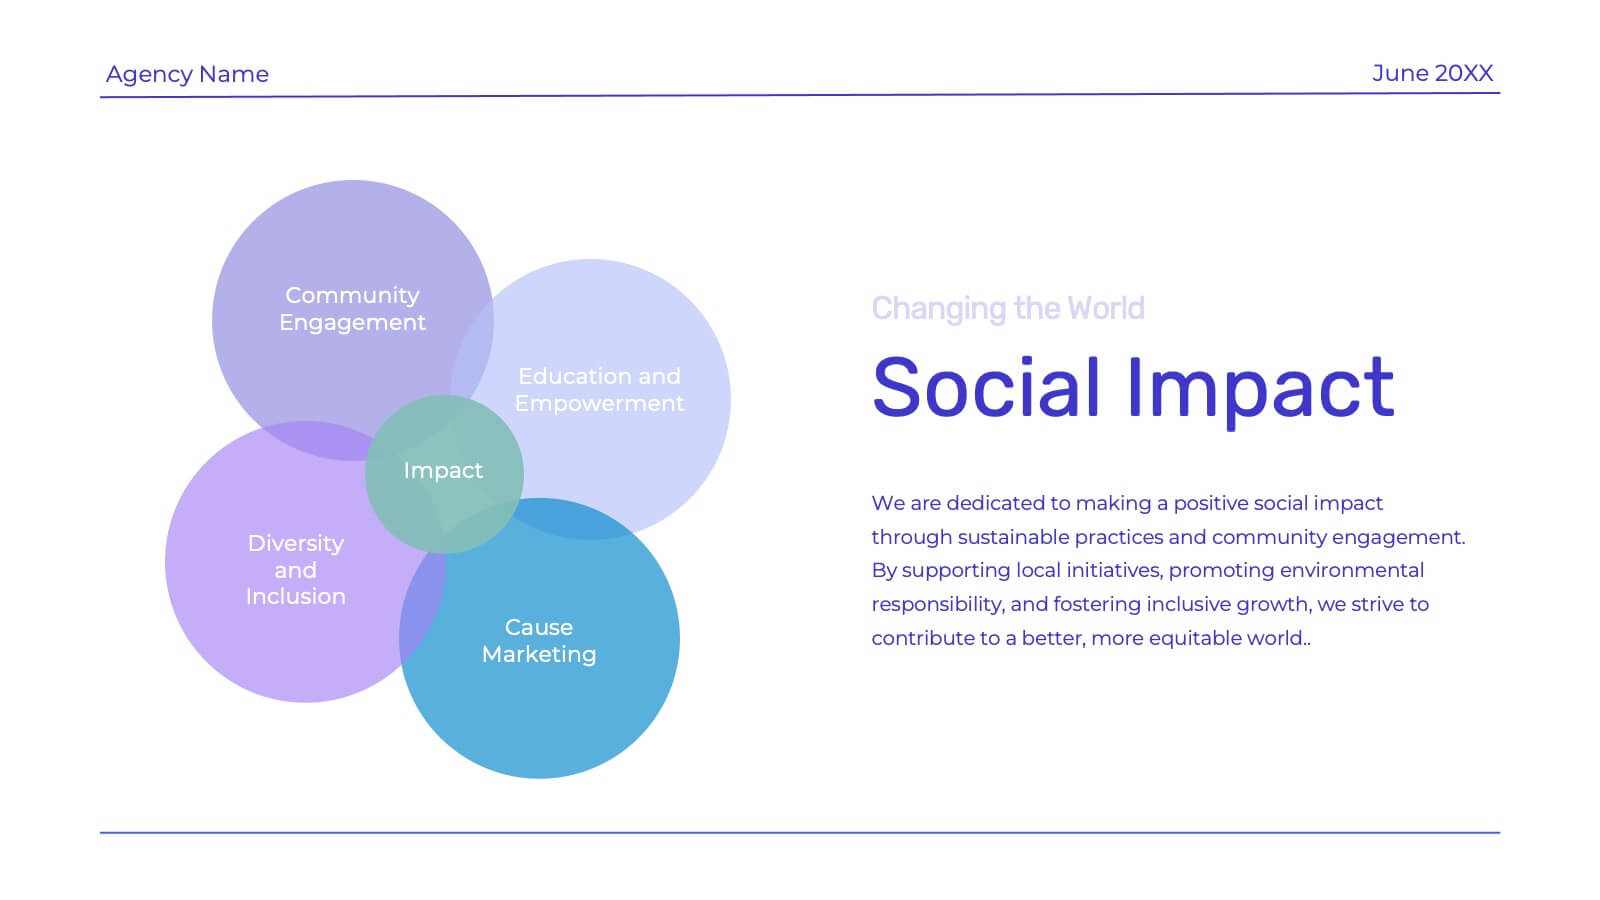
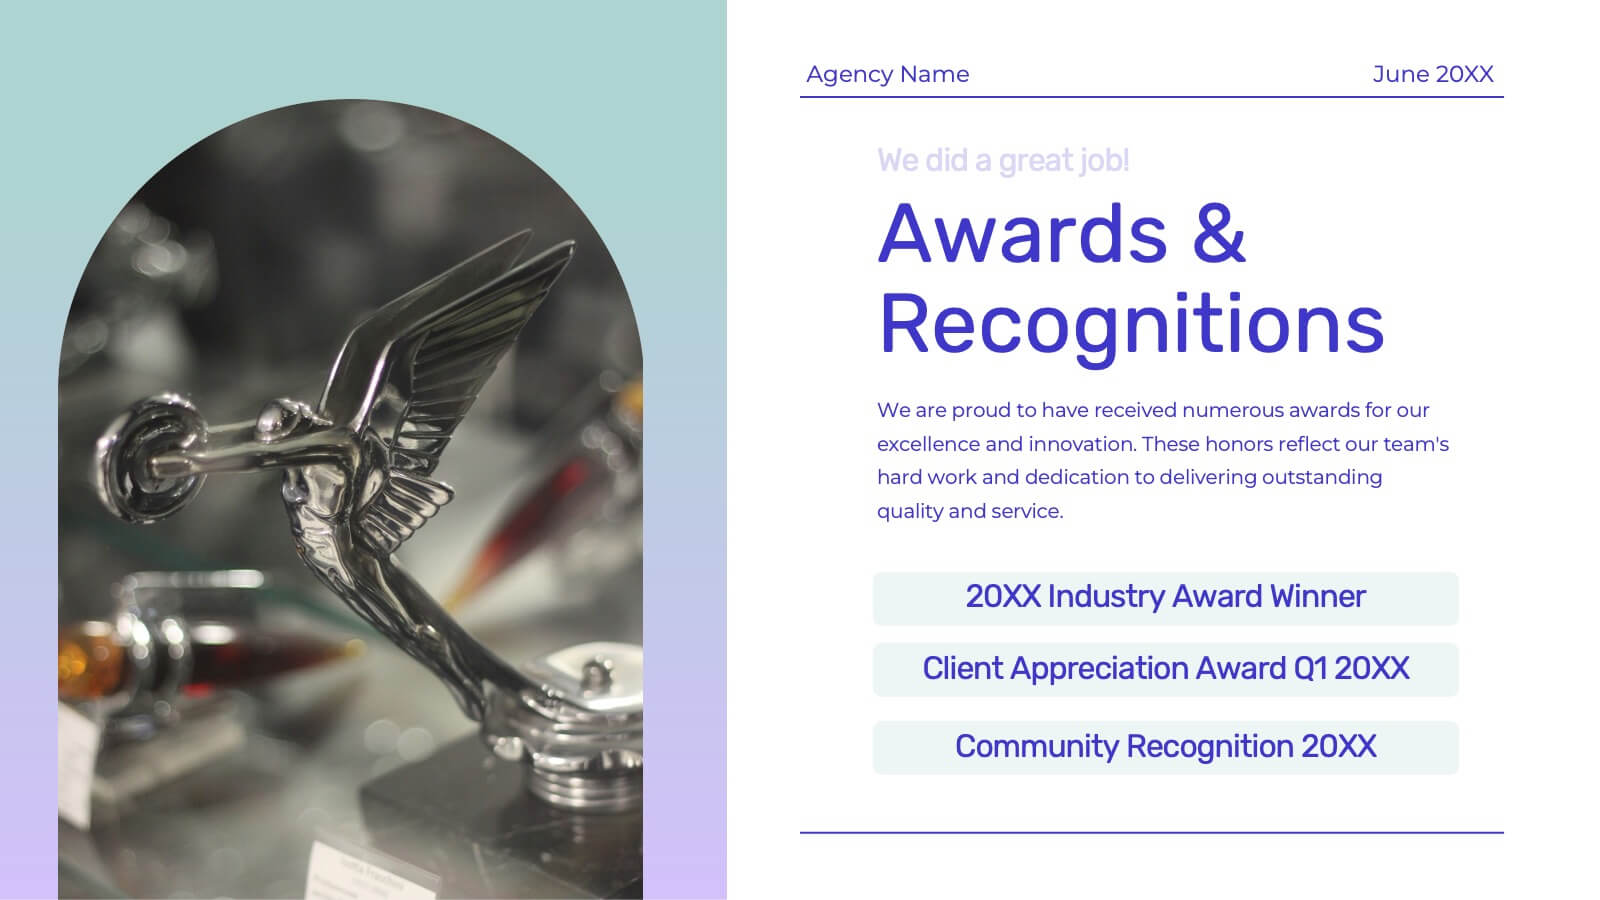
Corporate Social Responsibility (CSR) Presentation
Make a difference with our Corporate Social Responsibility (CSR) presentation template, perfect for PowerPoint, Keynote, and Google Slides. This template is designed for leaders and organizations committed to ethical practices, environmental stewardship, and community engagement. Our CSR template empowers you to showcase your company's commitment to social responsibility. It provides a structured format to present your sustainability efforts, ethical initiatives, and community projects. It helps you to communicate the value of CSR to stakeholders and illustrates how responsible business practices contribute to overall success. With customizable visuals, you can highlight your CSR achievements and goals, fostering transparency and trust. This template is SEO-optimized, ensuring that your message of commitment to social responsibility reaches a broad audience. Use this template to promote your CSR strategy and demonstrate how your organization is playing a pivotal role in building a sustainable and equitable future.


26 slides
Kohen Presentation Template
Kohen is a minimal coffee shop template that features slide designs you can use together, making it perfect for sharing your business and services. It is easy to use, resulting in convenient high quality presentations. This template design can be used to create more elaborate presentations about food and restaurants. It is complete with charts, images, and text boxes for endless presentation possibilities. This template will help make your message more compelling and informative. The presentation includes a variety of tools and resources, to highlight key points and ideas with minimal text.


26 slides
Coffee Shop Warm Company Profile Presentation
Coffee shops have become an important part of modern culture, especially in urban areas, and they come in various styles and themes. This presentation template is designed to bring the essence of your coffee haven to life. From the first sip to the last drop, let this presentation showcase the soul-warming experience your coffee shop provides. Fully customizable and compatible with Powerpoint, Keynote, and Google Slides. Utilize warm colors like browns, oranges, and yellows to evoke a cozy, comforting atmosphere. The template integrates coffee cup icons, latte art, and coffee bean graphics for a coffee-centric theme.


23 slides
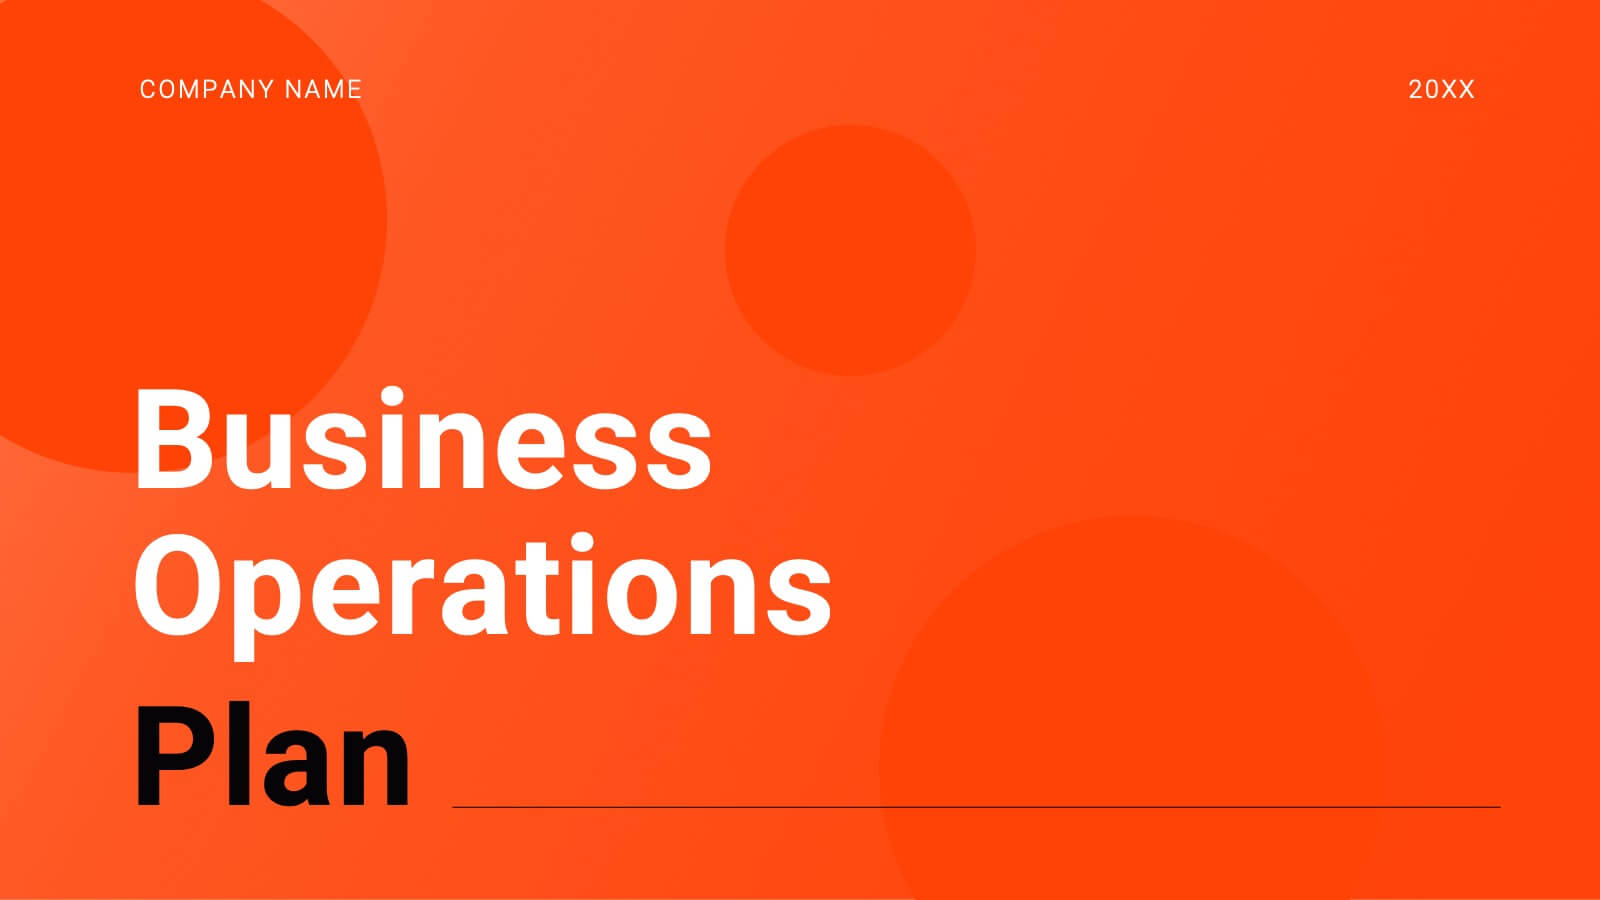
Equinox Business Operations Plan Presentation
Elevate your business operations with this dynamic plan template! Perfect for detailing company background, market opportunities, and strategic objectives. Ideal for business leaders and managers aiming to streamline operations and drive growth. Compatible with PowerPoint, Keynote, and Google Slides, this template ensures your business plan is clear, professional, and impactful. Drive success today!


5 slides
Business Report Summary Slide Presentation
Deliver key metrics and insights with confidence using this Business Report Summary Slide. Featuring segmented graphs, percentage indicators, and a 6-part breakdown, this layout helps you highlight performance trends and action items clearly. Ideal for reporting, monthly reviews, or executive briefings. Fully editable in PowerPoint, Keynote, and Google Slides.
22 slides
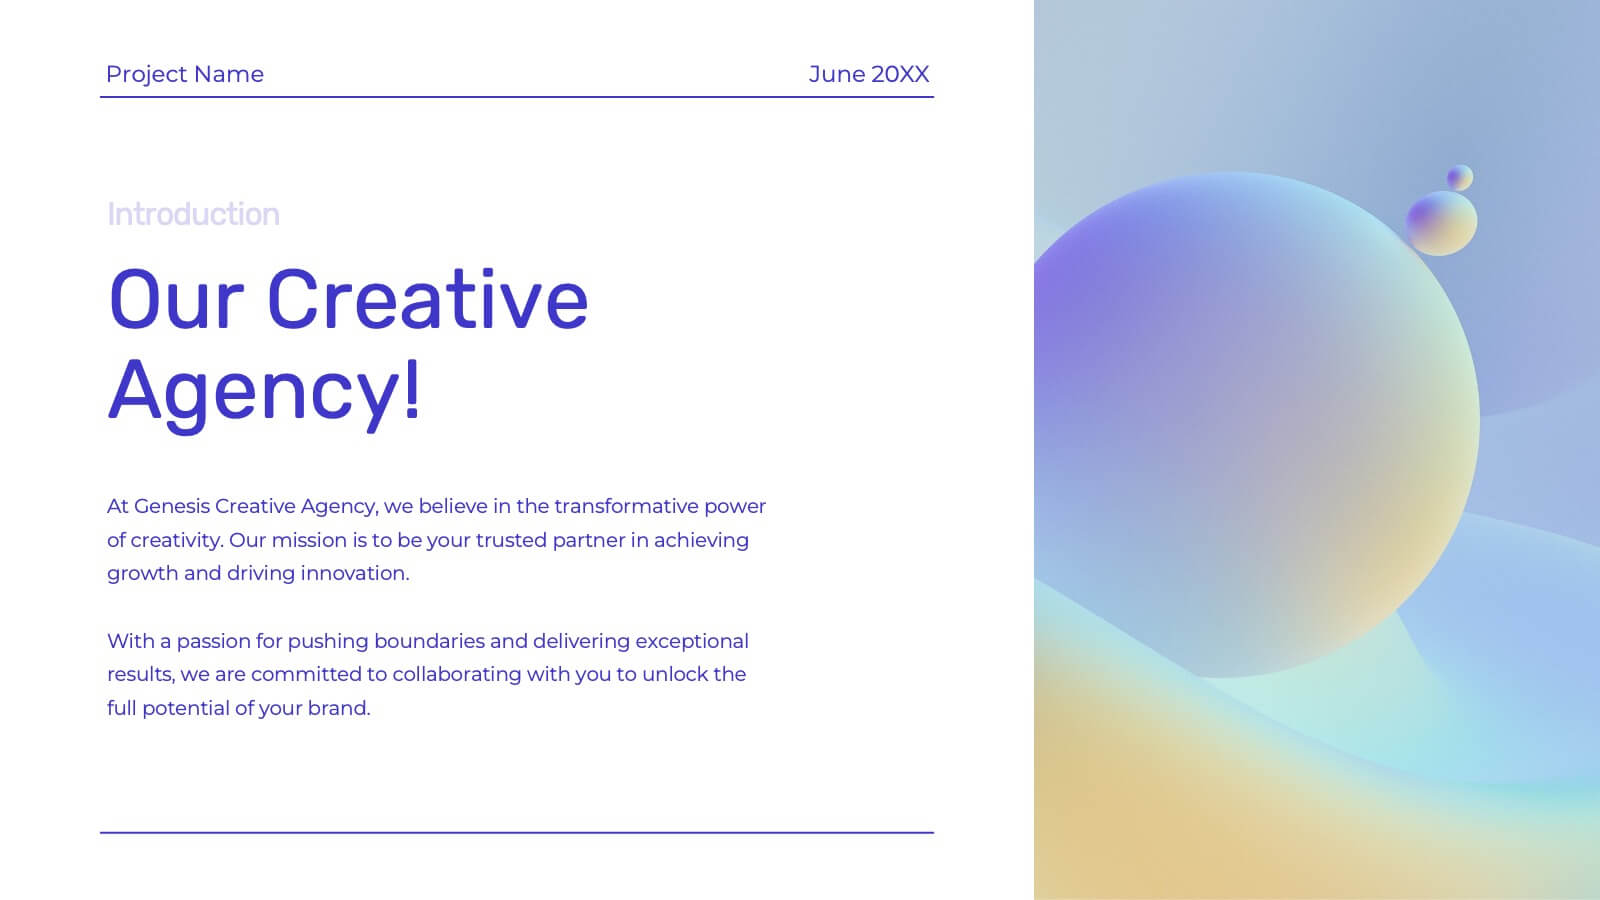
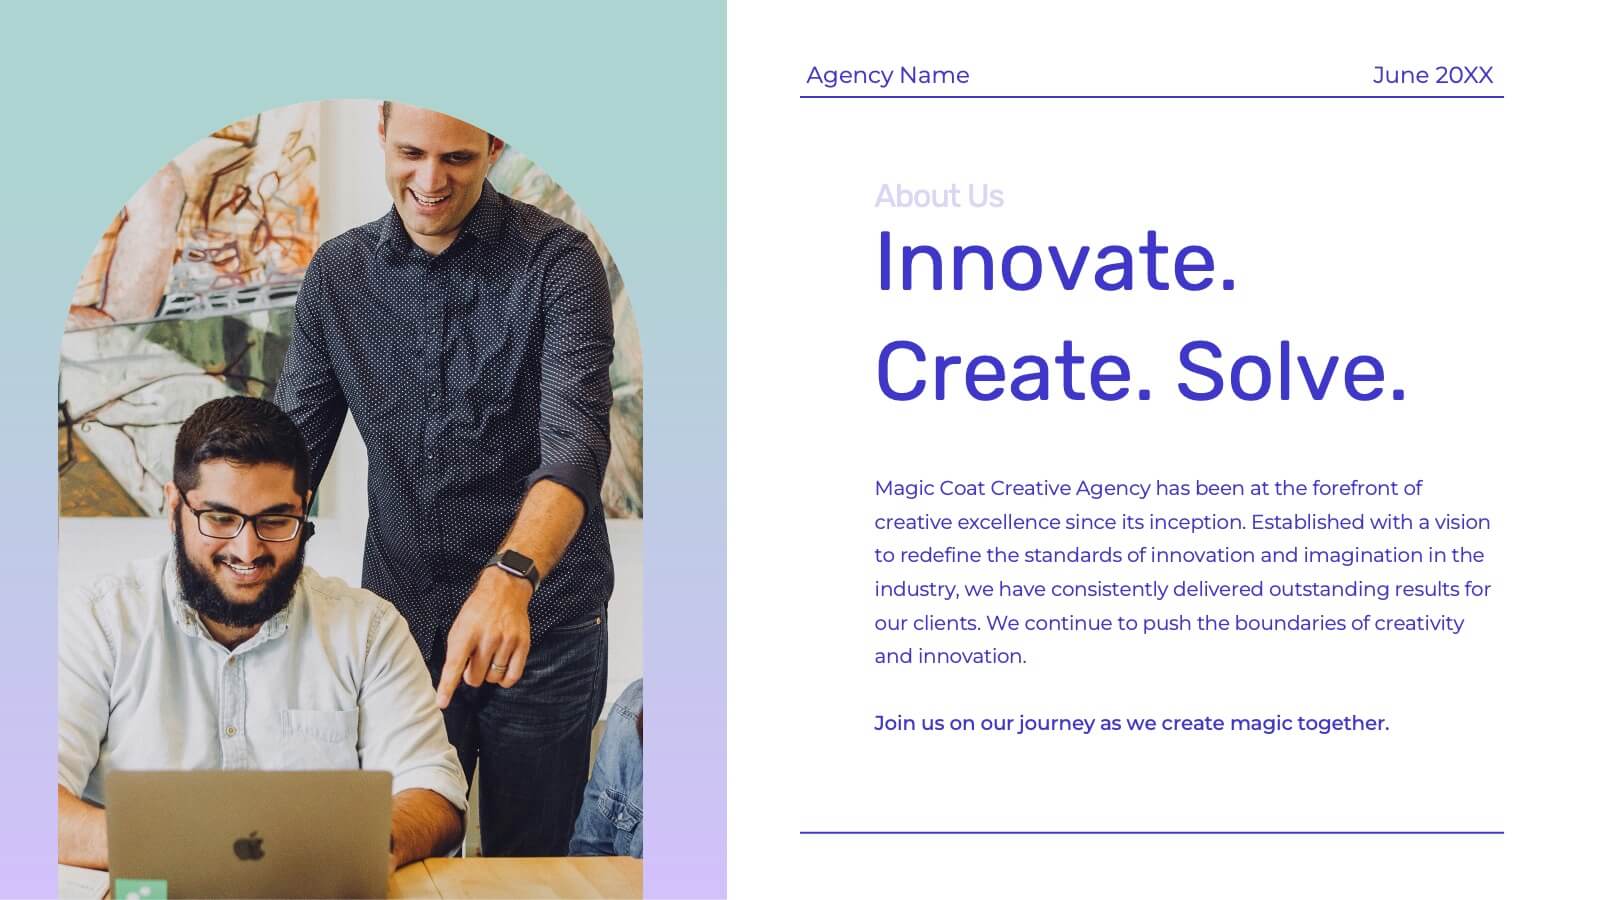
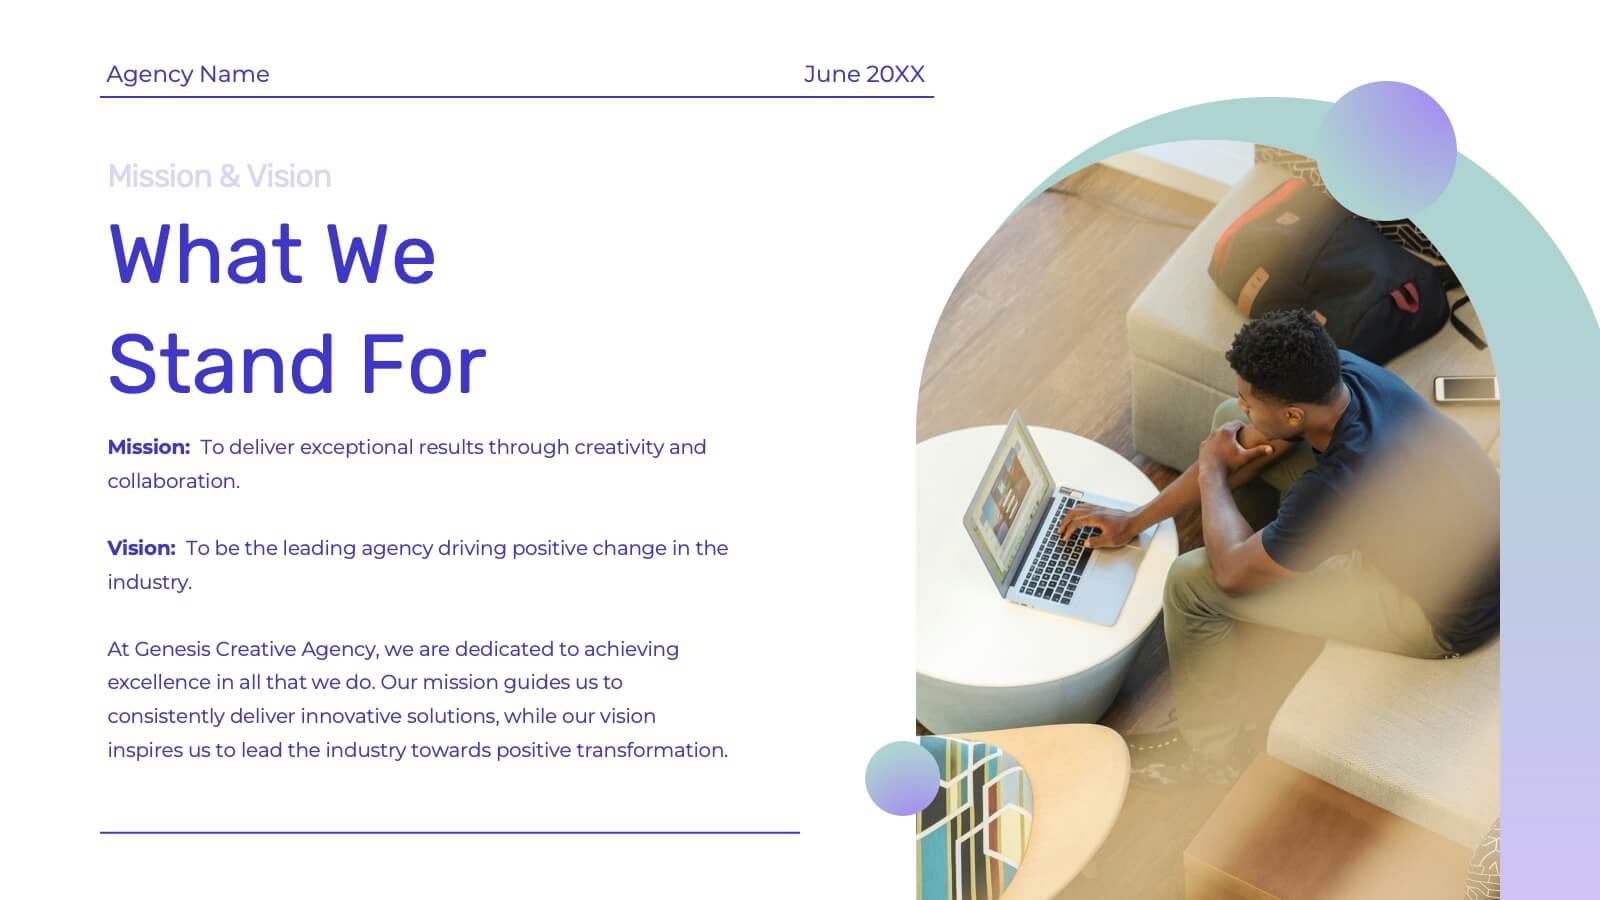
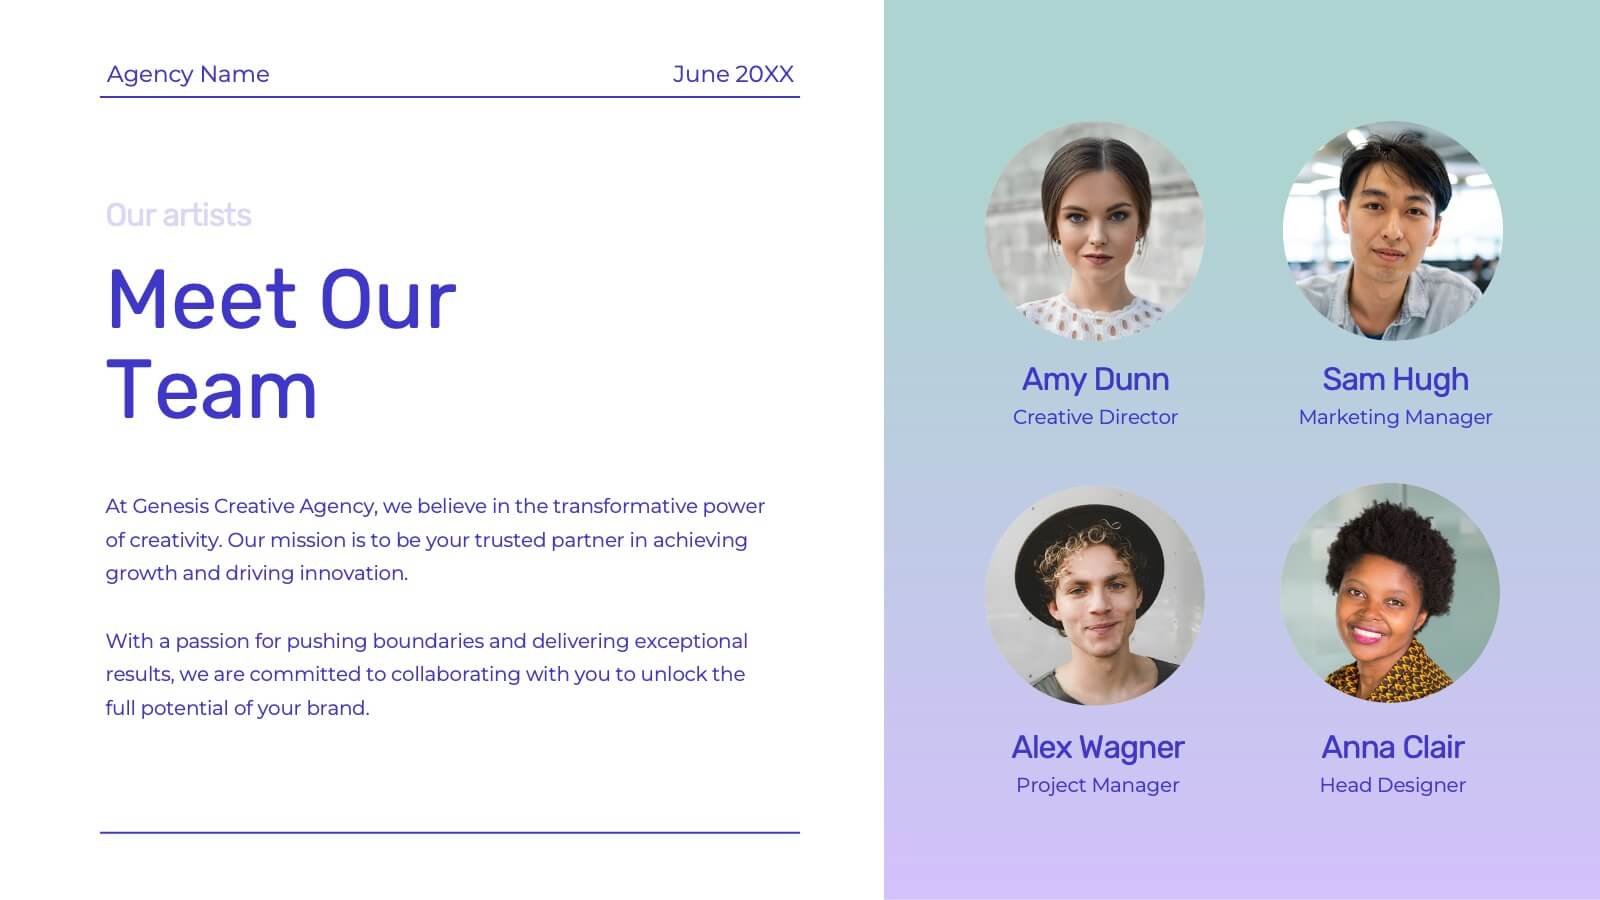
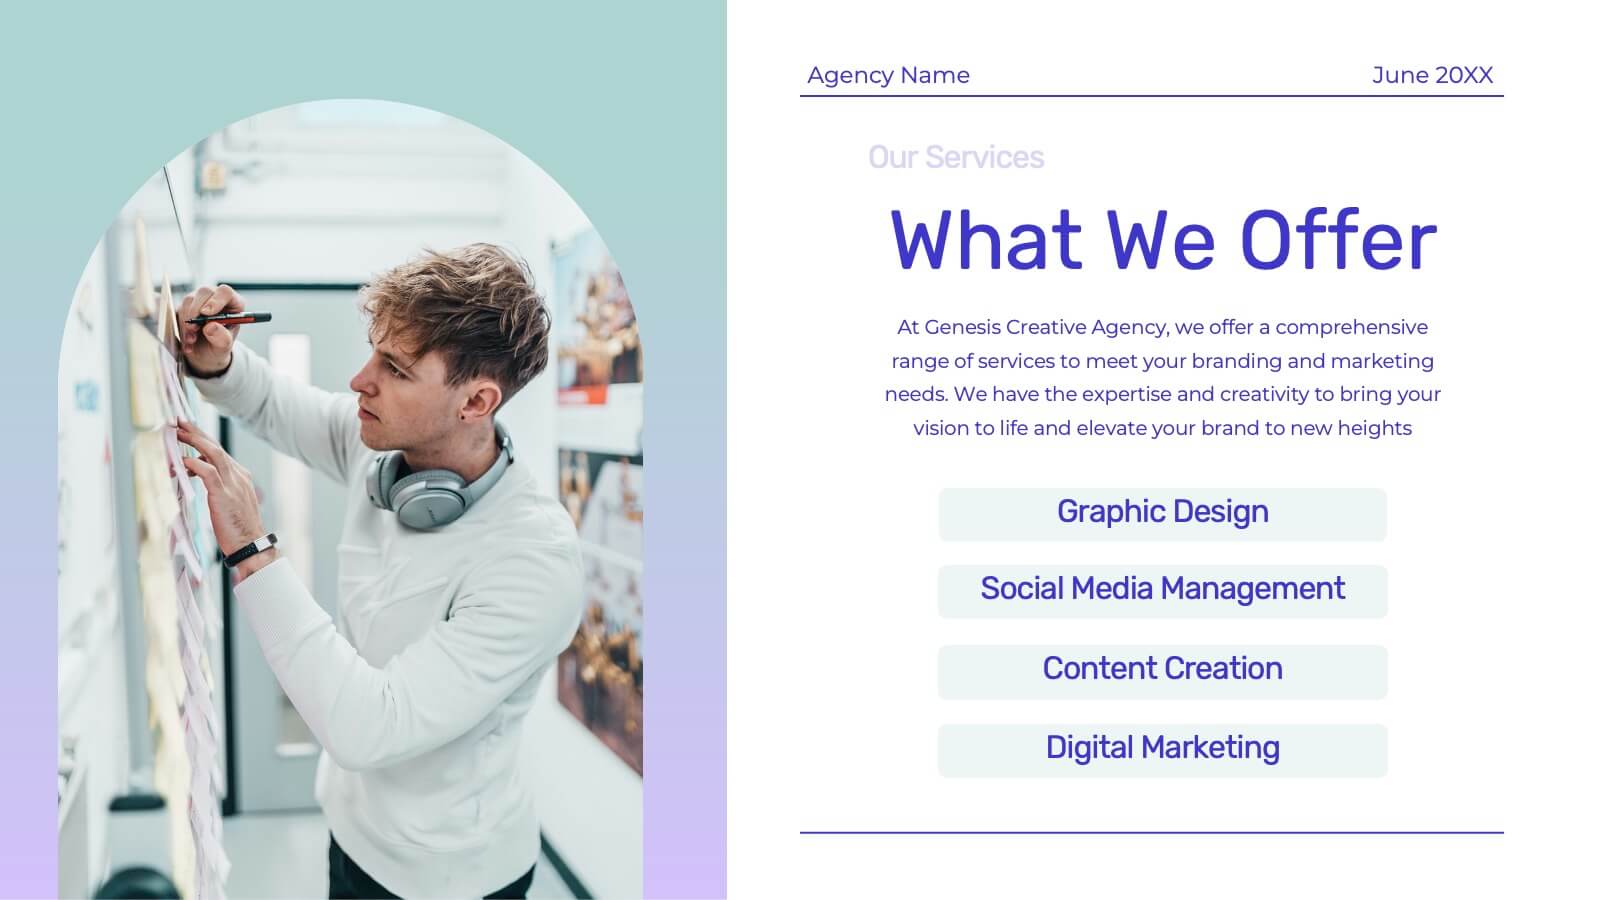
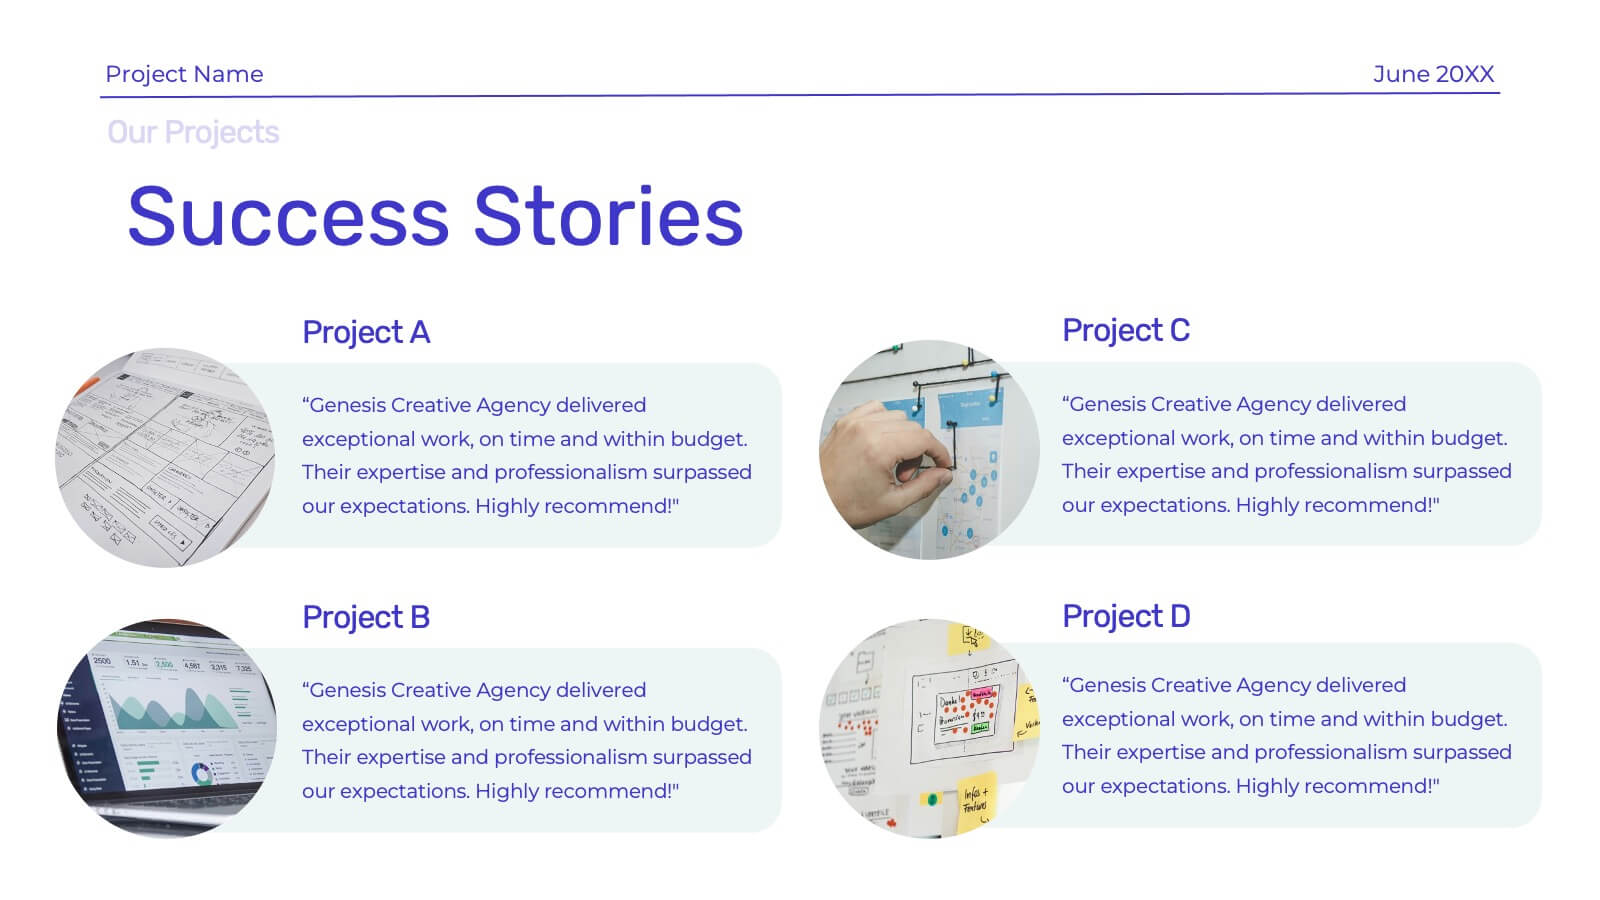
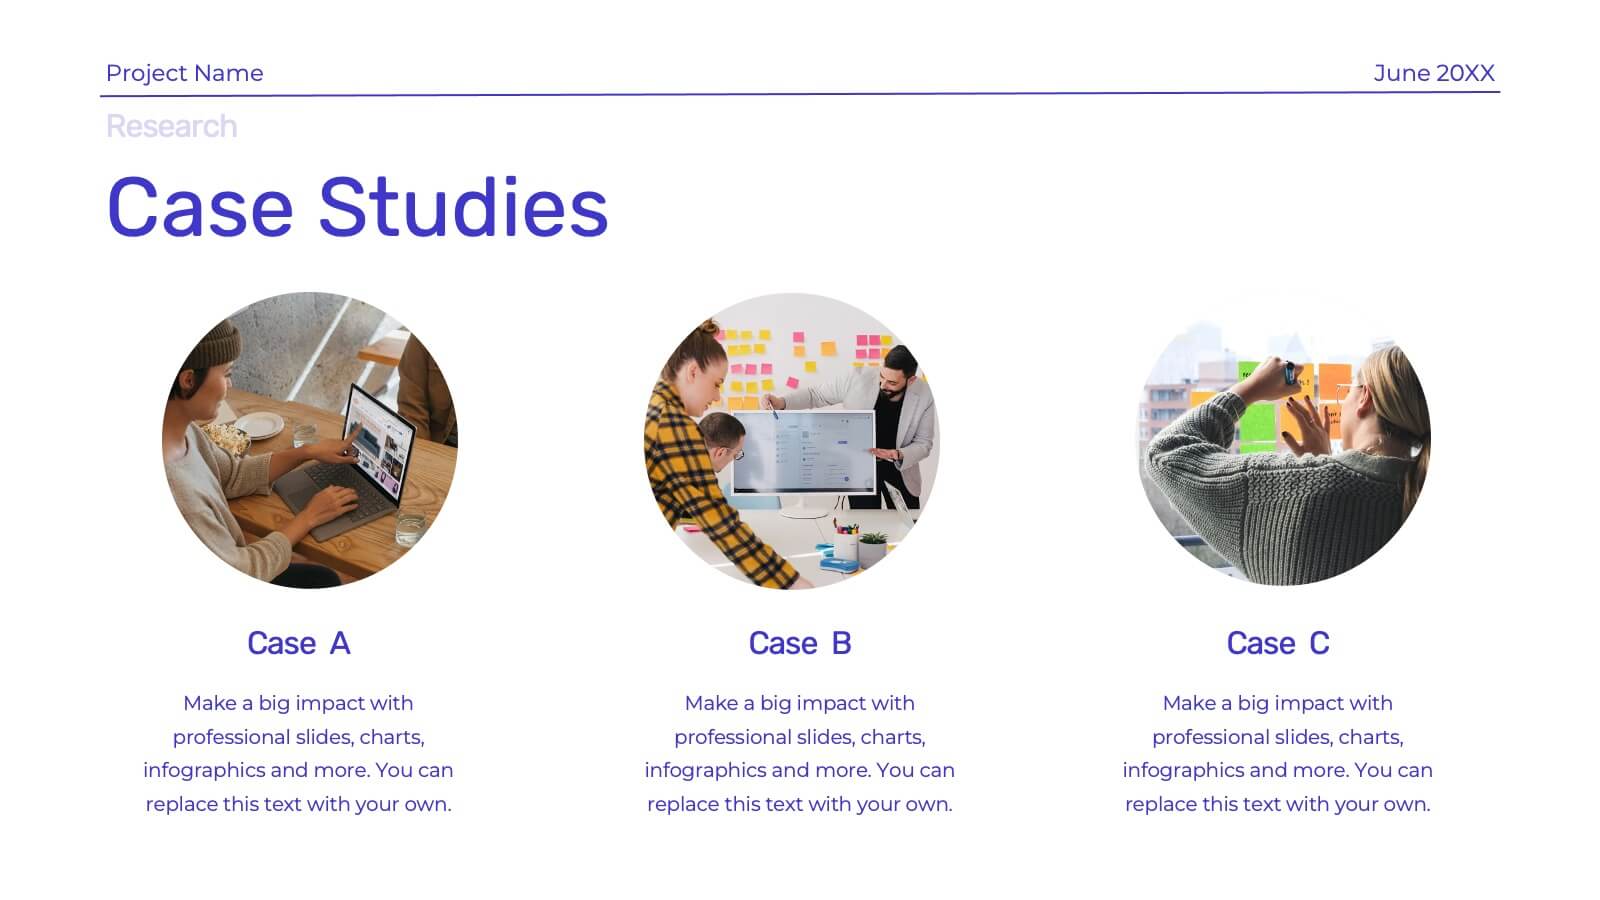
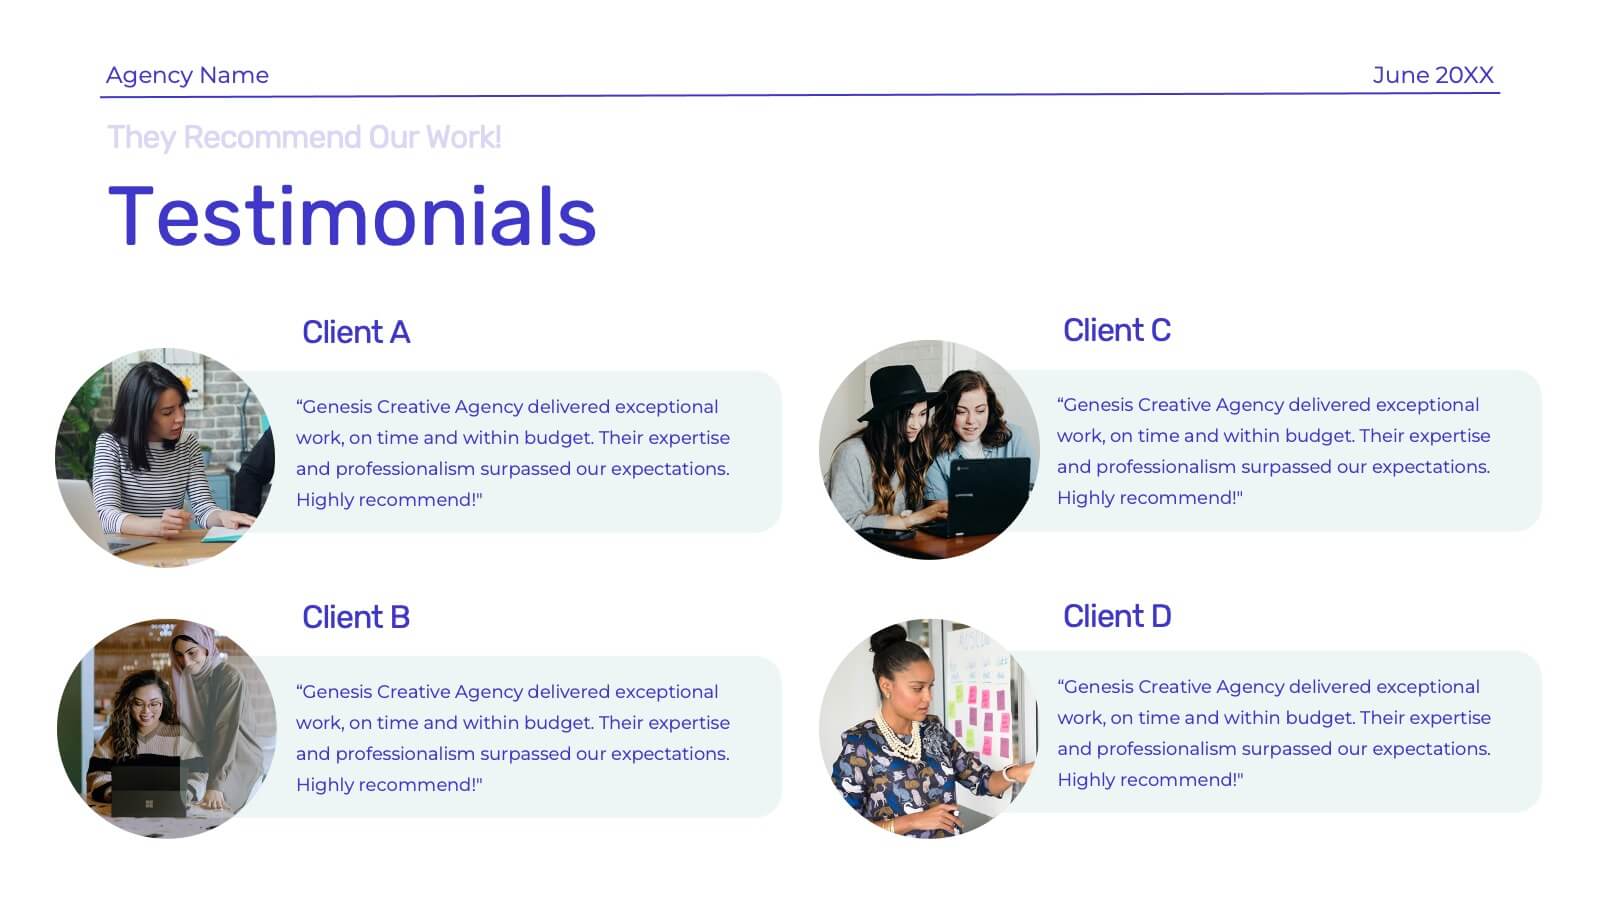
Genesis Creative Agency Pitch Deck Presentation
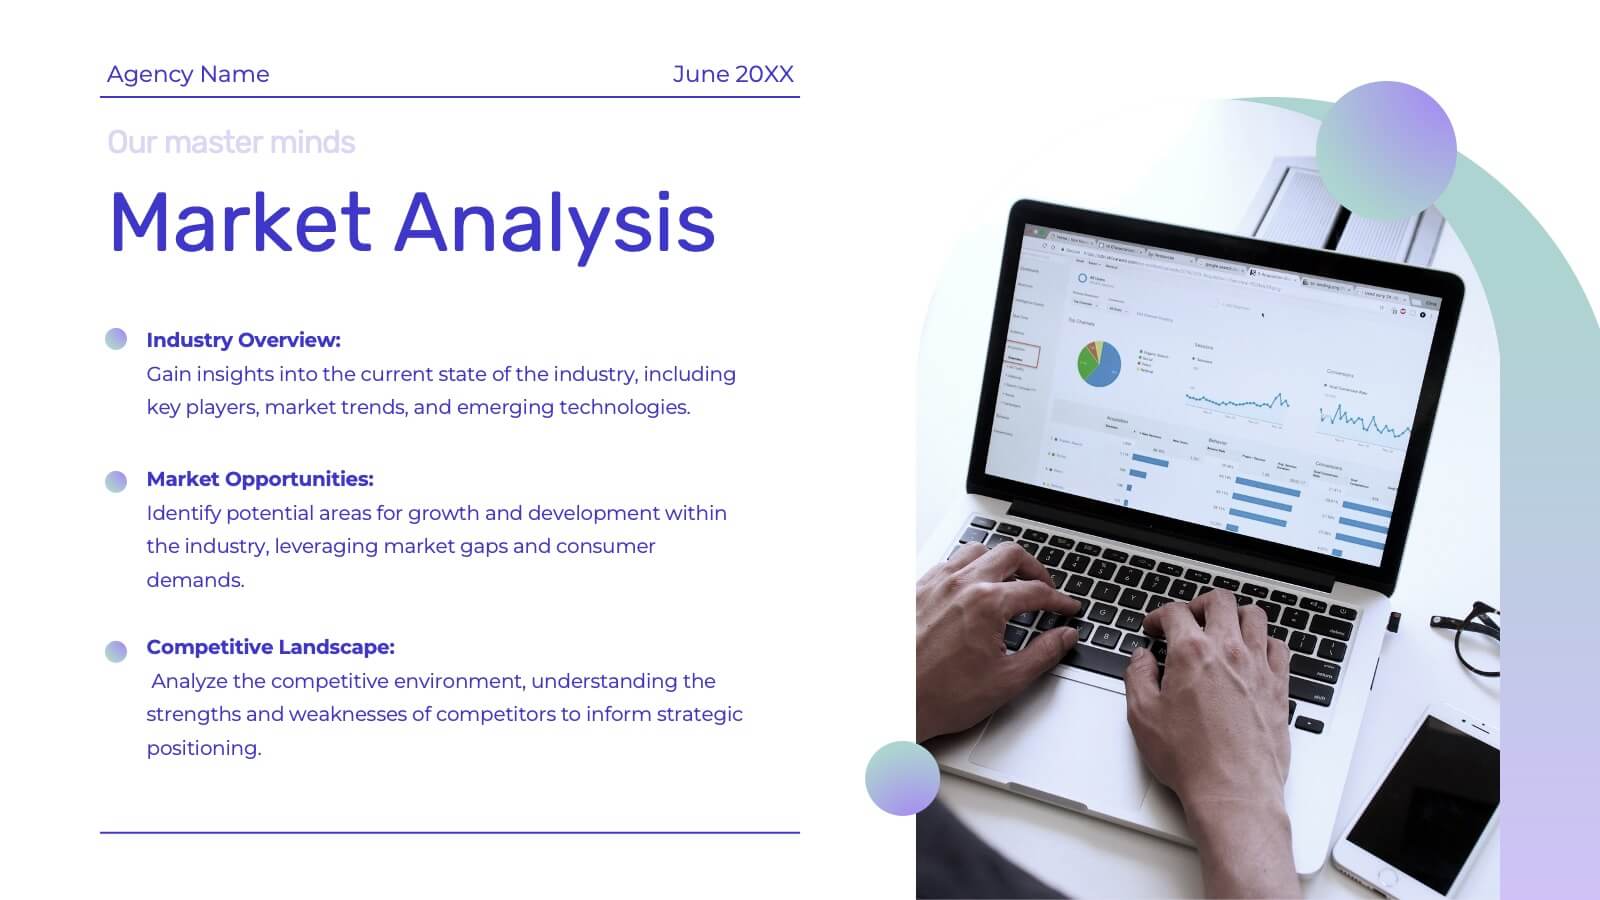
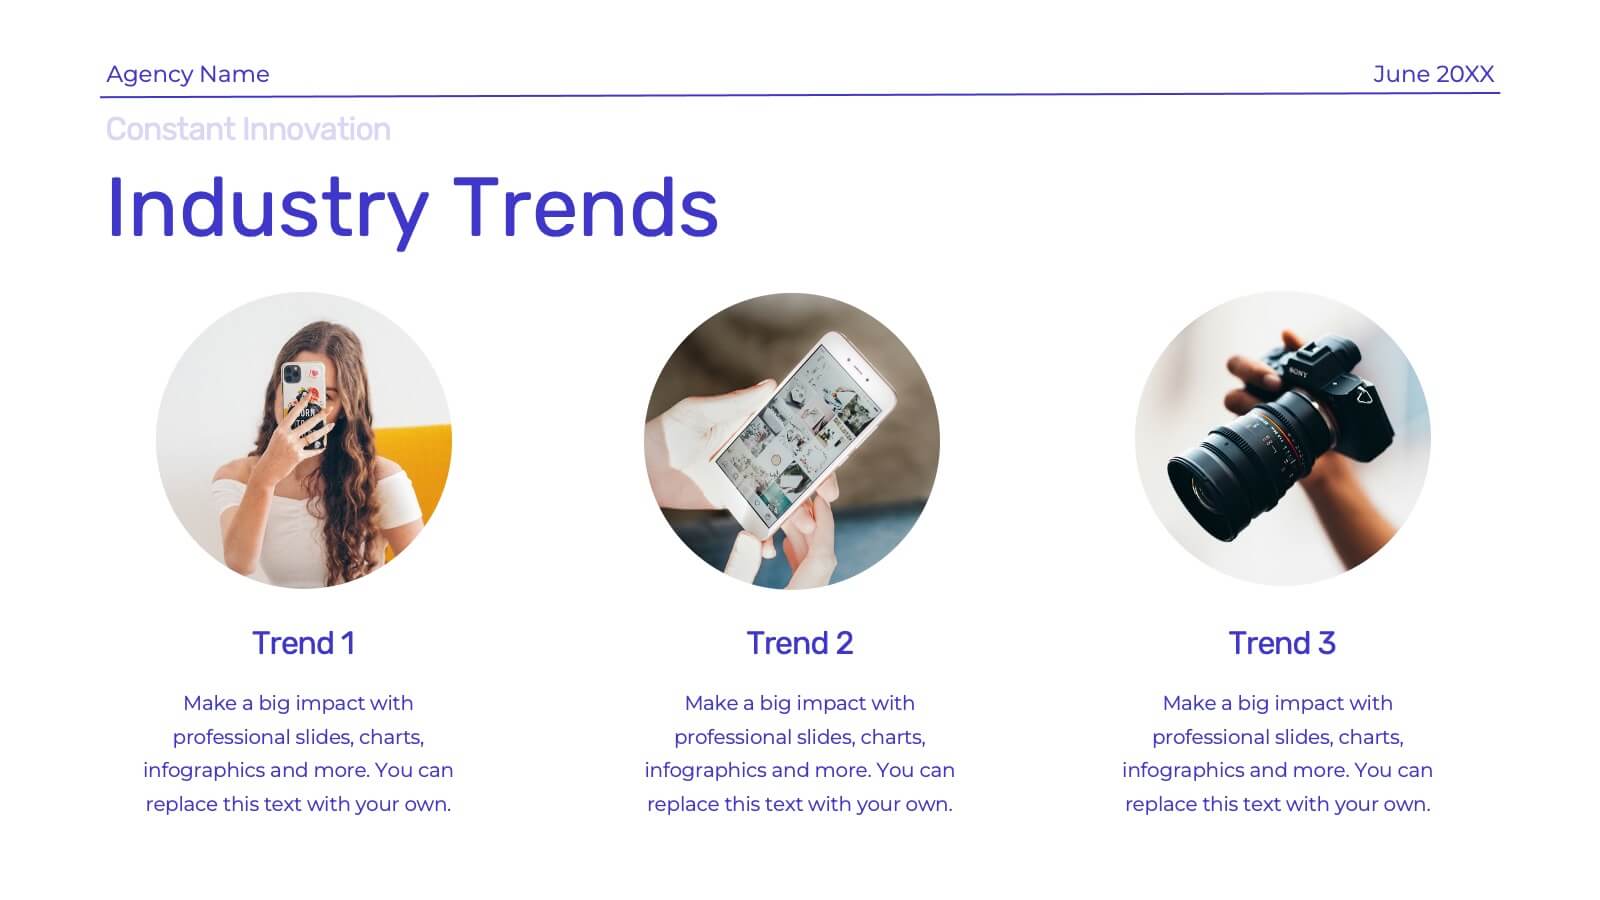
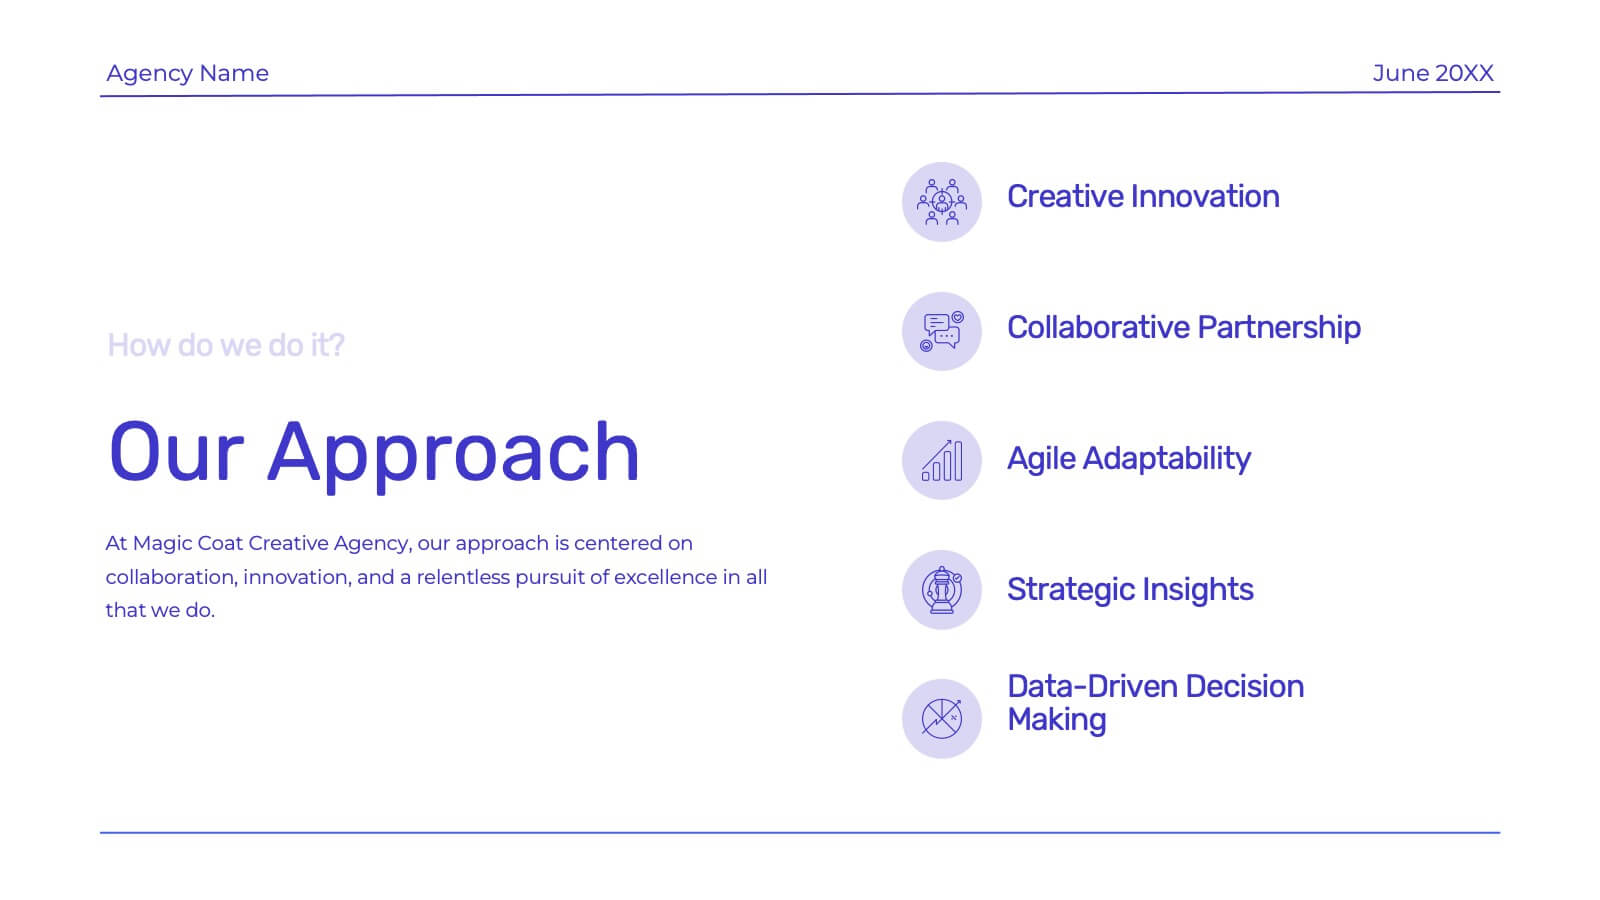
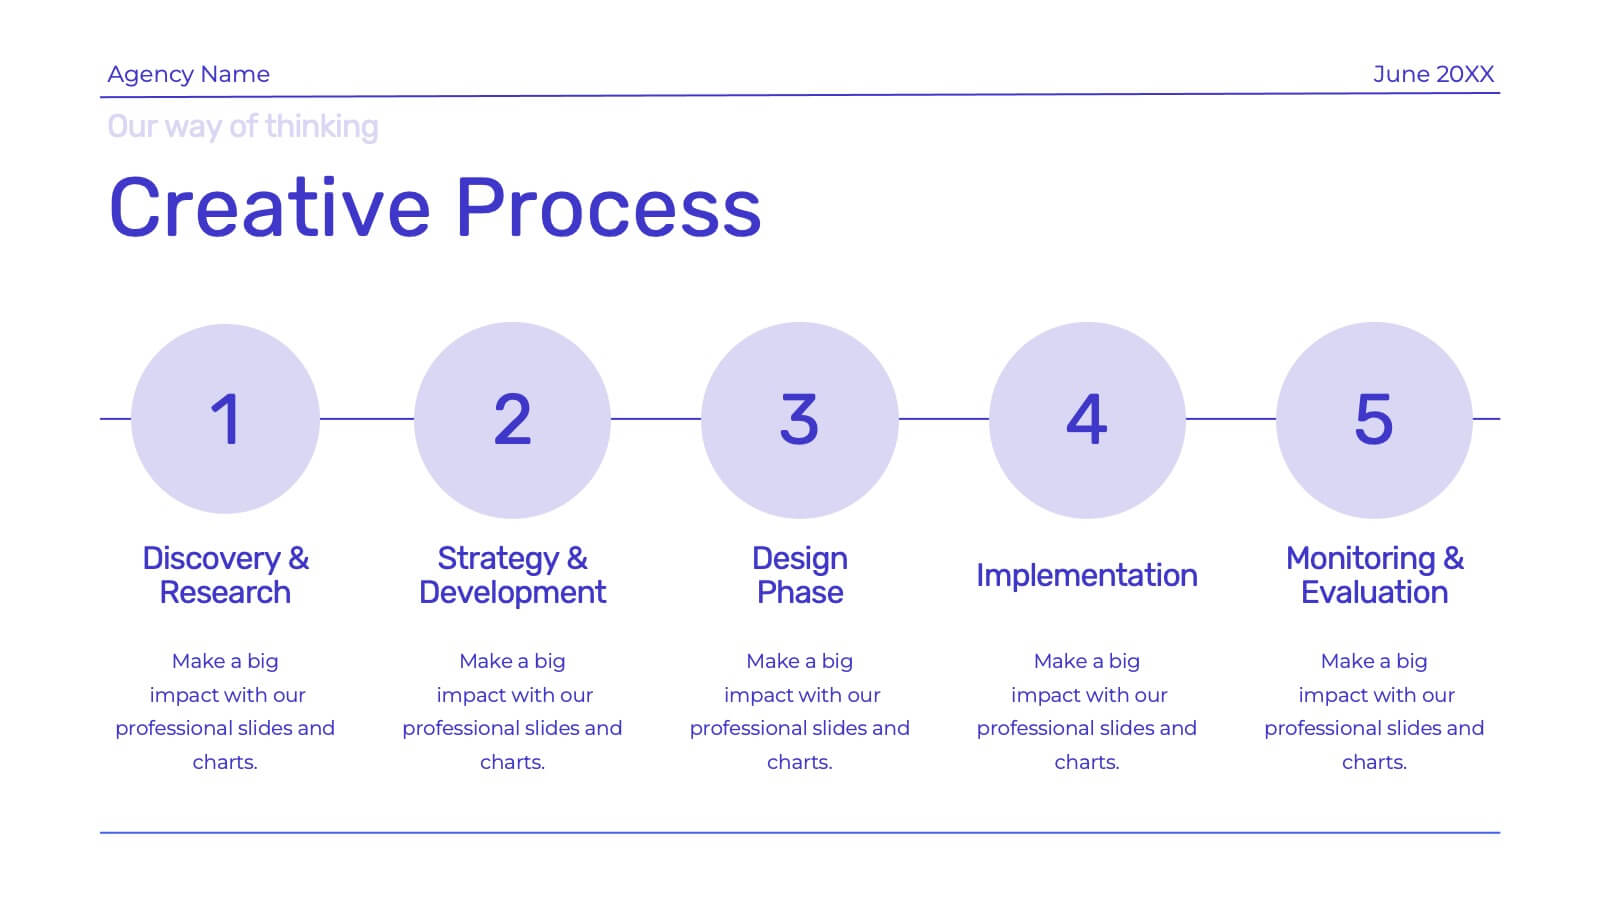
Showcase your creative agency’s strengths with this vibrant template. Highlight your team, services, success stories, and unique approach. Ideal for case studies, market analysis, and campaign execution. Fully compatible with PowerPoint, Keynote, and Google Slides.


5 slides
Business Annual Report Summary Presentation
Clear, Concise, and Impactful! The Business Annual Report Summary Presentation template helps you present key performance indicators, financial metrics, and company growth in a professional and visually engaging way. Fully customizable and compatible with PowerPoint, Keynote, and Google Slides, it’s ideal for executives and analysts aiming for a compelling data-driven presentation.


5 slides
Workout Motivation Infographics
Finding and maintaining Workout Motivation is a personal journey. These vertical infographics are informative designs that aim to inspire and motivate individuals to maintain an active and healthy lifestyle. This template is perfect for fitness professionals, personal trainers, health coaches, or anyone looking to create engaging content about workout motivation. With its vibrant and dynamic visuals, the template captures the essence of fitness and encourages viewers to embark on their fitness journey. They are designed with eye-catching icons, illustrations, and color schemes that grab attention and make the information easy to understand and remember.


26 slides
Flower Shop and Blossoms Presentation
A flower shop, also known as a floral boutique, is a retail establishment that sells fresh flowers, floral arrangements, and related products. This presentation template has a charming design that celebrates the beauty and elegance of flowers. This template is perfect for florists, flower shops, garden enthusiasts, or anyone looking to create a captivating presentation about flowers, floral arrangements, or the art of floristry. The presentation features visually stunning floral icons with colorful and artistic arrangements, creating a delightful and inviting atmosphere. This template is fully customizable and compatible with Powerpoint, Keynote, and Google Slides.


8 slides
Team Time Allocation and Planning Presentation
Stay on top of your team's workload with the Team Time Allocation and Planning presentation slide. This template features a clear, month-by-month Gantt-style layout, helping you visualize team tasks, priorities, and resource distribution across the year. Ideal for project managers, department leads, or operations teams aiming to streamline scheduling and improve collaboration. Fully customizable in PowerPoint, Keynote, and Google Slides.


26 slides
Understanding Cryptocurrency Presentation
Step into the future of finance with this engaging presentation on cryptocurrency. Covering key topics like blockchain technology, digital wallets, market trends, and security best practices, this template helps simplify complex concepts for any audience. Fully customizable and compatible with PowerPoint, Keynote, and Google Slides for a seamless and informative presentation experience.


8 slides
Digital Payment and Credit Solutions Deck Presentation
Present your financial strategies with clarity using this Digital Payment and Credit Solutions Deck Presentation. Designed to highlight key service features and fintech insights, this layout visually compares digital cards, credit options, or payment tiers. Perfect for banks, startups, and financial analysts. Fully editable in PowerPoint, Keynote, and Google Slides.


8 slides
Early Detection and Prevention of Breast Cancer Presentation
Take a proactive approach to health with the Early Detection and Prevention of Breast Cancer template, designed to emphasize essential awareness and prevention strategies. This template, compatible with PowerPoint, Keynote, and Google Slides, uses intuitive icons and a clean design to effectively communicate key prevention measures and screening importance, ideal for healthcare seminars and community health initiatives.


8 slides
Success Metrics and Performance Presentation
Showcase your Success Metrics and Performance with this data-driven presentation template. Designed with bar-style visualizations and percentage-based highlights, this layout is ideal for business analysts, project managers, and executives looking to present key performance indicators (KPIs) with clarity. Featuring customizable colors, icons, and text placeholders, this template ensures clear and impactful storytelling. Compatible with PowerPoint, Keynote, and Google Slides for easy integration.