


Features
- 8 Unique slides
- Fully editable and easy to edit in Microsoft Powerpoint, Keynote and Google Slides
- 16:9 widescreen layout
- Clean and professional designs
- Export to JPG, PDF or send by email


Do you have any questions?
Recommend


21 slides
Karma Design Portfolio Presentation
Step into the spotlight with this bold and contemporary design portfolio! It presents your creative work in a sleek, visually striking format. From featured projects to your creative process and collaborations, this portfolio will leave a lasting impression. Perfect for showcasing your design style on PowerPoint, Keynote, or Google Slides!


7 slides
Alphabet Letters Infographic
An alphabet infographic is a visual representation or graphic that presents information related to the alphabet, often used for educational purposes or to convey information in a creative and engaging manner. Get ready to embark on a joyful journey through the wonderland of letters and words with our alphabet letters infographic. This infographic template includes various elements like letters, words, examples, pronunciation guides, or related images. This is more than just an infographic—it's a vibrant celebration of language, learning, and pure happiness. Dive into the kaleidoscope of alphabets and spread the cheer!


4 slides
Business SWOT Evaluation Presentation
Break down business strategies with this visually structured SWOT analysis layout. Present strengths, weaknesses, opportunities, and threats in a clean, quadrant-style format. Ideal for reports, pitches, or internal reviews. Fully editable in PowerPoint, Keynote, and Google Slides for clear, impactful analysis that drives smarter decision-making and strategic alignment.


5 slides
Home Investment and Property Value Presentation
Visualize key real estate insights with this skyline-themed slide, ideal for showcasing home investment data and market value trends. Designed for realtors, analysts, or housing consultants, it features a cityscape layout for clear comparison. Fully editable in PowerPoint, Keynote, and Google Slides for effortless customization and polished presentations.


4 slides
Freight & Logistics Route Planning Presentation
Track every mile with this smart and stylish logistics flowchart. Visualize freight movement across air, sea, rail, and road using bold, intuitive icons and directional arrows. A great fit for supply chain managers and route optimization strategies. Easily customizable in PowerPoint, Keynote, and Google Slides.


4 slides
Skills Development Training Schedule Presentation
Organize learning paths with clarity using the Skills Development Training Schedule Presentation. This structured grid layout helps you map out training modules by skill category and timeline. Ideal for internal workshops, L&D planning, or certification programs. Fully editable in PowerPoint, Keynote, Google Slides, or Canva for seamless customization.


26 slides
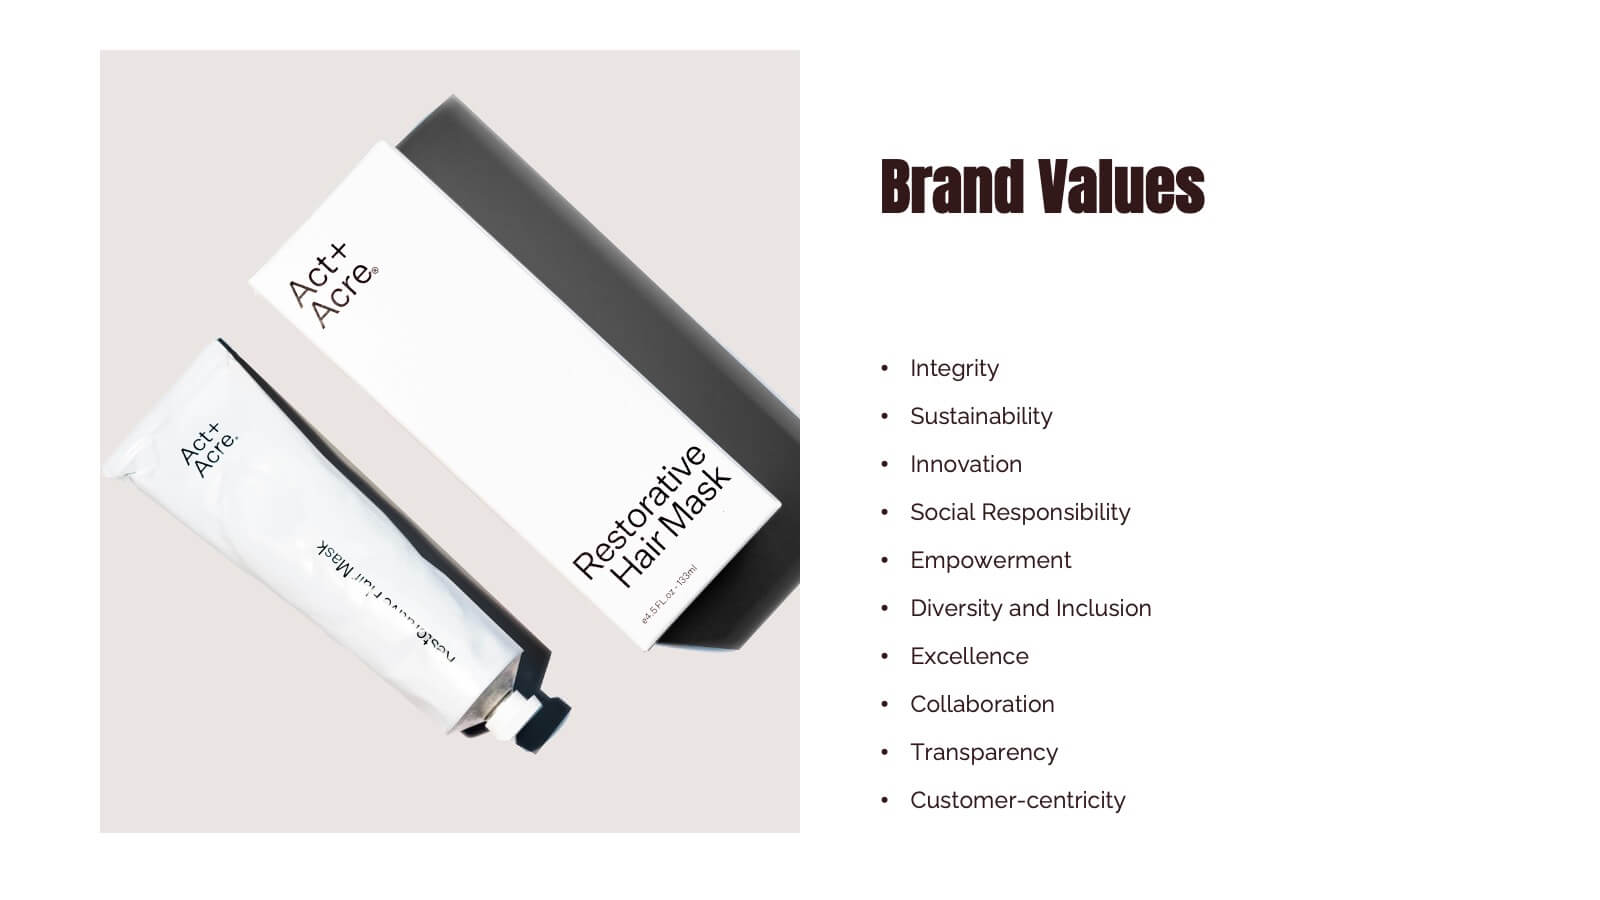
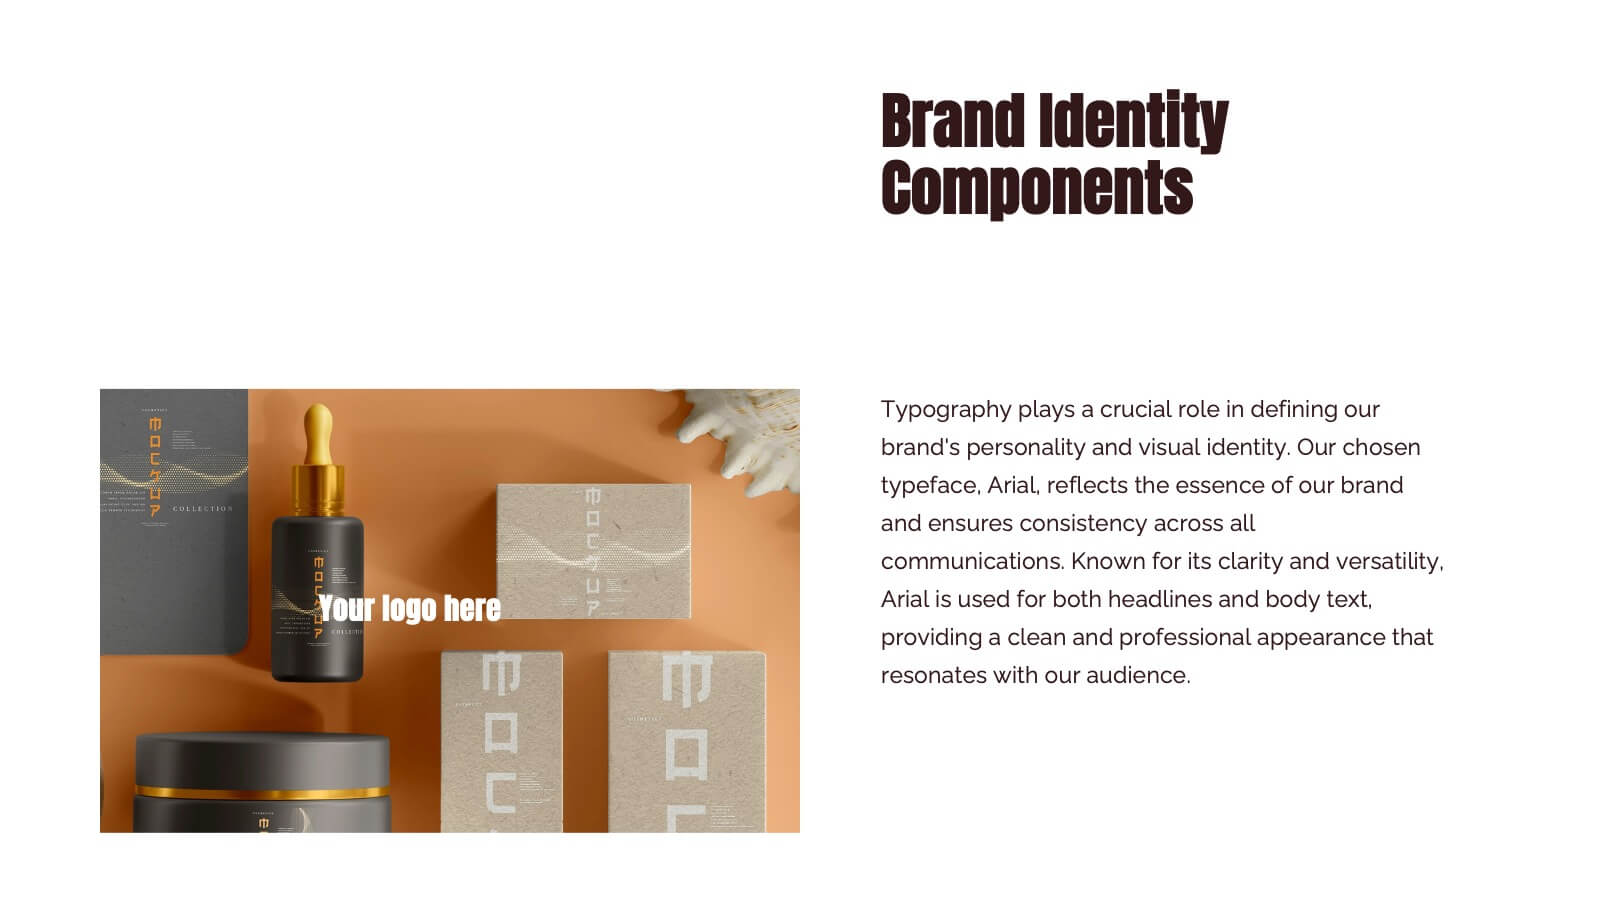
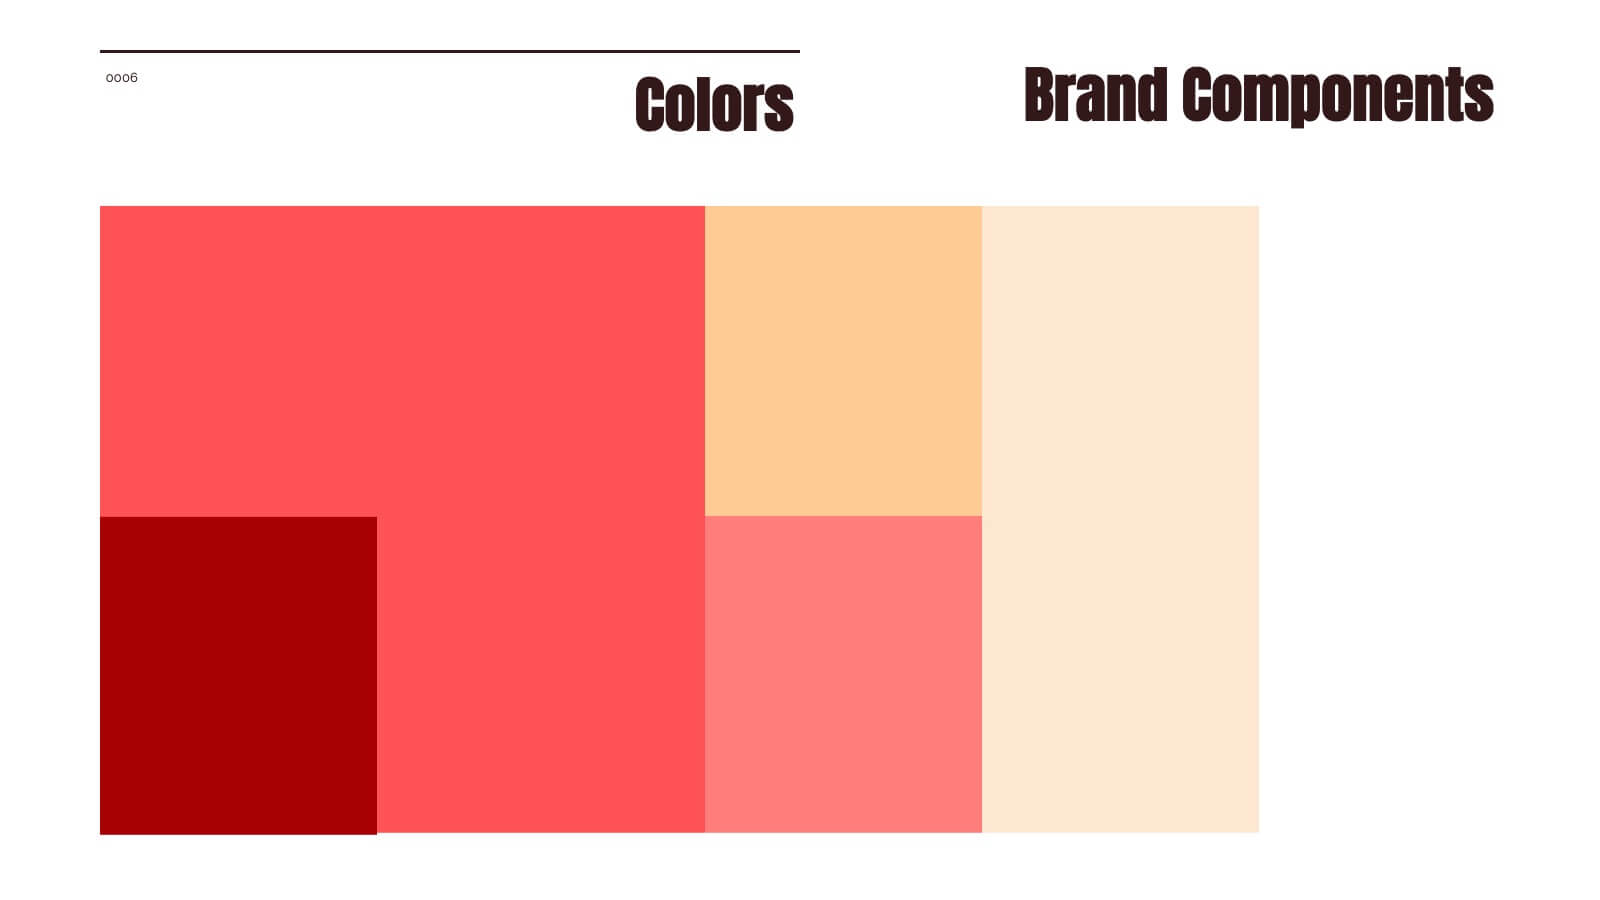
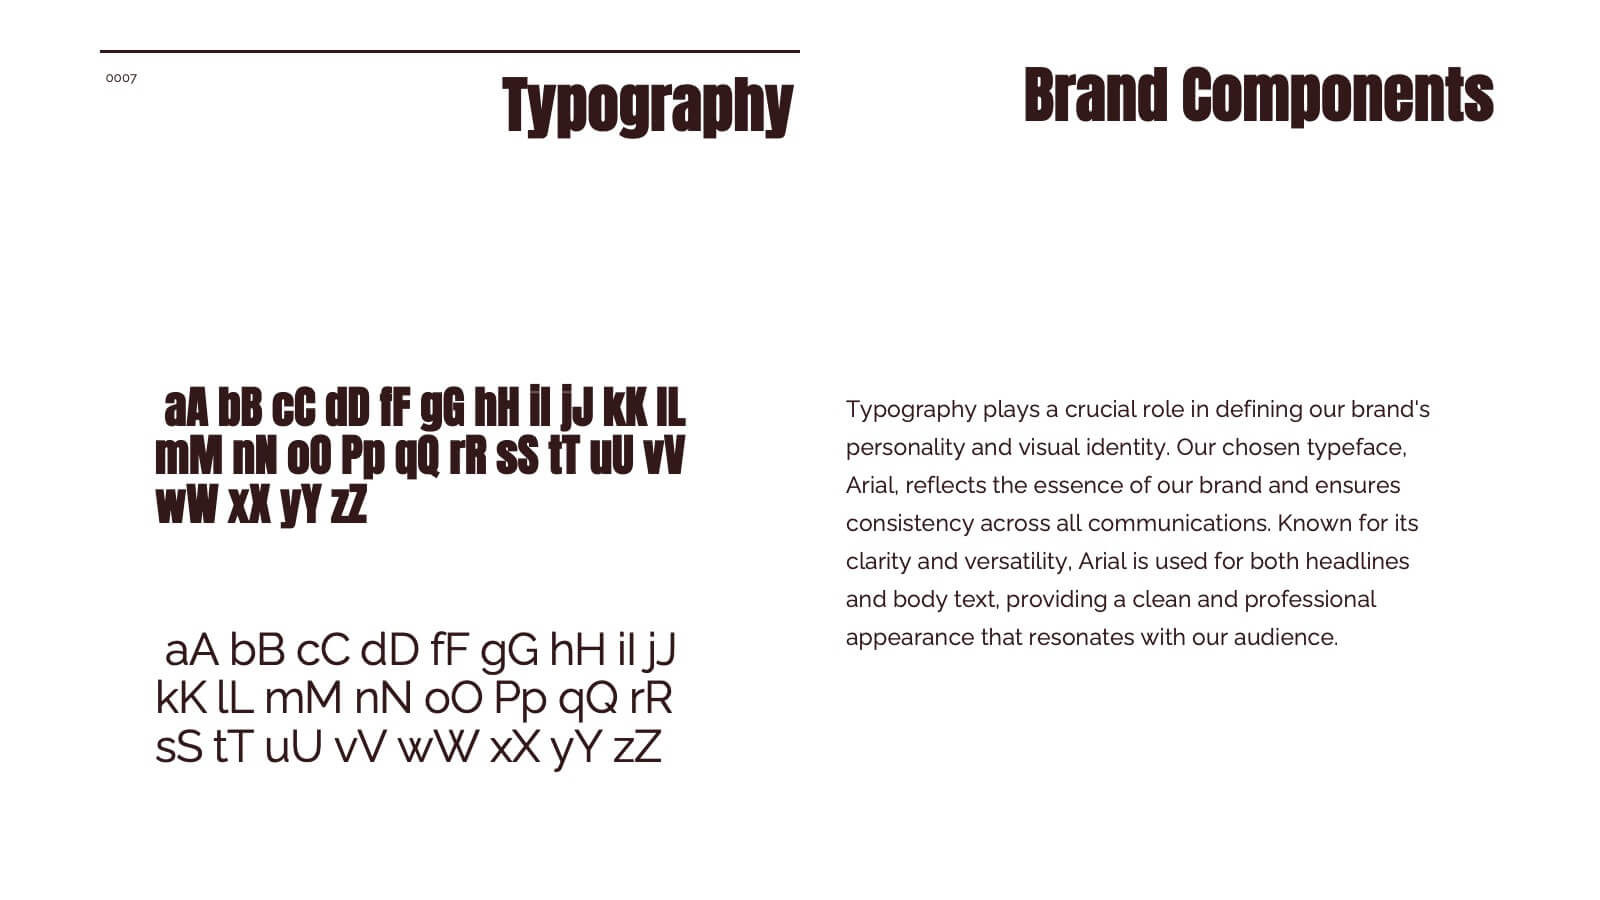
Tempo Brand Identity Presentation
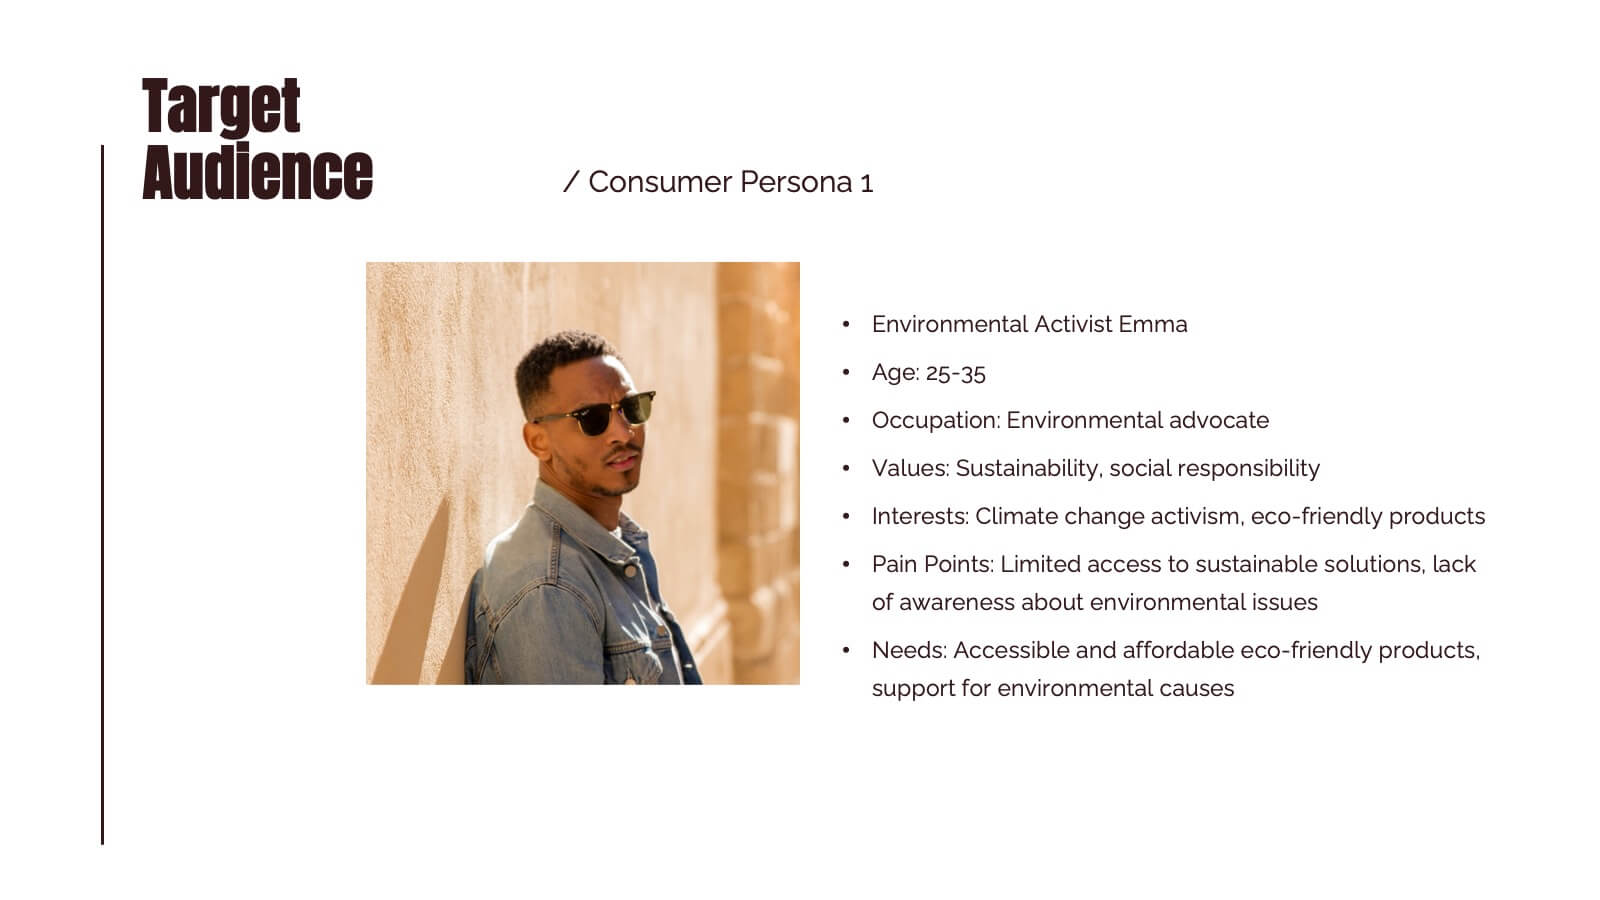
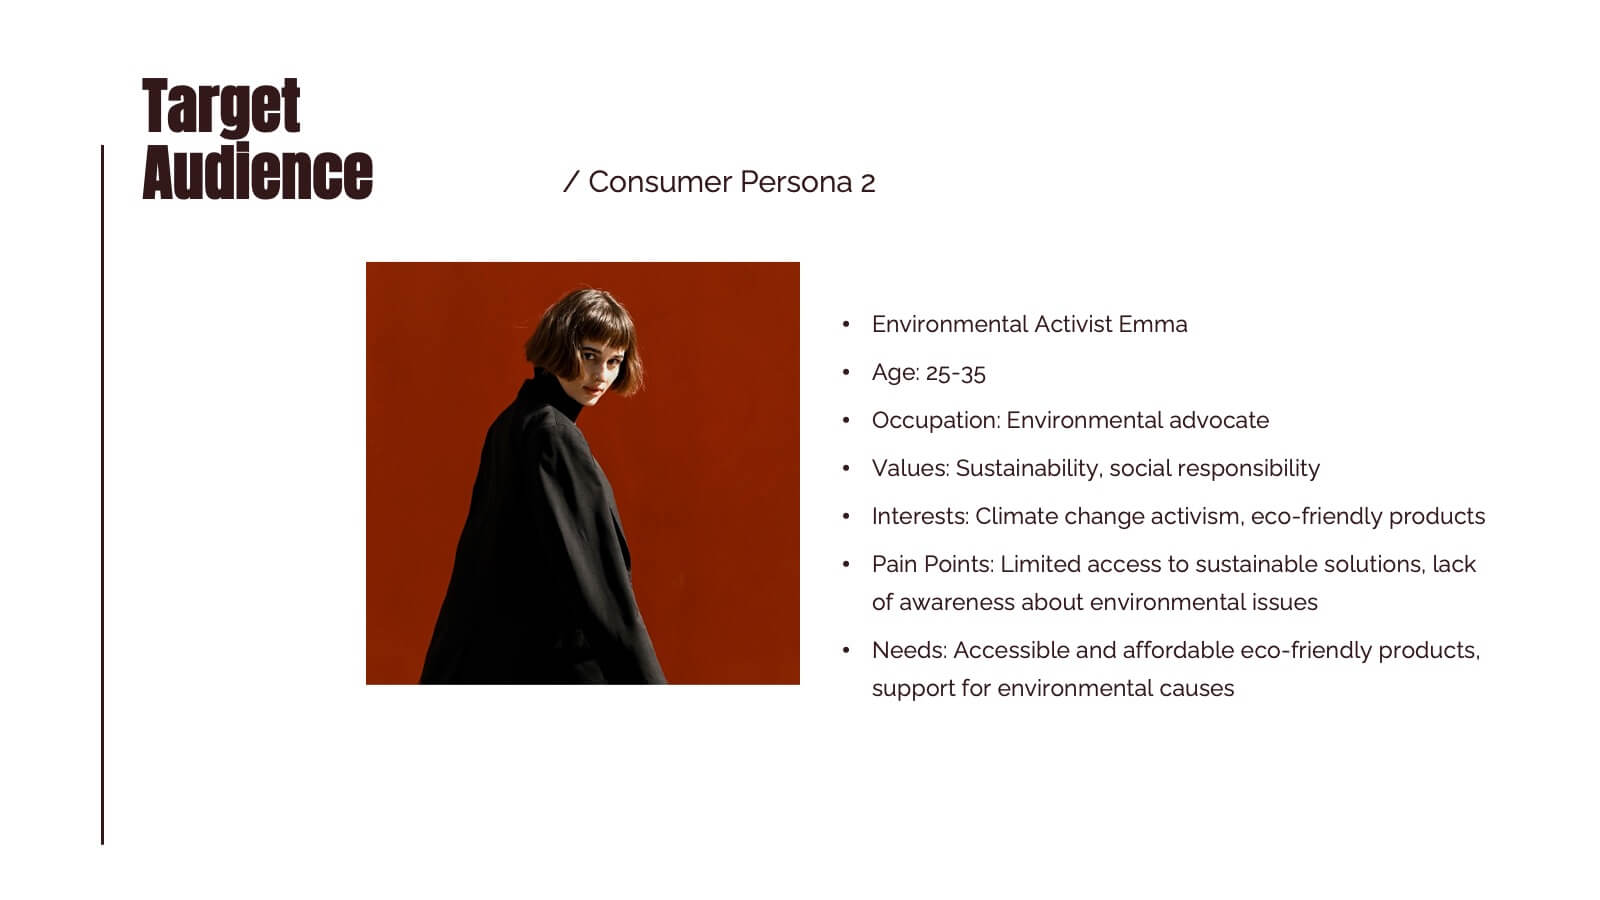
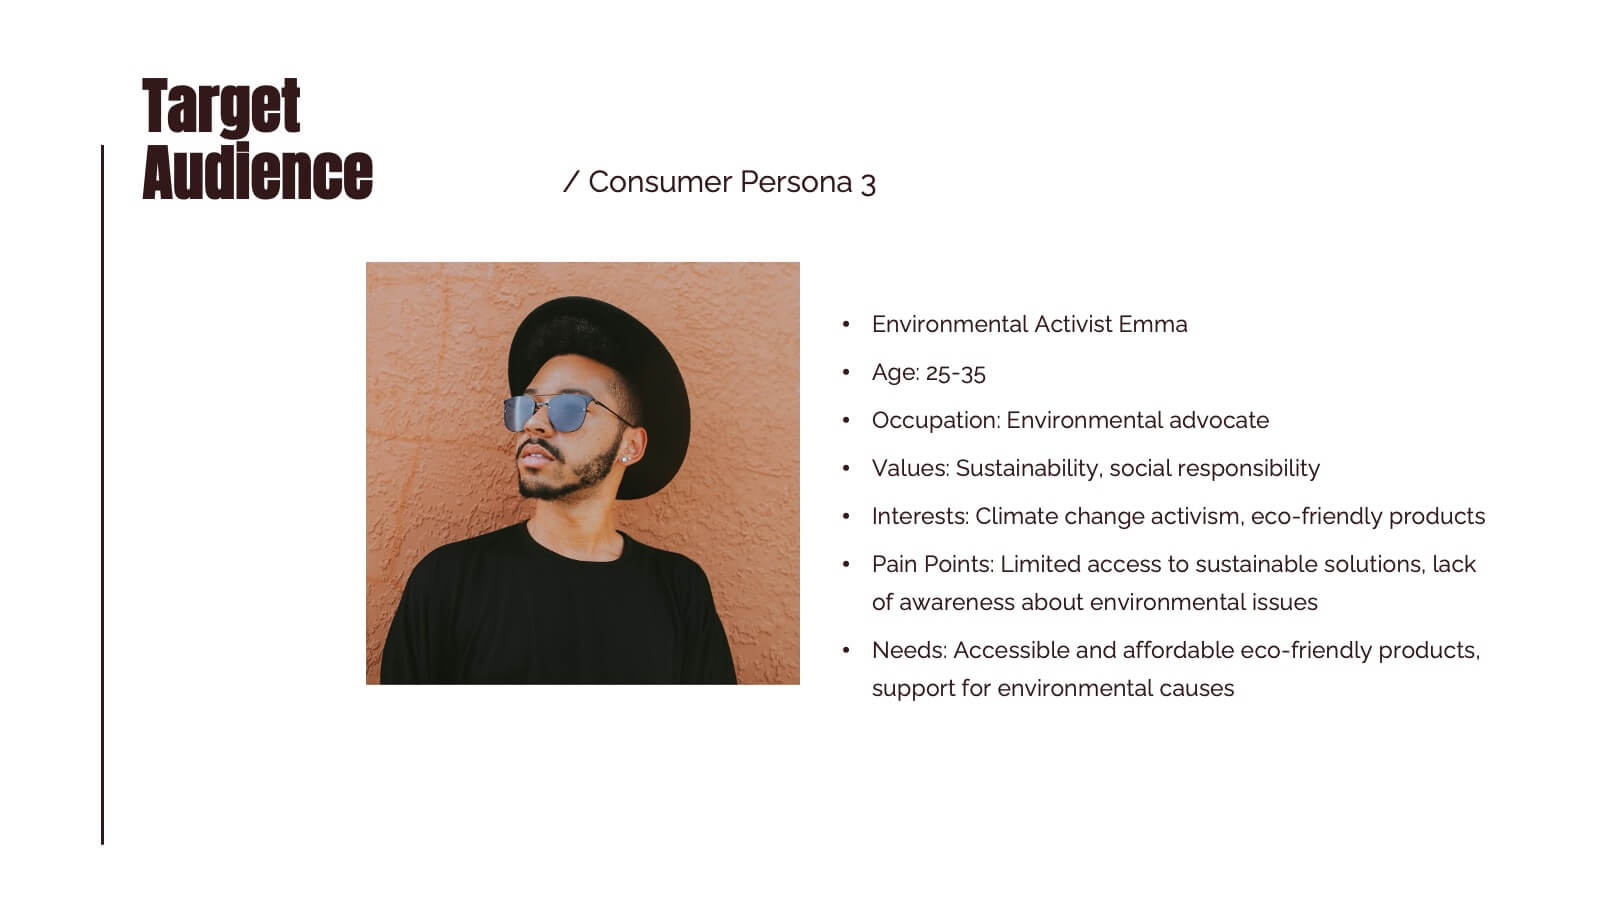
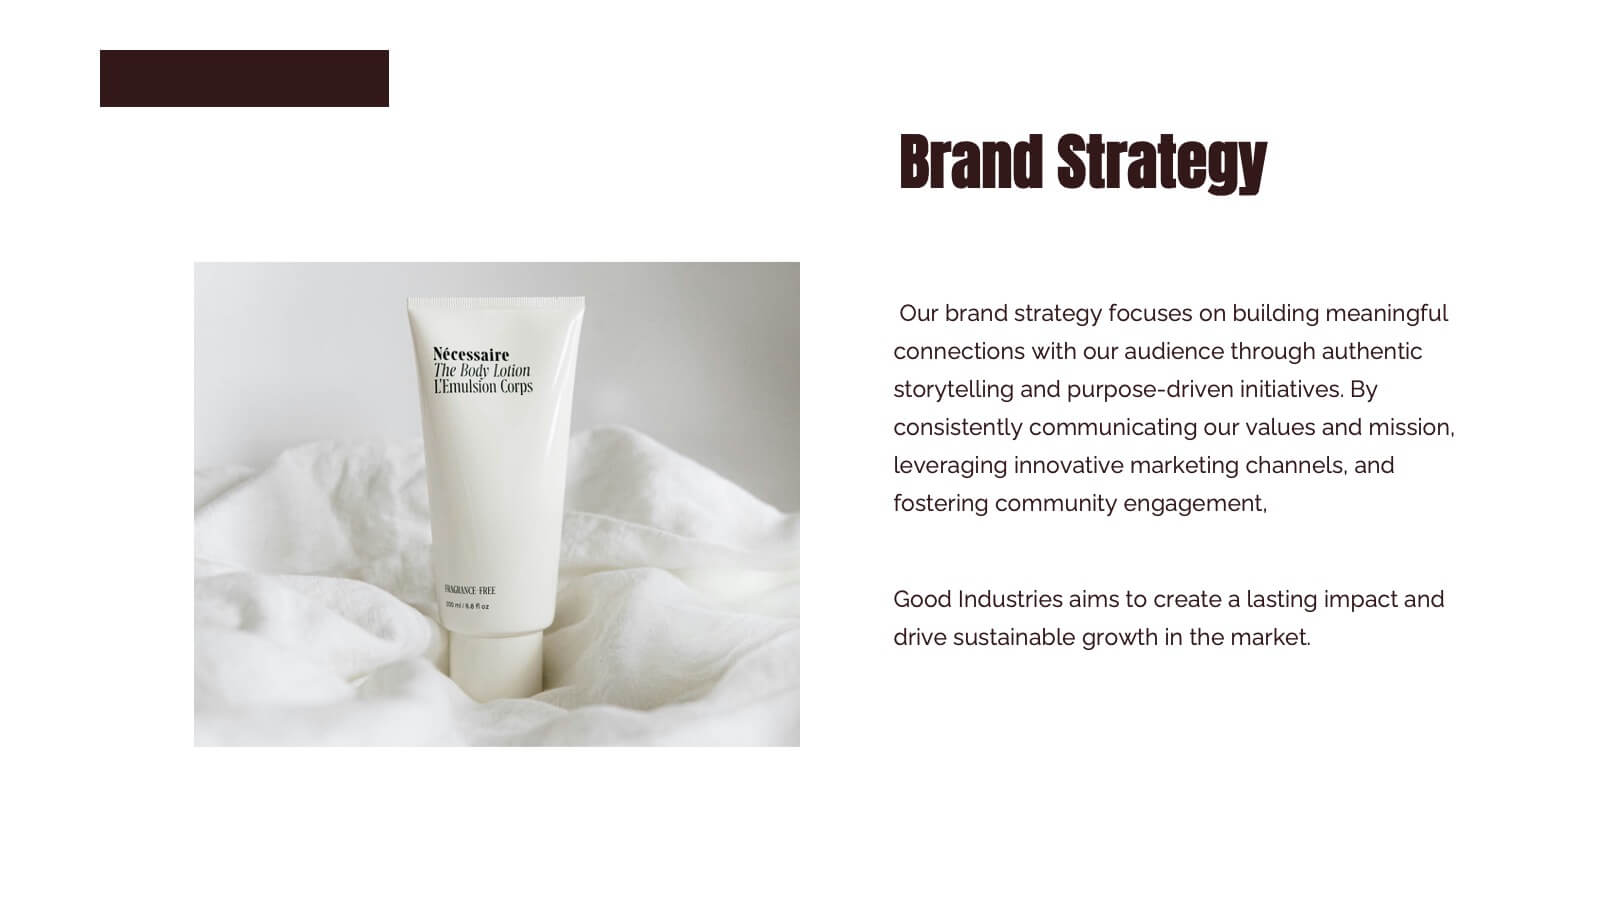
Introduce and elevate your brand with this versatile presentation template designed to reflect your company's vision and values. Perfect for businesses looking to showcase their brand strategy, components, and touchpoints with clarity and professionalism. This presentation features thoughtfully designed slides covering brand identity components, visual guidelines, target audience insights, and future development plans. Use dedicated sections to outline your unique selling proposition, positioning, and strategy. With its clean layout and attention to detail, it's ideal for presenting a cohesive and impactful brand narrative. Compatible with PowerPoint, Google Slides, and Keynote, this template is fully customizable. Edit colors, text, and images to align with your brand aesthetics and messaging. Deliver your presentation with confidence, ensuring your audience is inspired by a polished and professional brand identity.


4 slides
Attention-Interest-Desire-Action Sales Strategy Presentation
Highlight each phase of your sales journey with this clean and modern AIDA model layout. Designed for clarity, it uses bold semicircle visuals and directional arrows to guide your audience from capturing attention to driving action. Perfect for sales teams, marketers, and consultants. Fully editable in PowerPoint, Keynote, and Google Slides.
25 slides
Blaze Brand Identity Presentation
Ignite your brand's potential with this vibrant, blaze-inspired presentation! Ideal for showcasing your brand identity, this template highlights key elements like logo design, color palette, and brand messaging with bold visuals and a modern layout. Perfect for making your brand stand out. Compatible with PowerPoint, Keynote, and Google Slides.


20 slides
Radiance Sales Forecast Presentation
This vibrant sales presentation template is perfect for showcasing your strategy, objectives, and team. It highlights key areas like pricing, sales process, and performance metrics with a modern and eye-catching design. Compatible with PowerPoint, Keynote, and Google Slides, it ensures you’ll deliver impactful and professional presentations every time. Get ready to wow your audience!


5 slides
Traveling Needs Infographics
Travel Infographics play an important role in providing valuable and engaging information to travelers. These infographics are visual representation of the essential items and considerations for travelers. This template is designed to provide travelers with an overview of what they need to pack, plan, and prioritize before a trip. This consists of customizable elements such as icons and illustrations that visually depict different categories of traveling needs. These categories can include clothing and accessories, travel documents, health, and more. This template will help you convey the essential items and tips for a successful and enjoyable trip.


6 slides
Monthly Business Calendar Planning Presentation
Stay on top of your schedule with this clean and effective business calendar template. Designed for monthly planning, each slide features a weekly breakdown across Monday through Saturday, allowing you to map out initiatives, tasks, or events. Customize labels for meetings, milestones, or campaigns with color-coded weeks and neat icons for quick reference. Ideal for project managers, team leads, and small businesses. Fully editable in PowerPoint, Keynote, and Google Slides.


6 slides
Title Hierarchy Infographic
The collection of slides is designed to efficiently convey key themes with a striking visual appeal, ensuring that crucial topics are presented with clarity and emphasis. Each slide utilizes bold typography and a unique color palette to draw attention and maintain viewer engagement. The designs incorporate dynamic shapes and minimalist layouts, enhancing the presentation's readability while emphasizing important content. This set is ideal for professionals aiming to present complex ideas in a clear and memorable way during meetings or in corporate documents. It supports various communicative goals, such as introducing concepts, outlining challenges, or promoting organizational initiatives, making it a versatile tool for enhancing message delivery in any professional setting.


6 slides
Business Performance Dashboard
Enhance your business presentations with our "Business Performance Dashboard" template. This comprehensive infographic provides a detailed overview of crucial business metrics, structured within a user-friendly dashboard layout. It includes financial data like total orders and cash on hand, operational stats such as project updates, and engagement metrics including views and follows. Each section is visually distinct, with icons and color blocks that make data easy to read and analyze. Ideal for managers and analysts, this template offers a snapshot of company performance, facilitating informed decision-making and efficient reporting. Compatible with PowerPoint, Keynote, and Google Slides, it's an essential tool for any business analysis.


21 slides
Phantomwood Product Roadmap Presentation
A comprehensive presentation template designed to outline product strategies and roadmaps. Covers key aspects like target market, competitive analysis, pricing, and technical specifications. Highlight marketing approaches, production processes, and support information effectively. Fully editable, this template is compatible with PowerPoint, Keynote, and Google Slides for seamless collaboration and professional delivery.


6 slides
Relationship Compatibility Infographic
Relationship compatibility refers to the degree to which two individuals are well-suited for each other in a relationship. This infographic can be a fun and informative way to explore the compatibility between individuals in a relationship. This template is designed to help individuals gain a better understanding of their relationships and make informed decisions about their interactions with others. Compatible with Powerpoint, Keynote, and Google Slides. The combination of visual elements and informative content can make this topic engaging and accessible. Making it easy for readers to navigate and understand the content.


6 slides
Major World History Milestones Presentation
Highlight significant events in a visually engaging way with this horizontal timeline template. Featuring clean icons, color-coded markers, and spacious text areas, it’s ideal for showcasing historical sequences, educational lectures, or research summaries. Fully editable in PowerPoint, Keynote, and Google Slides for customized storytelling and clear chronological impact.