


Features
- 5 Unique slides
- Fully editable and easy to edit in Microsoft Powerpoint, Keynote and Google Slides
- 16:9 widescreen layout
- Clean and professional designs
- Export to JPG, PDF or send by email


Do you have any questions?
Recommend


7 slides
Europe Population Infographic Presentation
A Europe Map infographic is a visual representation of the European continent, highlighting its geographic features, population, culture, history, and other relevant information. This template is a perfect graphic representation of Europe that combines text, data, and images in a fun and engaging way. This pre-designed template allows users to modify or customize the map to suit their specific needs. This includes a map of Europe with its countries, major cities, and geographic features, along with additional information and visuals related to the topic or purpose of the infographic.


21 slides
Cerberus Project Timeline Presentation
Bring your project vision to life with a well-structured plan that flows effortlessly. This presentation covers everything from objectives and timelines to budget breakdowns, team introductions, and next steps, helping you communicate key details with clarity. Perfect for internal or client presentations, and fully compatible with PowerPoint, Keynote, and Google Slides.


12 slides
Customer Support Common Questions Presentation
Enhance customer support efficiency with this modern and structured presentation slide. Featuring a head silhouette with question marks, this template effectively represents customer inquiries and problem-solving processes. Perfect for help desk teams, customer service training, and support workflow presentations, it is fully editable, allowing you to customize text, colors, and layout for a tailored experience. Compatible with PowerPoint, Keynote, and Google Slides for seamless integration.


5 slides
Animal Health and Veterinary Care Presentation
Promote optimal animal health and veterinary practices with our comprehensive presentation template. Designed to facilitate discussions on veterinary care, this template is perfect for educational seminars, veterinary training, or healthcare meetings, ensuring all aspects of animal welfare are covered effectively.


5 slides
European Countries Editable Map Presentation
Bring your data to life with a detailed and modern map layout that showcases insights across Europe. Perfect for visualizing country comparisons, regional statistics, or business expansion plans, this clean design ensures clarity and impact. Fully compatible with PowerPoint, Keynote, and Google Slides for easy editing and presentation.


7 slides
Social Hierarchy Infographics
A Social Hierarchy is a way of organizing and ranking individuals or groups within a society based on factors such as social status, wealth, power, and prestige. This template features a powerful message about the difference in power between different groups, a stylish design and is fully customizable. Designed for use in Powerpoint, Google Slides and Keynote. Use this template to make your point clear in a meaningful way that really sticks with your audience. This hierarchy themed infographic is best suited for presentations about company structure, business hierarchies and office politics.


22 slides
Transmuton Creative Agency Pitch Deck Presentation
Showcase your agency’s creativity and expertise with this bold and modern pitch deck presentation. Covering key areas like campaign execution, strategy development, client success stories, and market analysis, this template helps you present a compelling vision. Fully customizable and compatible with PowerPoint, Keynote, and Google Slides for a seamless presentation experience.


4 slides
Target Audience and Buyer Persona Analysis Presentation
Visually map out your core audience segments with this modern target diagram layout. This presentation features a concentric ring graphic to represent buyer personas and user data, alongside three editable text sections with icons for clear and structured insights. Ideal for marketing strategies, customer profiling, and campaign planning. Easily customizable in PowerPoint, Keynote, and Google Slides.

23 slides
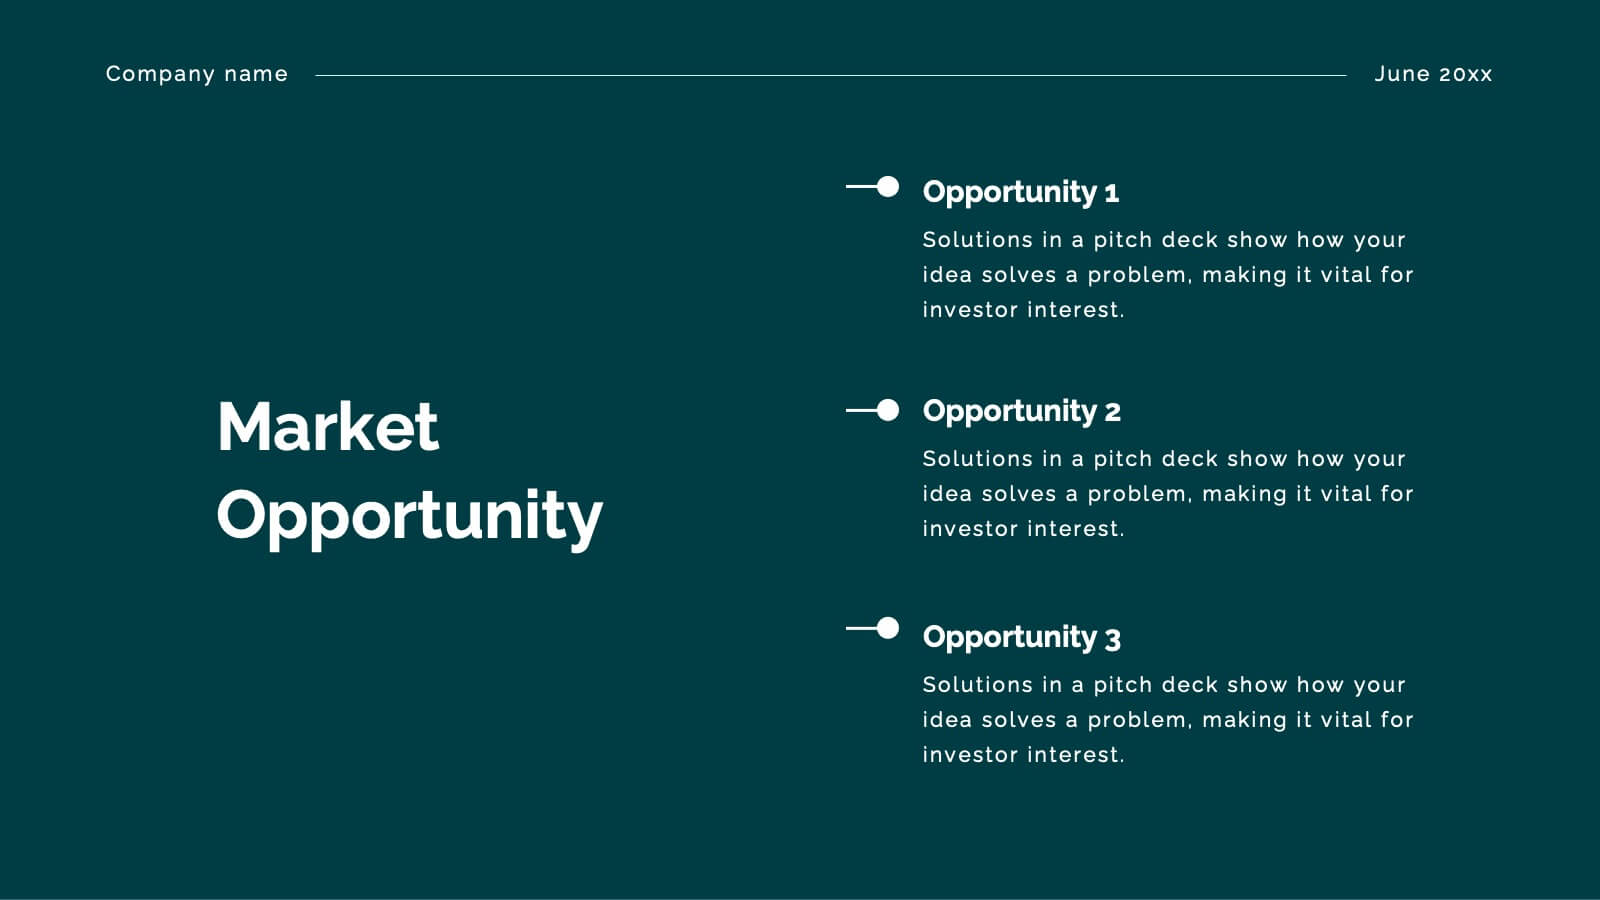
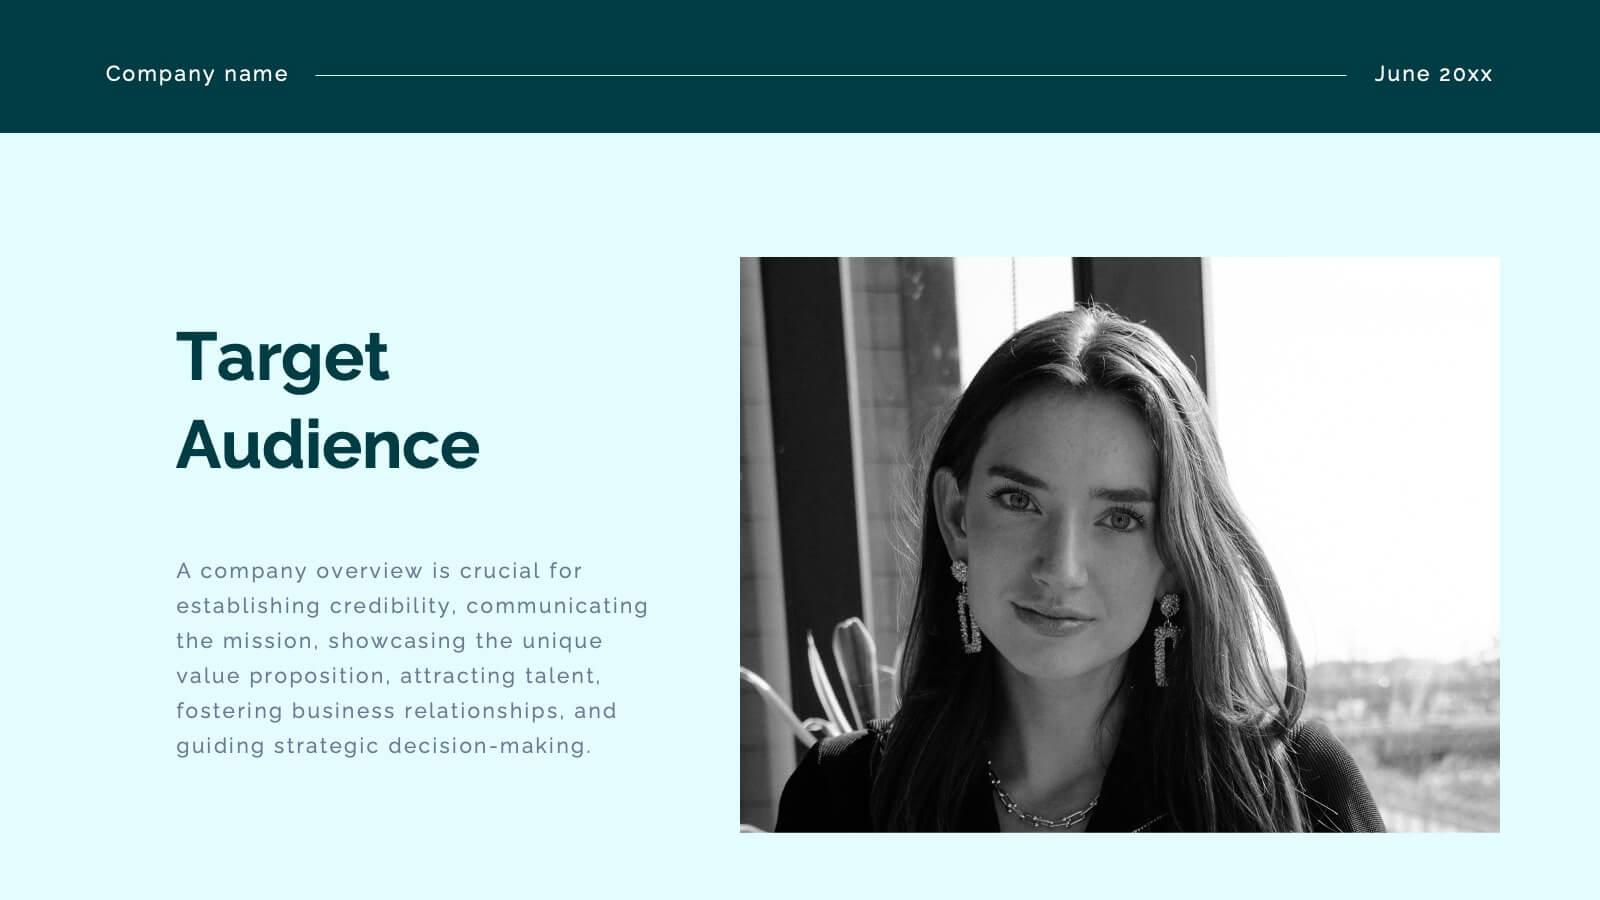
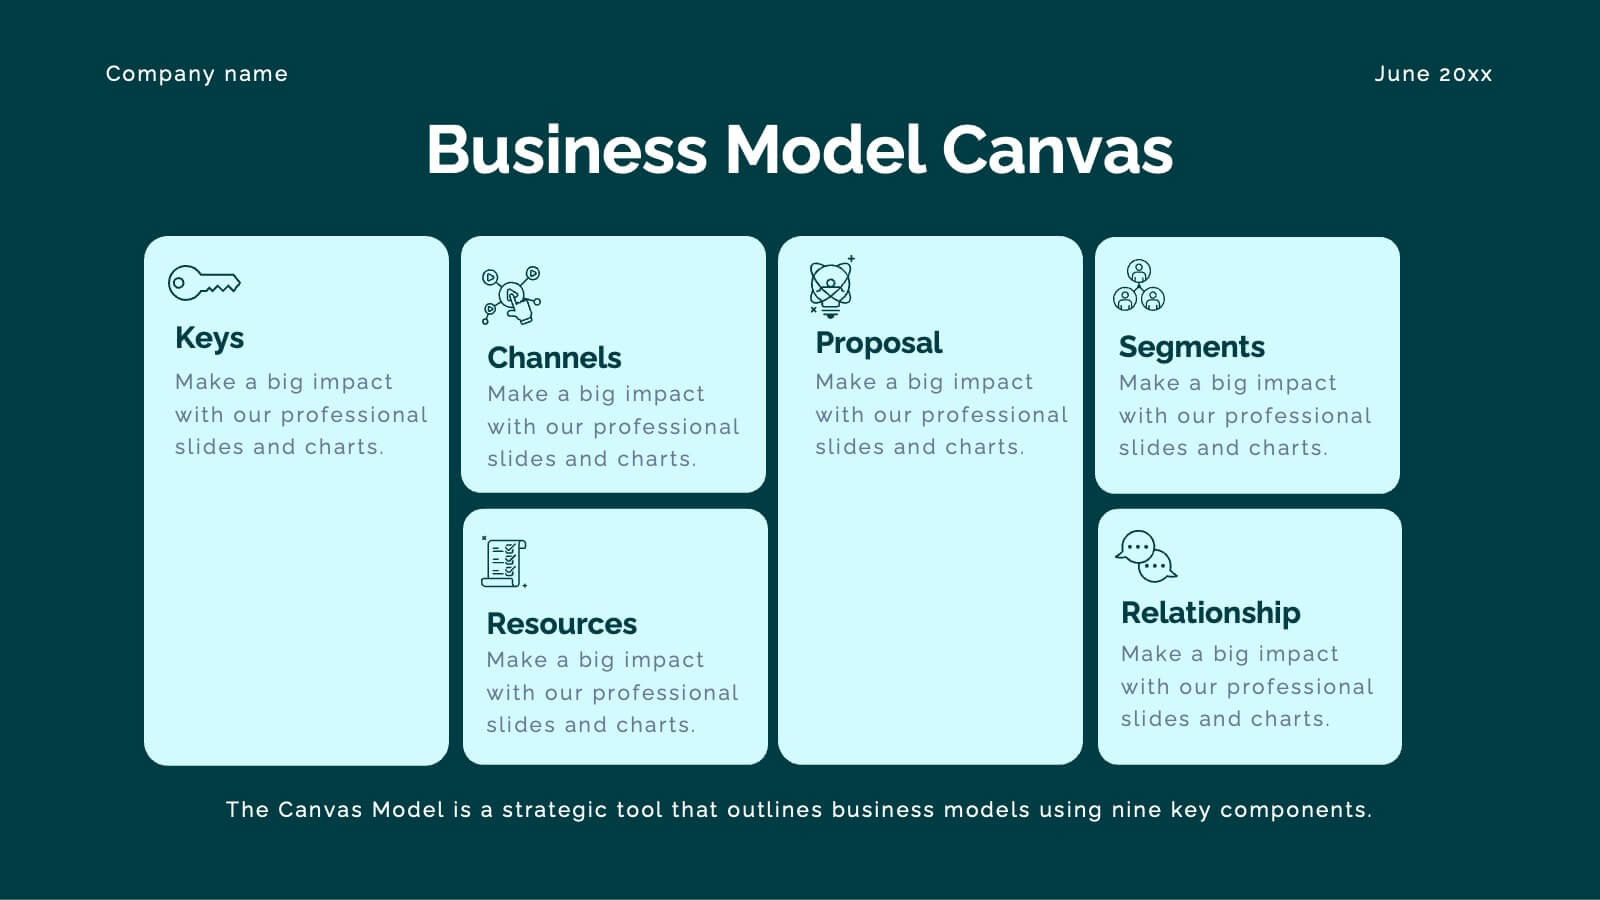
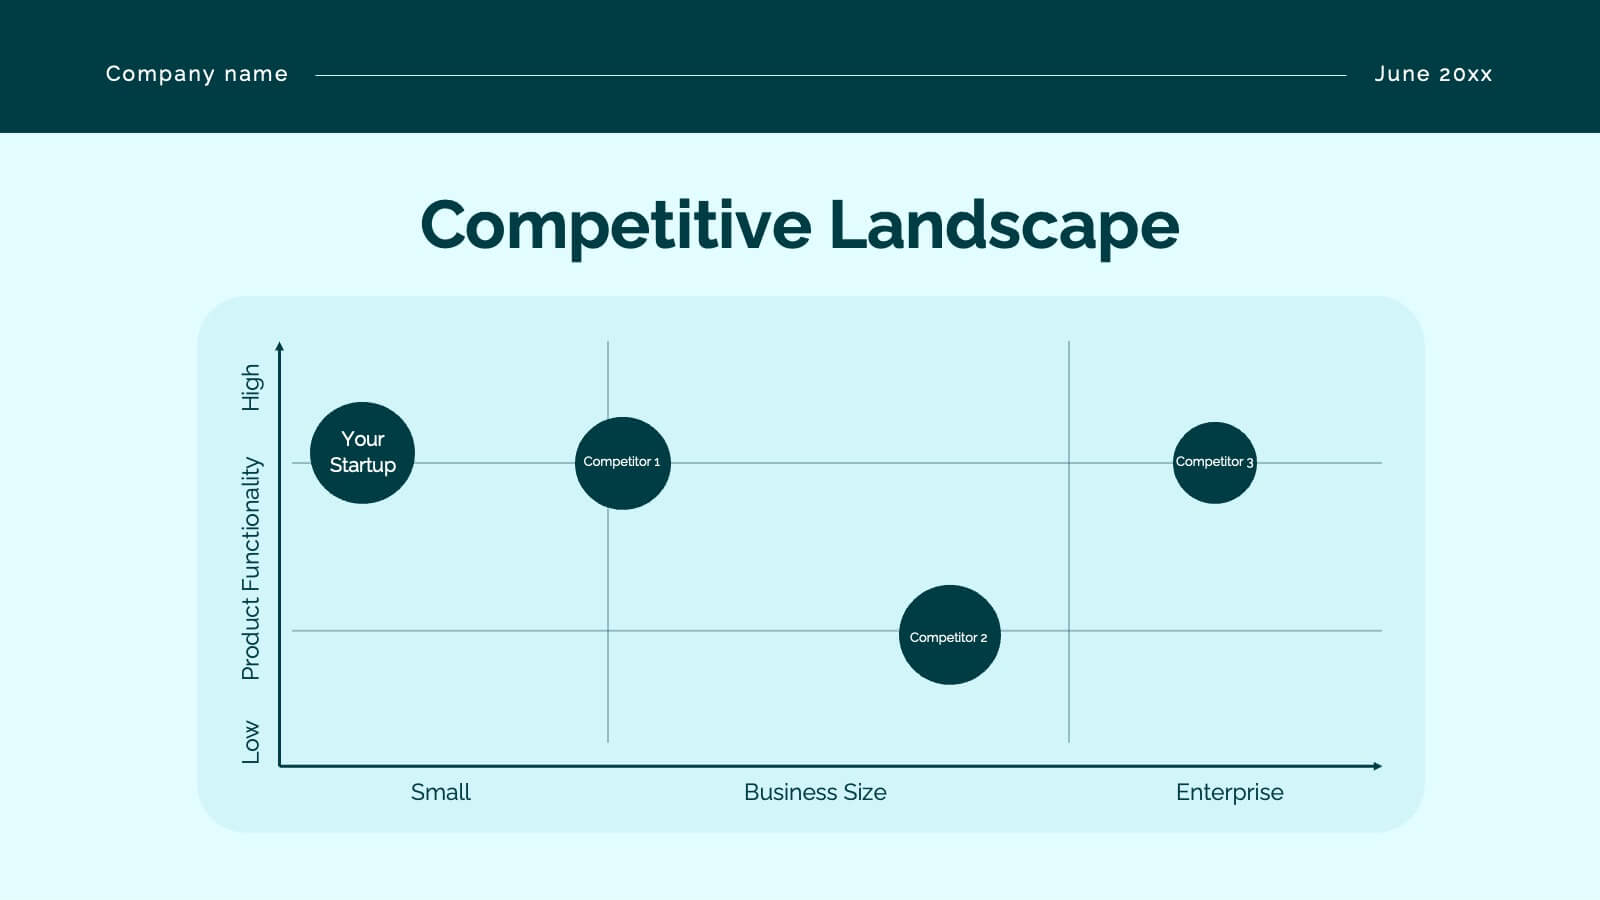
Crest Investor Pitch Presentation Presentation
Unleash your potential with this powerful pitch deck template! Tailored for presenting innovative business ideas, it features slides for company overview, market opportunity, competitive landscape, and financial projections. Clearly communicate your value proposition and impress investors with professional design and concise content. Compatible with PowerPoint, Keynote, and Google Slides for seamless presentations on any platform.


6 slides
Startup Goals and MVP Rollout Plan Presentation
Launch with clarity using the Startup Goals and MVP Rollout Plan Presentation. This dynamic circular layout features a rocket icon and segmented design to represent phased growth and product milestones. Ideal for showcasing early-stage priorities, MVP deliverables, and go-to-market strategies. Compatible with PowerPoint, Keynote, Google Slides, and Canva for full customization.


5 slides
Business Project Status Review Presentation
Present your team's progress with clarity using this hexagon-icon based project review layout. Designed for status updates, this slide includes four visually distinct sections with toggle-style indicators for highlighting progress, milestones, or tasks. Ideal for project managers, corporate teams, or consultants. Fully editable in PowerPoint, Keynote, and Google Slides.


5 slides
AI for Business Innovation Presentation
The "AI in Business" presentation template showcases how AI can be applied across different business processes. It features a friendly robot icon that creatively represents AI's role in modern business, making it visually engaging. The four connected nodes A, B, C, and D likely detail specific applications or case studies of AI in business, such as data analysis, automation, customer interaction, and innovation. This layout is excellent for presentations that aim to explain complex technological implementations in a straightforward and accessible manner, perfect for corporate training or stakeholder briefings.


5 slides
Mission and Values Alignment
Align your purpose with progress using this clean, directional layout that maps your mission, core values, and strategic focus in a unified flow. Perfect for internal briefings or culture decks, this slide visually connects each value to your organizational journey. Fully compatible with PowerPoint, Keynote, and Google Slides.


6 slides
Creating Effective Buyer Persona Strategies Presentation
Present your audience research with clarity using this buyer persona strategy slide. Designed with a radial layout of five icons leading to a central profile, this template helps communicate key traits, behaviors, and preferences. Ideal for marketing teams, branding workshops, and product strategy sessions. Easily customizable in PowerPoint, Keynote, and Google Slides.


4 slides
Employee Performance Feedback
Showcase progress clearly with this Employee Performance Feedback presentation. Featuring skill-based metrics, productivity scores, and analysis ratings, this layout uses visual data bars to evaluate team performance at a glance. Perfect for HR reviews, team assessments, or quarterly check-ins. Fully editable in PowerPoint, Keynote, and Google Slides.


21 slides
Rakshasa Project Status Report Presentation
This detailed status report template helps track progress with clarity and precision. Featuring sections on financial summaries, operational updates, key achievements, and market trend analysis, it ensures seamless reporting and decision-making. Perfect for reviewing team productivity, challenges, and upcoming priorities, this template offers easy customization in PowerPoint, Keynote, or Google Slides.


6 slides
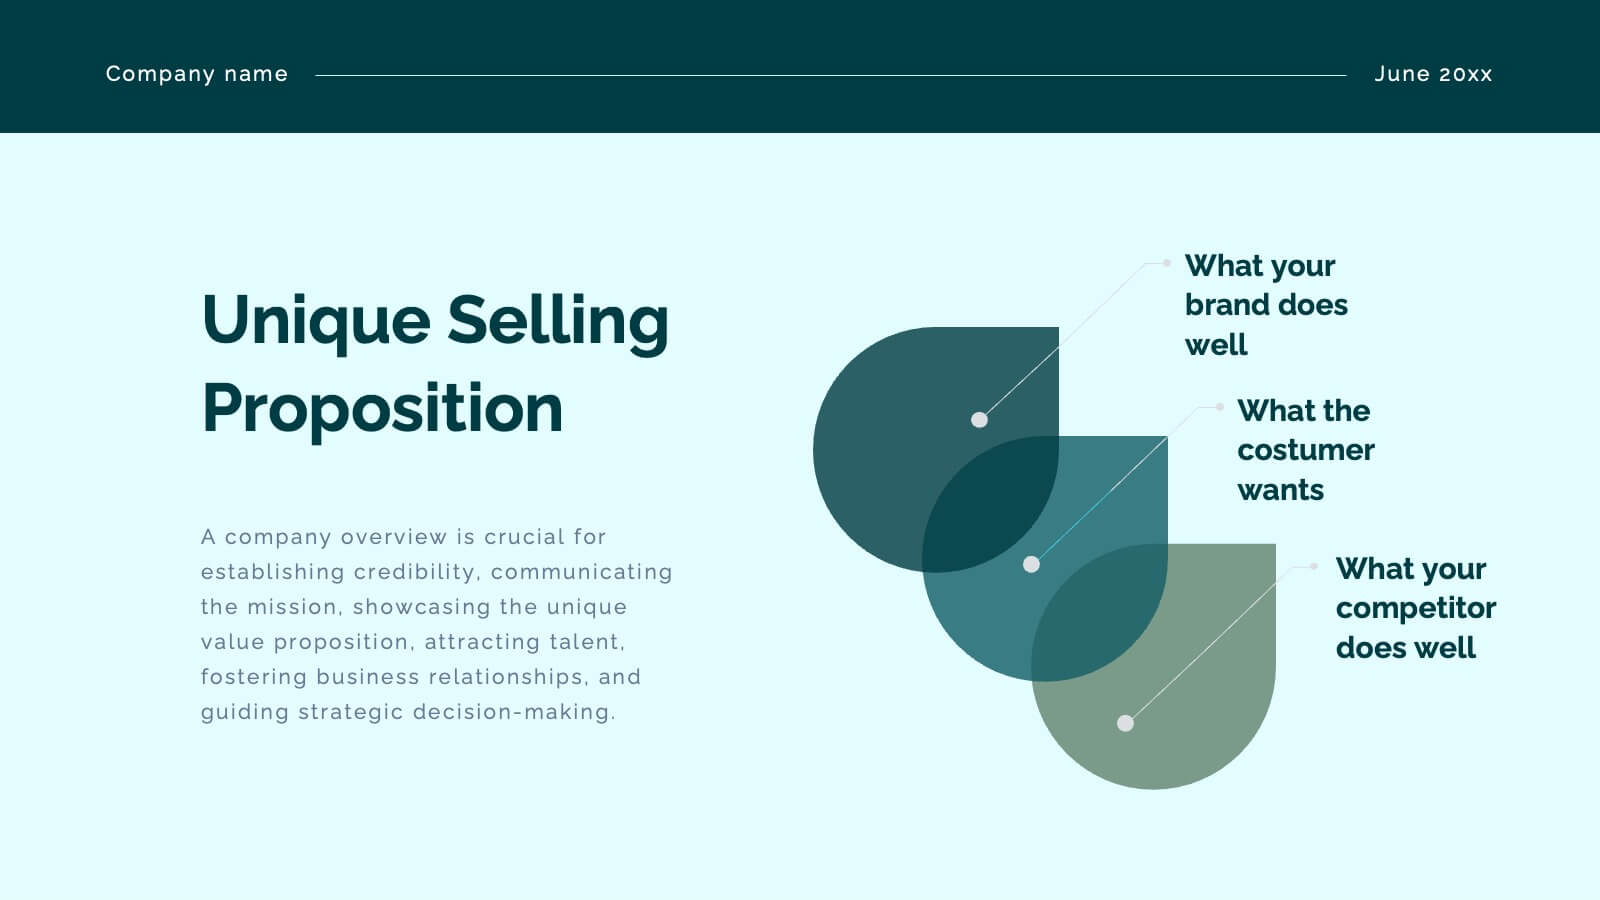
Venn Diagram
A Venn diagram is a visual representation of the relationships between different sets or groups. This infographic template consists of overlapping circles, each representing a specific set, and the overlapping parts indicates the elements that belong to multiple sets. Use this infographic to illustrate the relationships between different sets of data or concepts. The main components of the infographic are the circles or ellipses that represent the sets being compared. The size and position of the circles can be adjusted to reflect the data accurately. This infographic is fully customizable and compatible with Powerpoint, Keynote, and Google Slides.