


Features
- 6 Unique slides
- Fully editable and easy to edit in Microsoft Powerpoint, Keynote and Google Slides
- 16:9 widescreen layout
- Clean and professional designs
- Export to JPG, PDF or send by email


Do you have any questions?
Recommend


6 slides
Venn Diagram
A Venn diagram is a visual representation of the relationships between different sets or groups. This infographic template consists of overlapping circles, each representing a specific set, and the overlapping parts indicates the elements that belong to multiple sets. Use this infographic to illustrate the relationships between different sets of data or concepts. The main components of the infographic are the circles or ellipses that represent the sets being compared. The size and position of the circles can be adjusted to reflect the data accurately. This infographic is fully customizable and compatible with Powerpoint, Keynote, and Google Slides.


26 slides
Adlyn Presentation Template
Making low-calorie foods a part of your daily diet protect against the risk of heart disease, diabetes, and cancer. They make you feel full while reducing the daily calorie intake, which can help with weight loss. The Adlyn template is a concise, easy-to-use template that’s designed to help you inform your audience on the importance of low-calorie foods. This template is perfect for site builders, food bloggers, and writers looking to create informative content on food facts and healthy living. Using Adlyn you can add daily tips about nutrition and exercise along with a list of healthy foods.


5 slides
Managing Product Maturity and Decline
Effectively visualize each phase of a product’s lifecycle with this curve-style infographic—from introduction to decline. Ideal for business strategy, product development, or market lifecycle planning. Fully editable in PowerPoint, Keynote, or Google Slides for seamless customization.


6 slides
Best Pricing Tables Infographics
Maximize your product or service presentation with our Best Pricing Tables infographic template. This template is fully compatible with popular presentation software like PowerPoint, Keynote, and Google Slides, allowing you to easily customize it to showcase your pricing structures effectively. The Best Pricing Tables infographic template offers a visually appealing platform to display different pricing tiers, features, and benefits. Whether you're a business owner, marketer, or sales professional, this template provides a user-friendly canvas to create pricing tables that captivate your audience. Optimize your pricing strategy with this SEO-optimized Best Pricing Tables infographic template, thoughtfully designed for clarity and ease of use. Customize it to highlight competitive advantages, discounts, and special offers, helping you convert potential customers into loyal clients. Start crafting your personalized pricing tables today to boost your sales and revenue!


3 slides
Introduction to Cryptocurrency Presentation
Step into the future of finance with this sleek, modern template designed to explain digital currencies in a simple, engaging way. Perfect for educators, startups, and analysts, it transforms complex ideas into clear visuals. Fully compatible with PowerPoint, Keynote, and Google Slides for effortless editing and professional presentations.


5 slides
User Experience Customer Path Map
Visualize the full customer journey with the User Experience Customer Path Map Presentation. This engaging slide illustrates five key touchpoints in the user experience cycle using a connected flow design with bold icons and captions. Perfect for mapping onboarding steps, product interactions, or decision-making stages. Fully editable in PowerPoint, Keynote, and Google Slides.


6 slides
5-Stage Sales Funnel Presentation
Visualize your sales process effortlessly with this 5-Stage Sales Funnel template. Ideal for showcasing lead conversion, customer journey, and sales strategies, this design is fully customizable. Adjust colors, text, and icons to fit your needs. Compatible with PowerPoint, Keynote, and Google Slides for seamless integration into your presentations.


5 slides
Creative Alphabet Display Template
Make your message memorable with the Creative Alphabet Display Template Presentation. This slide uses bold, interlocking letter shapes to showcase four key ideas in a linear, eye-catching format—perfect for step-by-step processes, value breakdowns, or themed concepts. Fully editable in PowerPoint, Keynote, and Google Slides.

21 slides
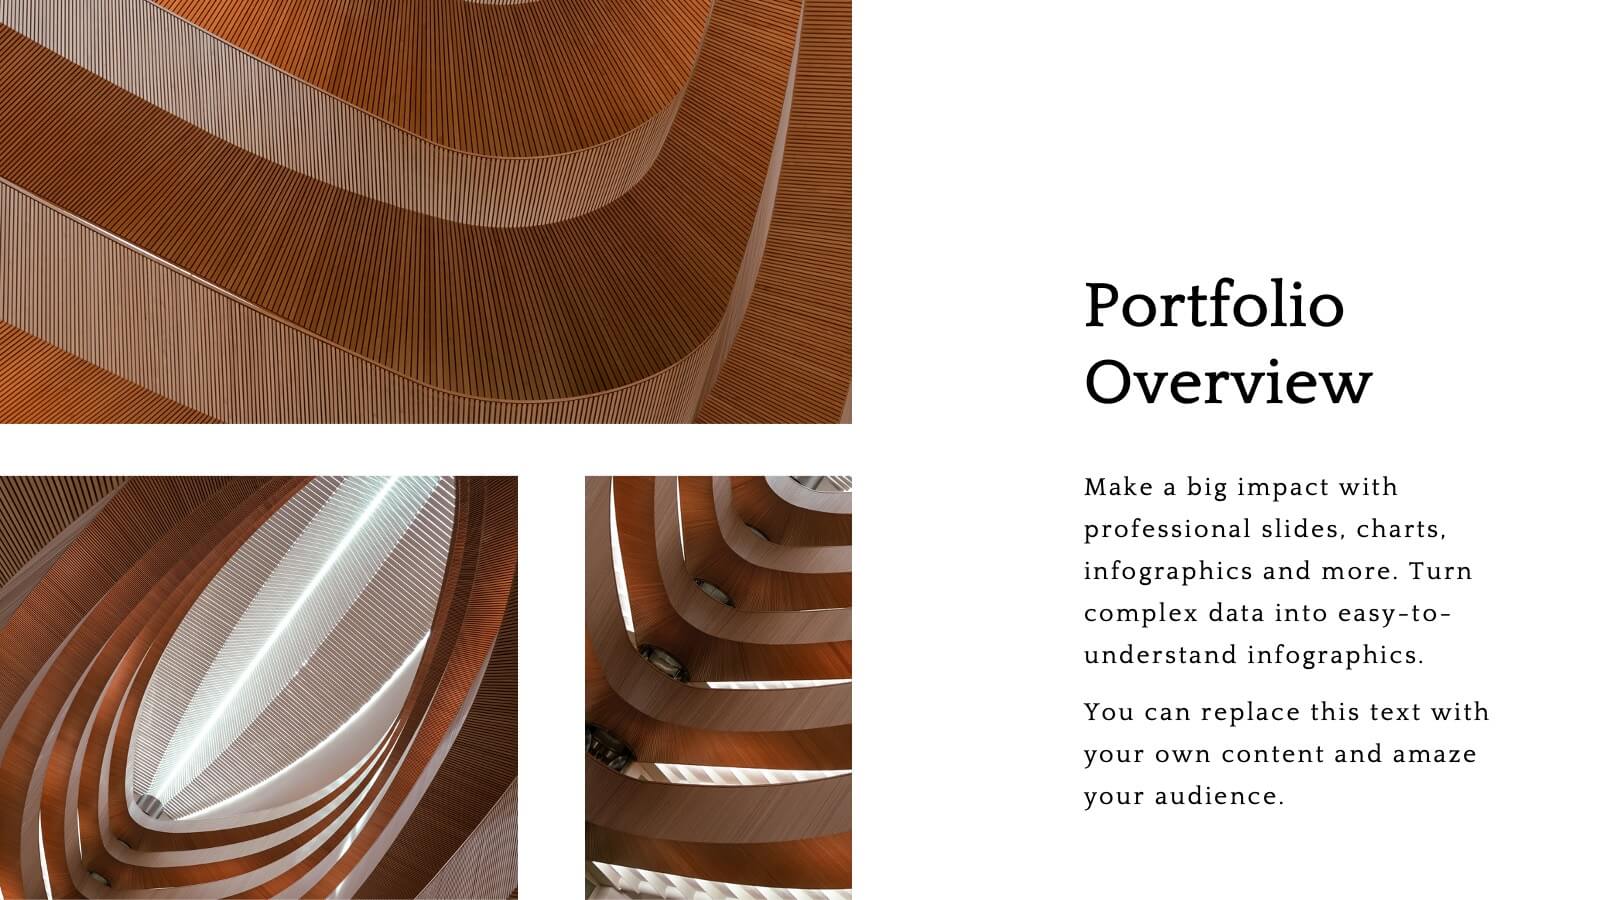
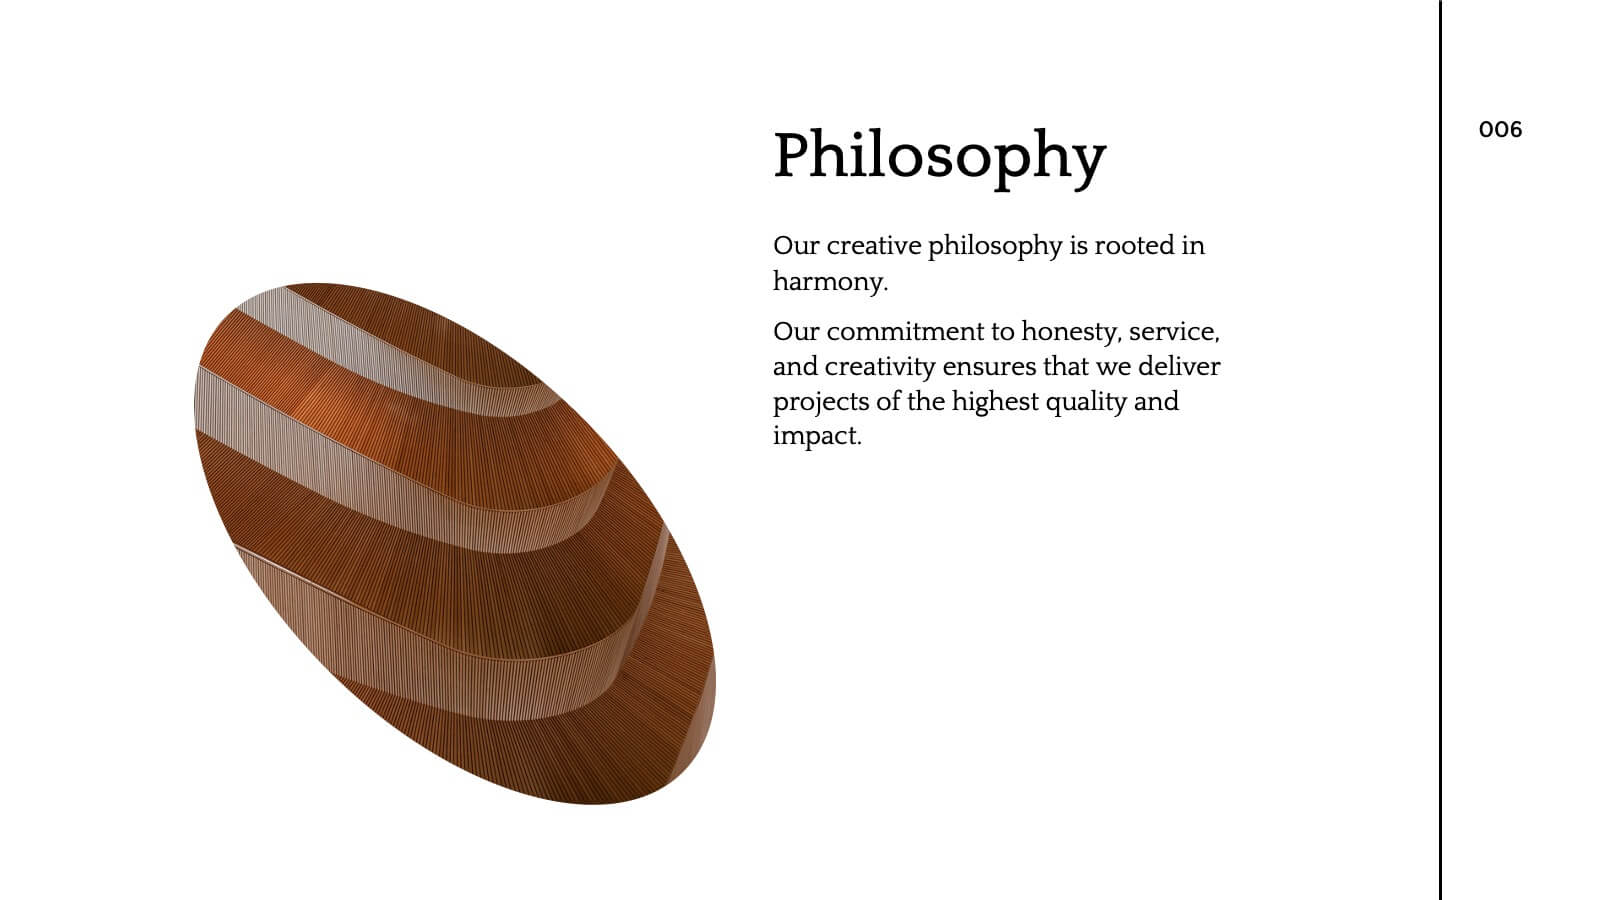
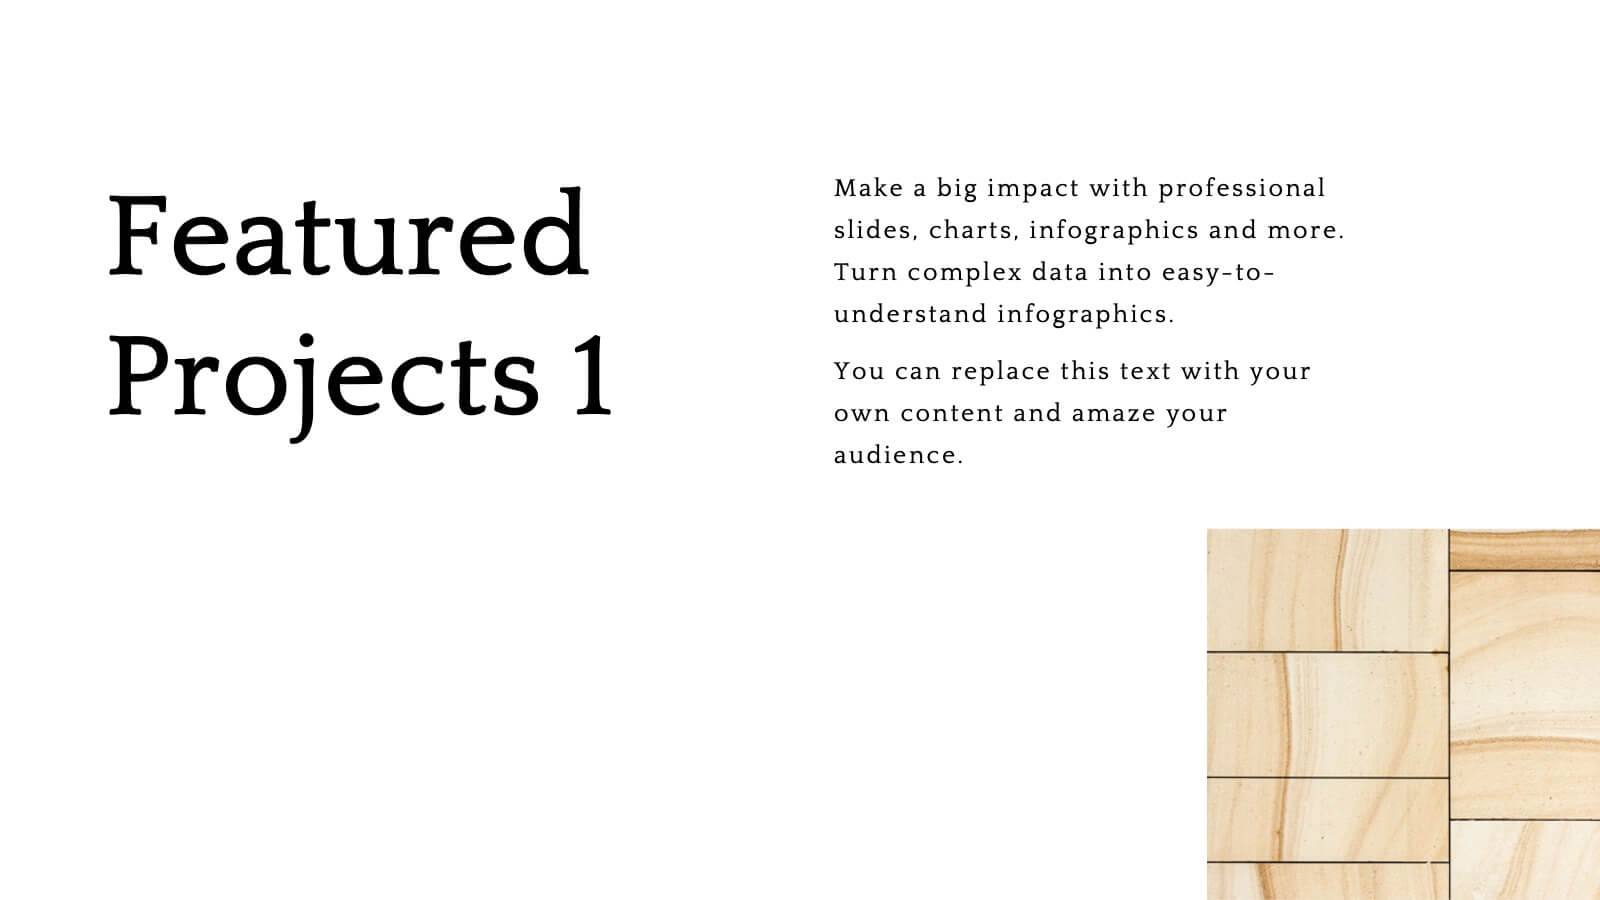
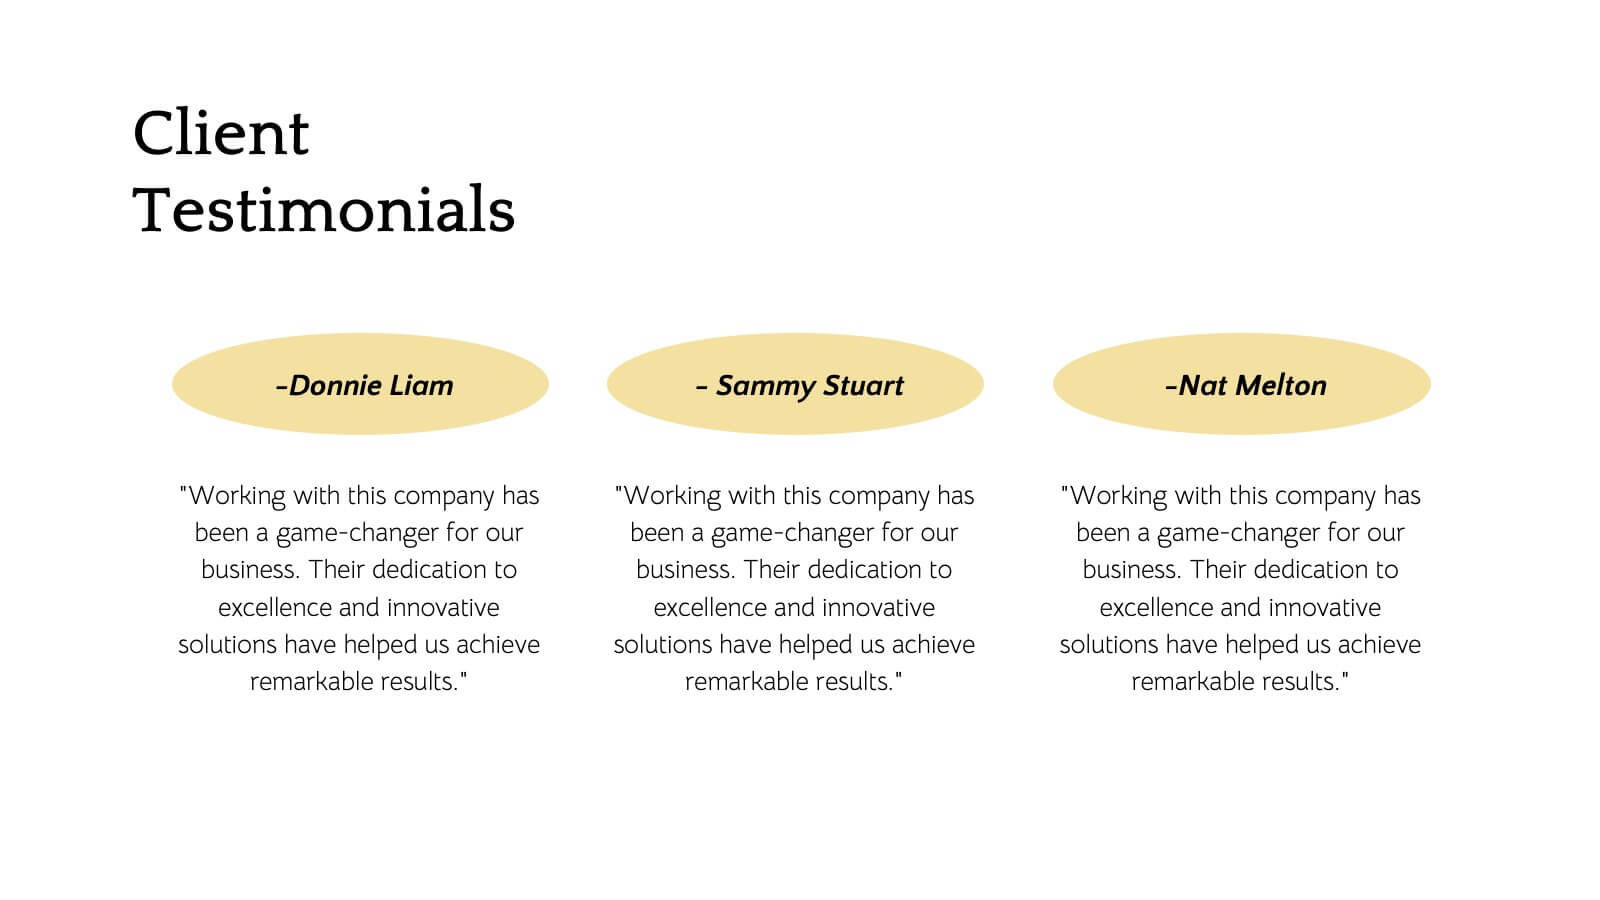
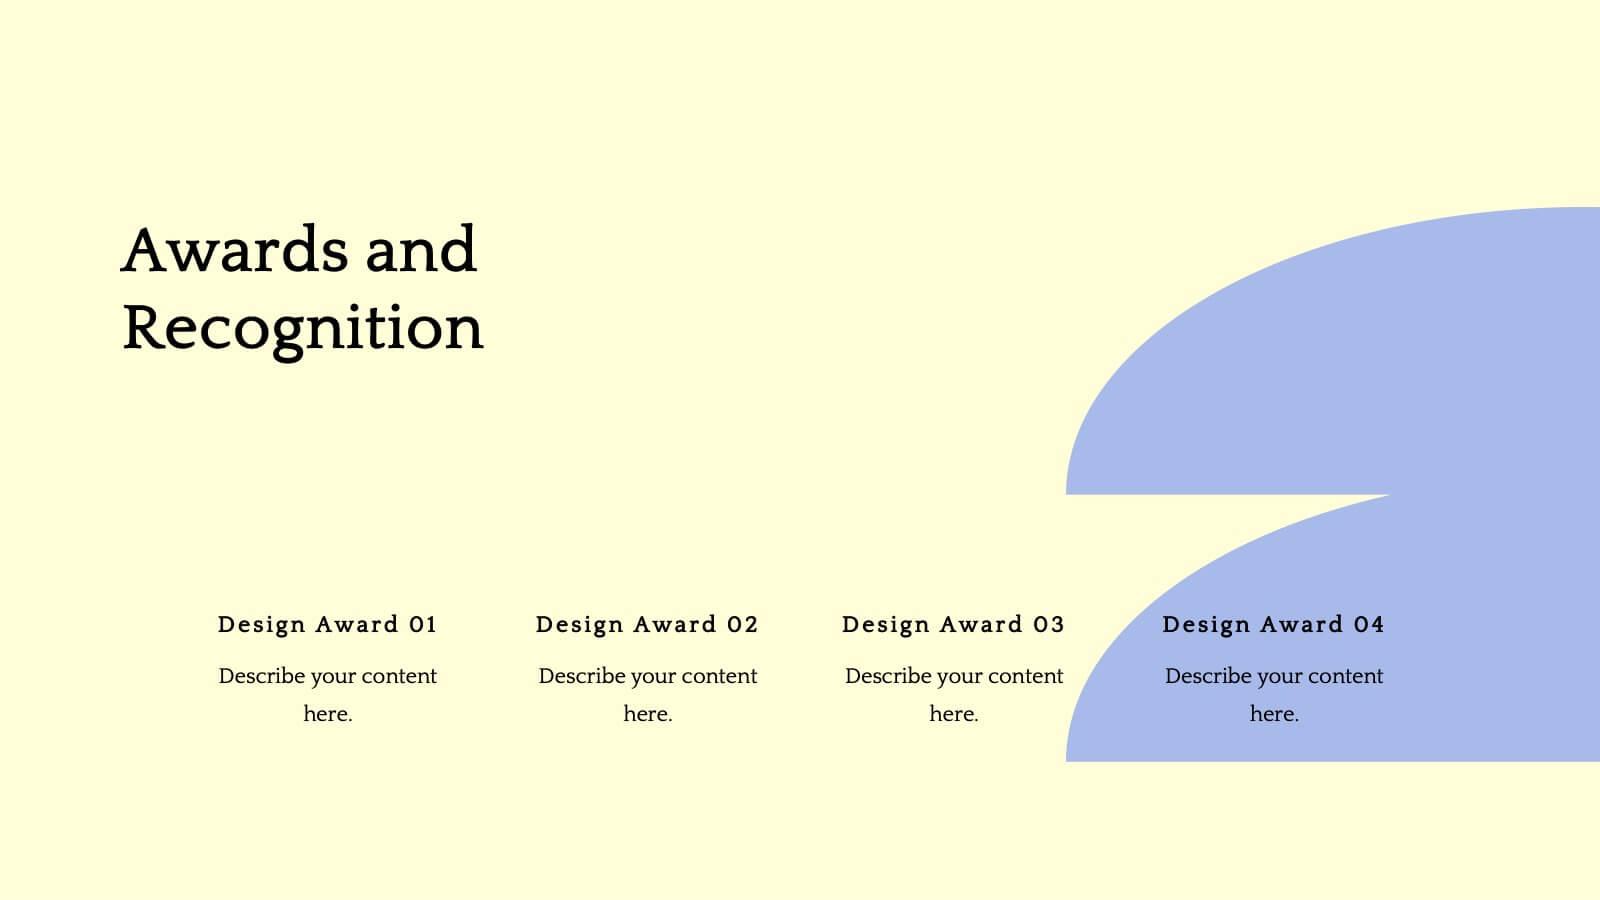
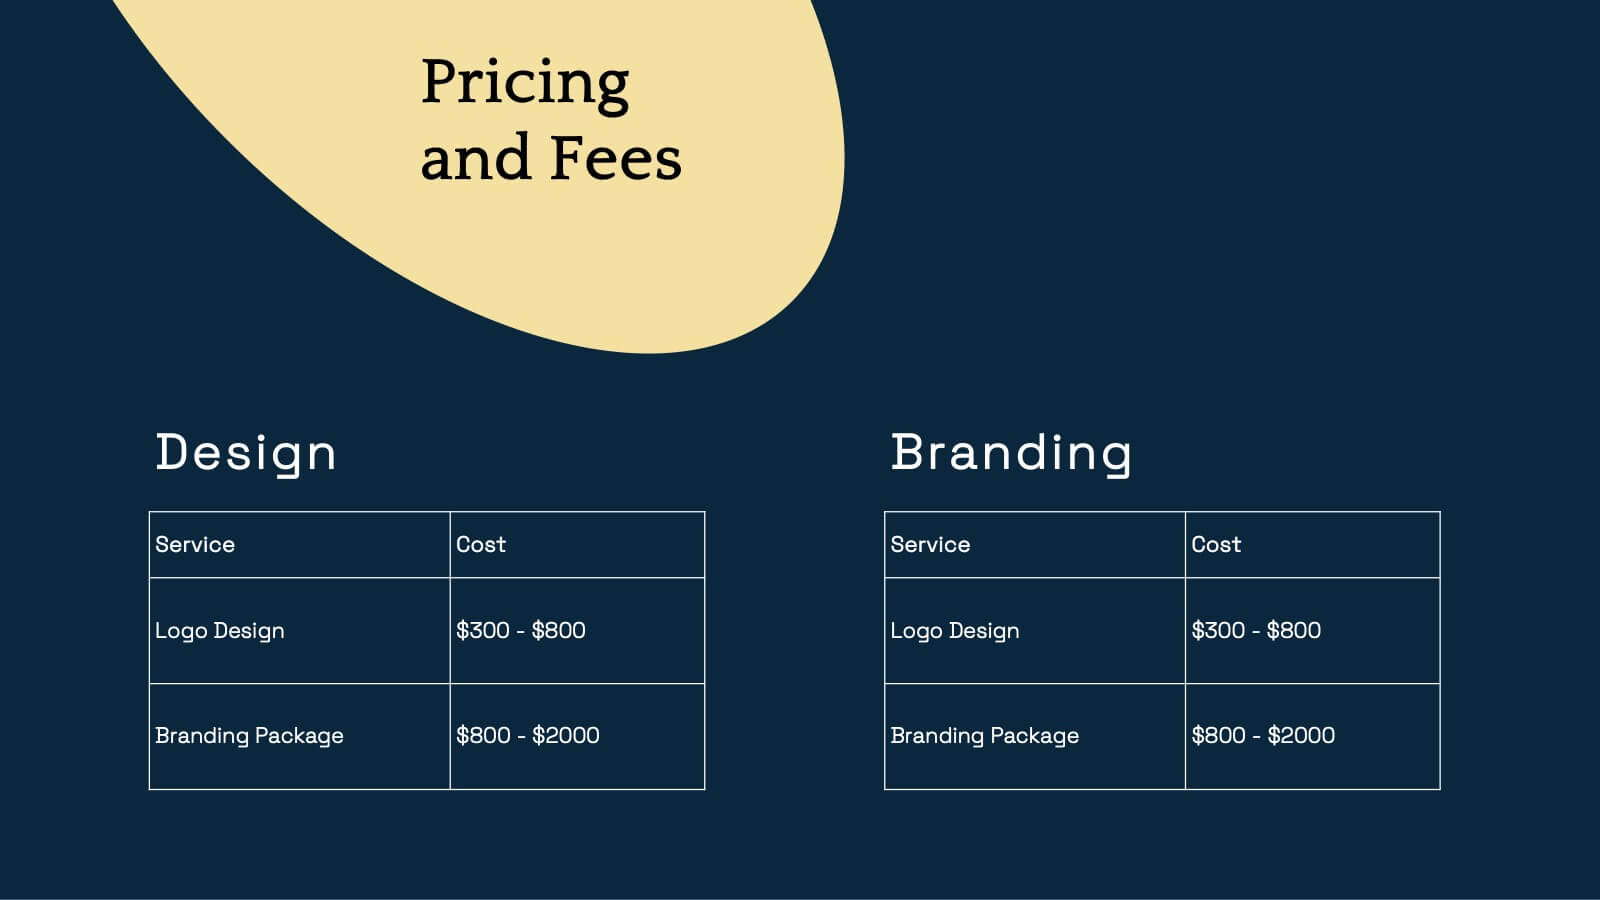
Flare Creative Portfolio Presentation
Showcase your creative work with this elegant portfolio template! Perfect for highlighting projects, client testimonials, and services offered. Ideal for artists, designers, and creatives aiming to impress clients and collaborators. Compatible with PowerPoint, Keynote, and Google Slides, this template ensures your portfolio is clear, professional, and visually stunning. Make your work shine!


20 slides
Visionix Project Management Plan Presentation
Streamline your project planning with this clean and modern presentation template. Covering key aspects such as objectives, timeline, budget breakdown, and risk management, it helps you organize and communicate your project strategy effectively. Ideal for business teams and project managers. Compatible with PowerPoint, Keynote, and Google Slides for easy customization.


26 slides
Protecting Your Digital Assets with Cybersecurity Presentation Template
Safeguard your digital world with this sleek and professional presentation on protecting your digital assets with cybersecurity! This template is designed to simplify complex concepts while showcasing the importance of online safety, data protection, and risk management. Featuring modern layouts, detailed infographics, and customizable charts, it’s ideal for exploring cybersecurity strategies, emerging threats, or best practices for organizations and individuals. The polished design, complete with high-tech visuals and a calming color palette, ensures your audience stays engaged while absorbing critical information. Perfect for IT professionals, educators, or businesses, this template is fully compatible with PowerPoint, Keynote, and Google Slides, making it an essential tool for impactful presentations.


6 slides
Dynamic Chart Visual Toolkit Presentation
Visualize data at a glance with the Dynamic Chart Visual Toolkit Presentation. This modern slide set combines revenue boxes, line trends, and circular progress charts to showcase performance metrics or KPIs effectively. Clean, minimal, and fully editable in Canva, PowerPoint, Keynote, or Google Slides—perfect for reports, dashboards, and marketing updates.


5 slides
Six Sigma DMAIC Process Flow Presentation
Streamline your process improvement with this Six Sigma DMAIC Flow template. Visually organize each stage—Define, Measure, Analyze, Improve, Control—using clean, professional layouts. Perfect for Lean Six Sigma projects, quality control, and operational excellence. Fully customizable in PowerPoint, Keynote, and Google Slides for versatile team presentations and process reviews.


4 slides
Problem-Solving Solution Framework Presentation
Streamline your approach to challenges with the Problem-Solving Solution Framework template, which visualizes complex solutions through an intuitive and clear design. It assists in entering business insights or key data in four structured sections, ensuring clarity and relevance. Ideal for strategic presentations, this template supports effective problem-solving narratives. Compatible with PowerPoint, Keynote, and Google Slides, it enhances presentation efficiency and impact.

20 slides
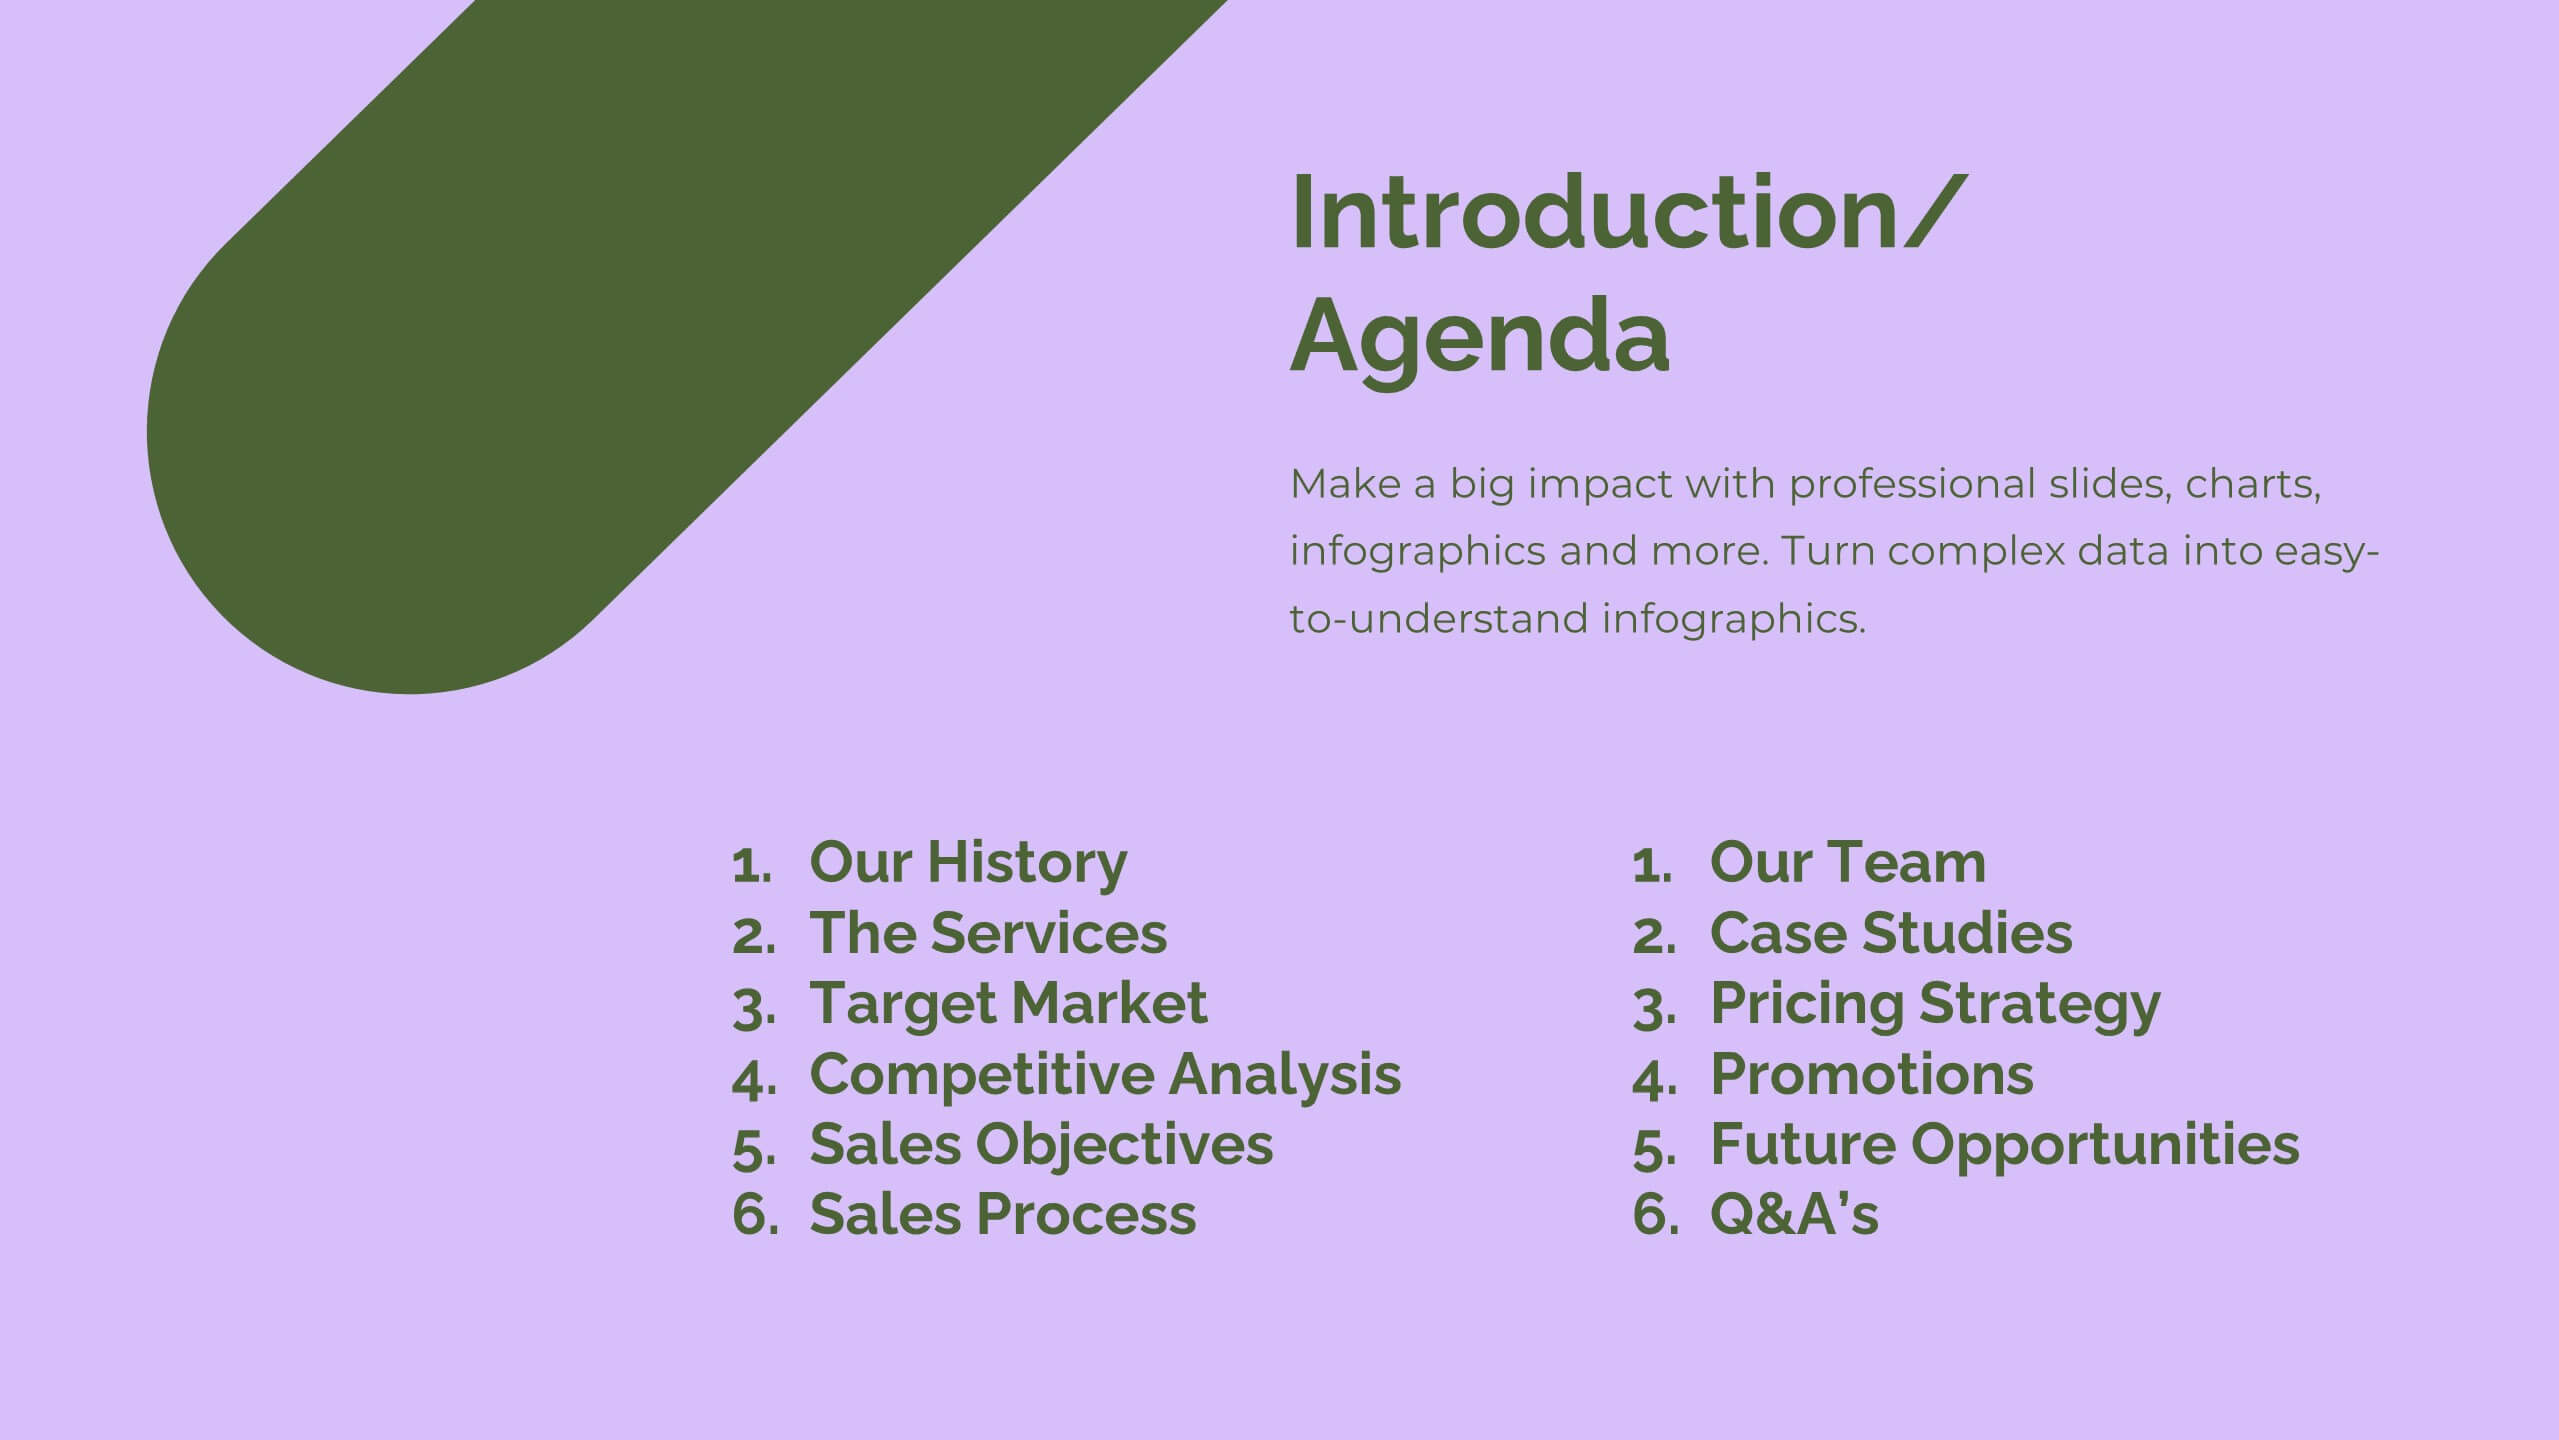
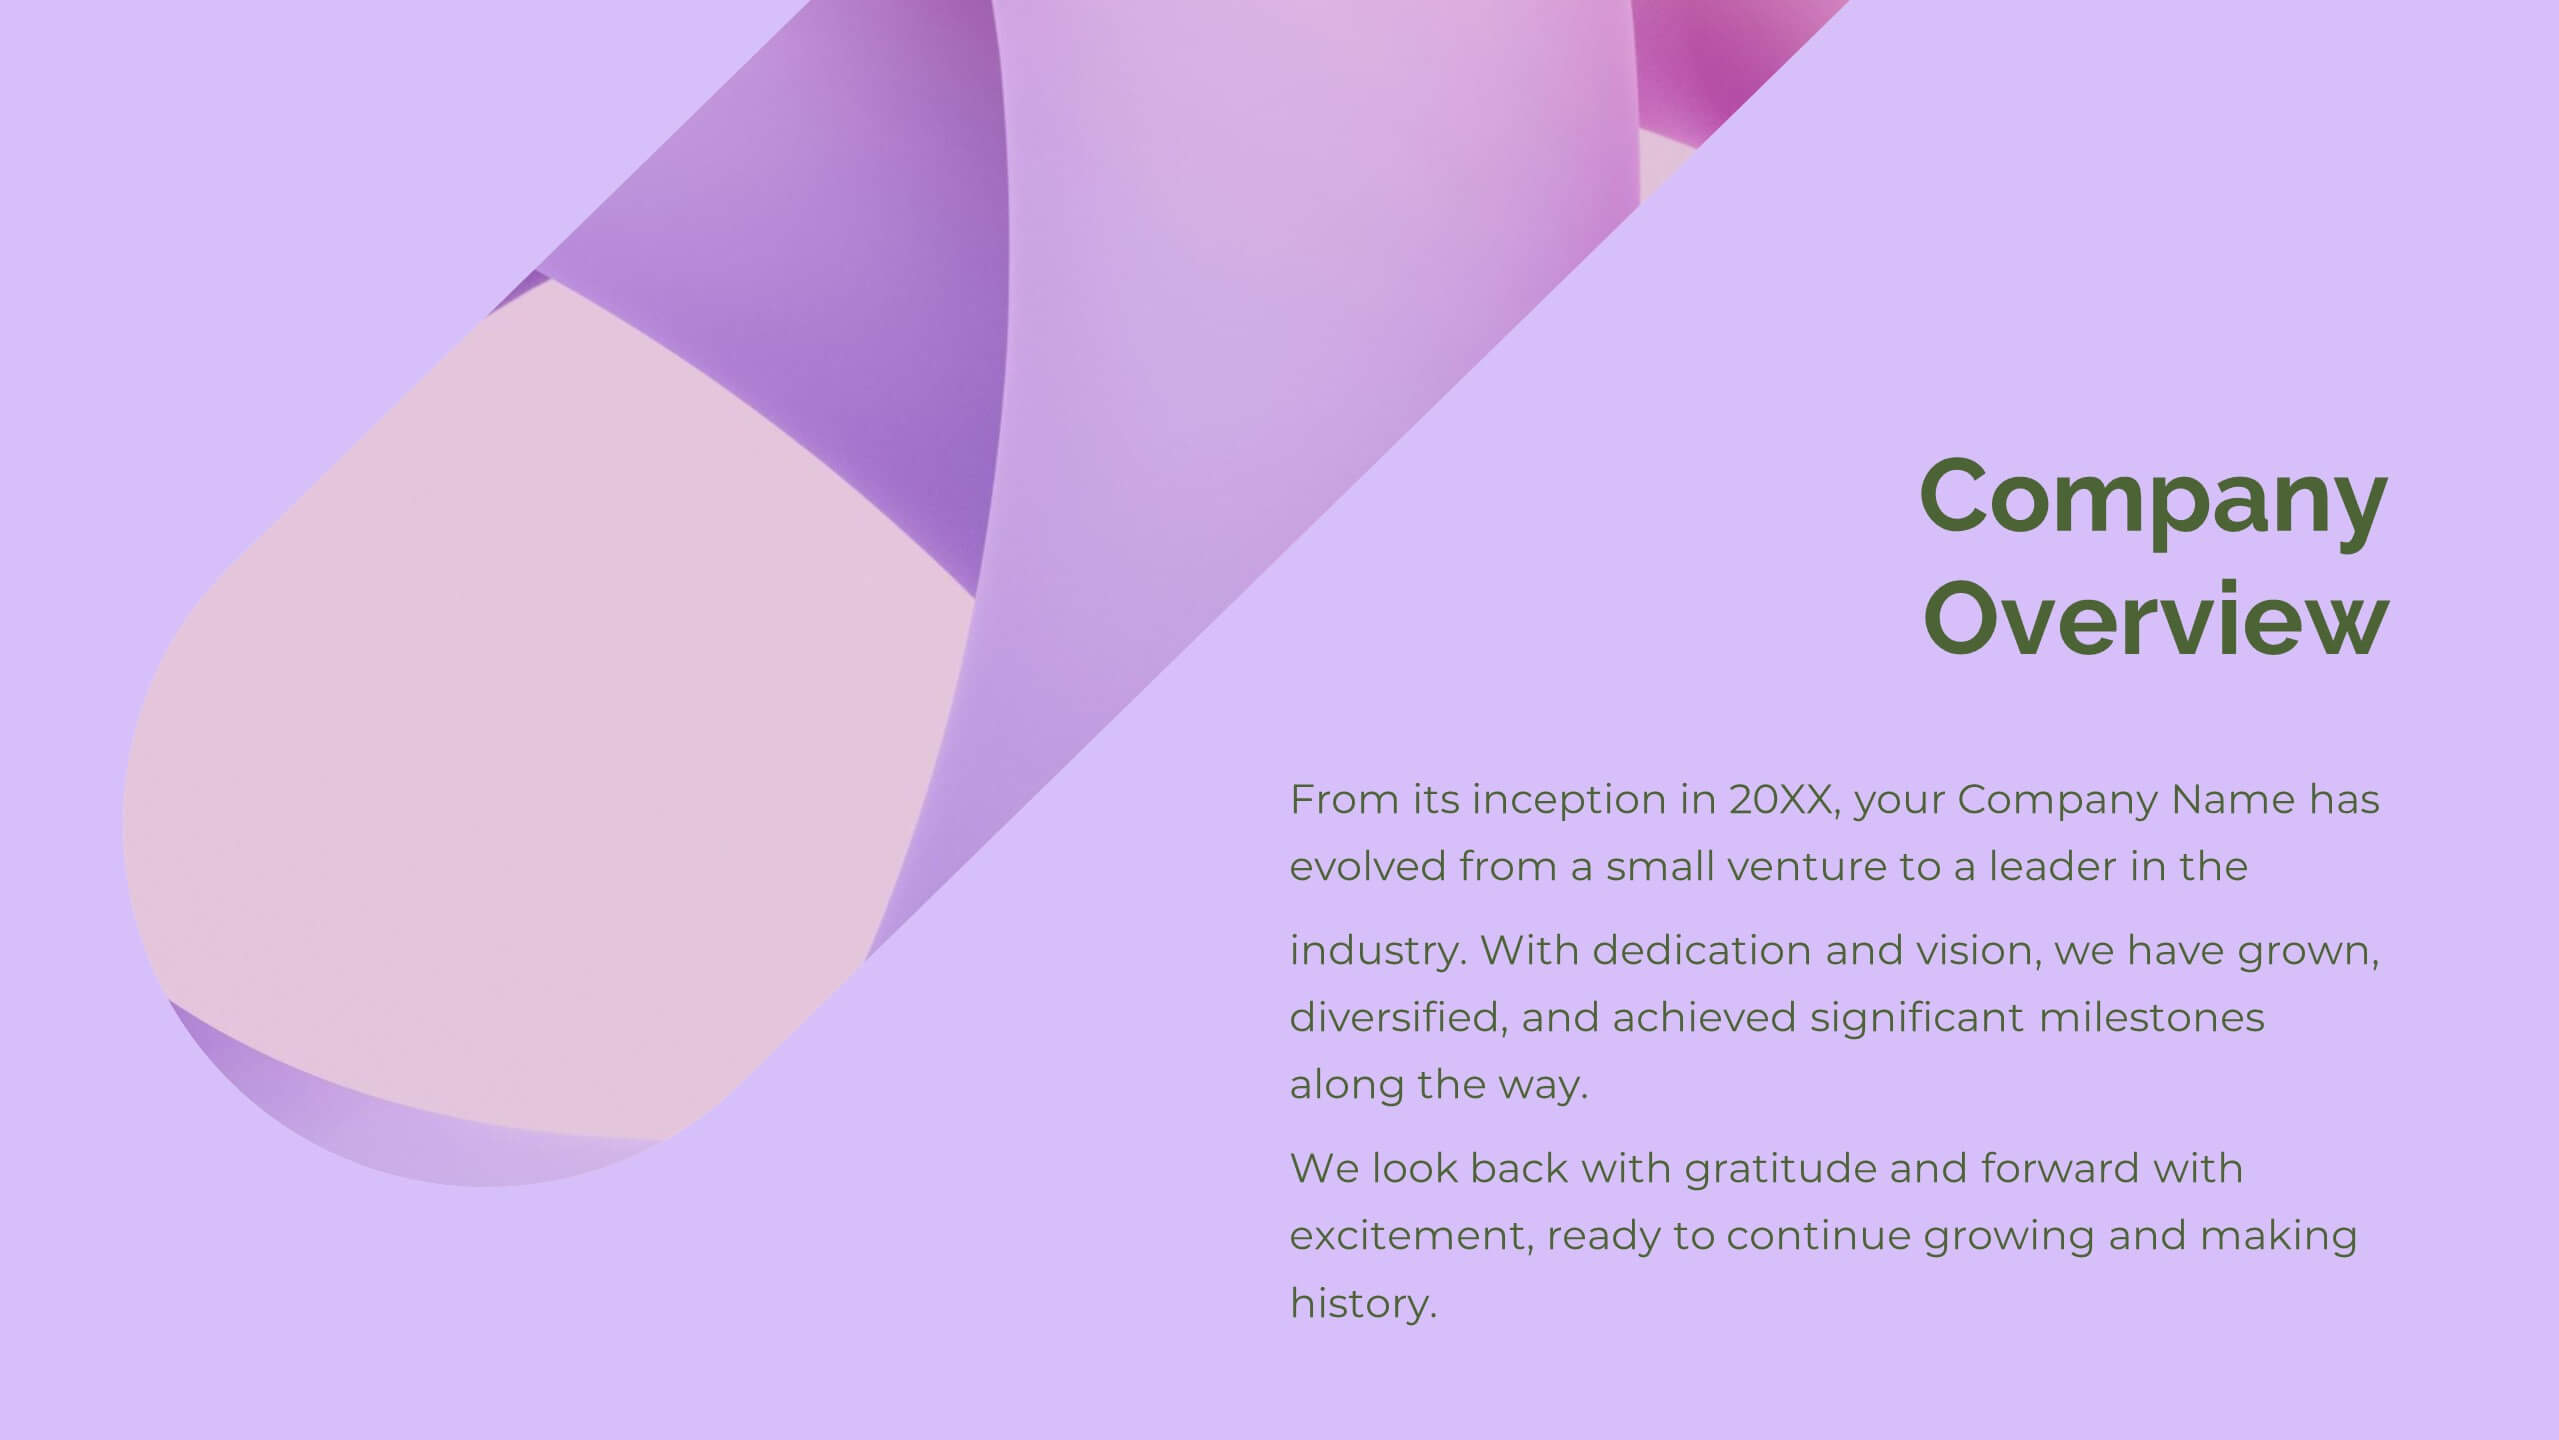
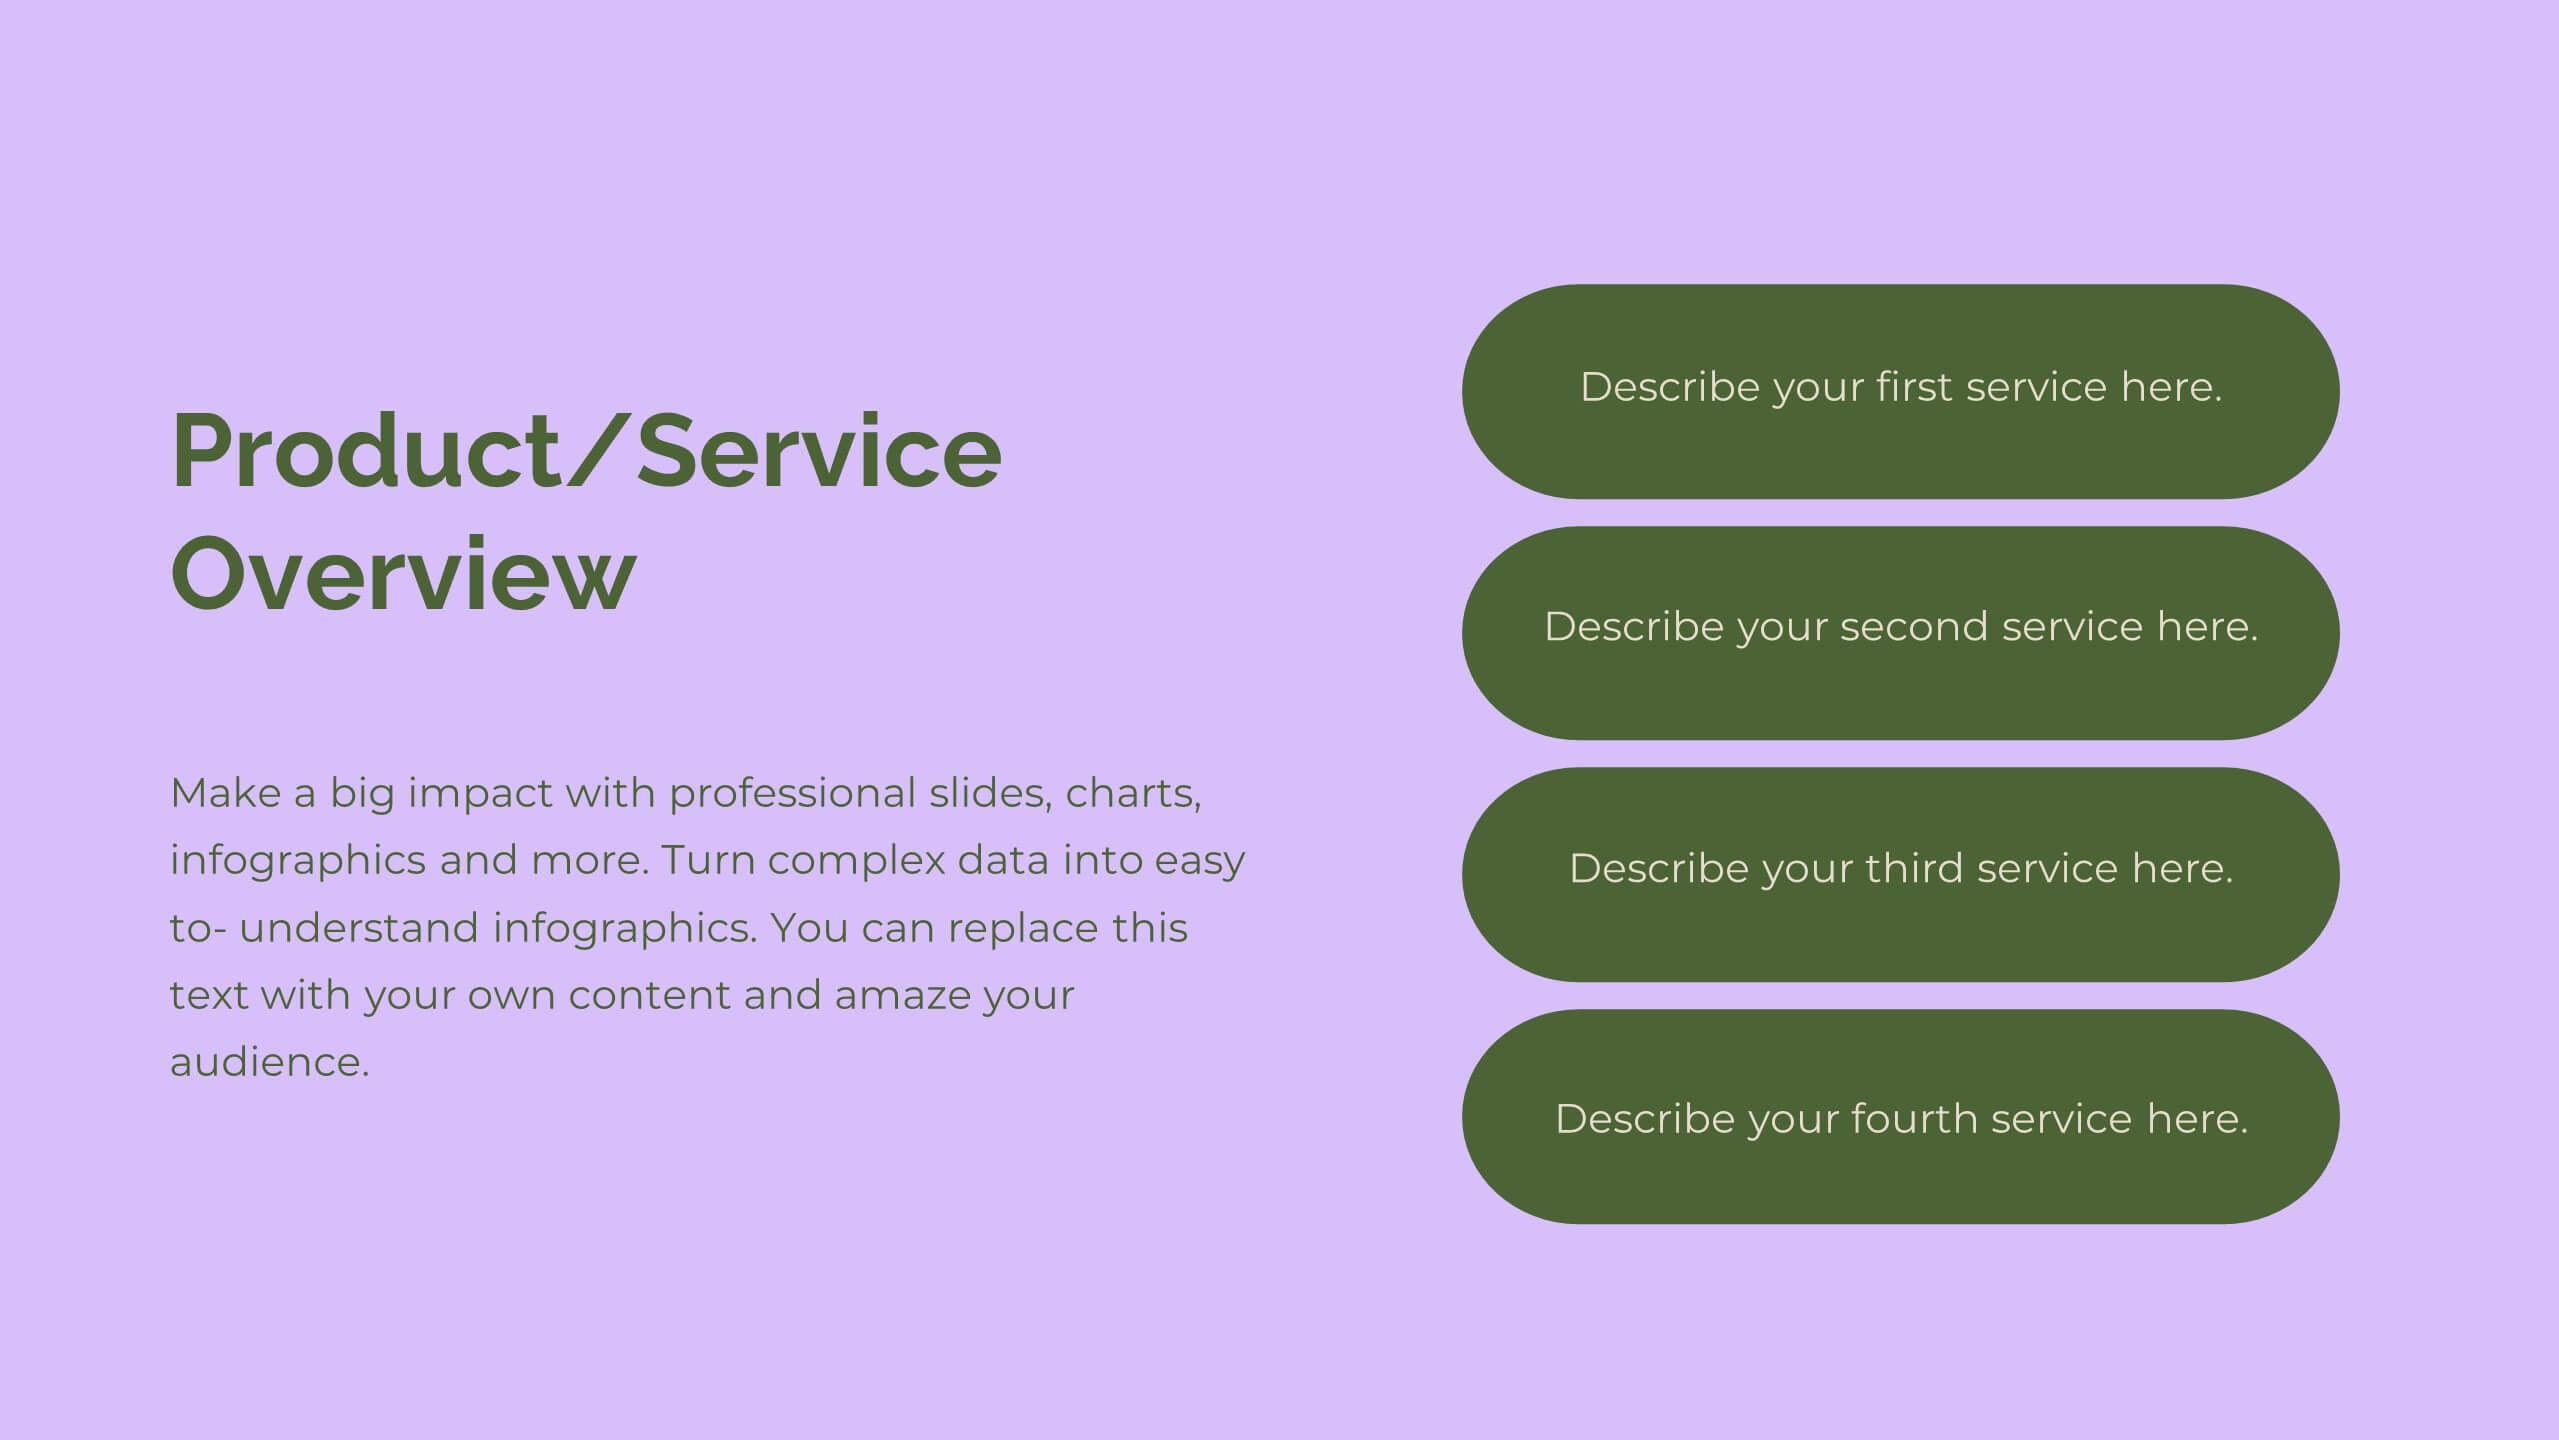
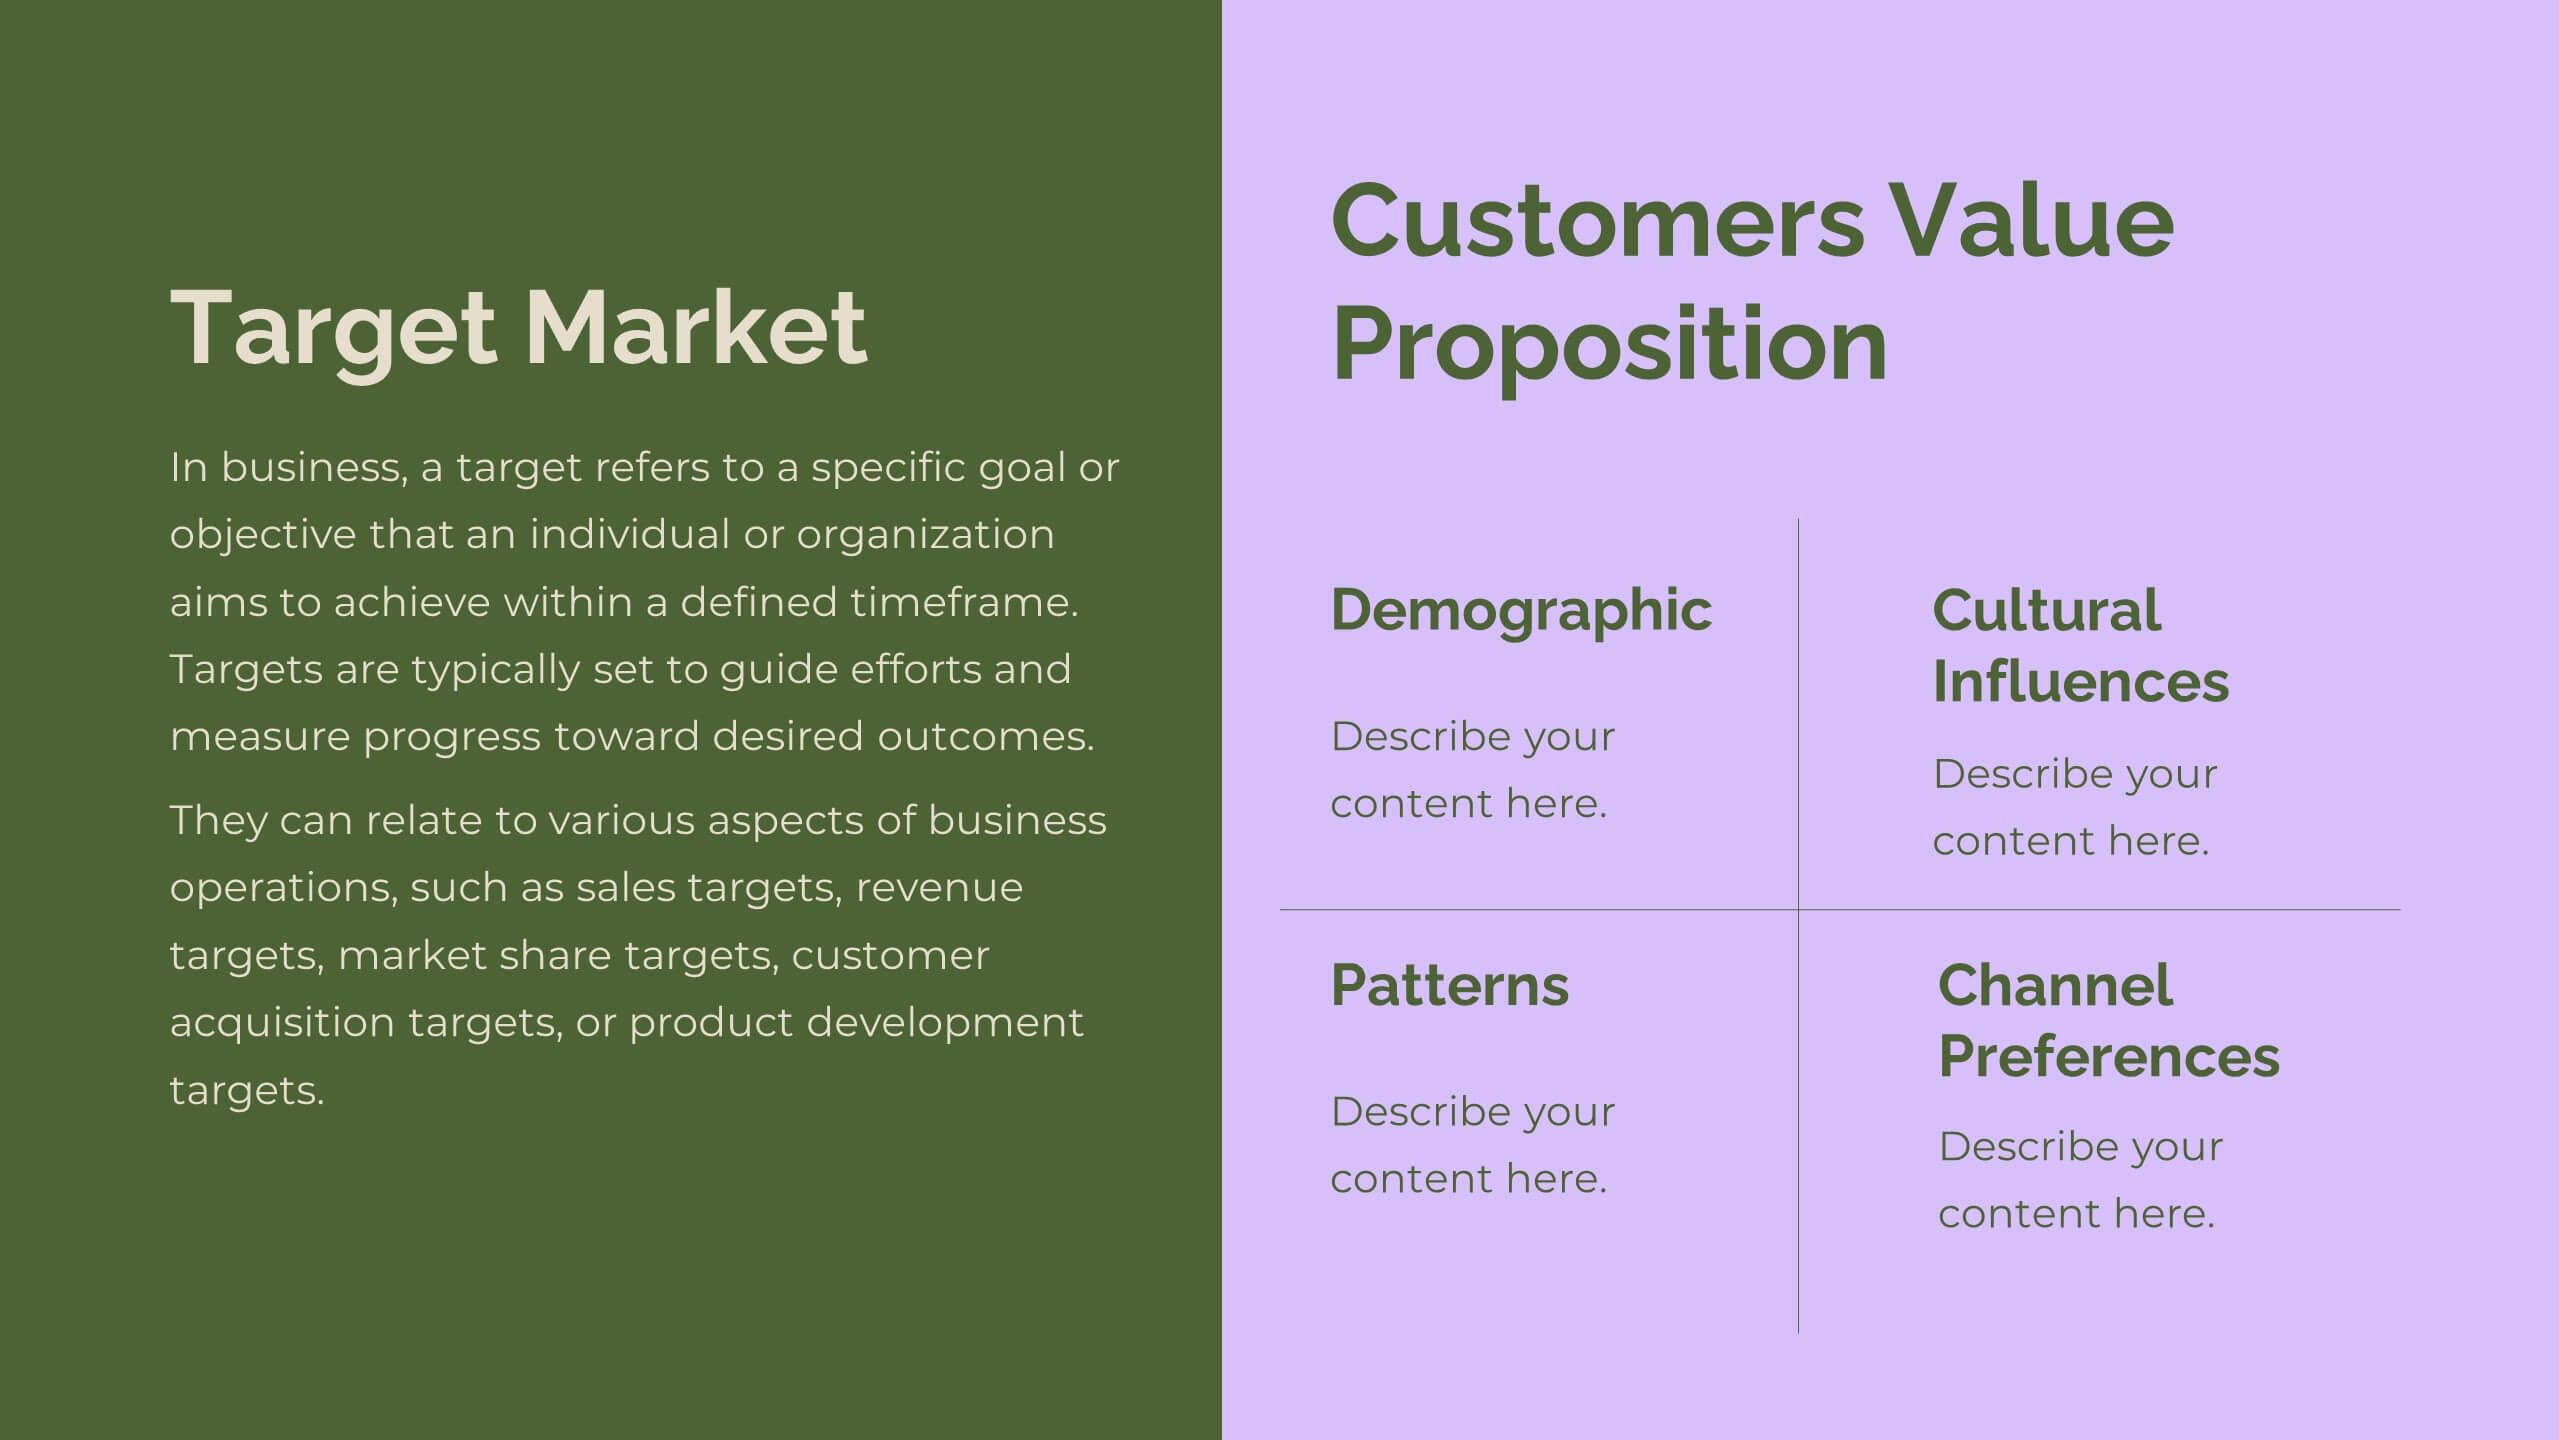
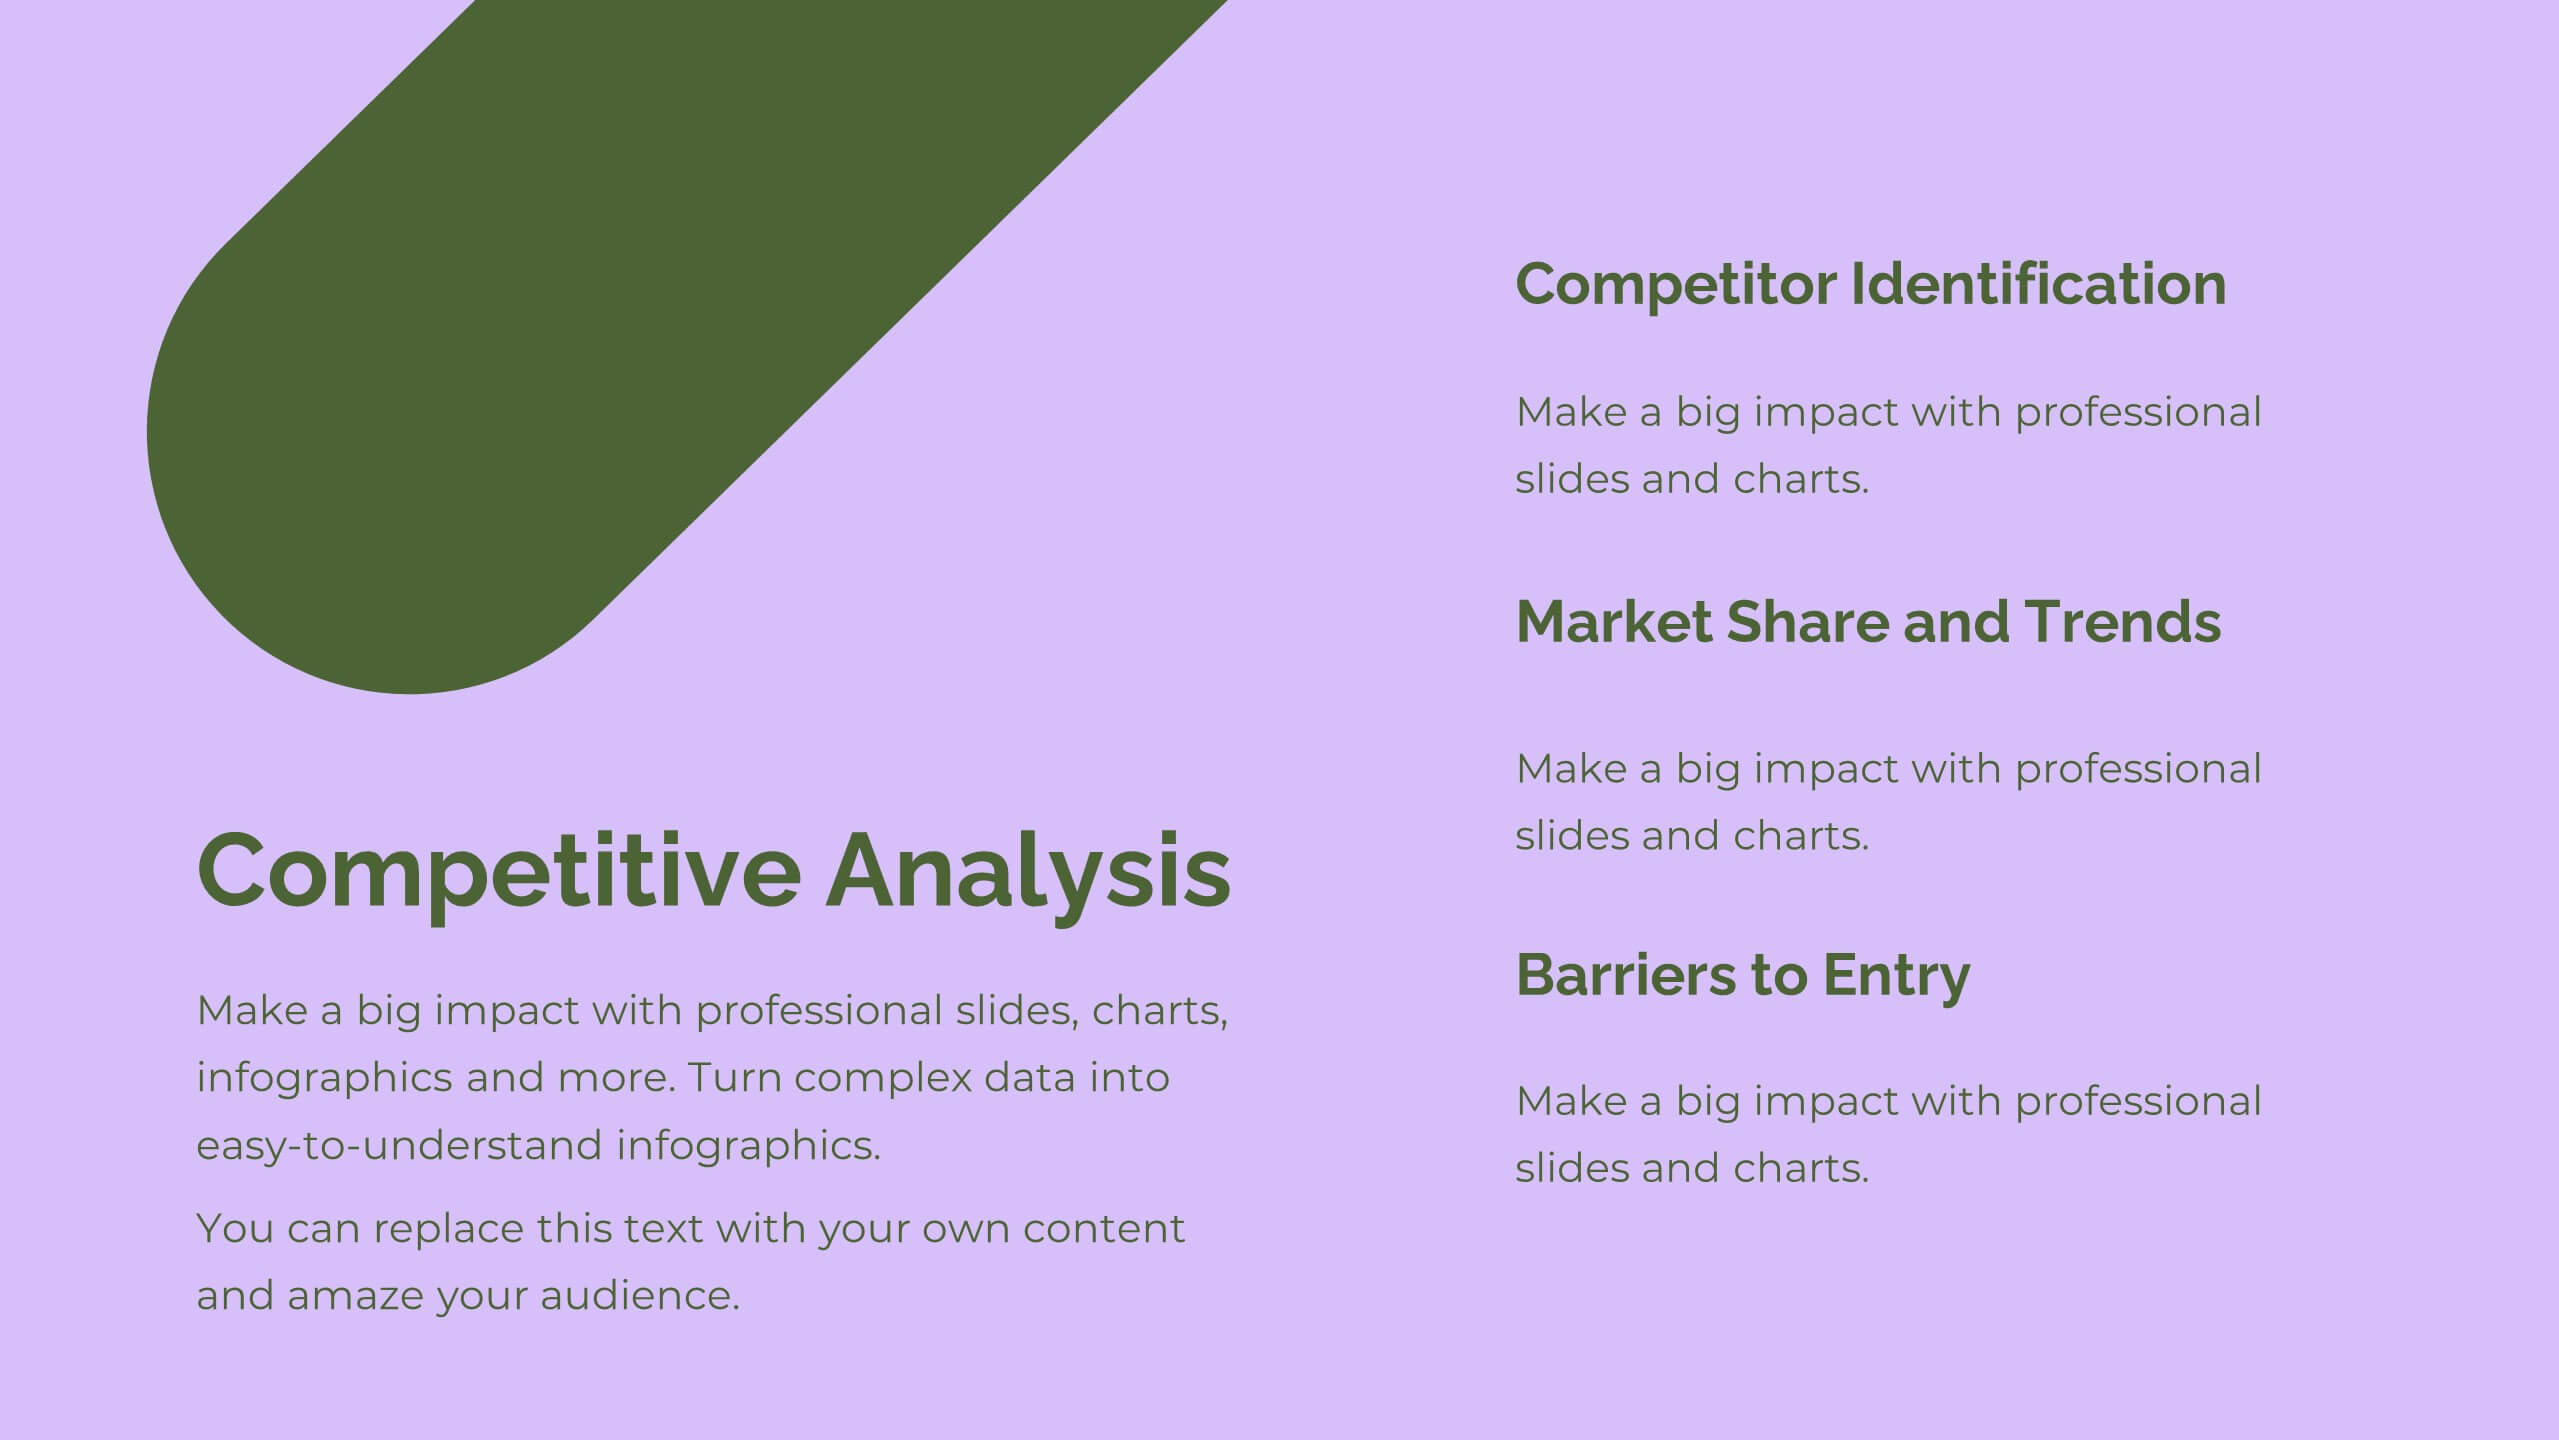
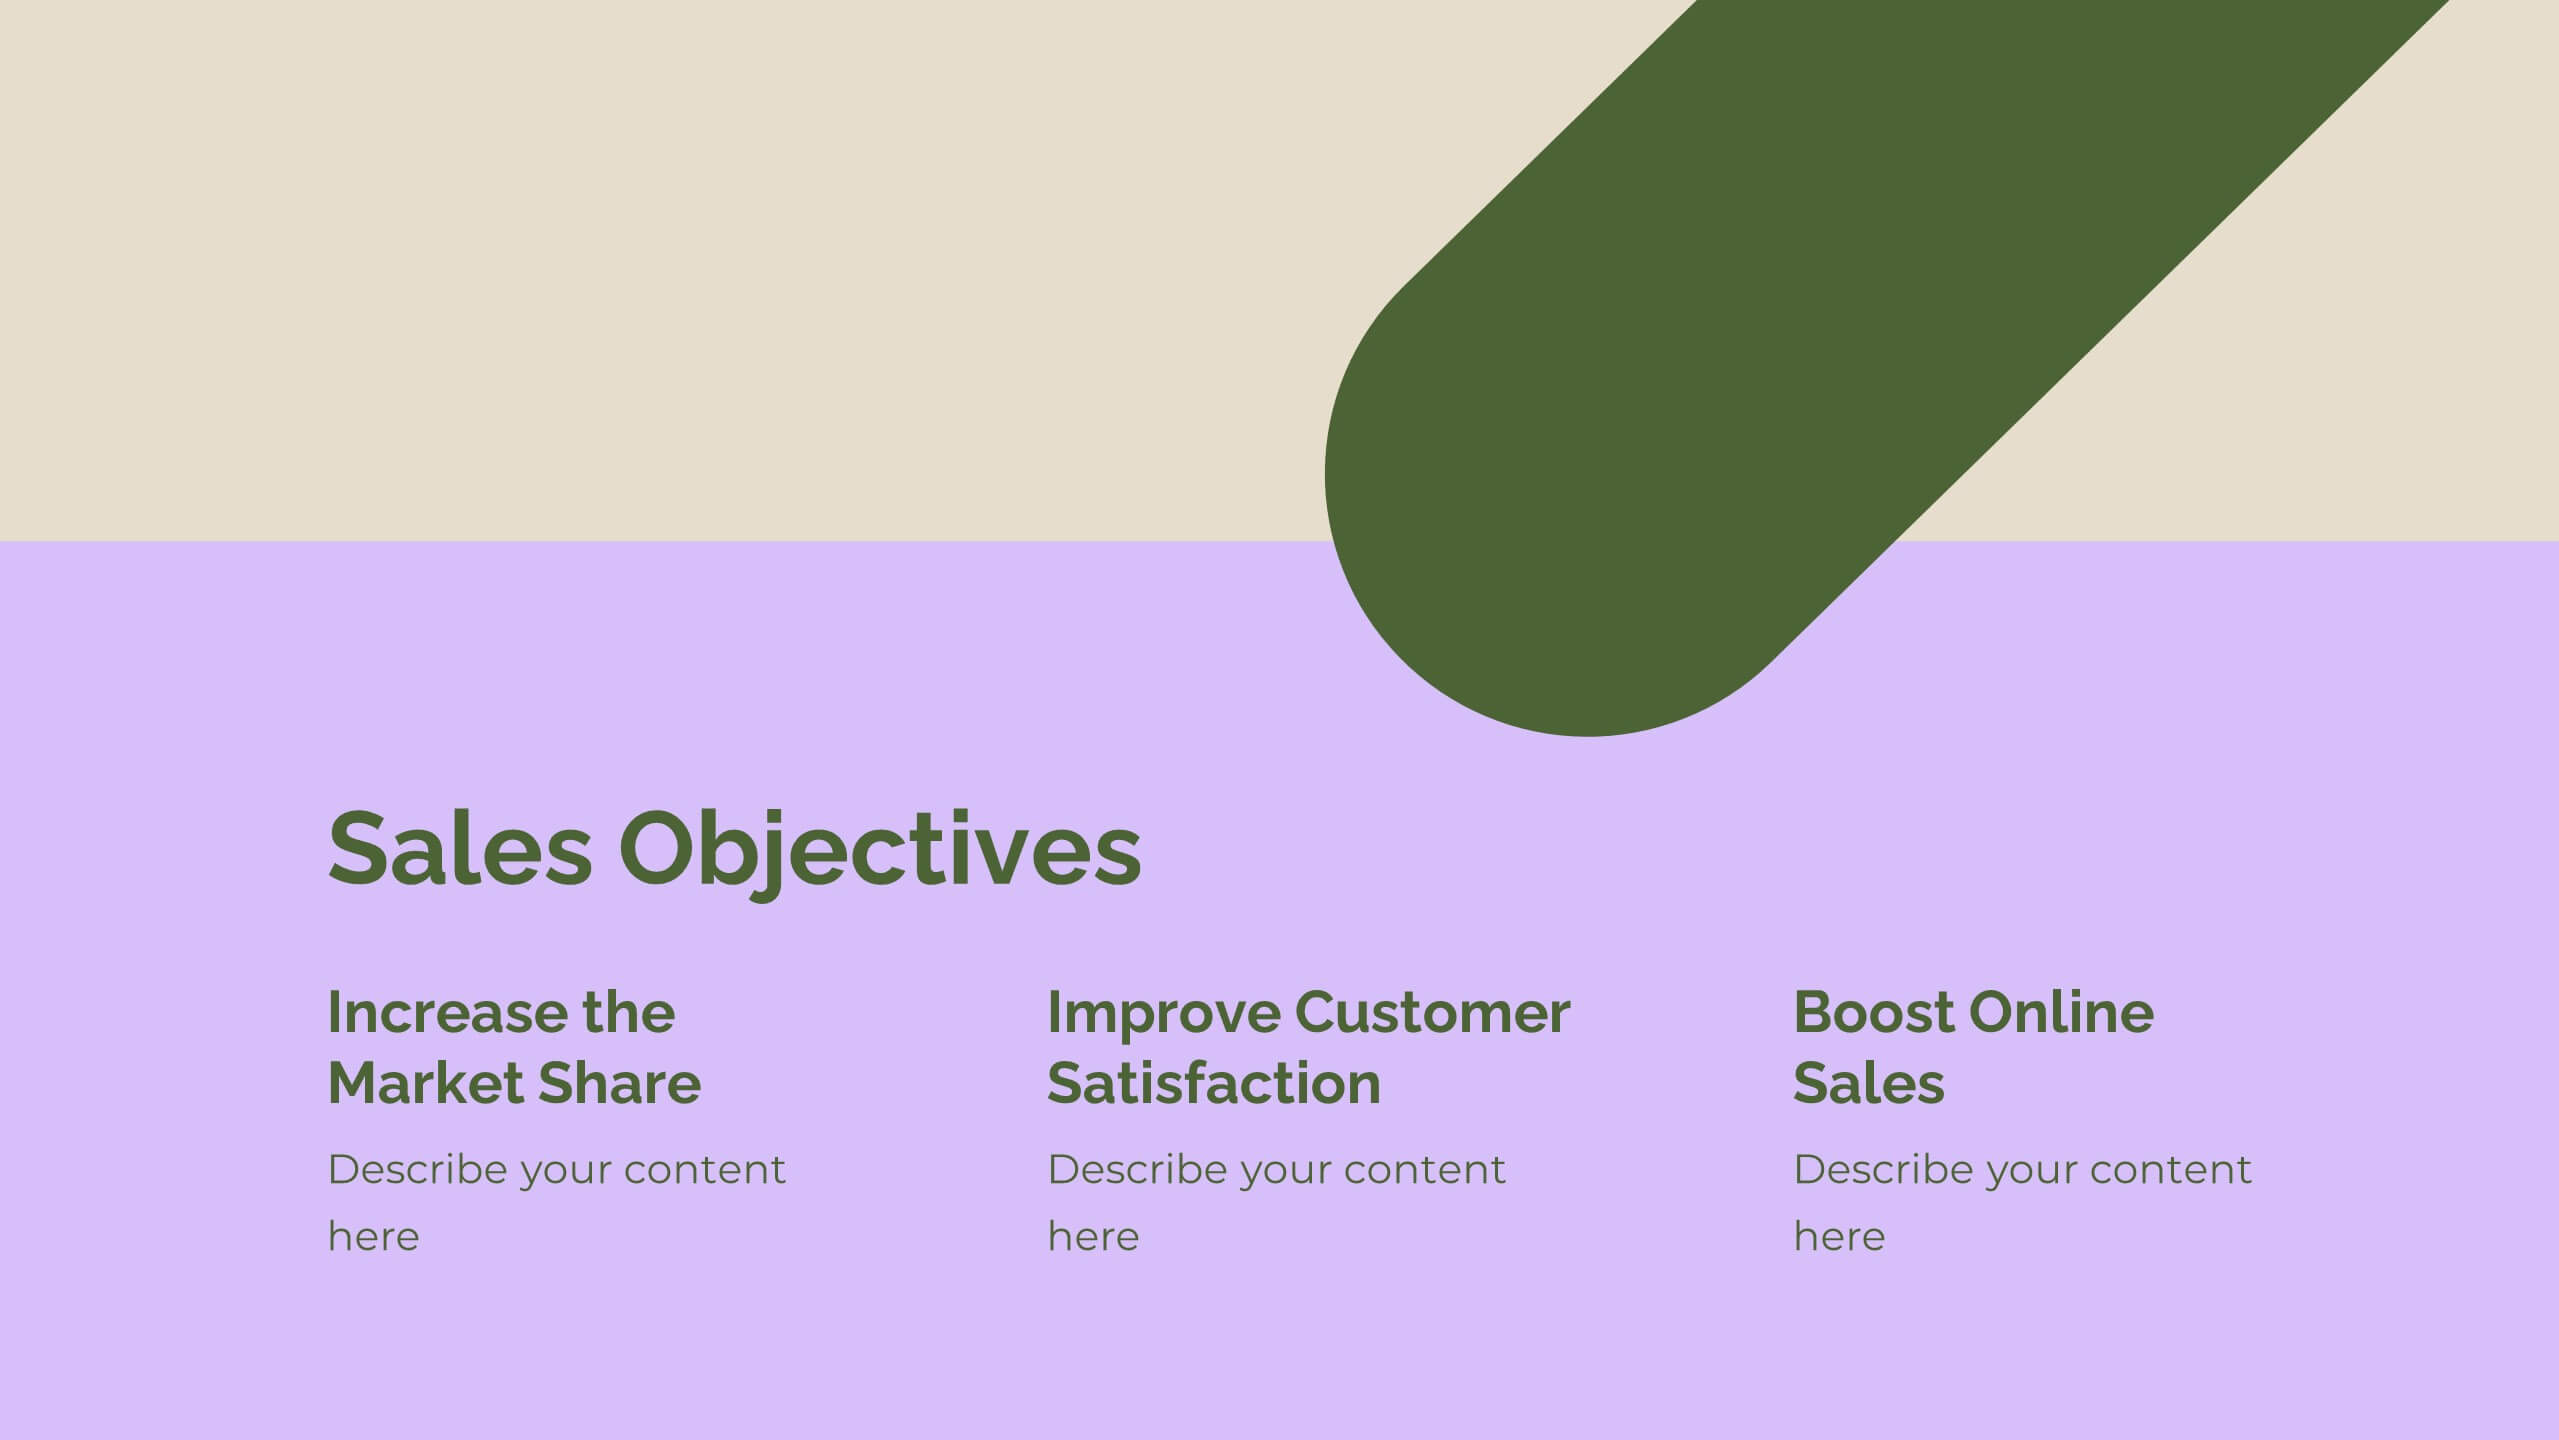
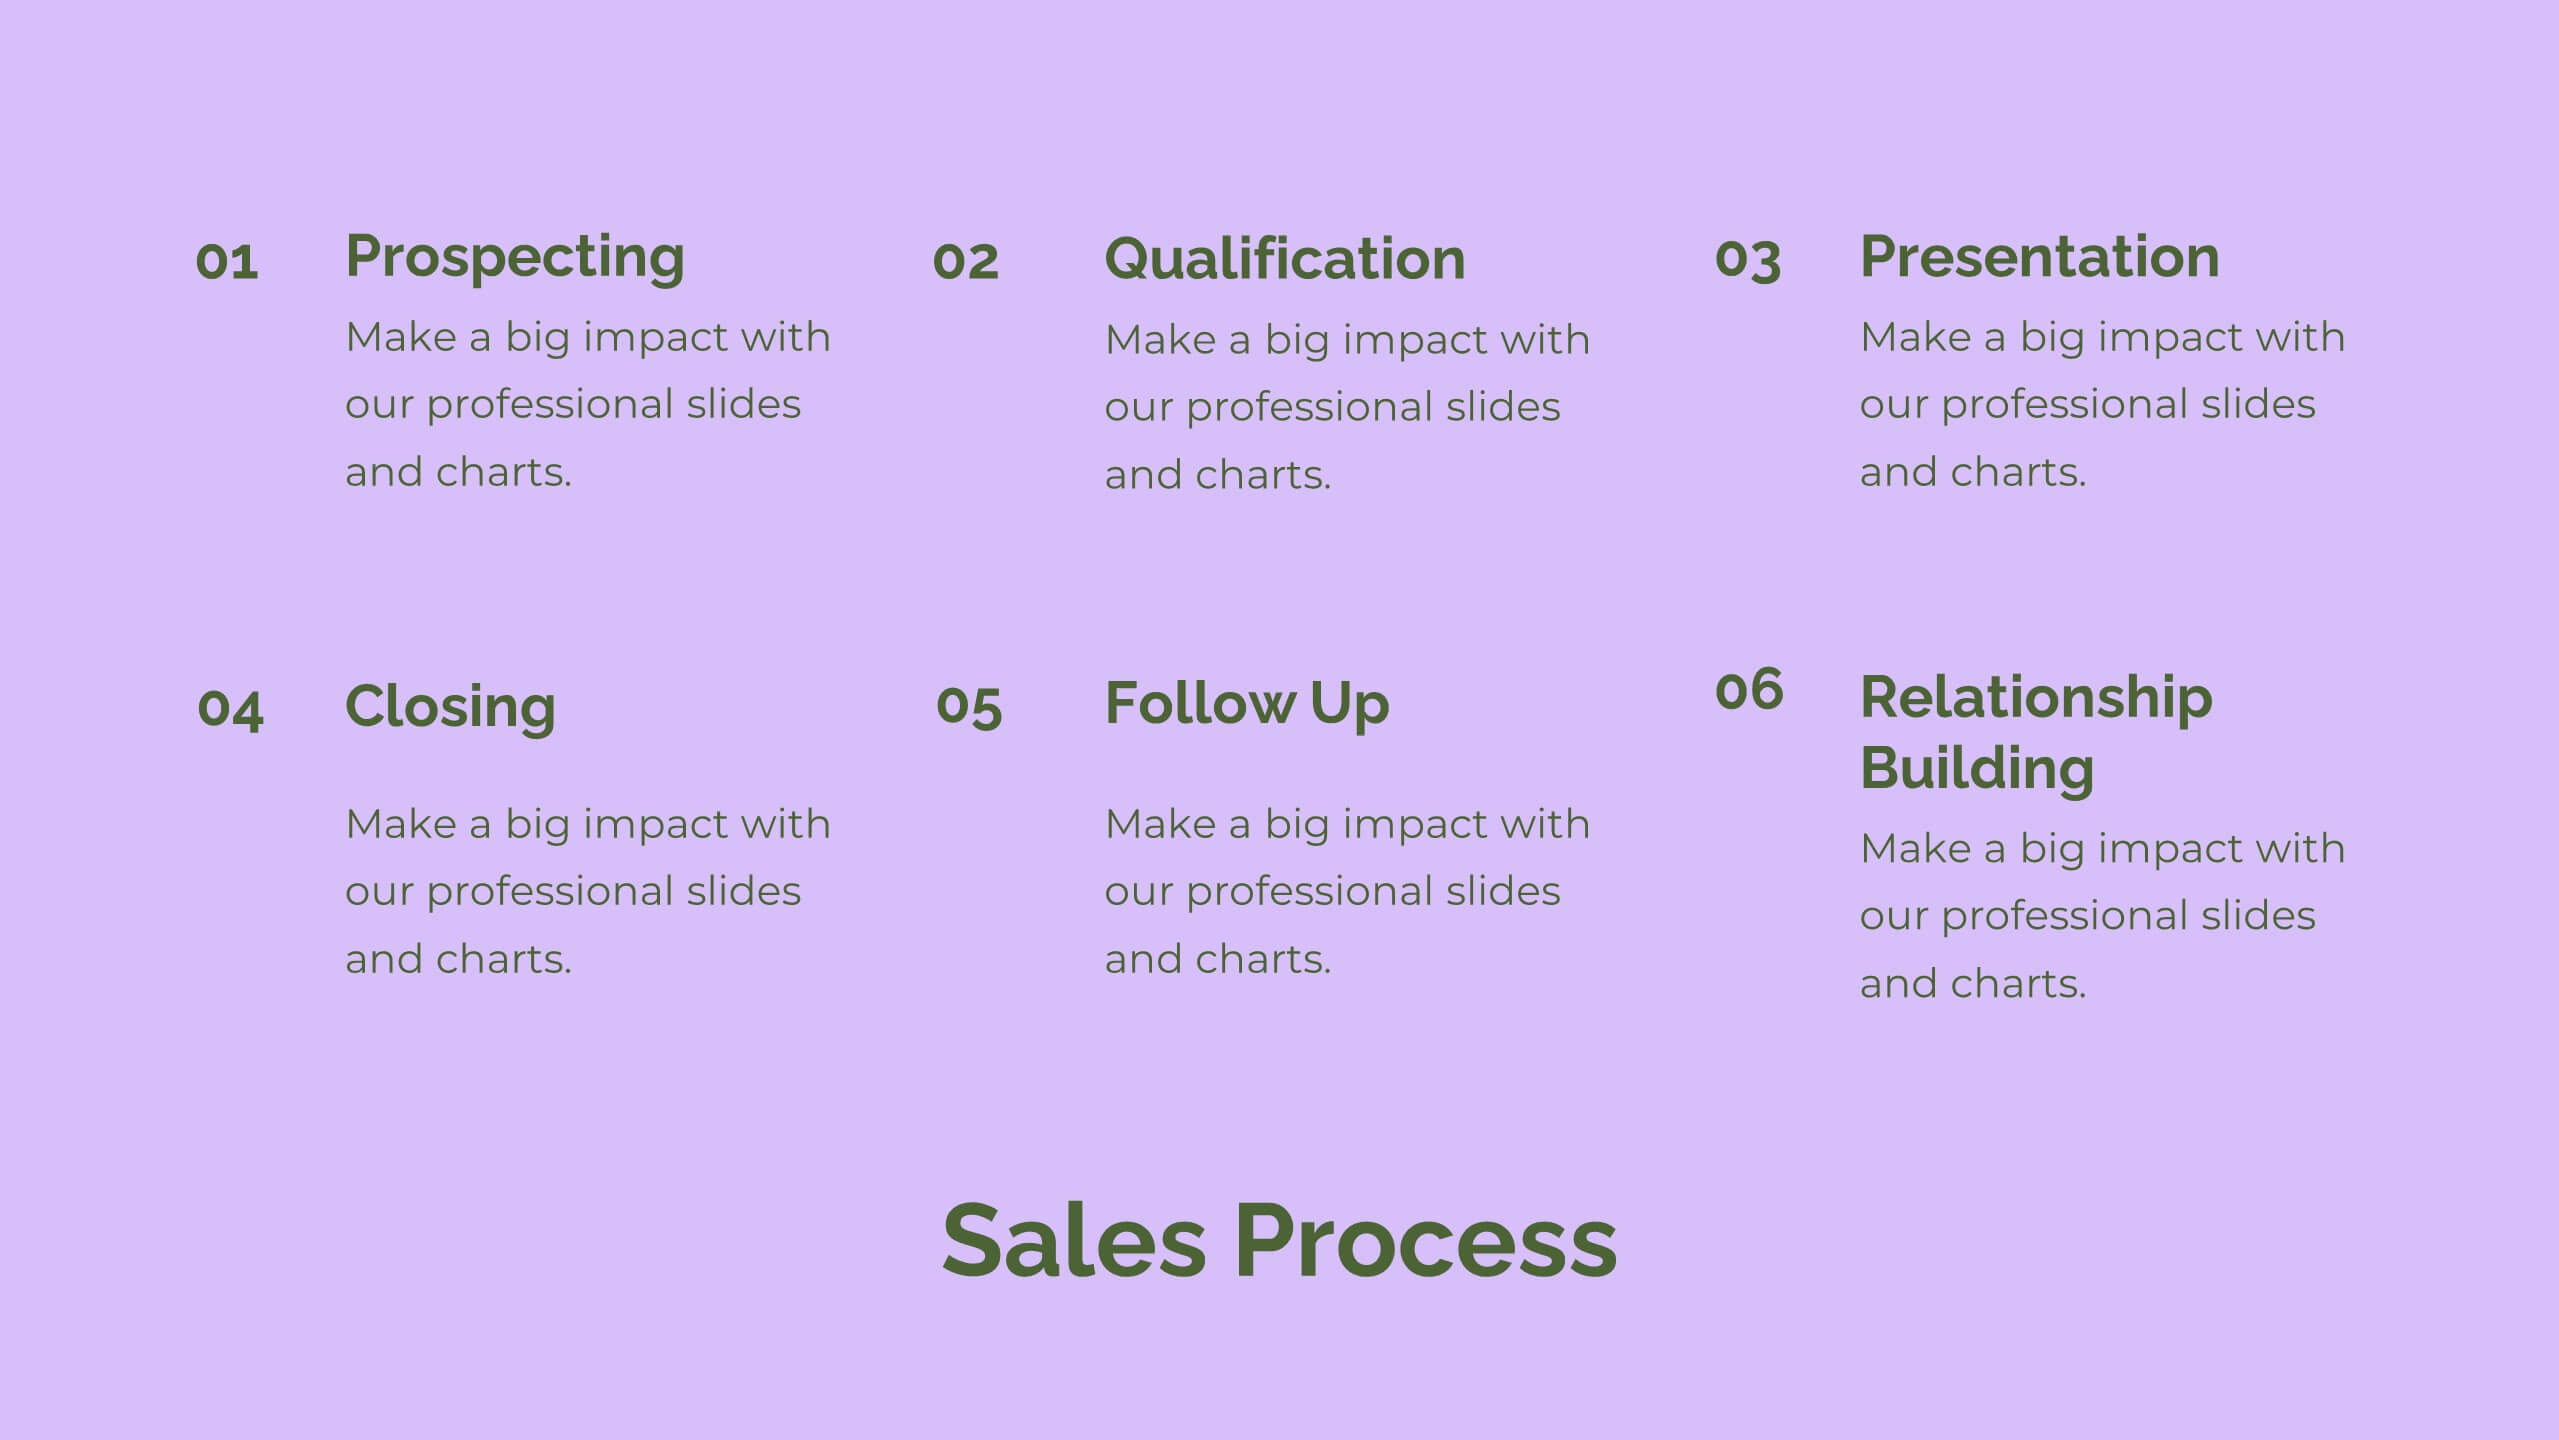
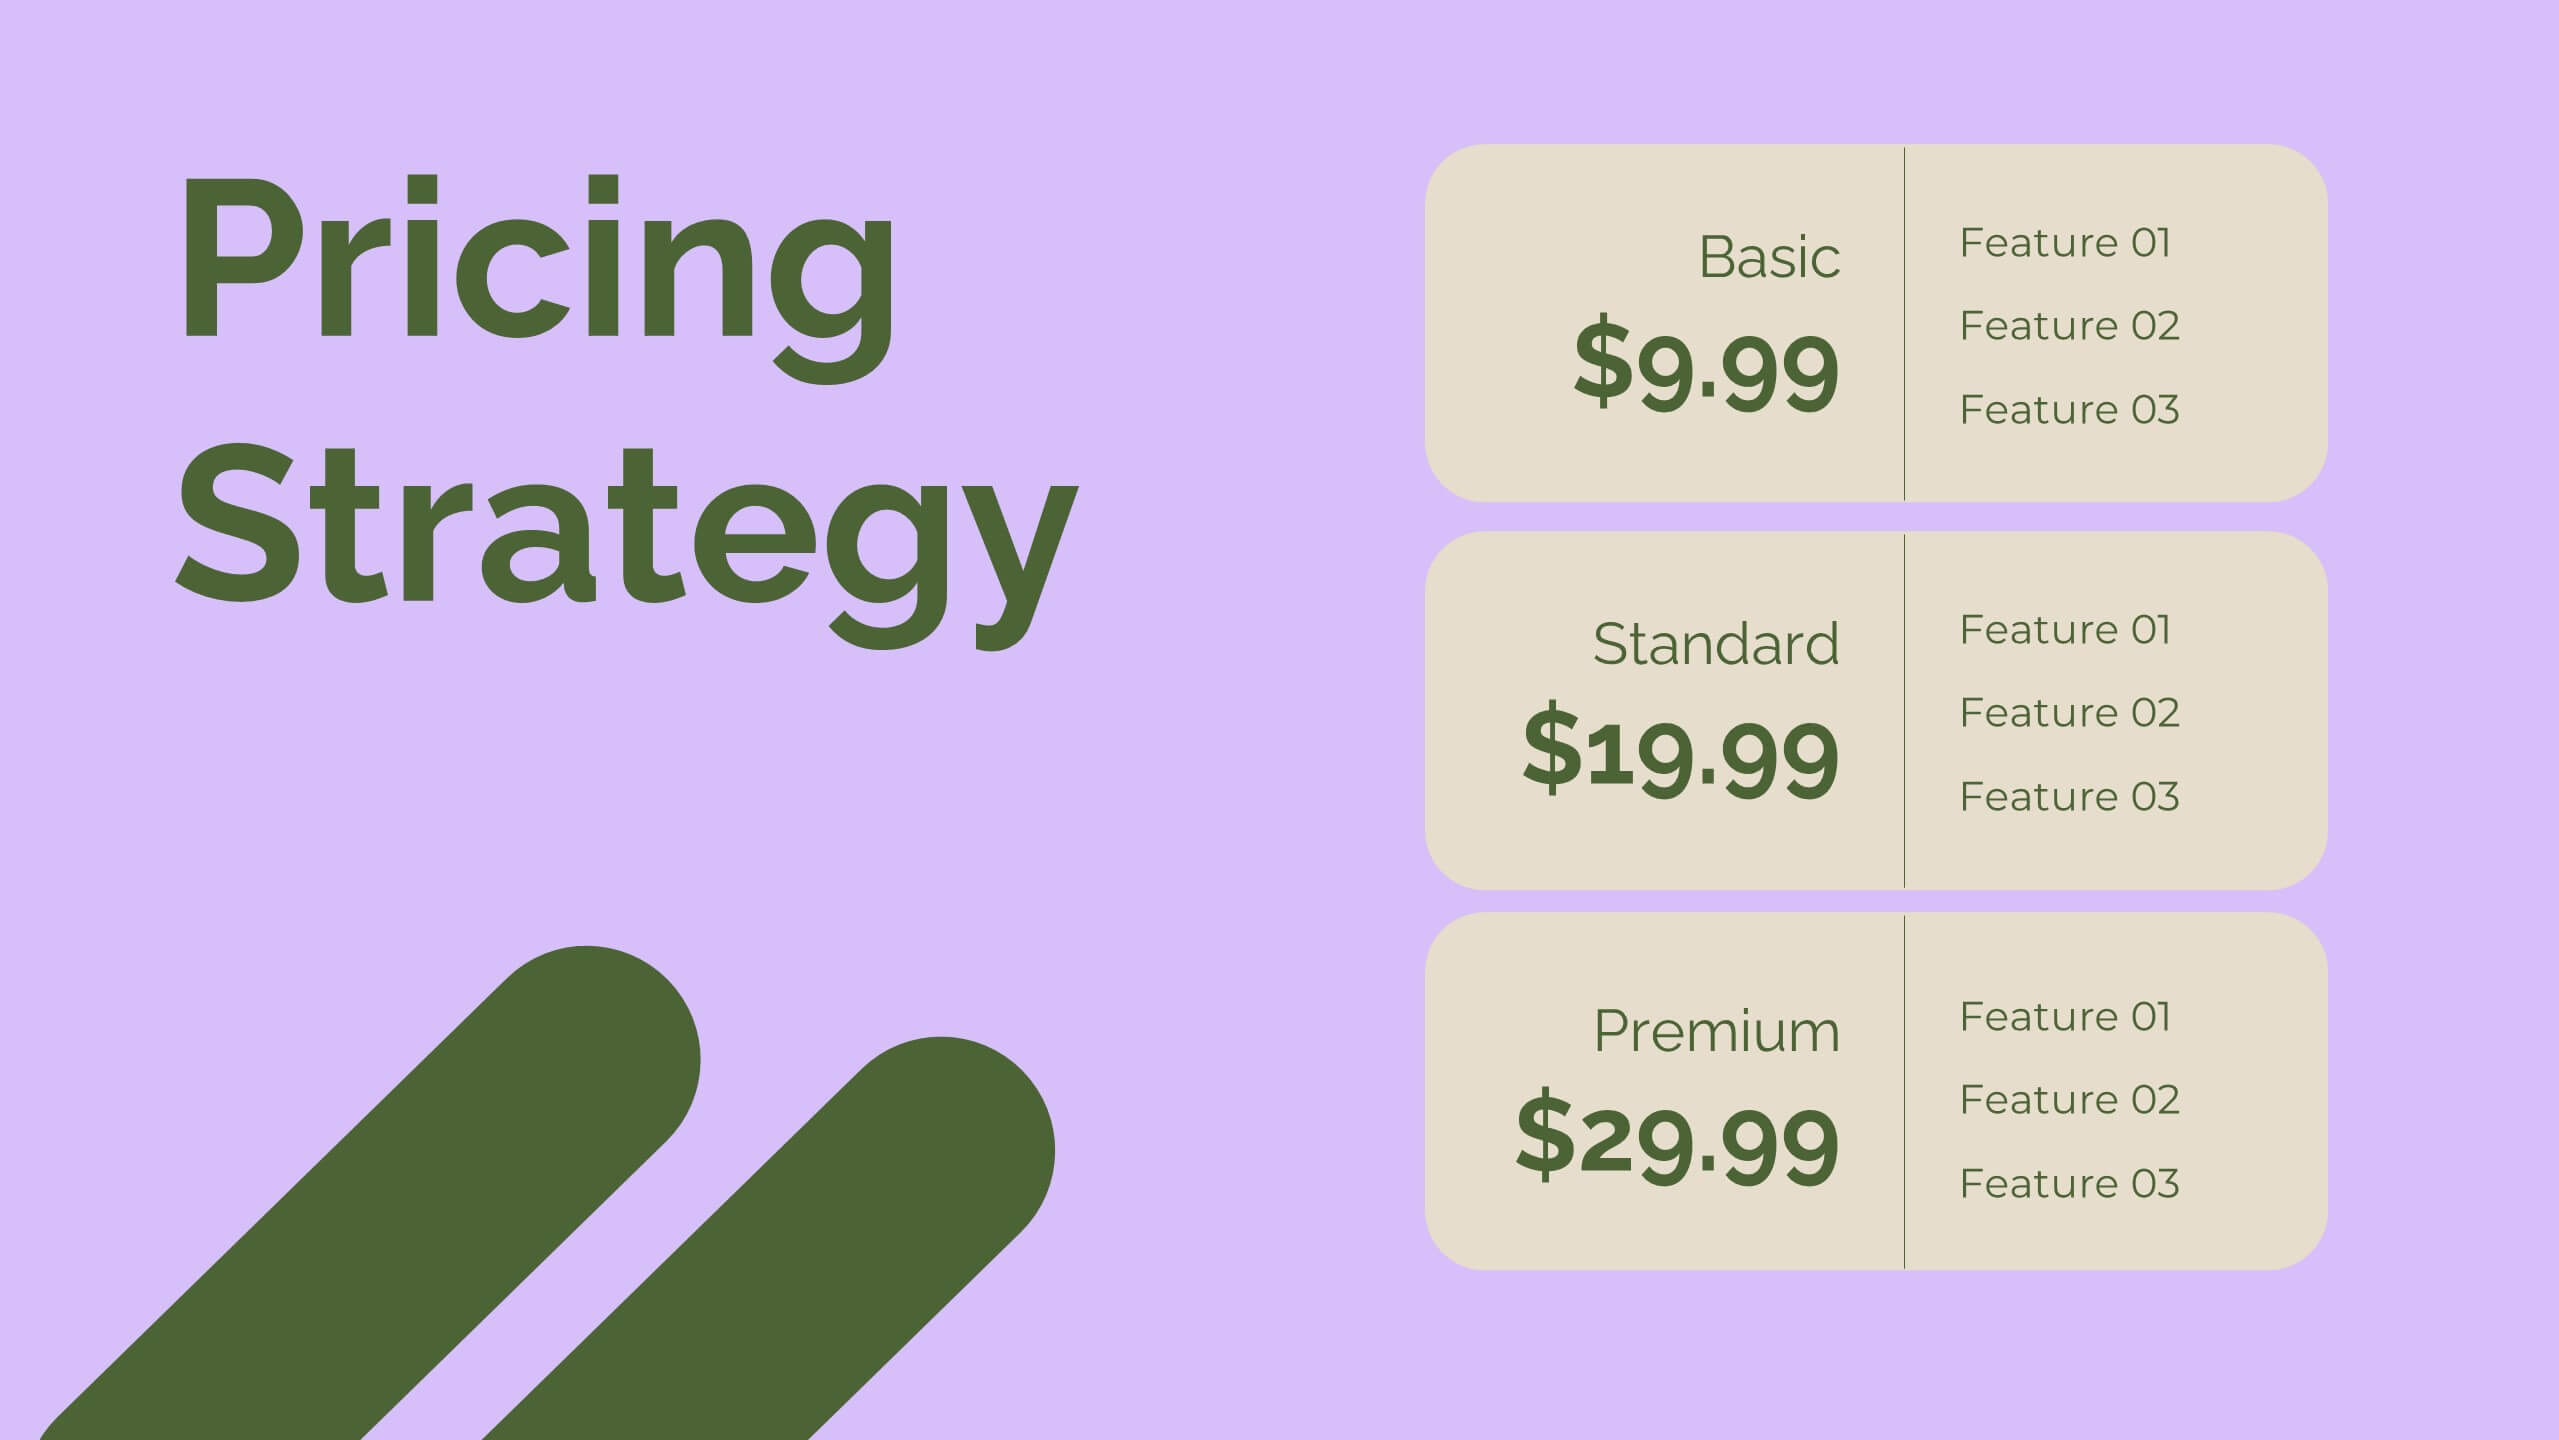
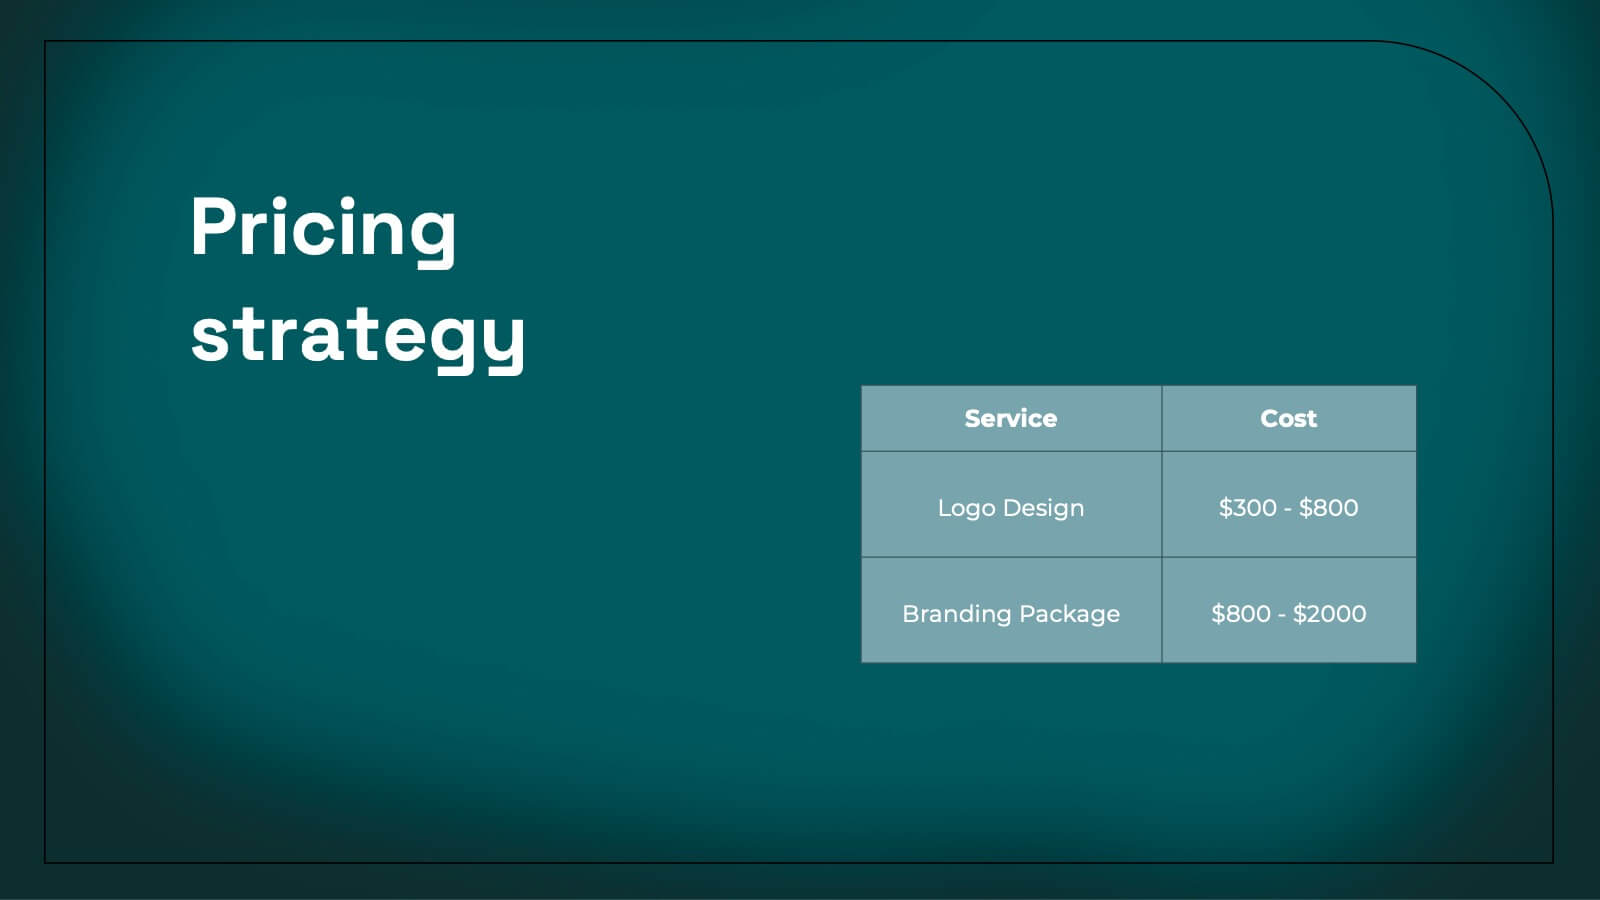
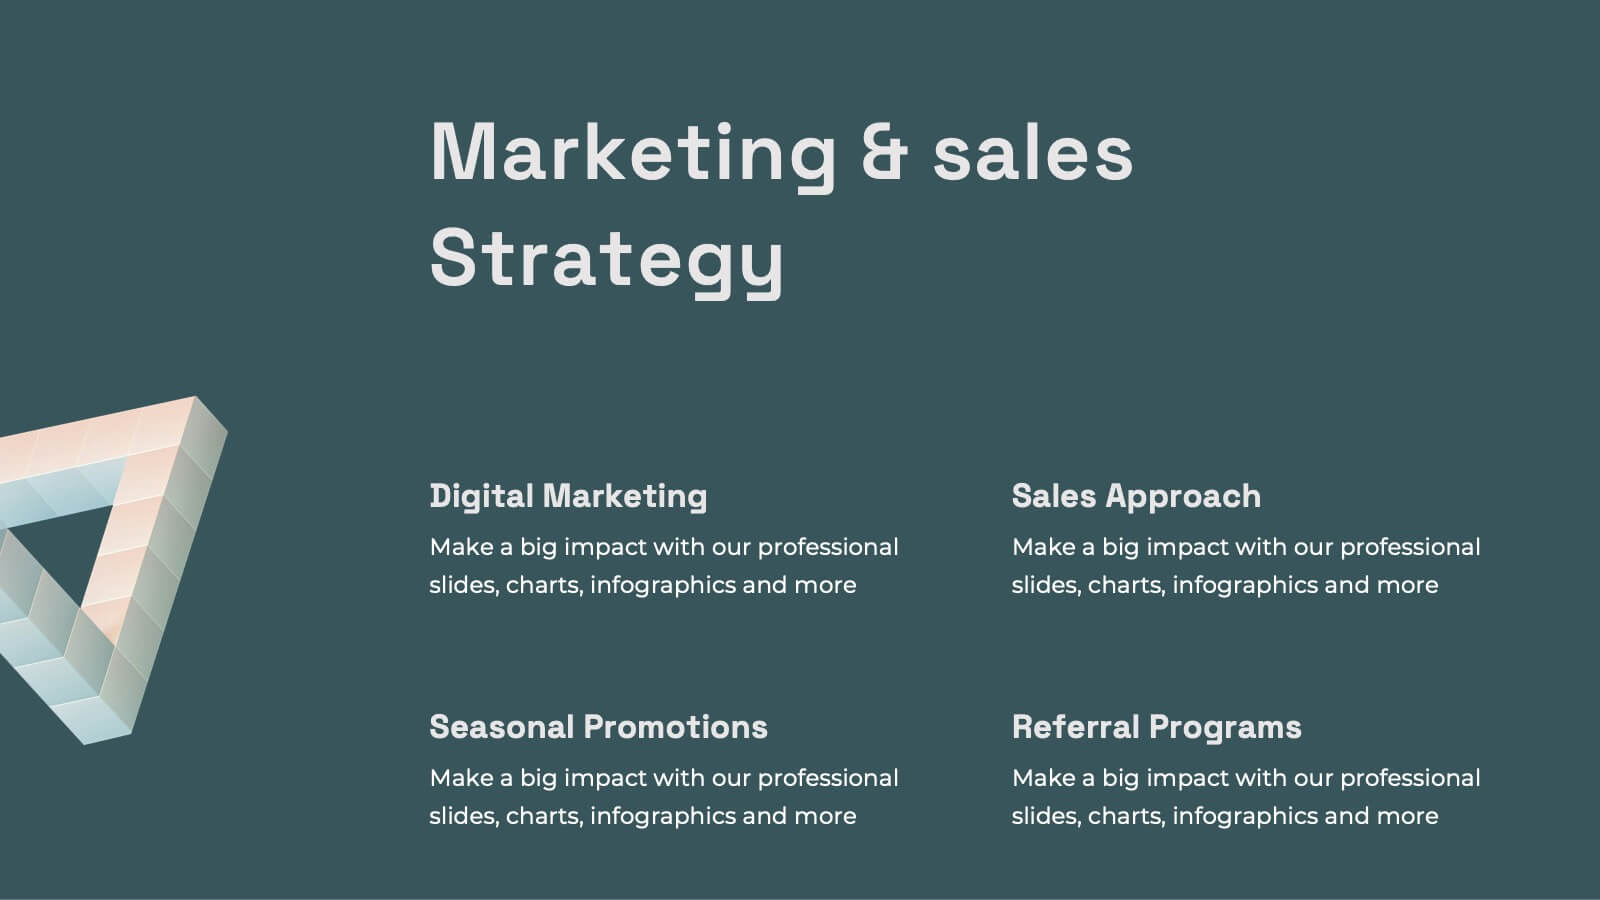
Glint Sales Strategy Presentation
Boost your sales performance with this dynamic sales strategy template! Perfect for presenting your company overview, product details, and competitive analysis, it includes slides for sales objectives, pricing strategy, and performance metrics. Engage your team with vibrant visuals and clear, structured content. Compatible with PowerPoint, Keynote, and Google Slides for seamless presentations on any platform.


7 slides
Technology Infographic Presentation Template
A technology infographic is a visual representation of information or data related to technology. The purpose of this template is to present your complex information in a simple, easy-to-understand manner. This template contains pre-designed layouts and images that can be used to structure your content in a variety of ways. This template is perfect to use to help explain technology-related topics such as software, hardware, cybersecurity, and more. Infographics are commonly used in the technology industry to help educate people about the latest trends, products, and services.


19 slides
Kale Product Strategy Report Presentation
Unleash the power of your product with this bold and dynamic product strategy report template! Elevate your presentation with eye-catching designs that showcase product features, competitive analysis, and pricing strategies like never before. Captivate your audience from start to finish and leave a lasting impression. Fully compatible with PowerPoint, Keynote, and Google Slides!