


Features
- 4 Unique Slides
- Fully editable and easy to edit in Microsoft Powerpoint, Keynote and Google Slides
- 16:9 widescreen layout
- Clean and professional designs
- Export to JPG, PDF or send by email


Do you have any questions?
Recommend


4 slides
Medical Theme Slides for Healthcare Presentation
Bring clarity and care to your data storytelling with this modern healthcare-themed presentation. Designed for hospitals, clinics, or medical professionals, it helps you present health data, research findings, and patient care insights with professionalism and trust. Fully customizable and compatible with PowerPoint, Keynote, and Google Slides for seamless editing.


5 slides
Strategic Framework Slide Presentation
Turn your strategy into a story that flows with clarity and precision using this clean, timeline-based presentation design. Ideal for illustrating project phases, corporate planning, or growth roadmaps, it keeps information structured and engaging. Fully editable and compatible with PowerPoint, Keynote, and Google Slides for seamless customization.


5 slides
Target Audience Analysis Slide Presentation
Discover who your audience truly is with this clear and visually balanced layout designed to simplify audience insights. Perfect for marketing plans, presentations, and strategy reports, it helps you visualize key demographics and behaviors effortlessly. Fully customizable and compatible with PowerPoint, Keynote, and Google Slides for easy editing.


23 slides
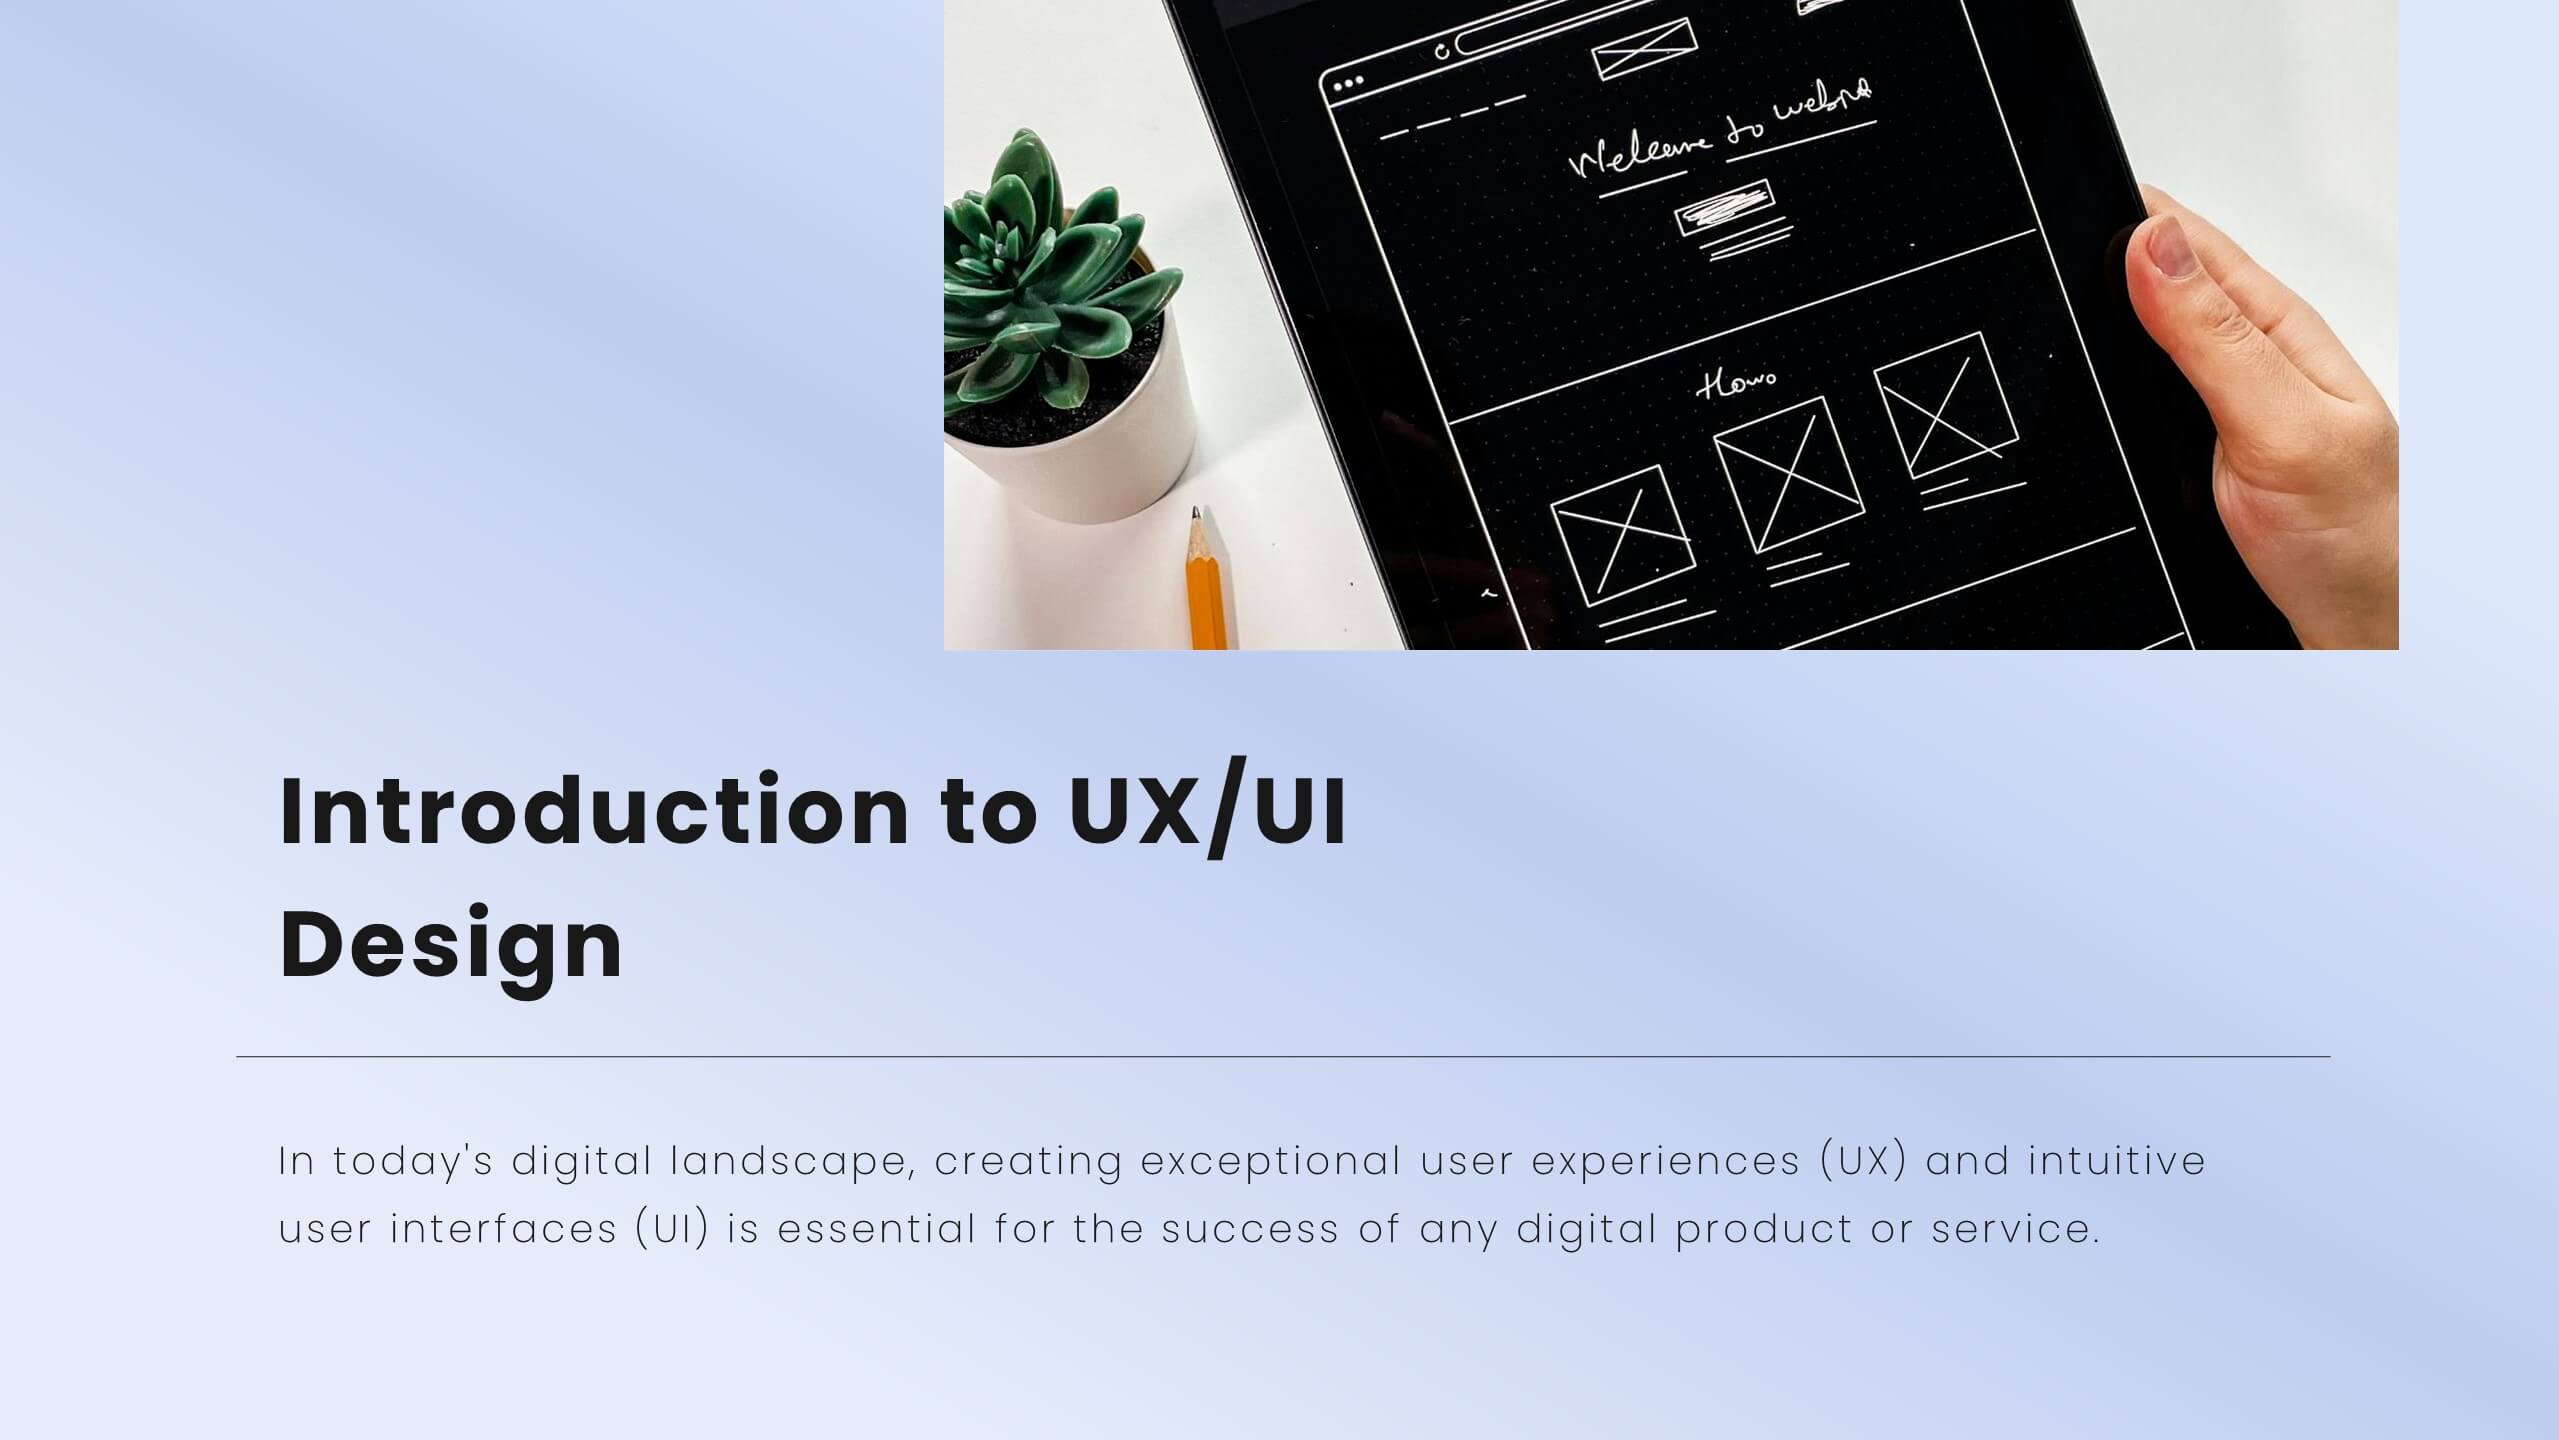
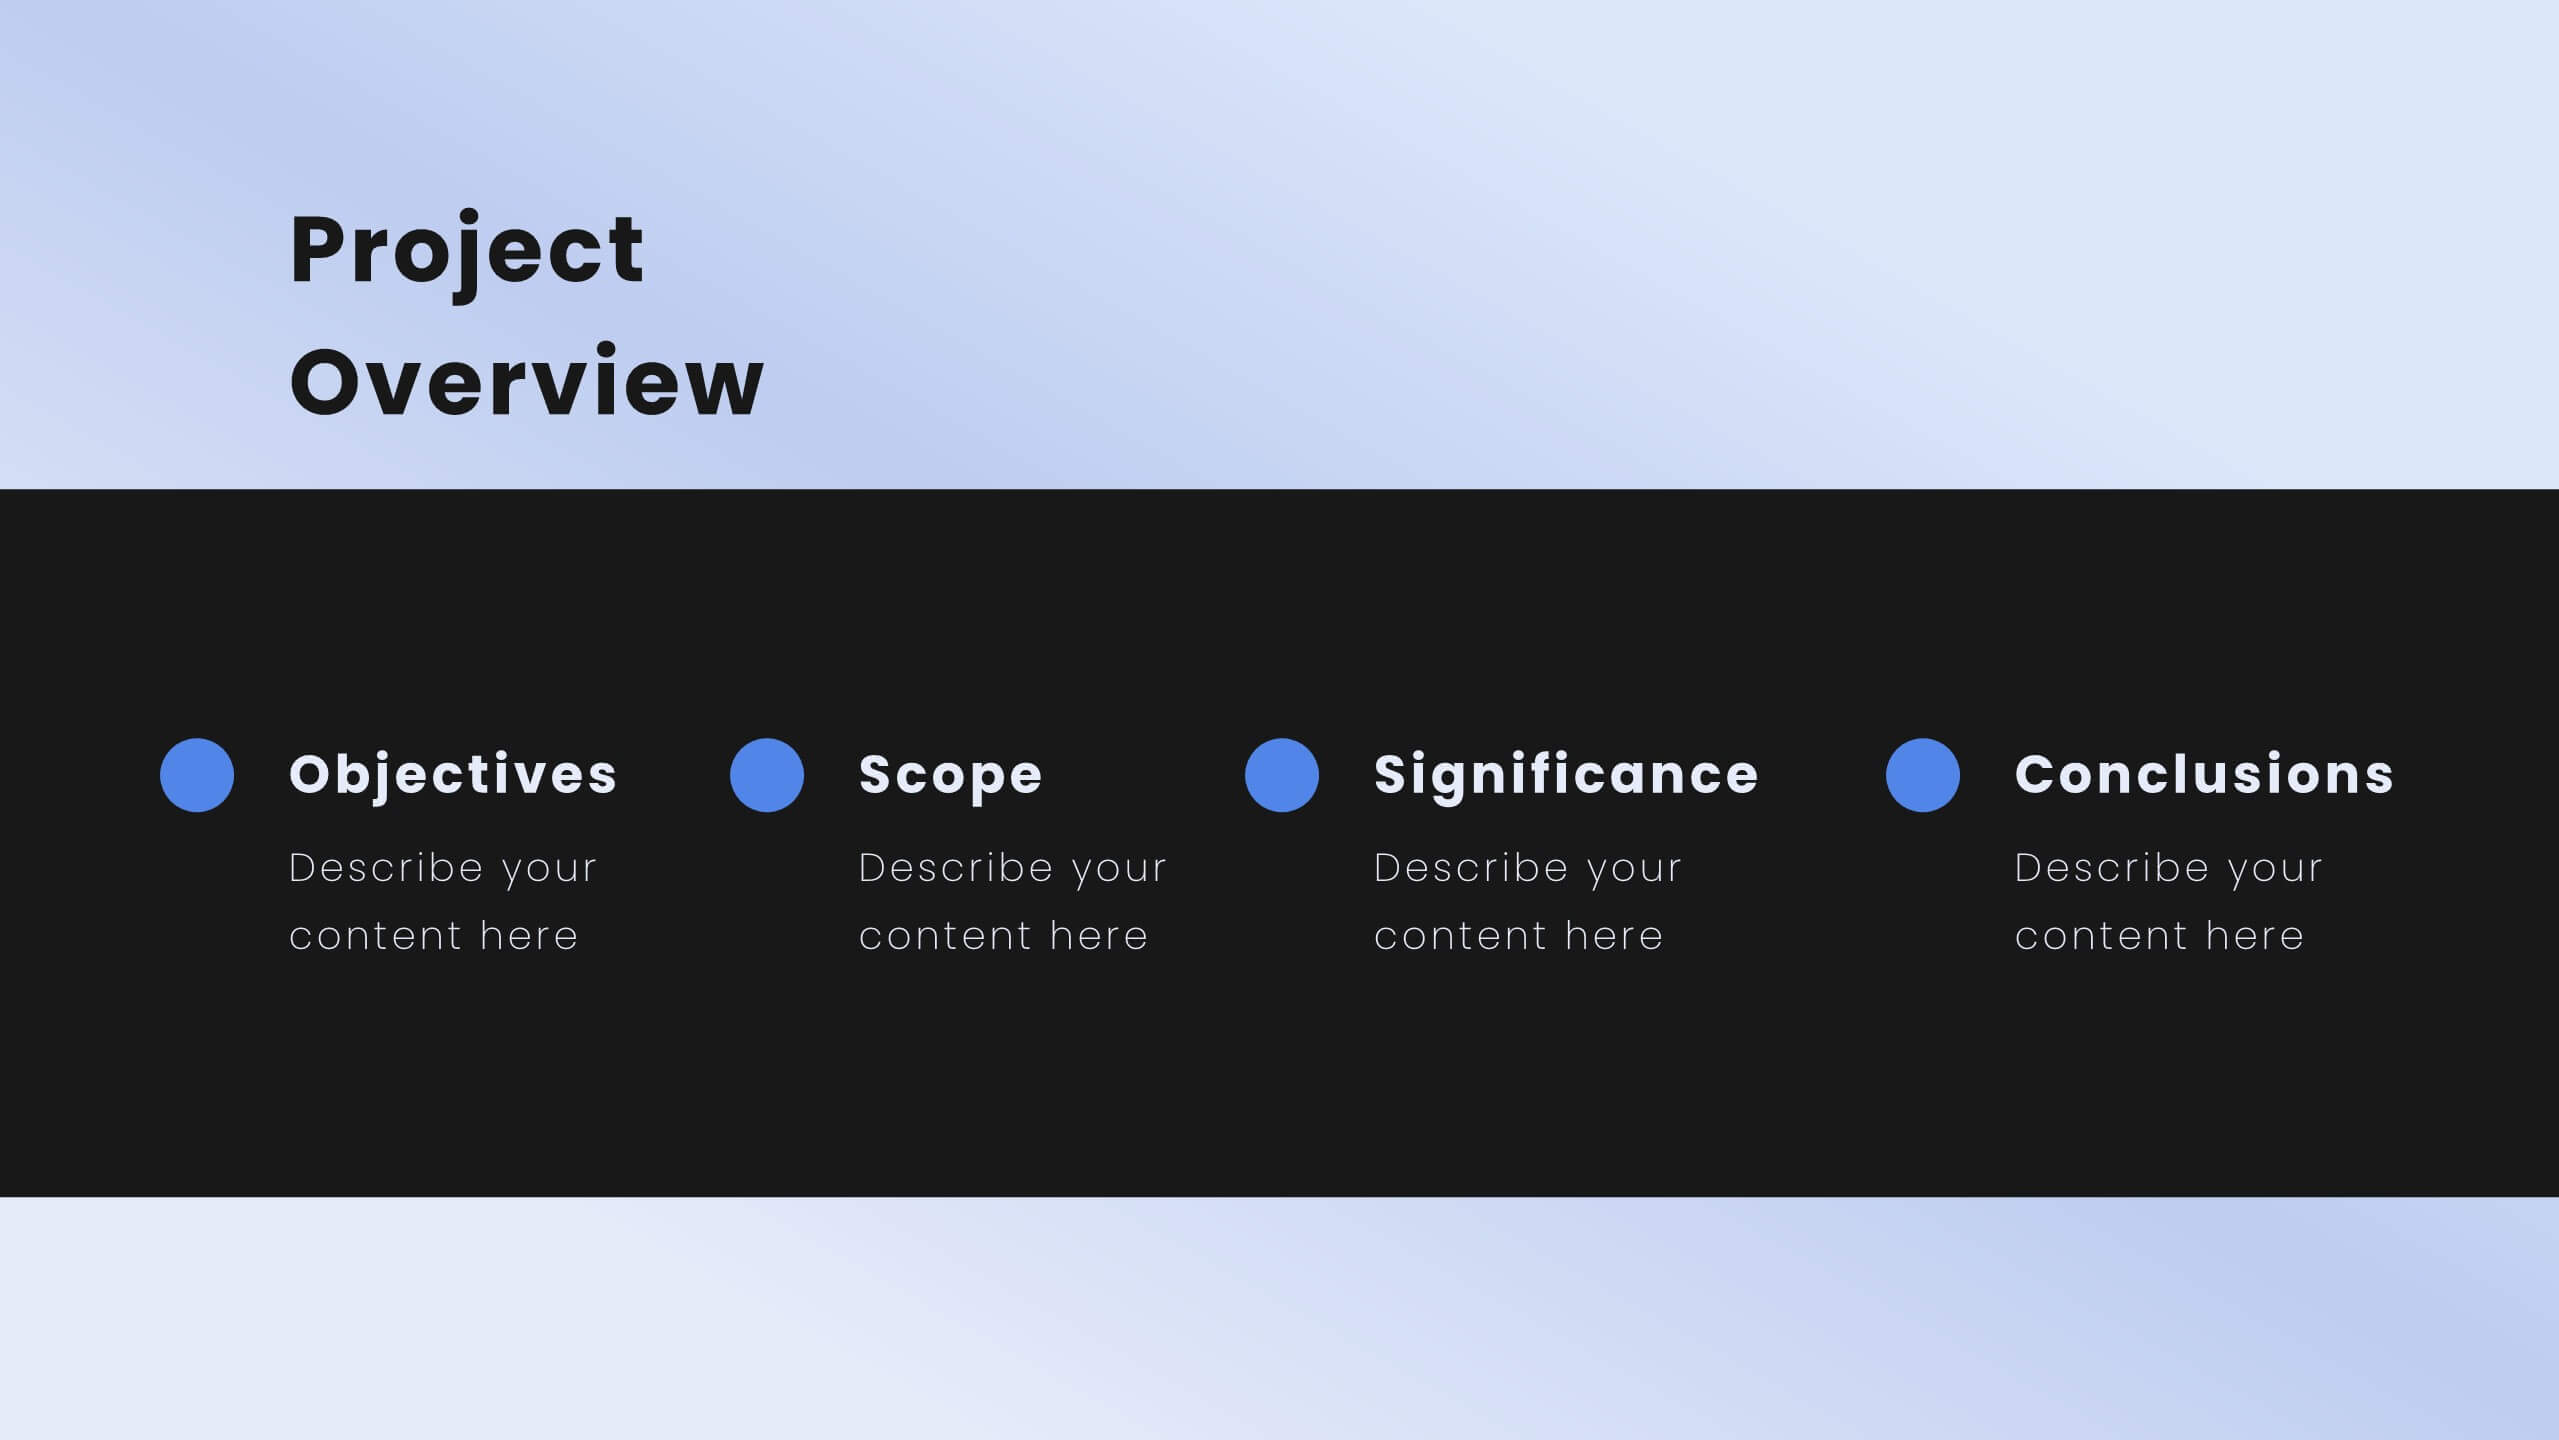
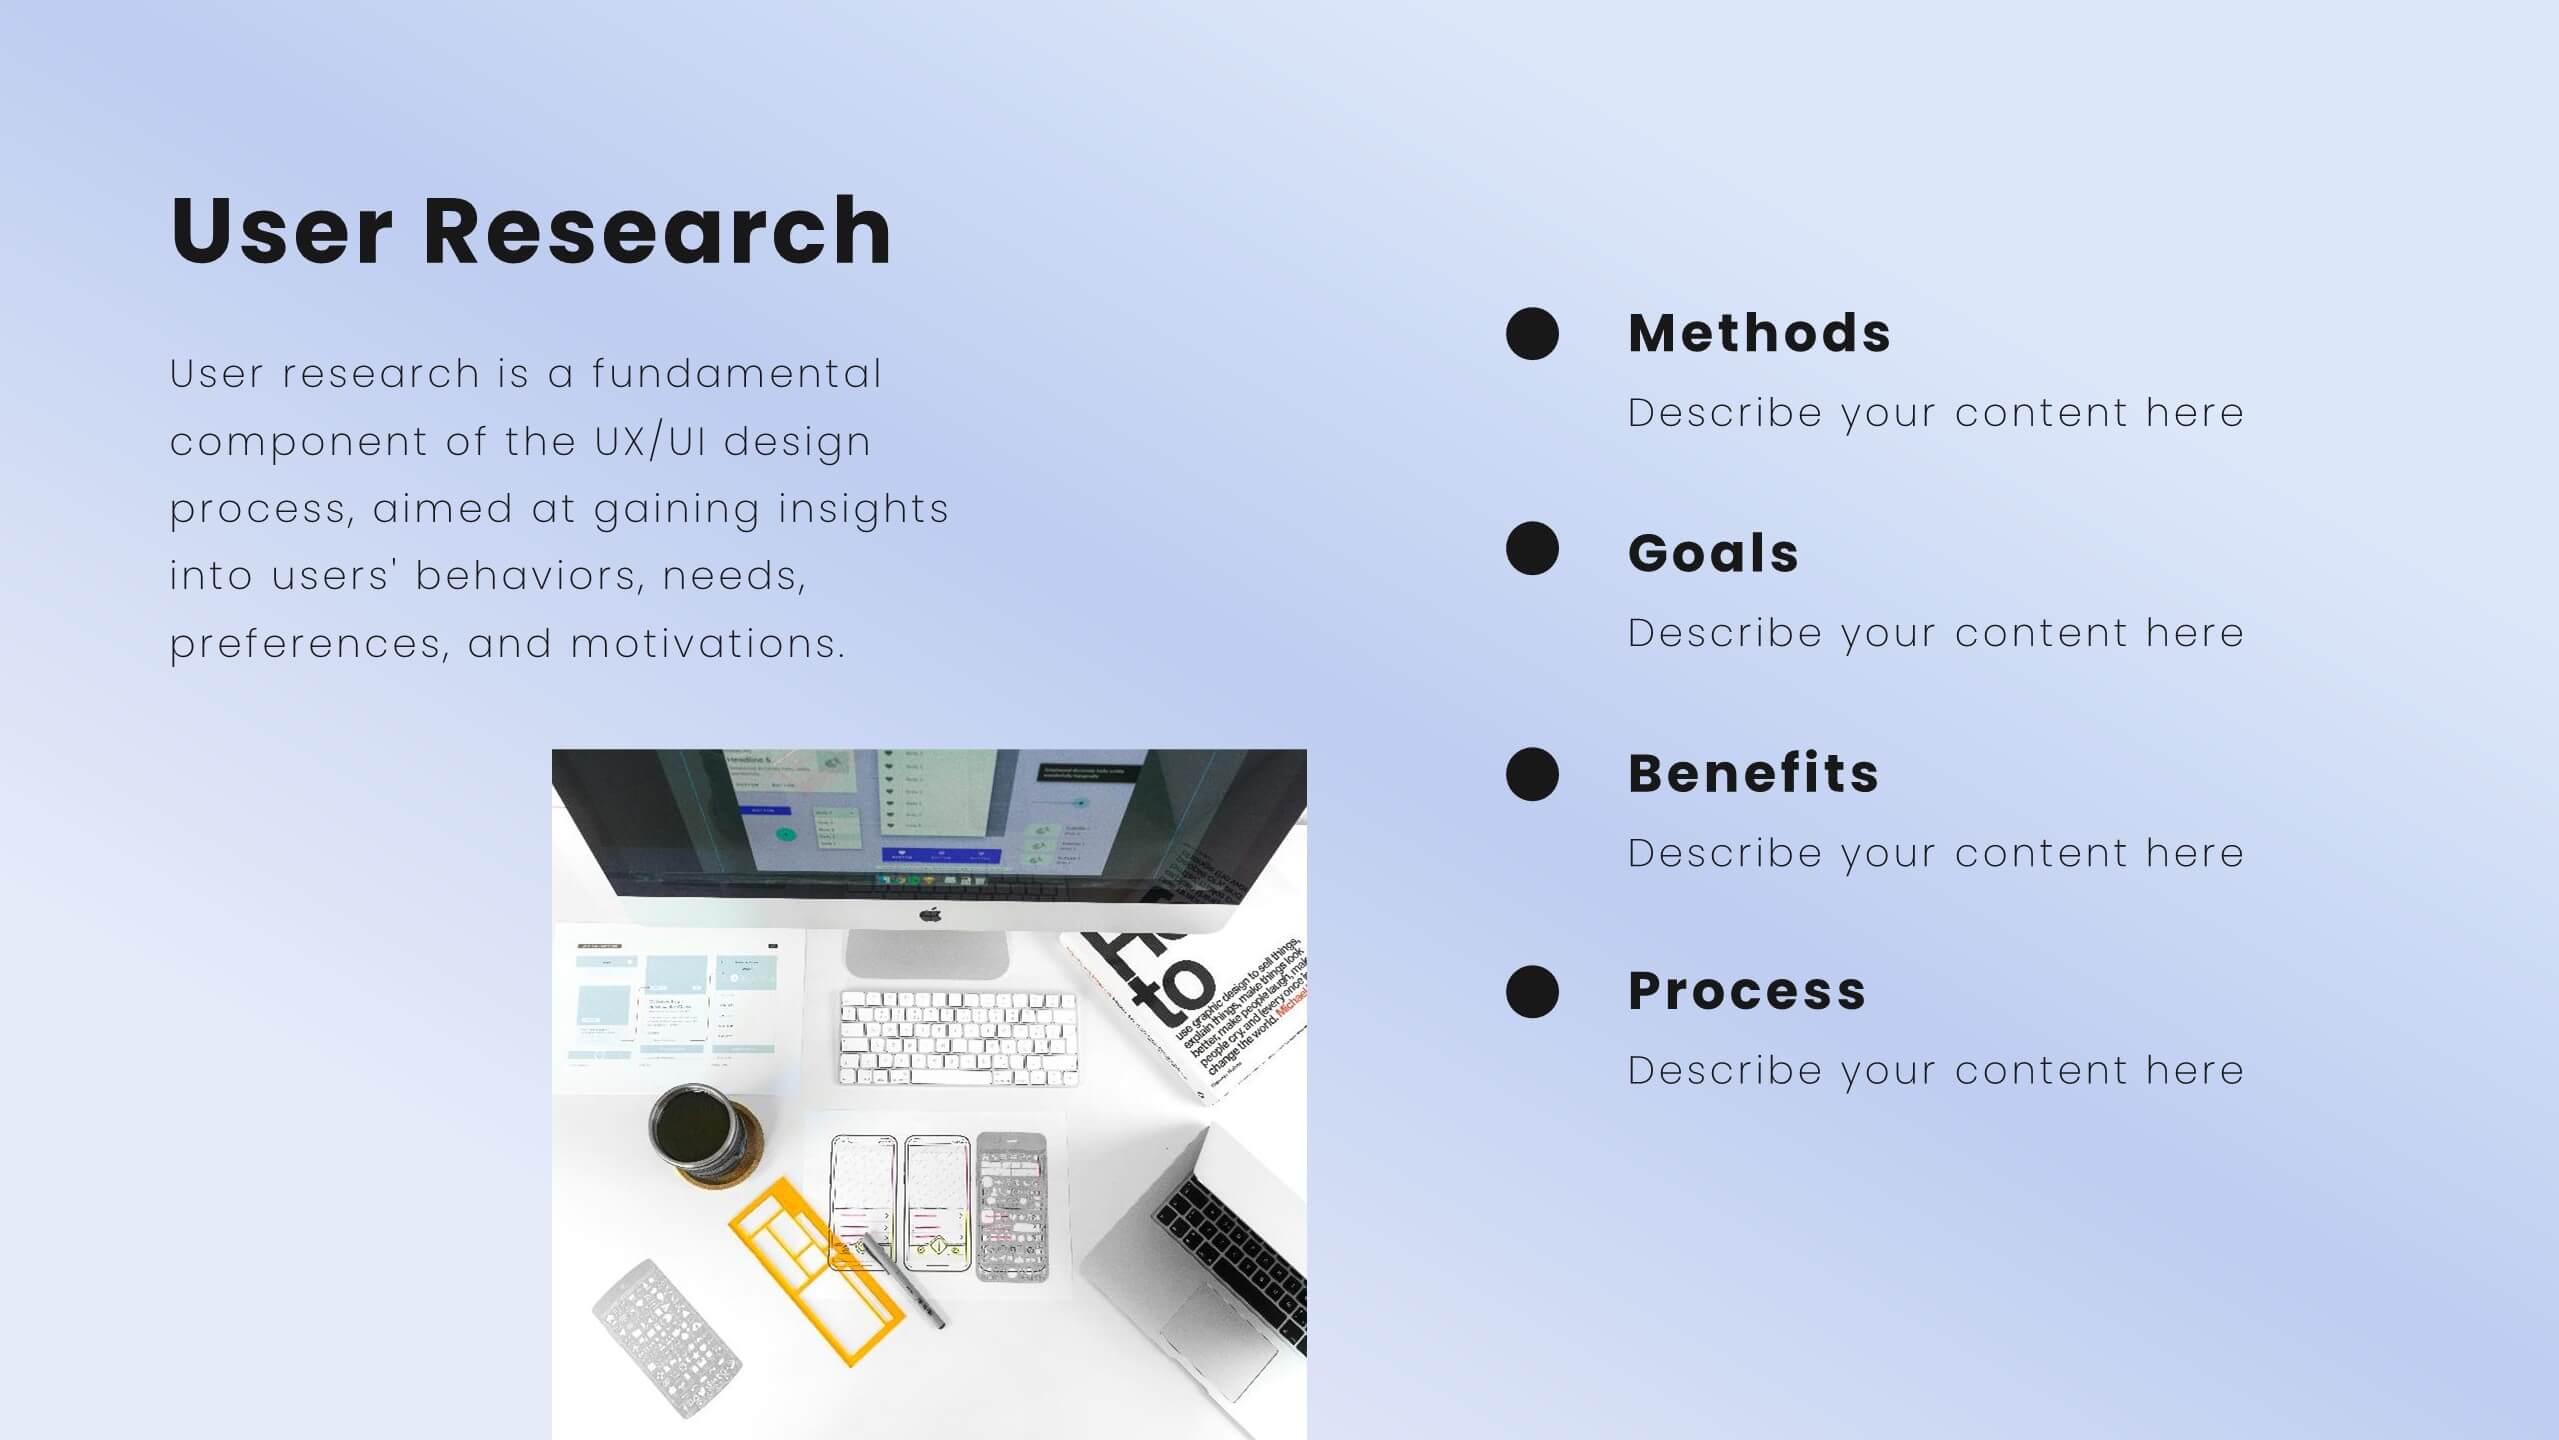
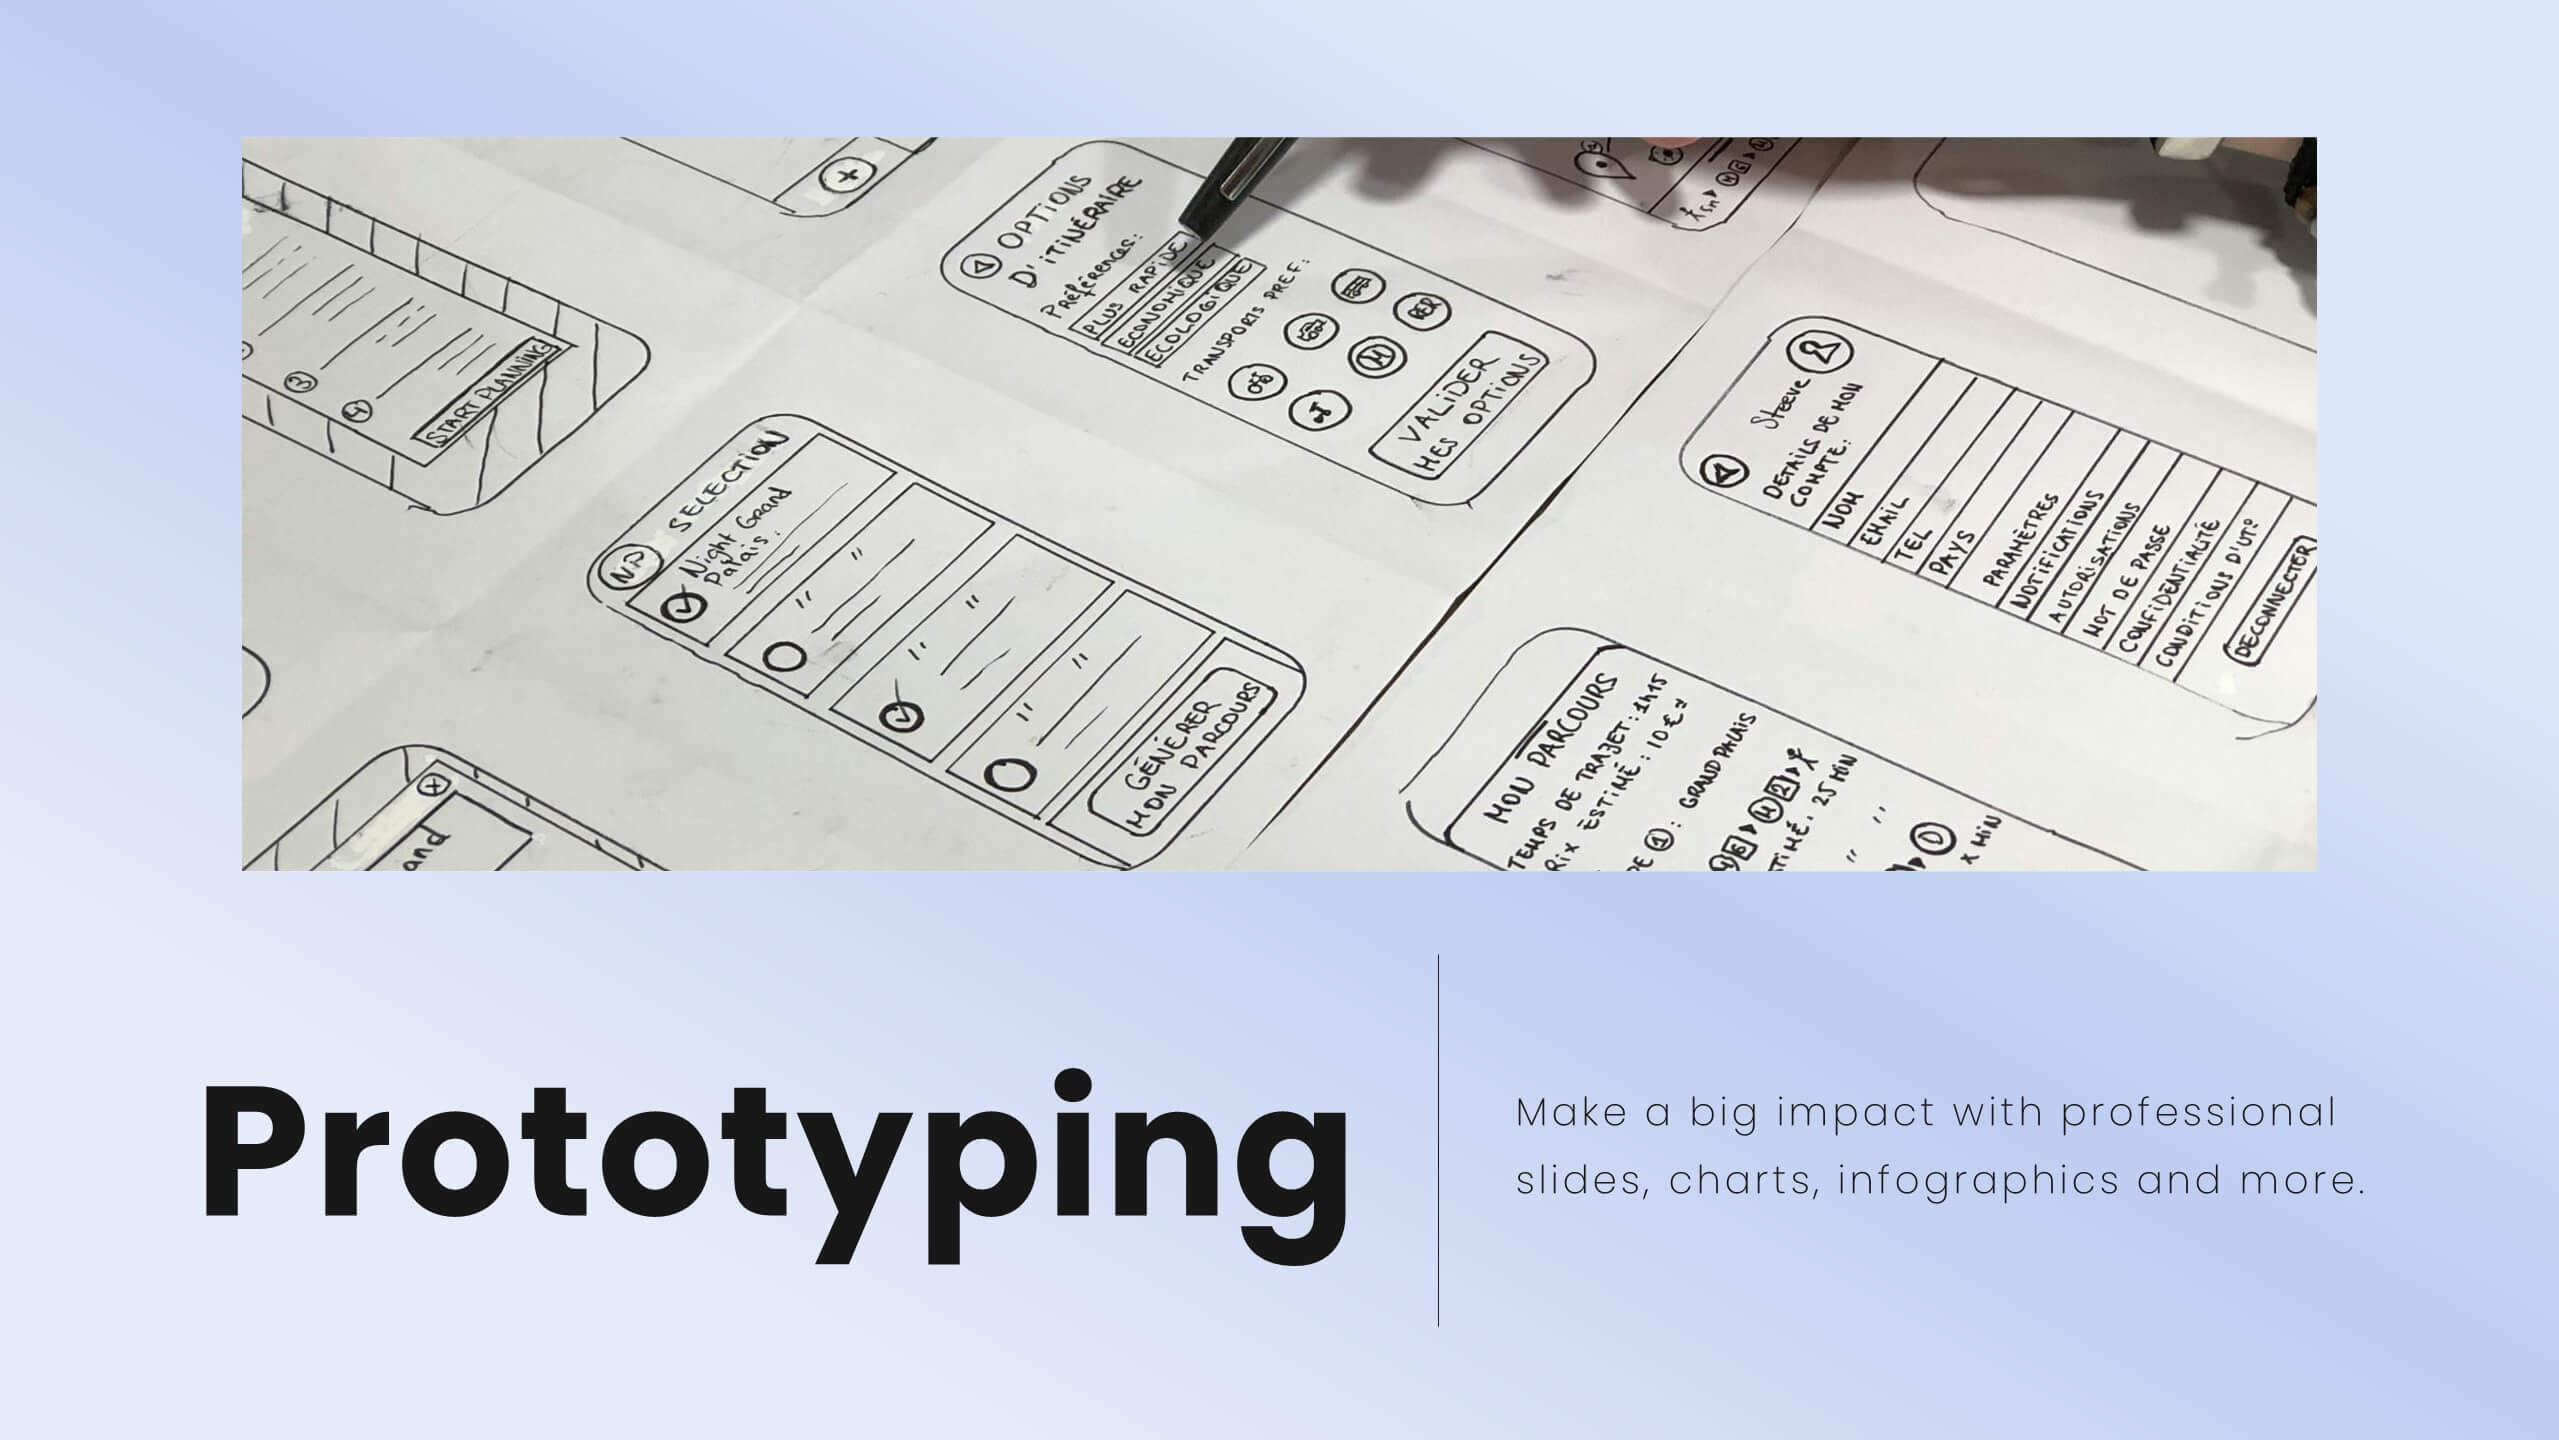
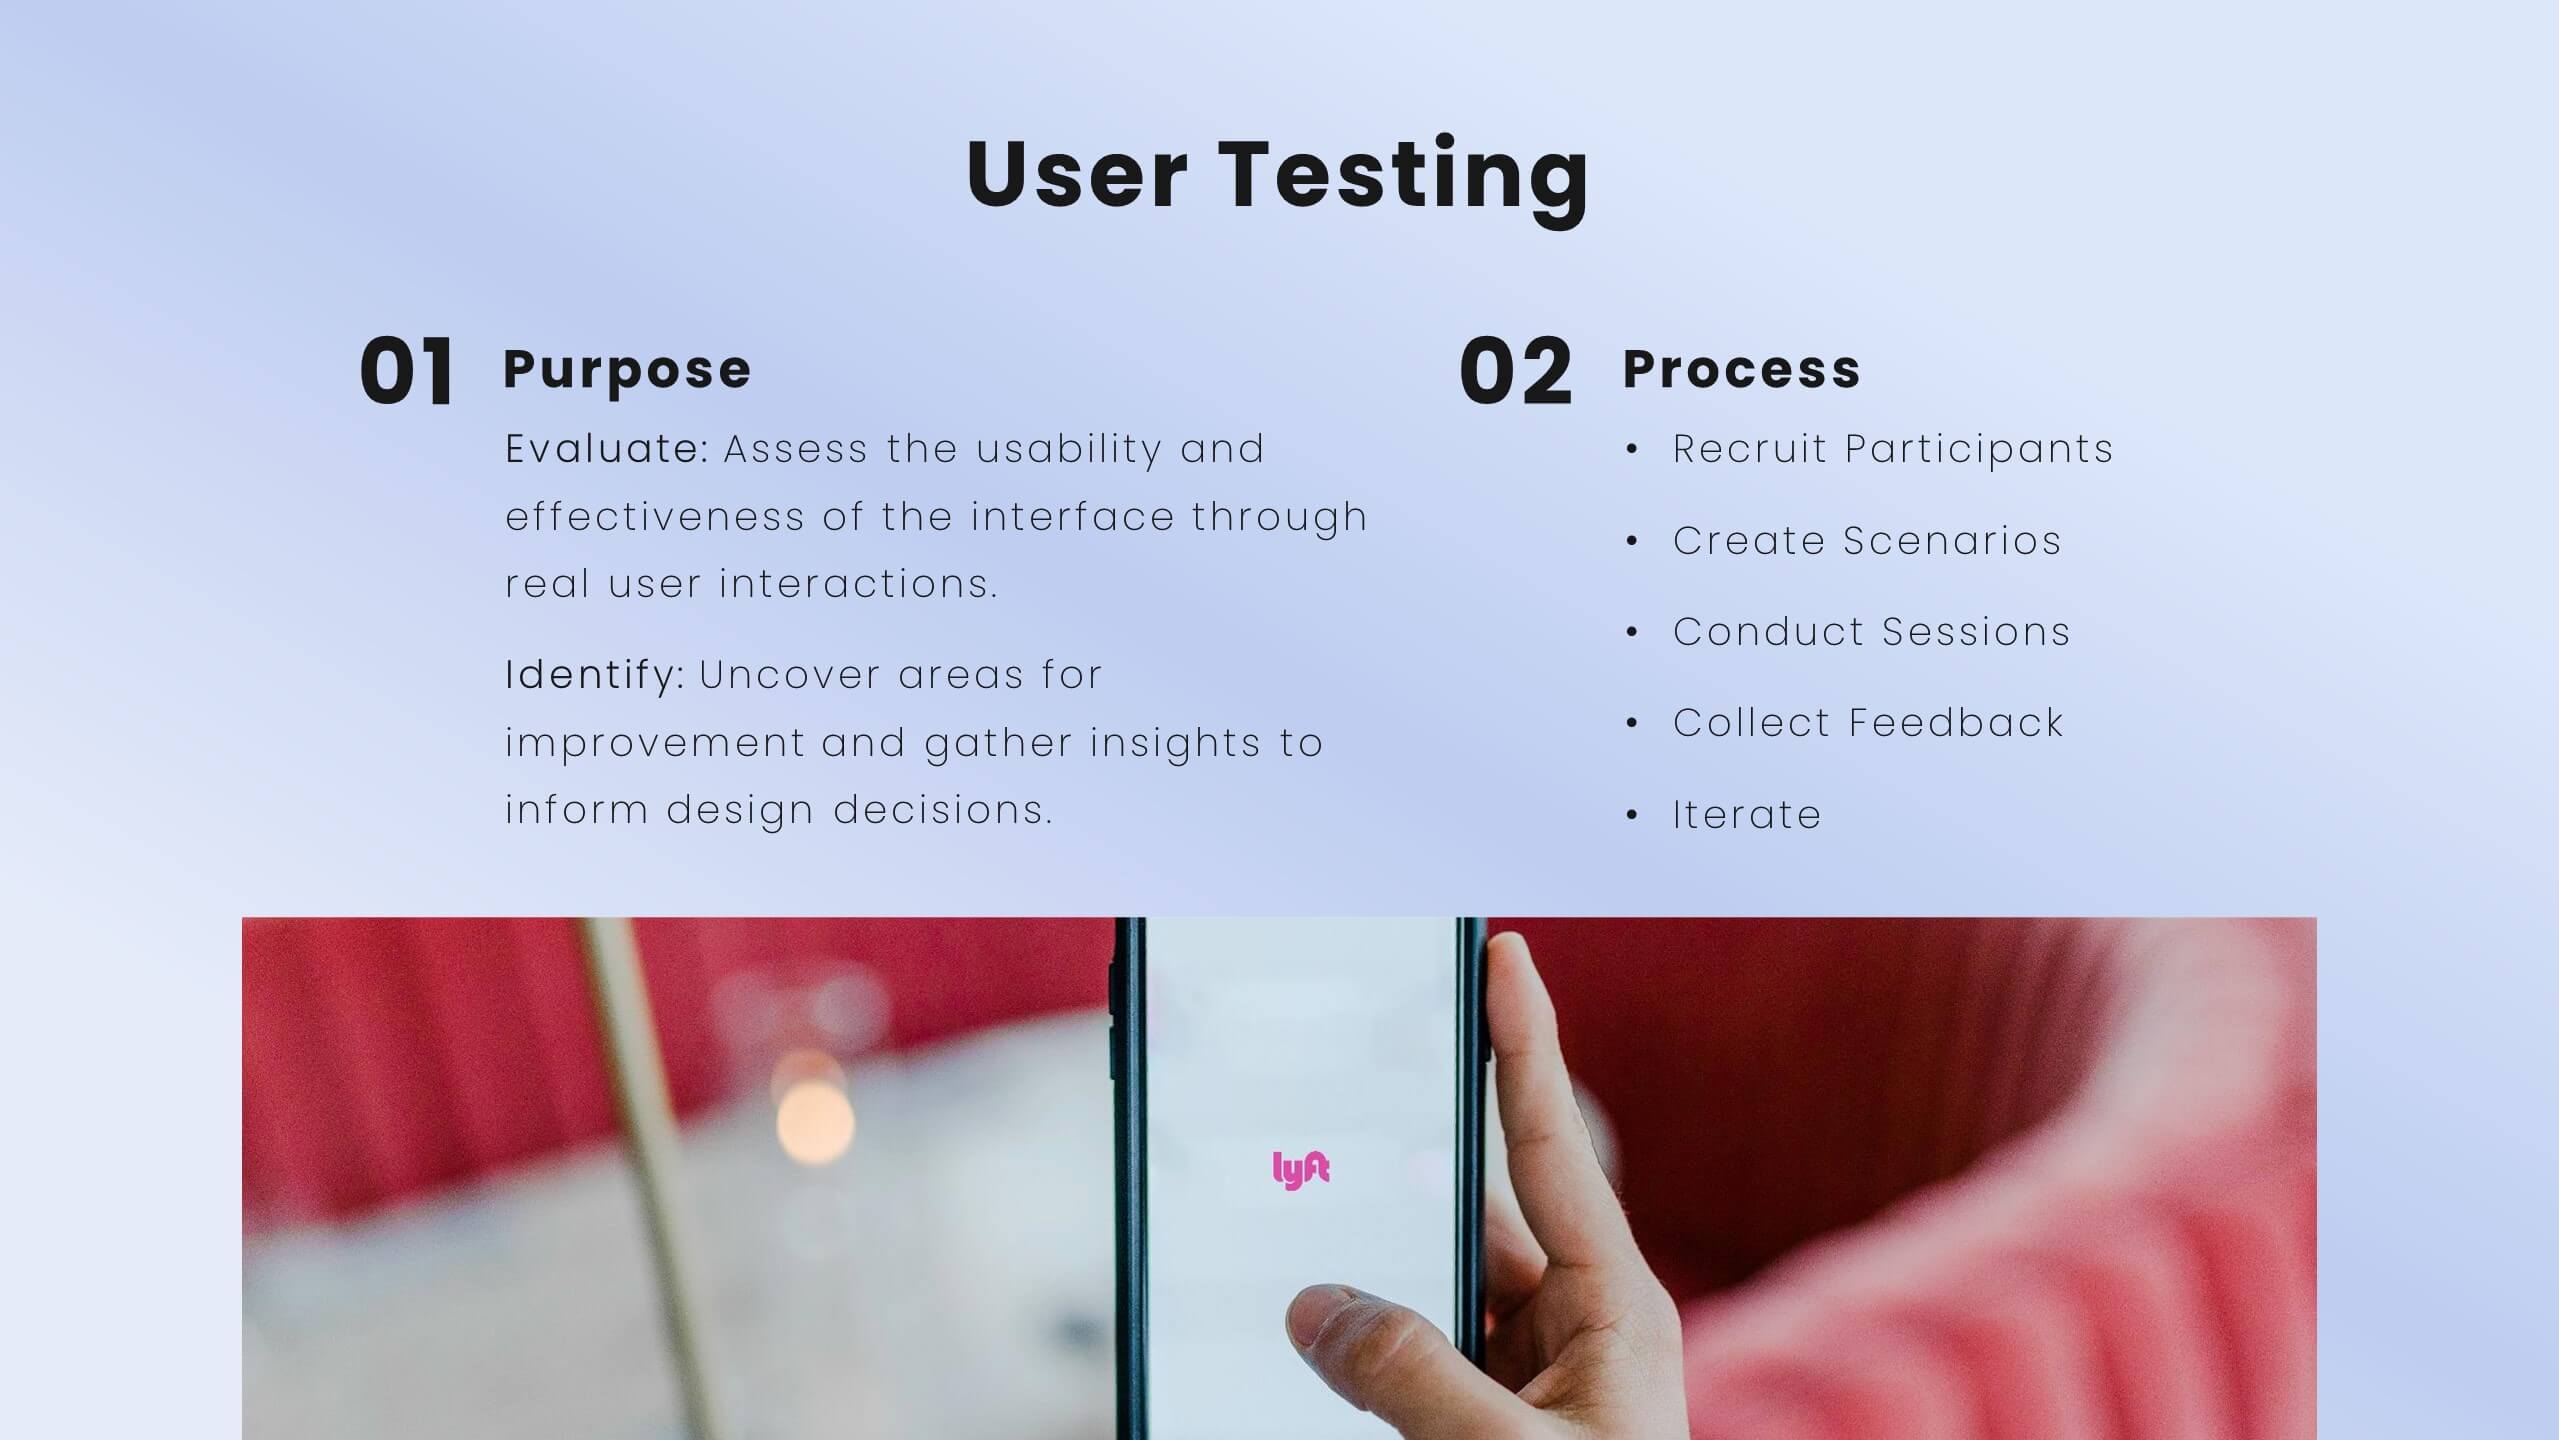
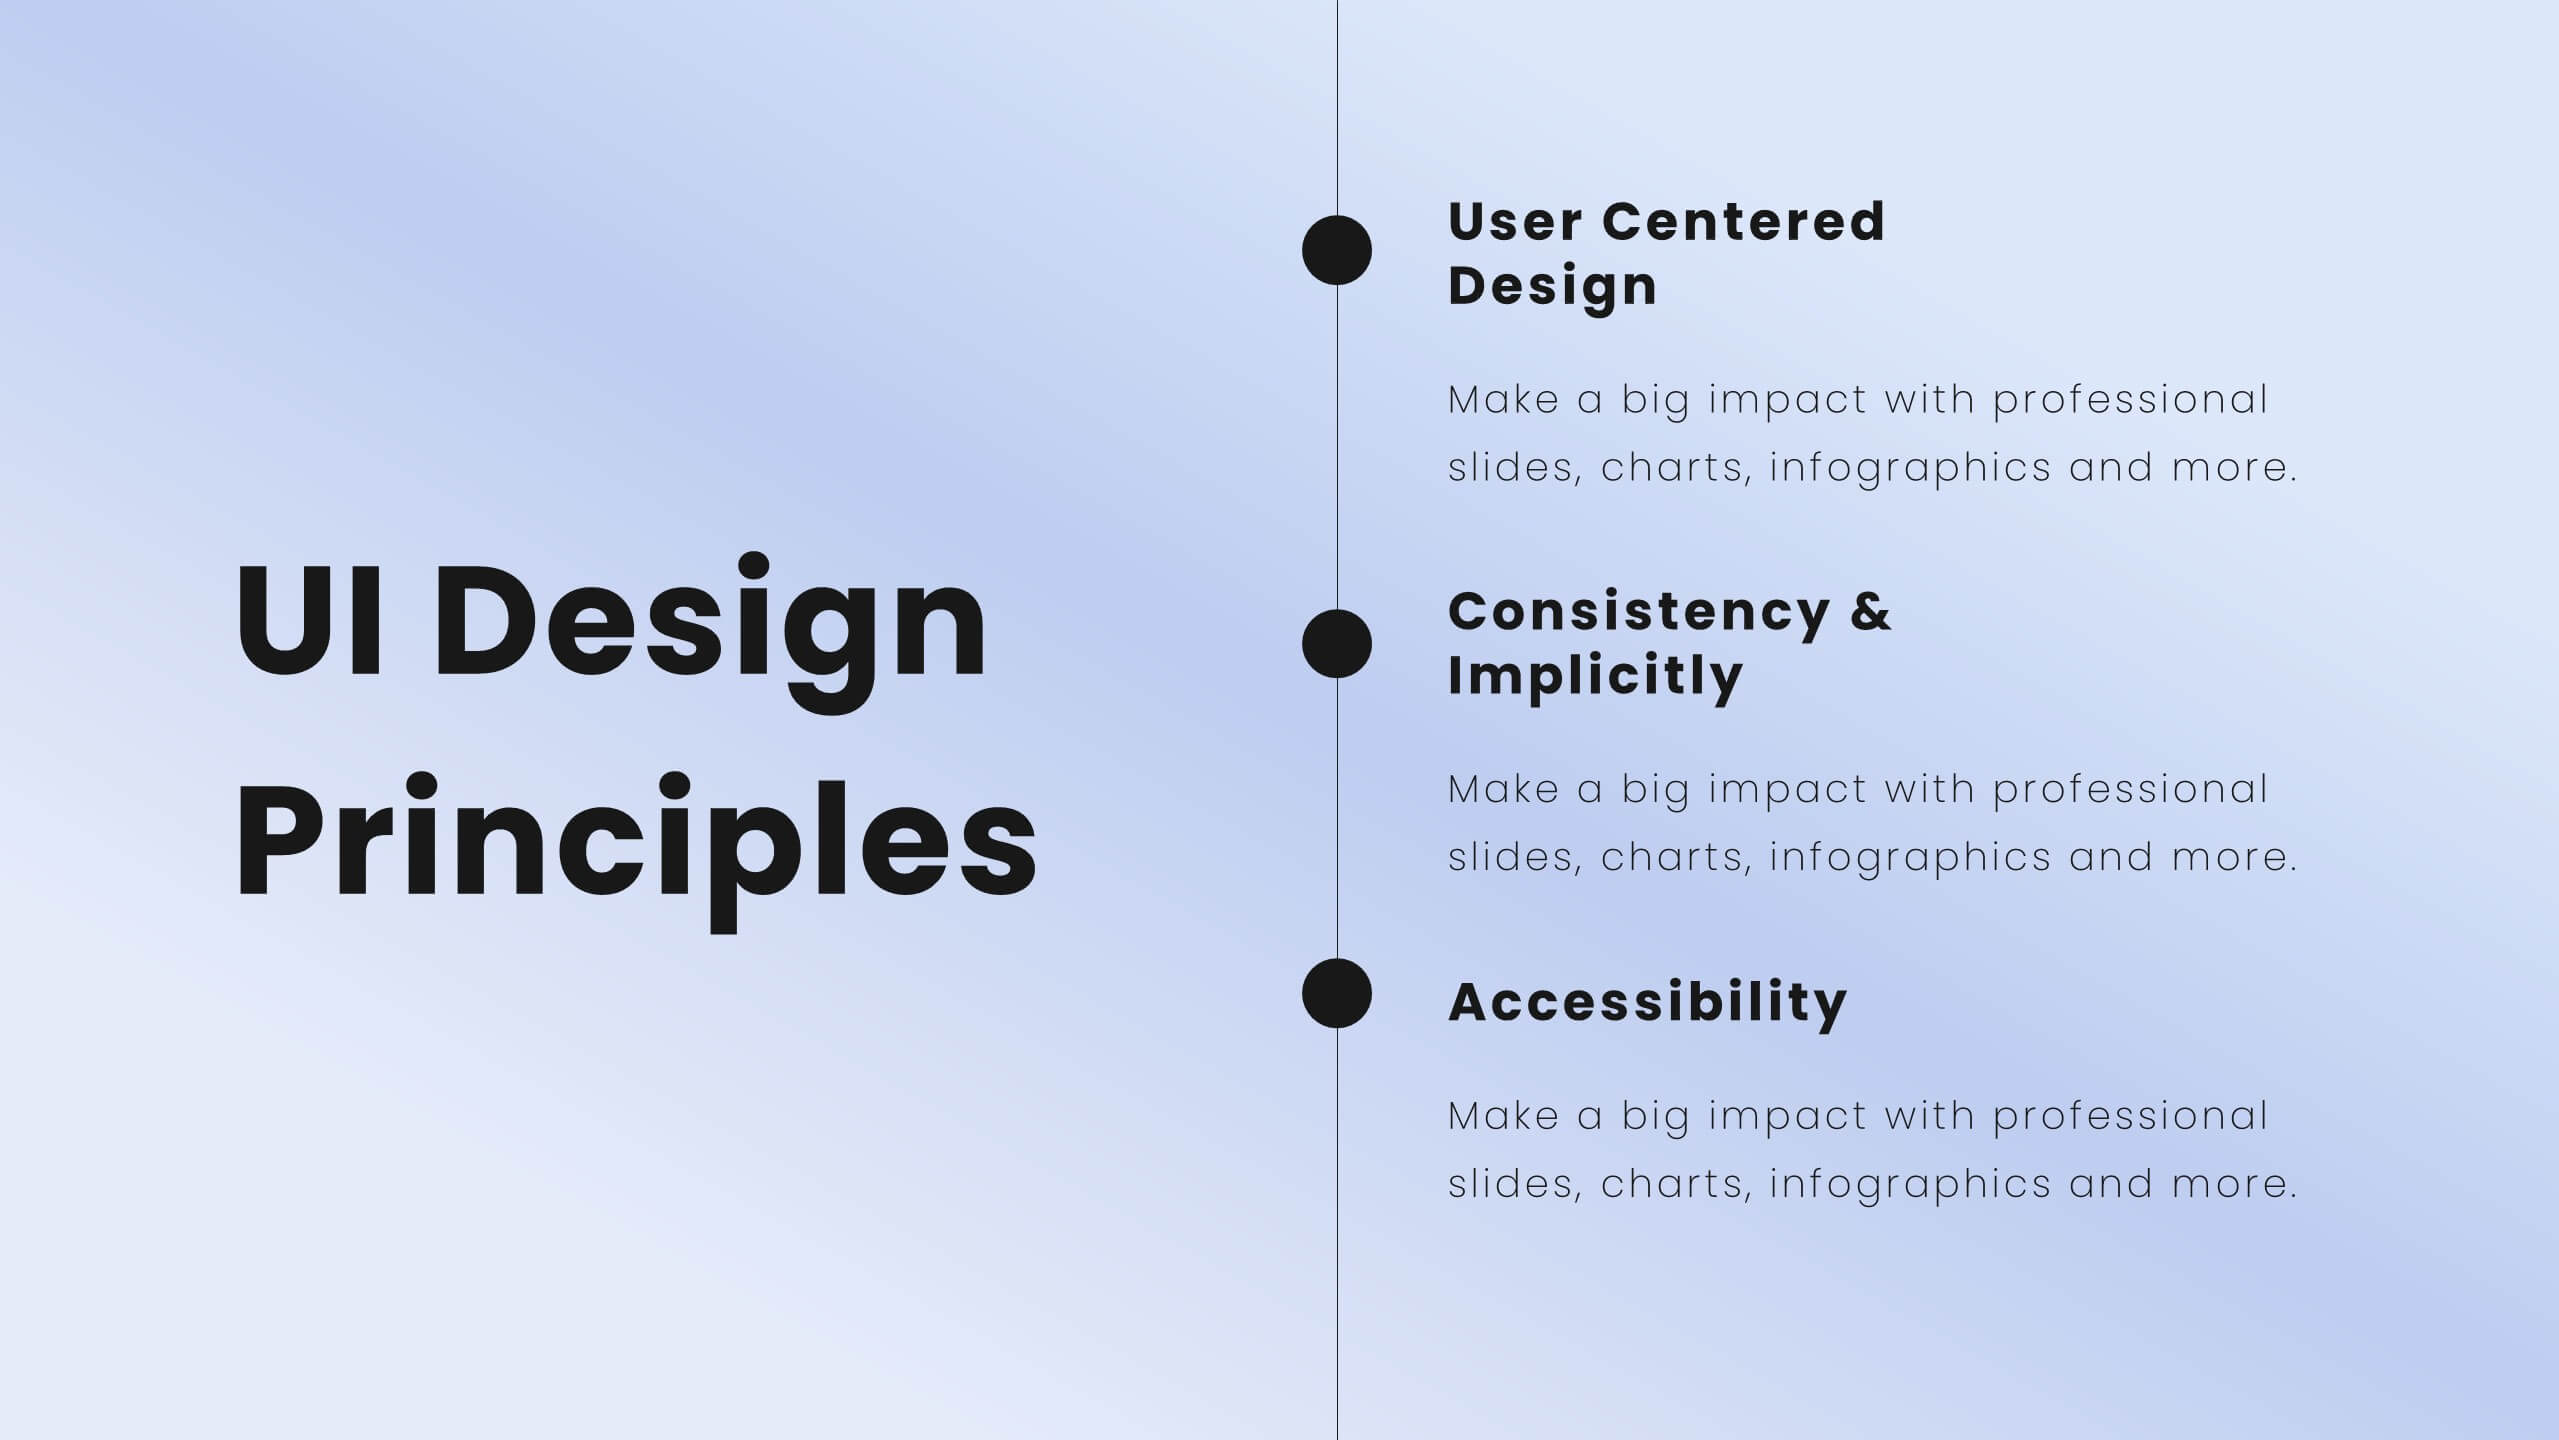
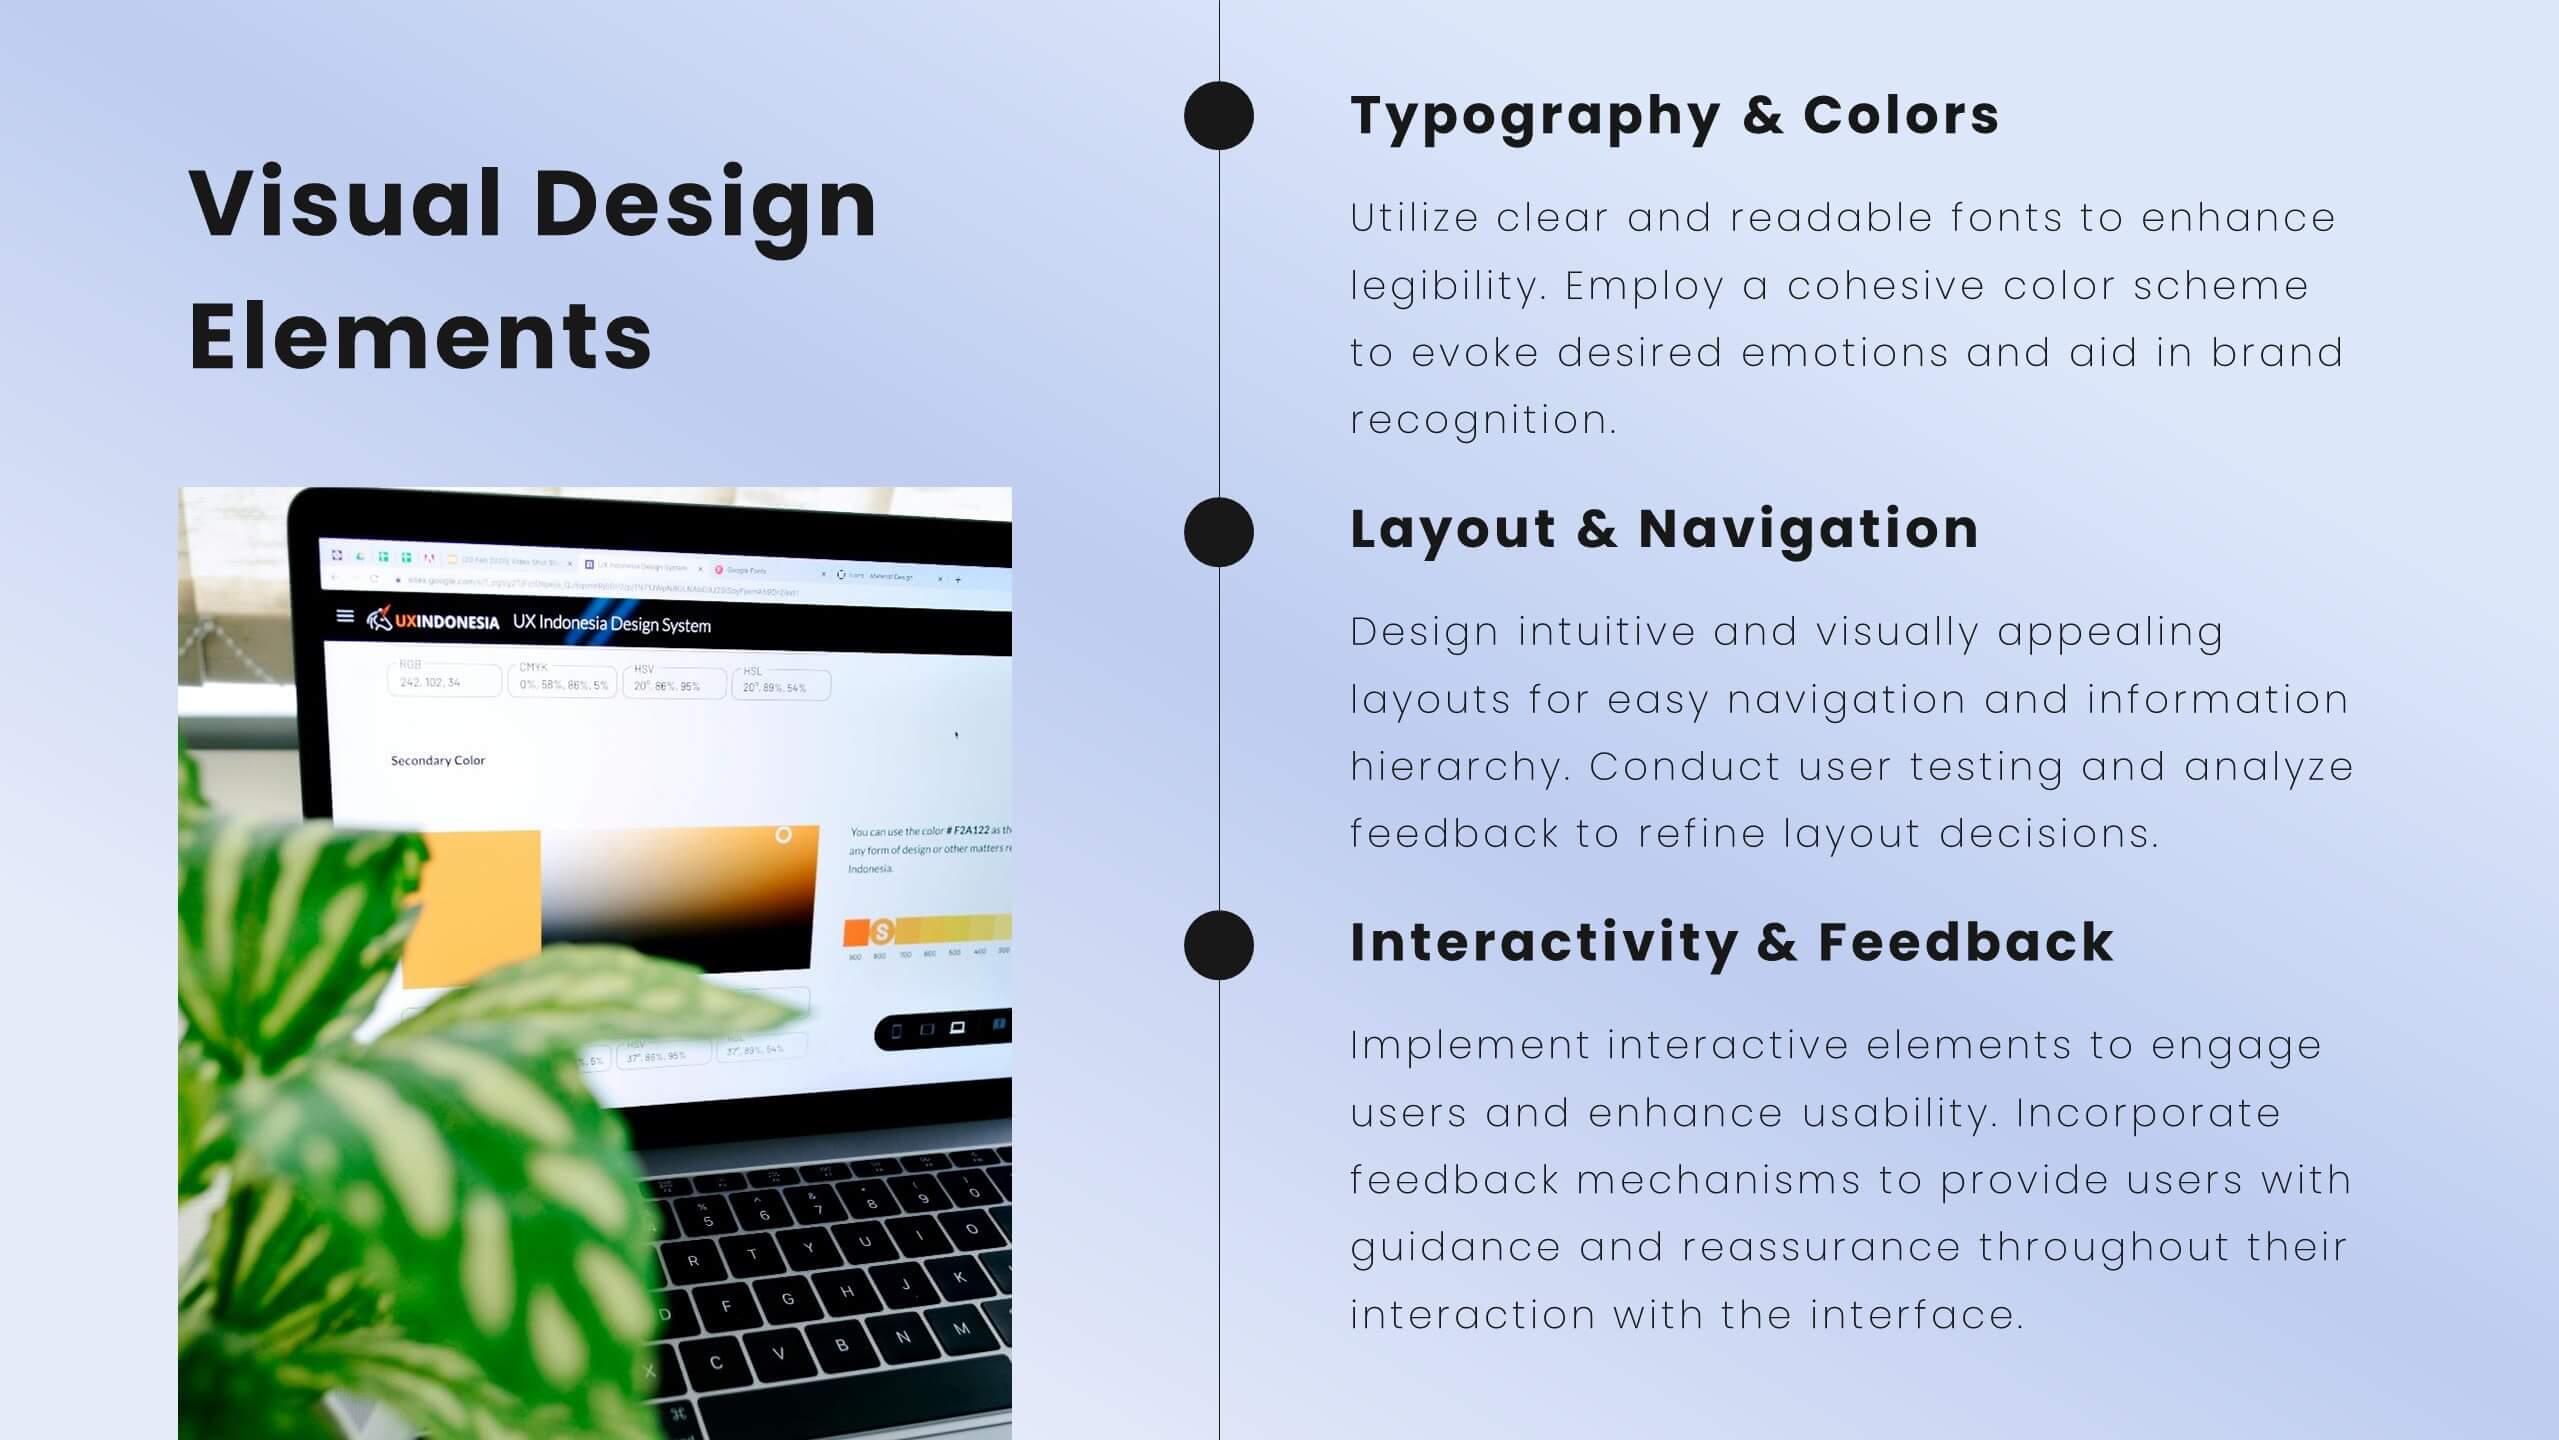
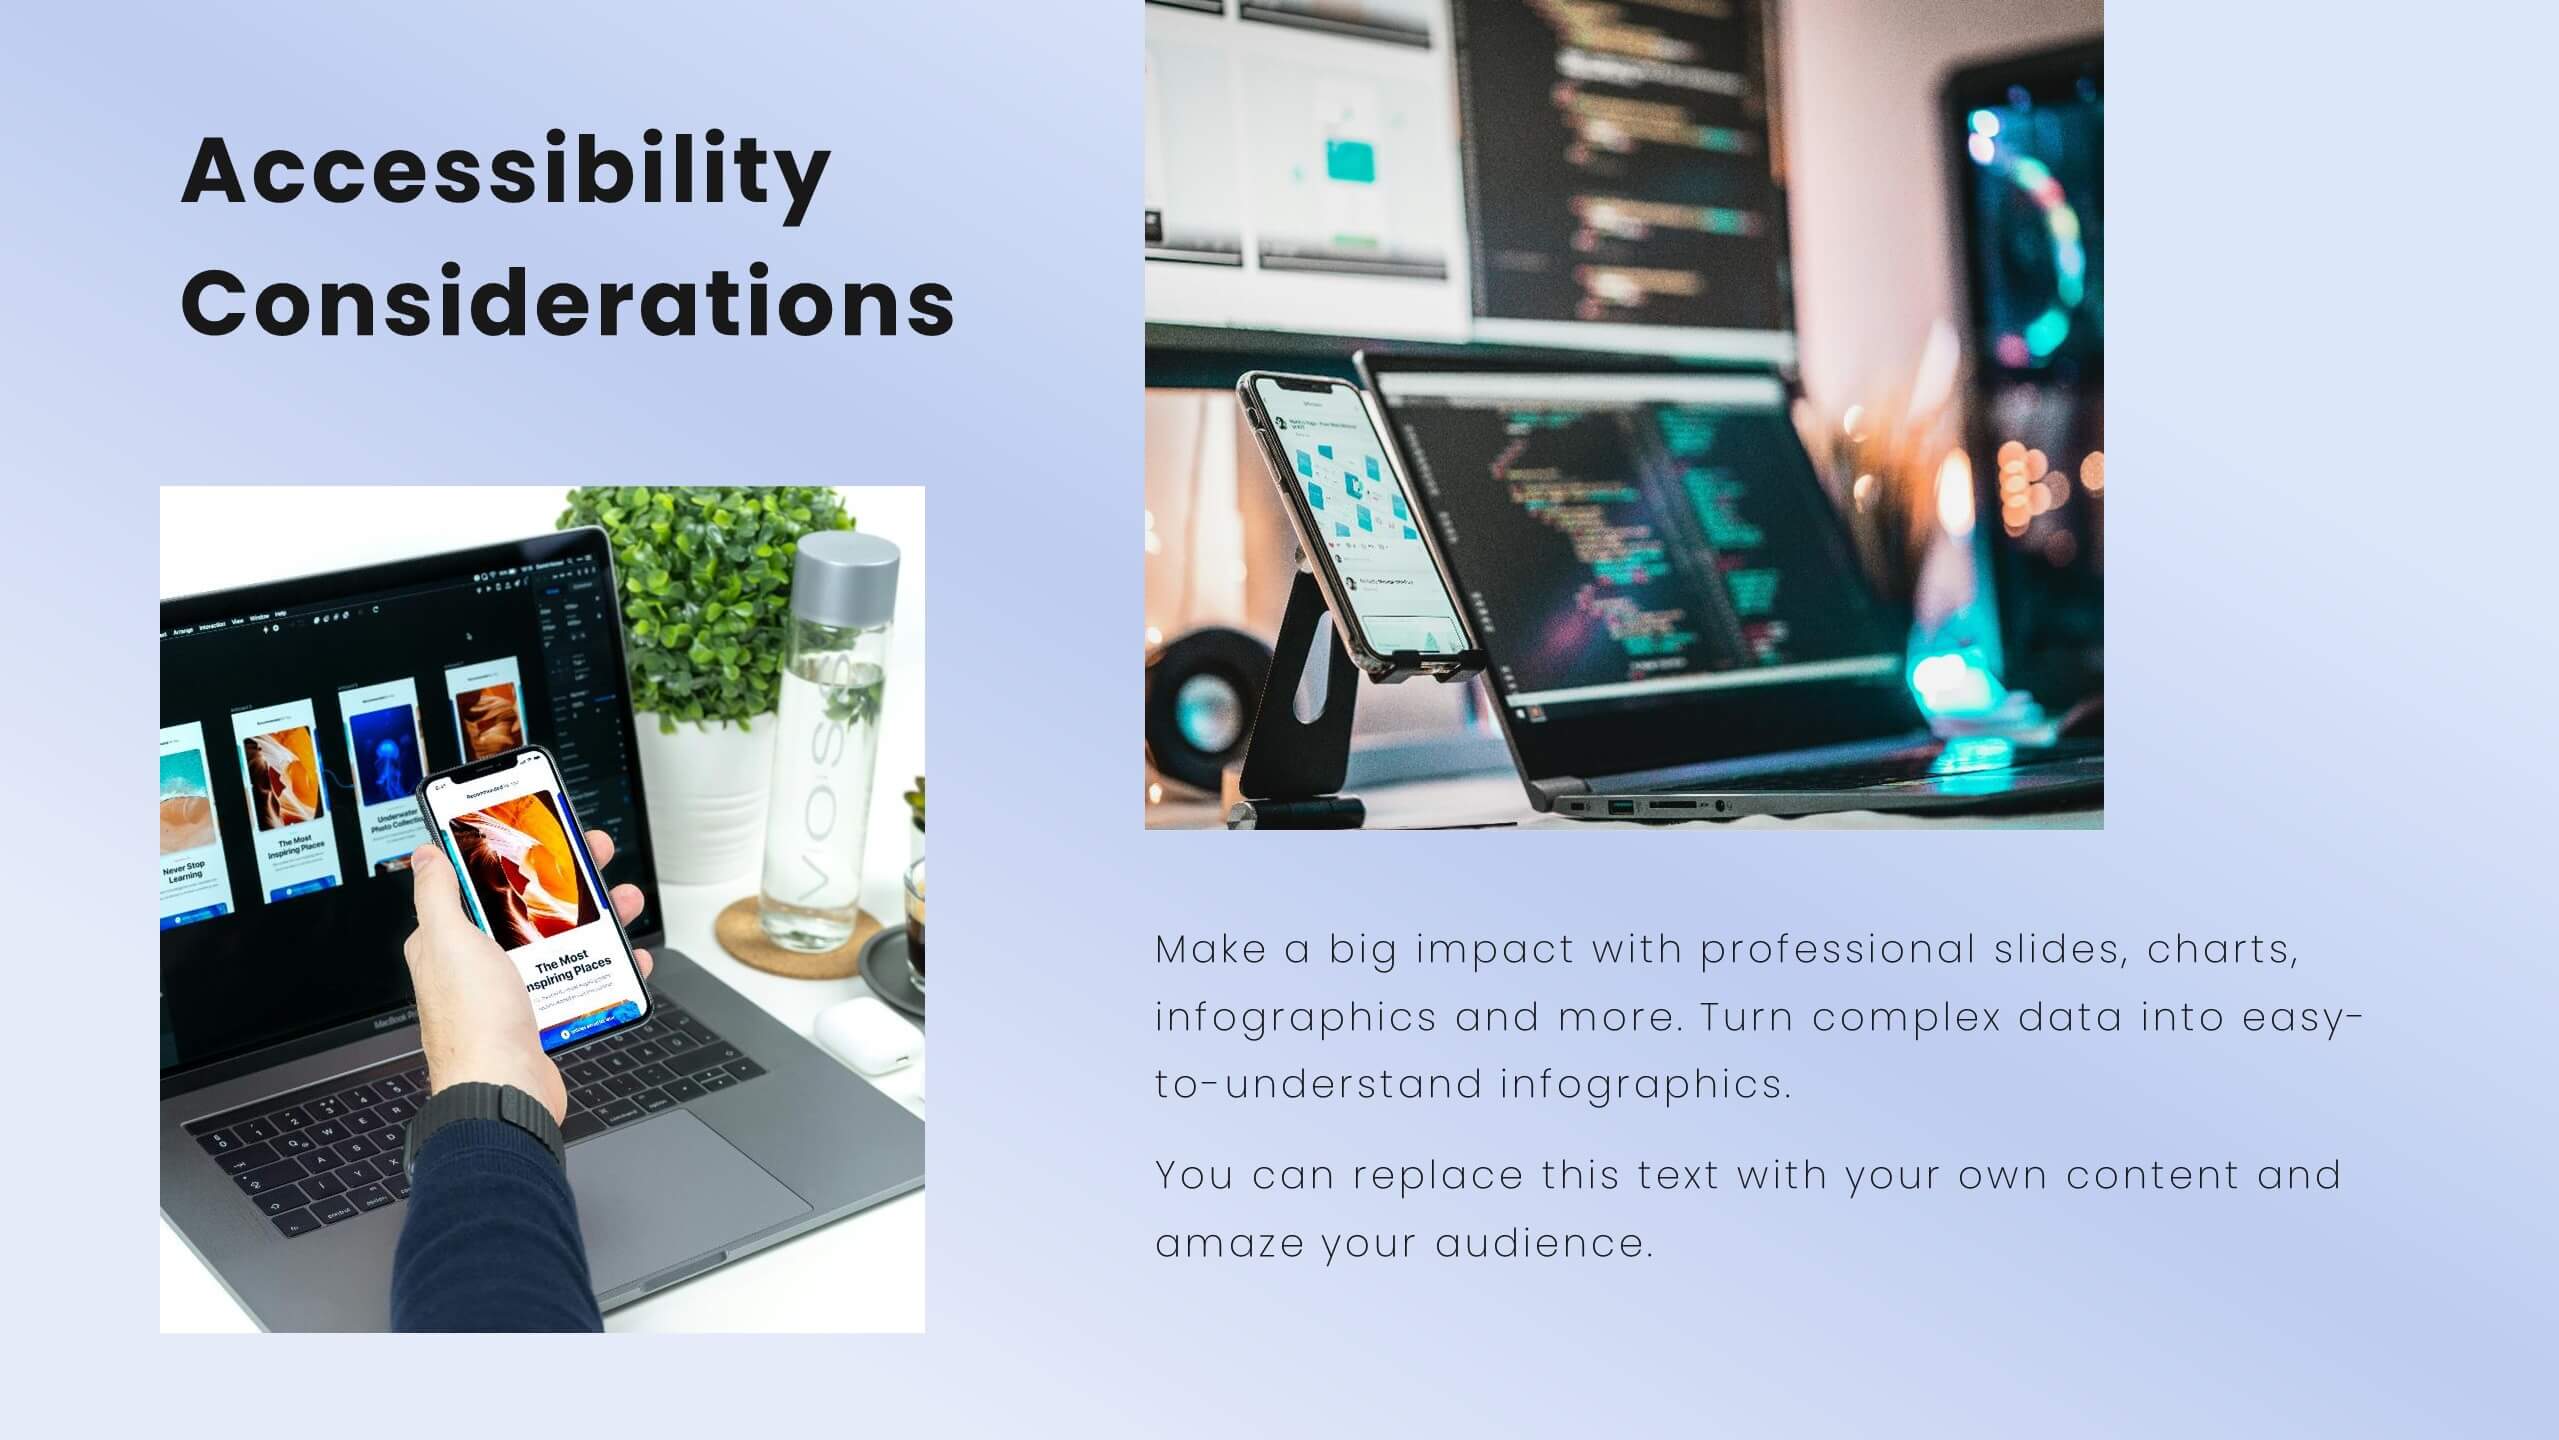
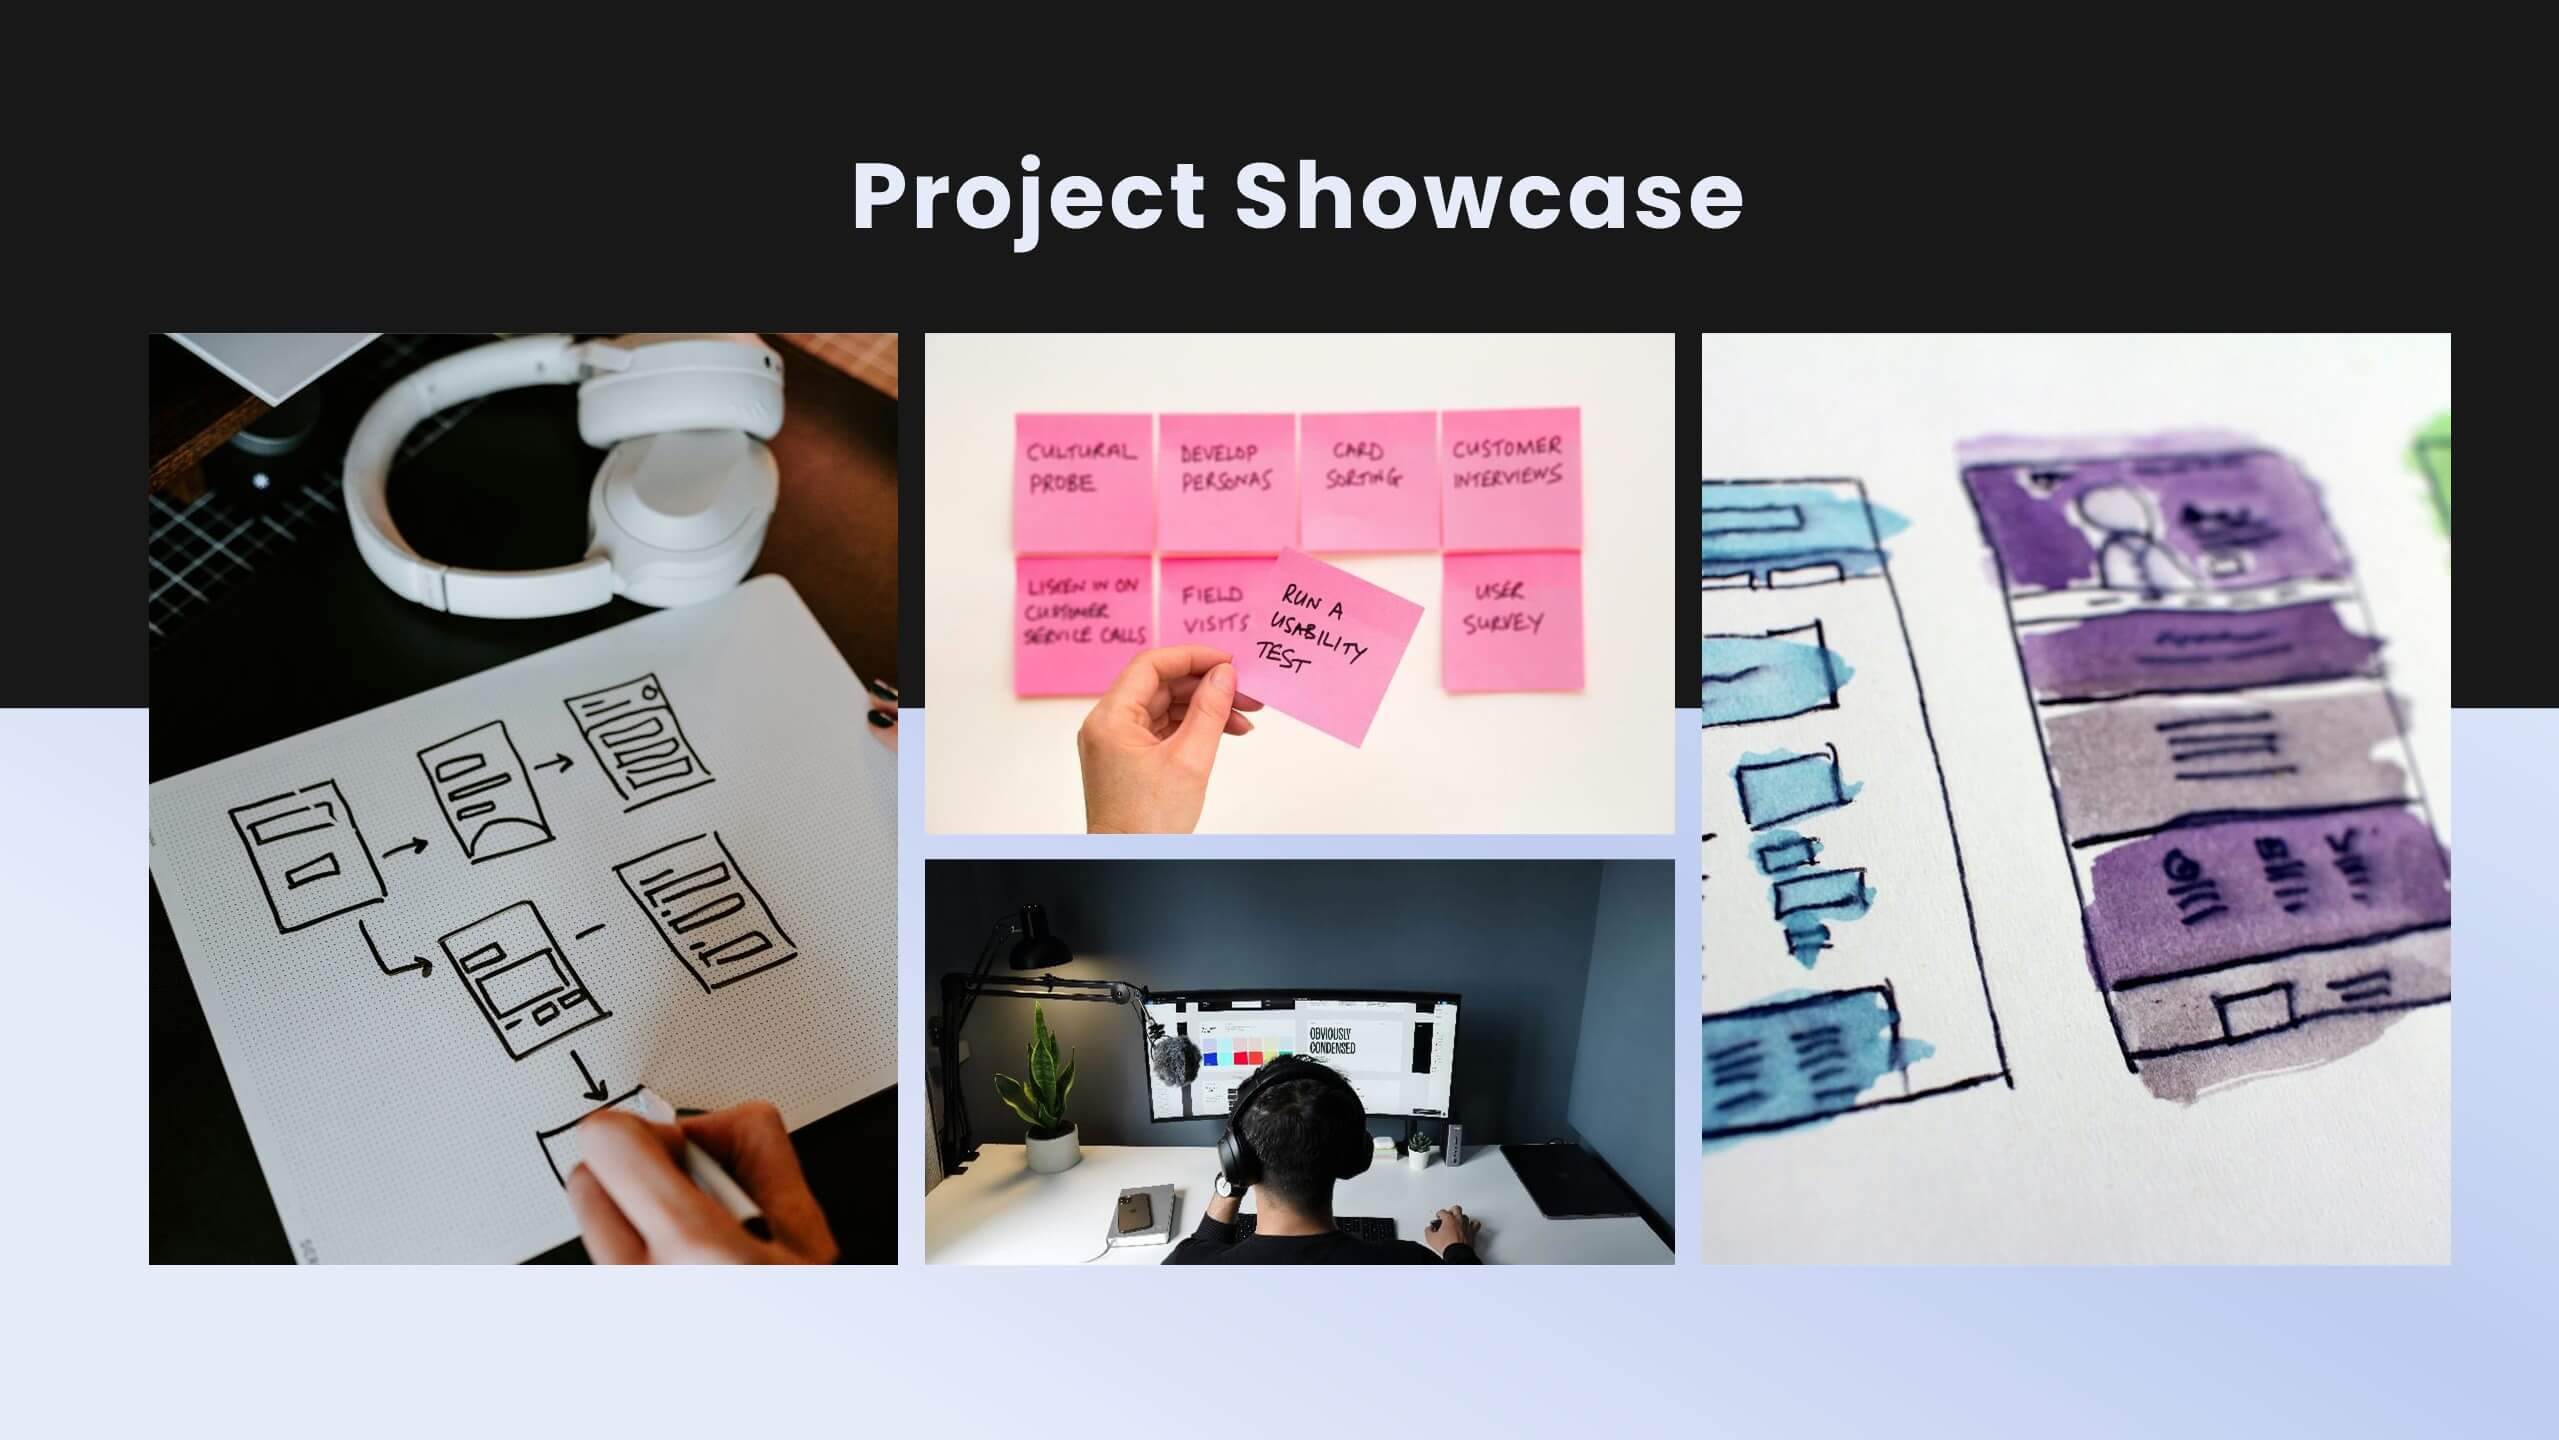
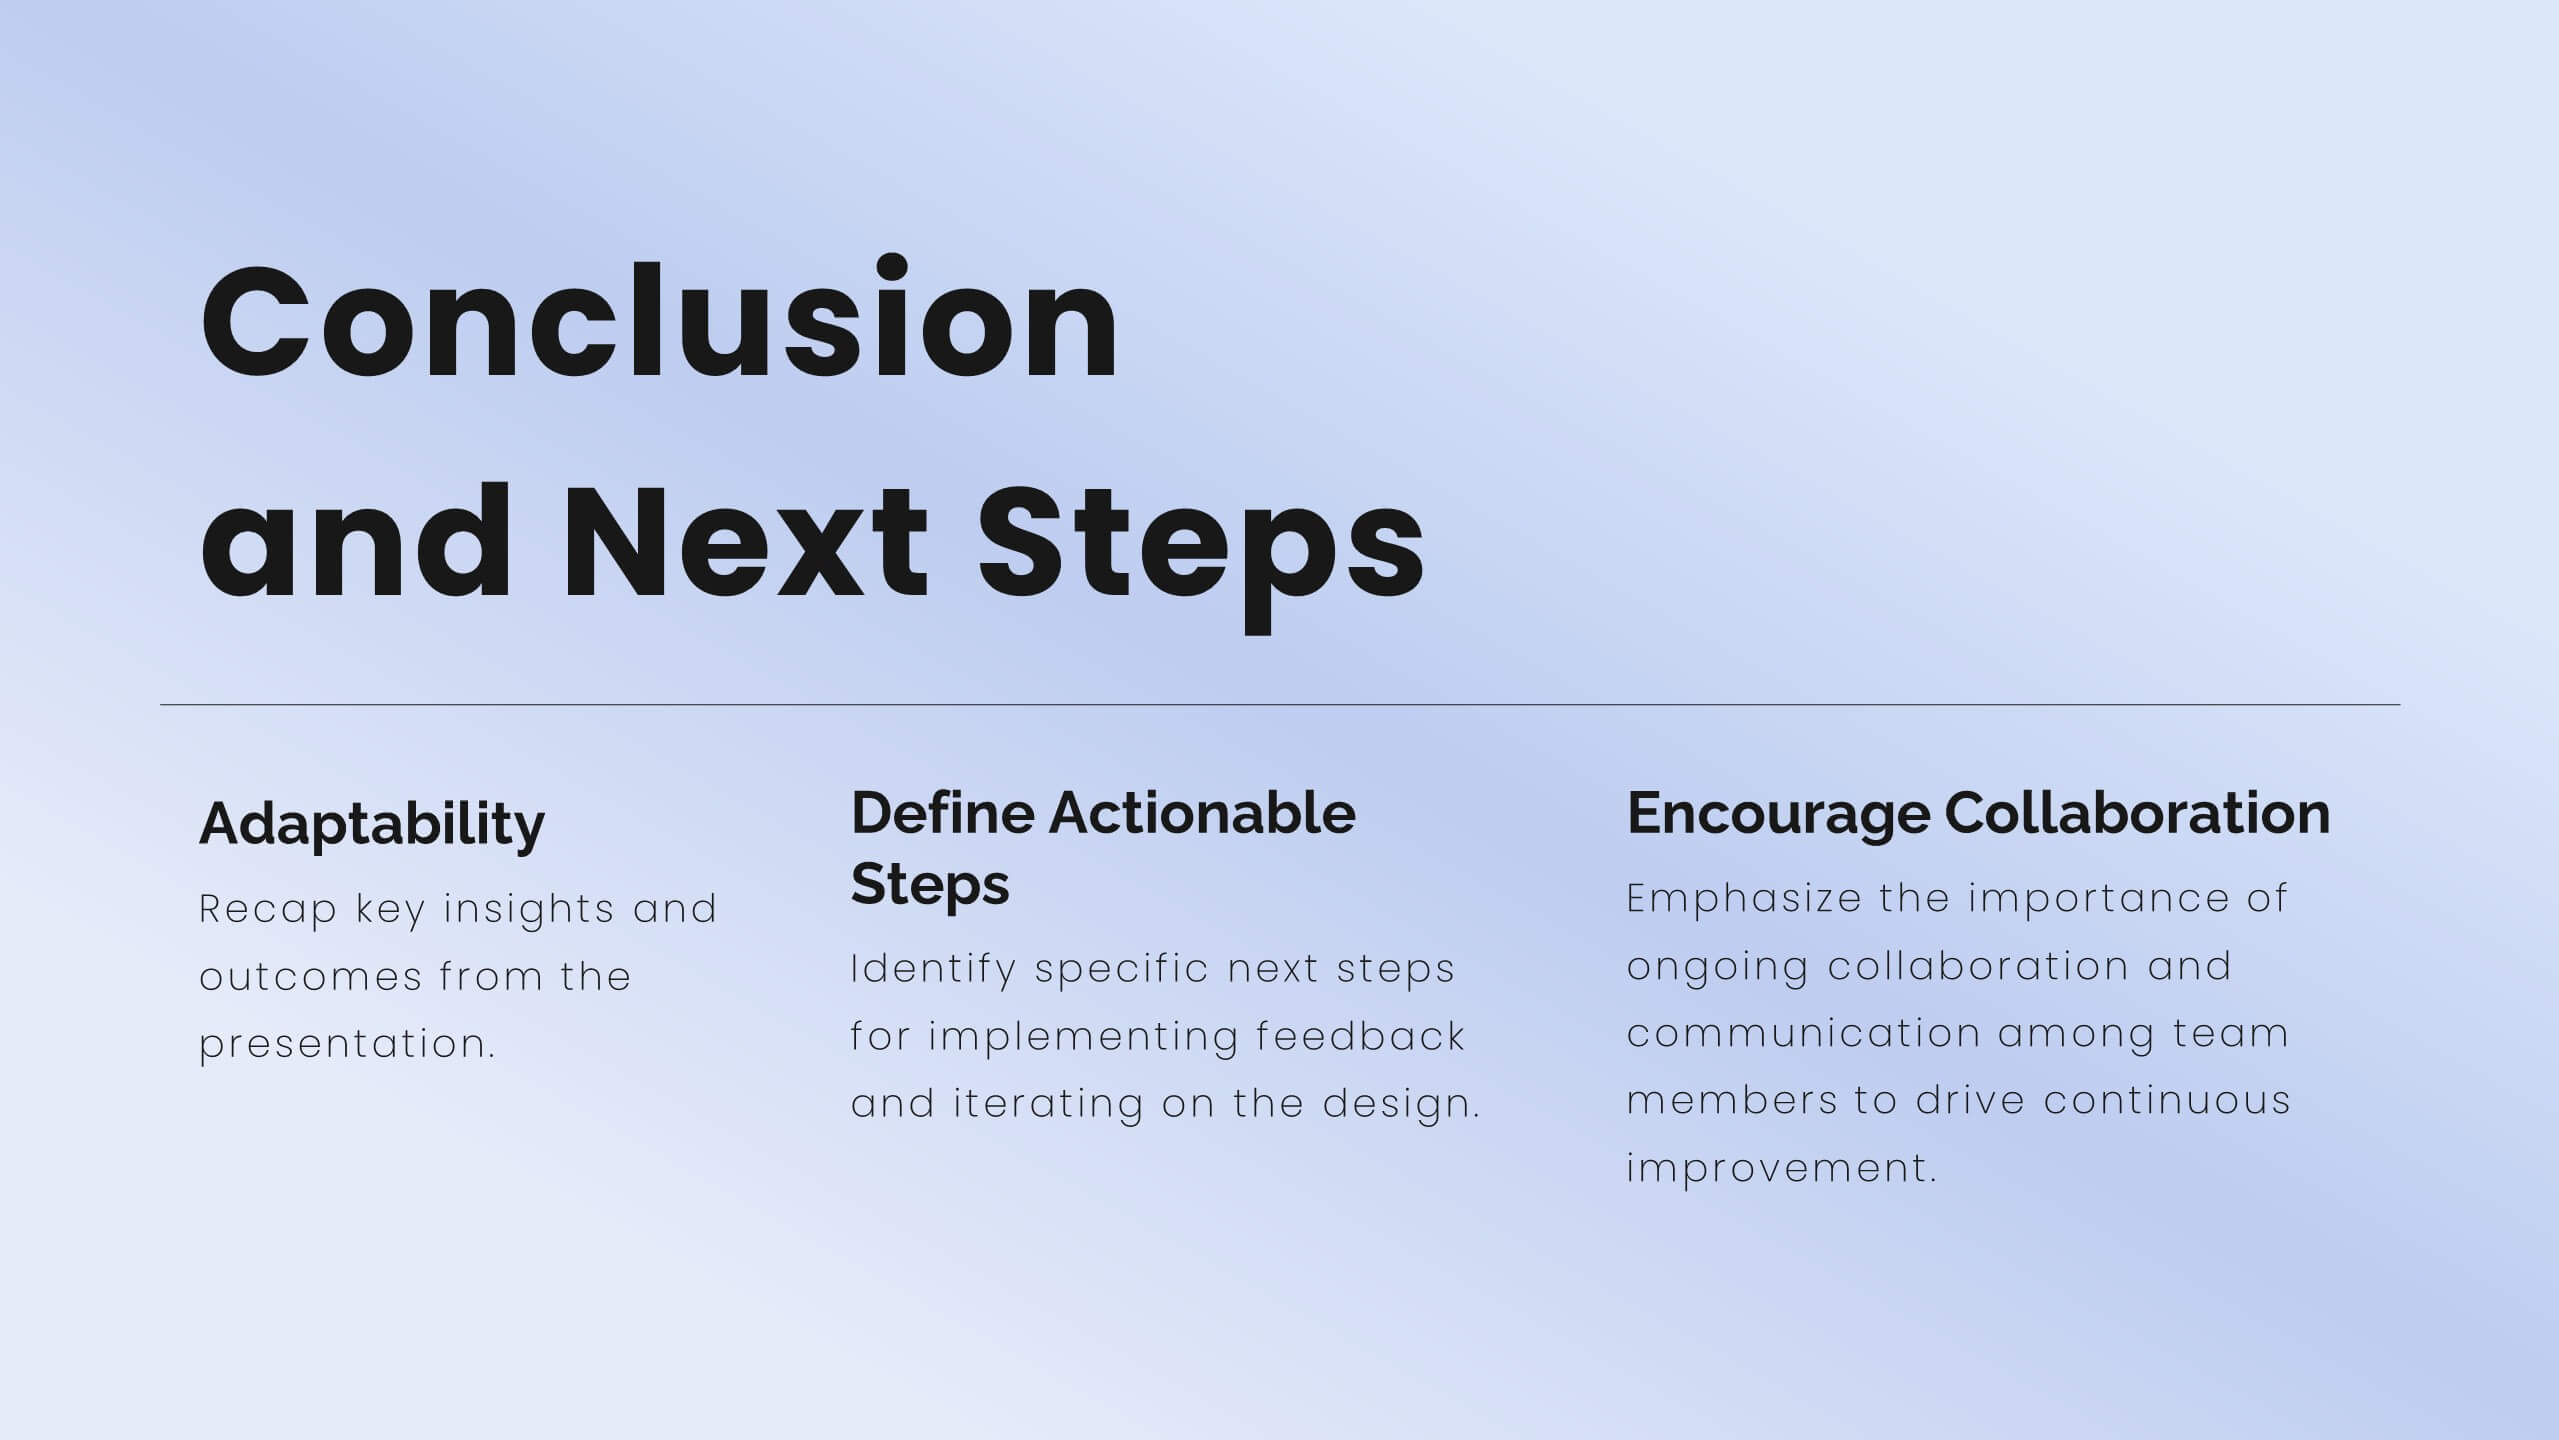
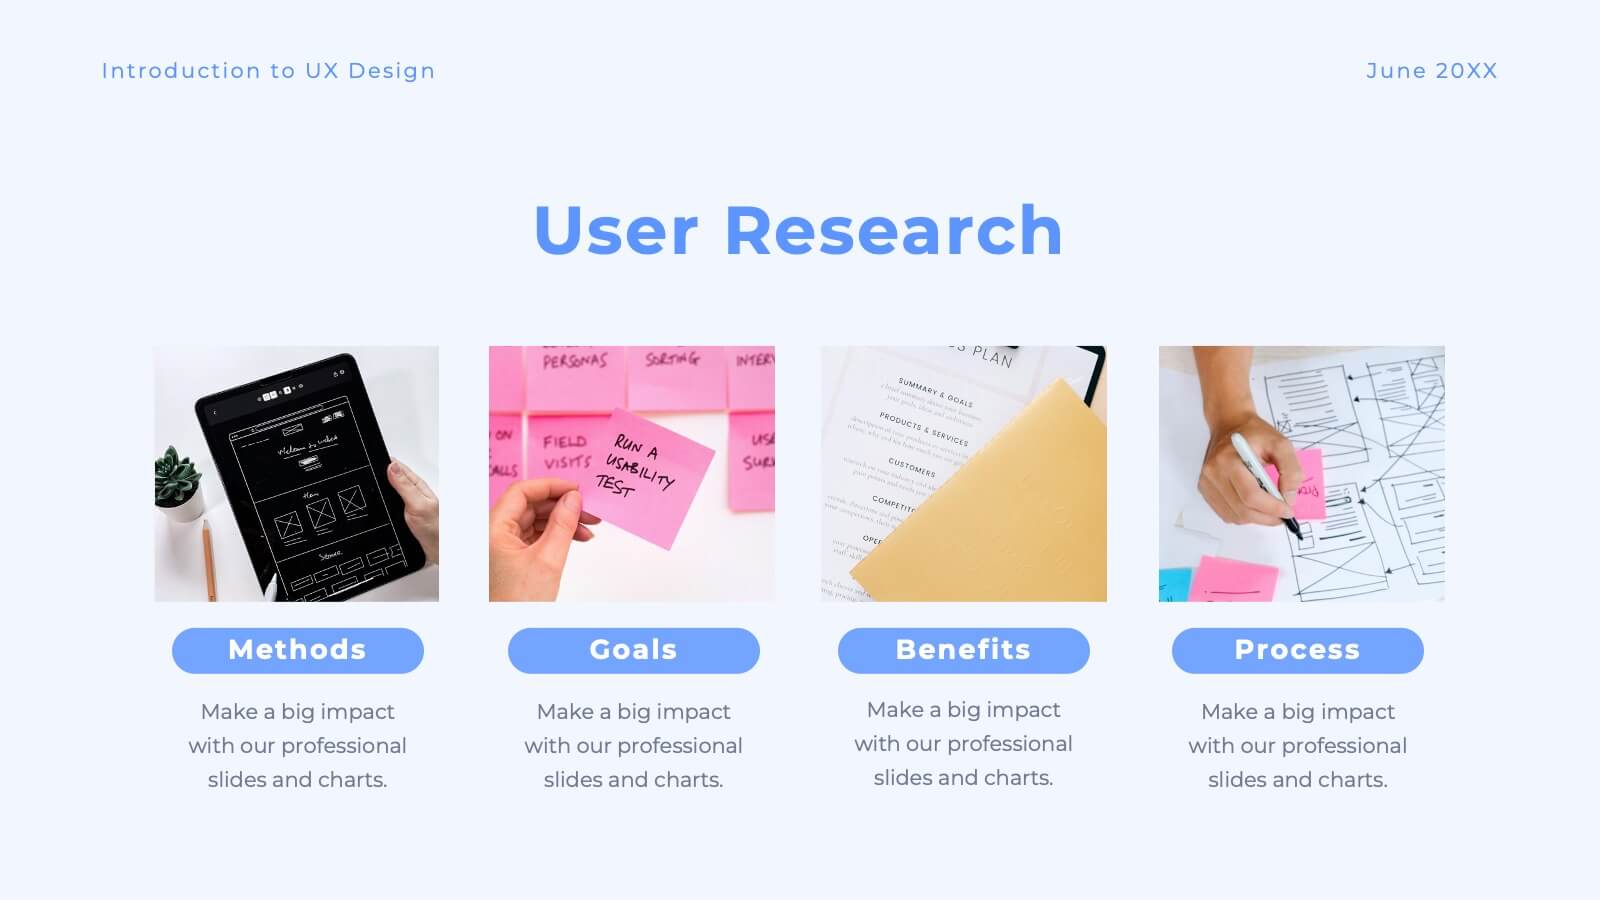
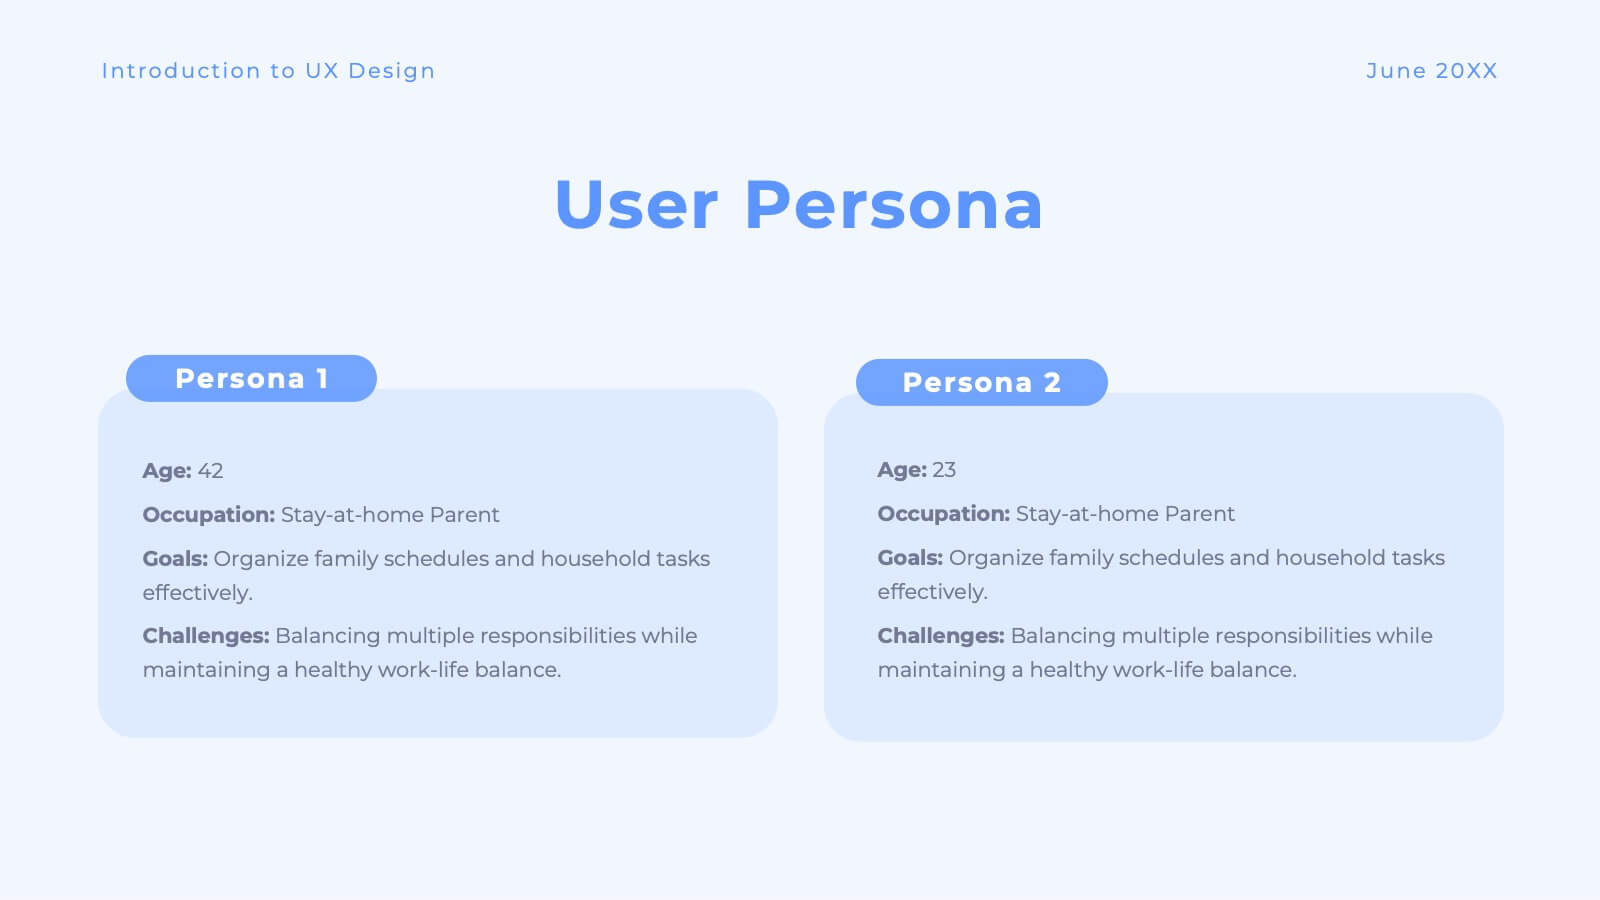
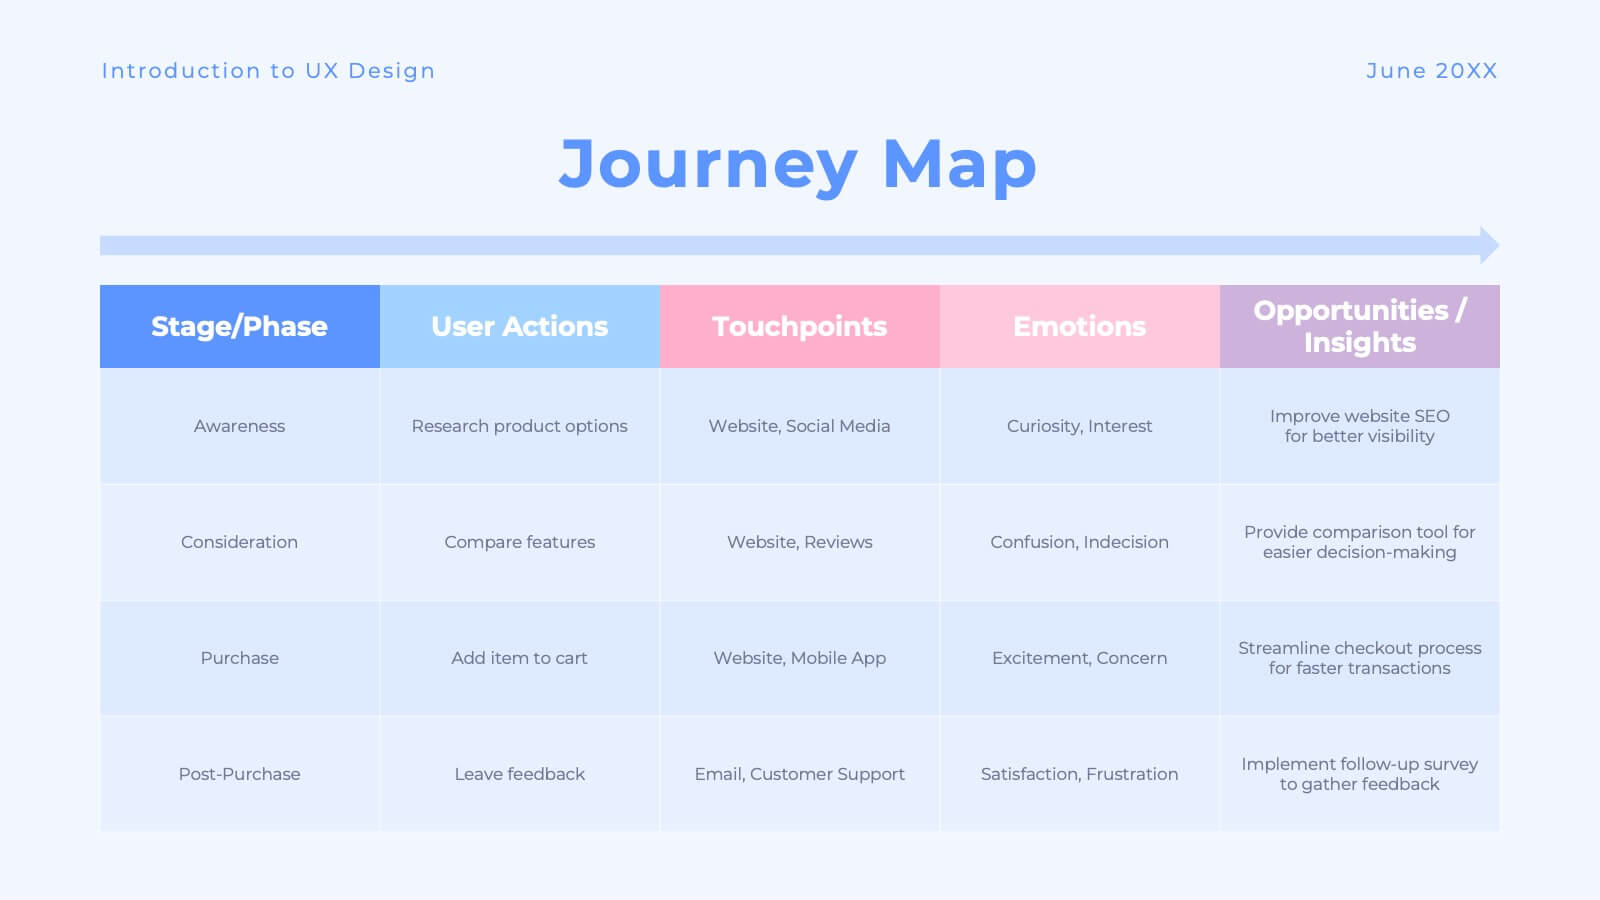
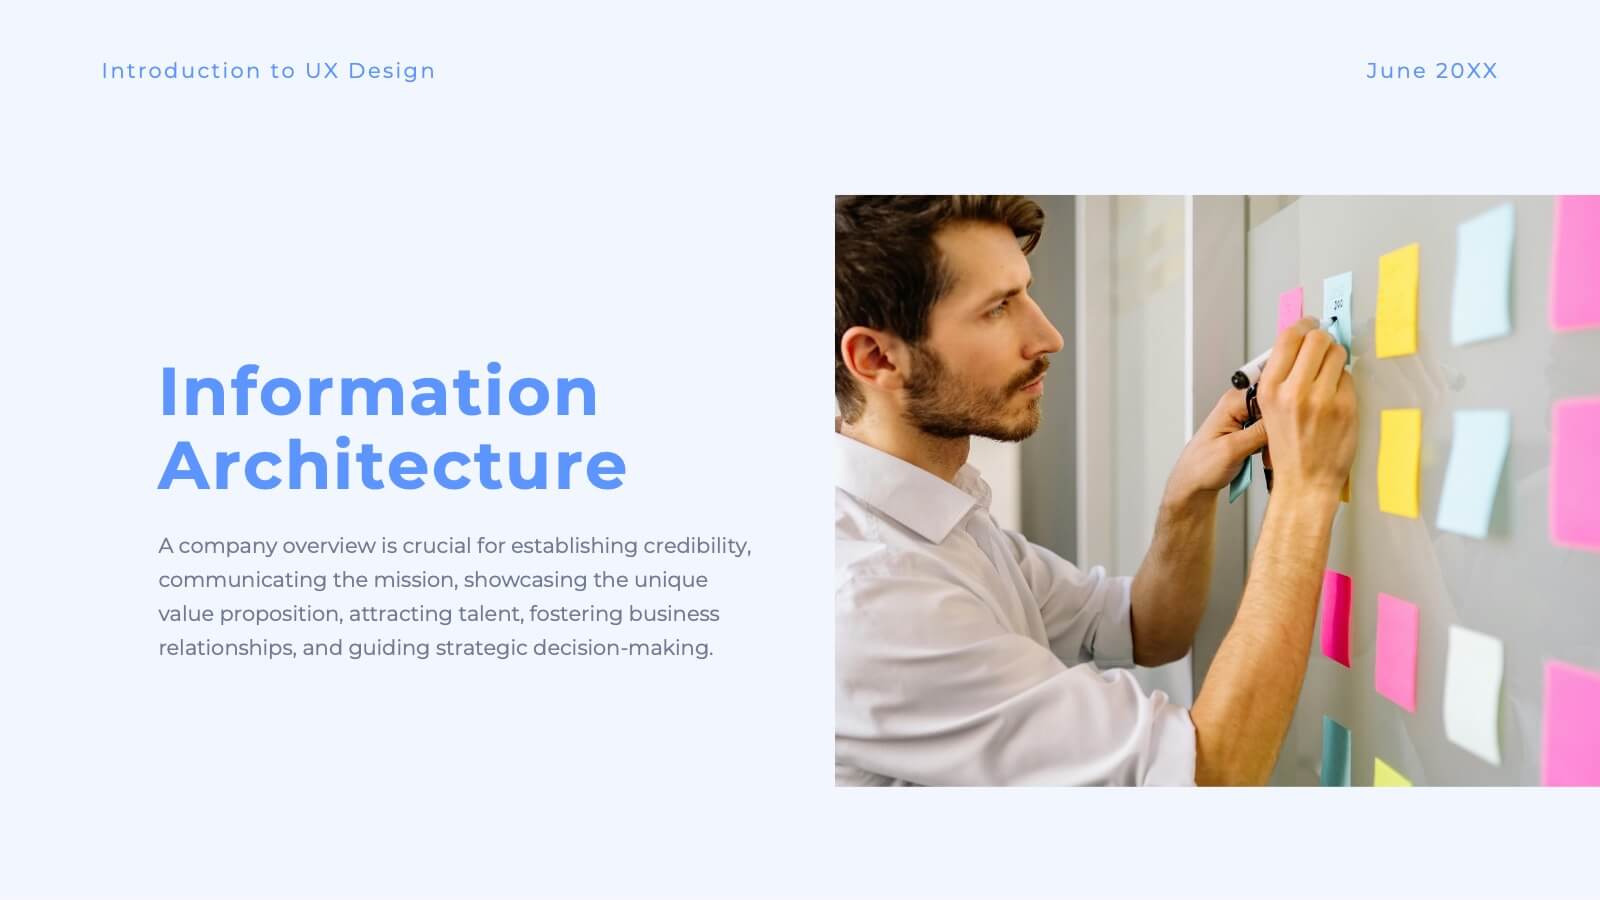
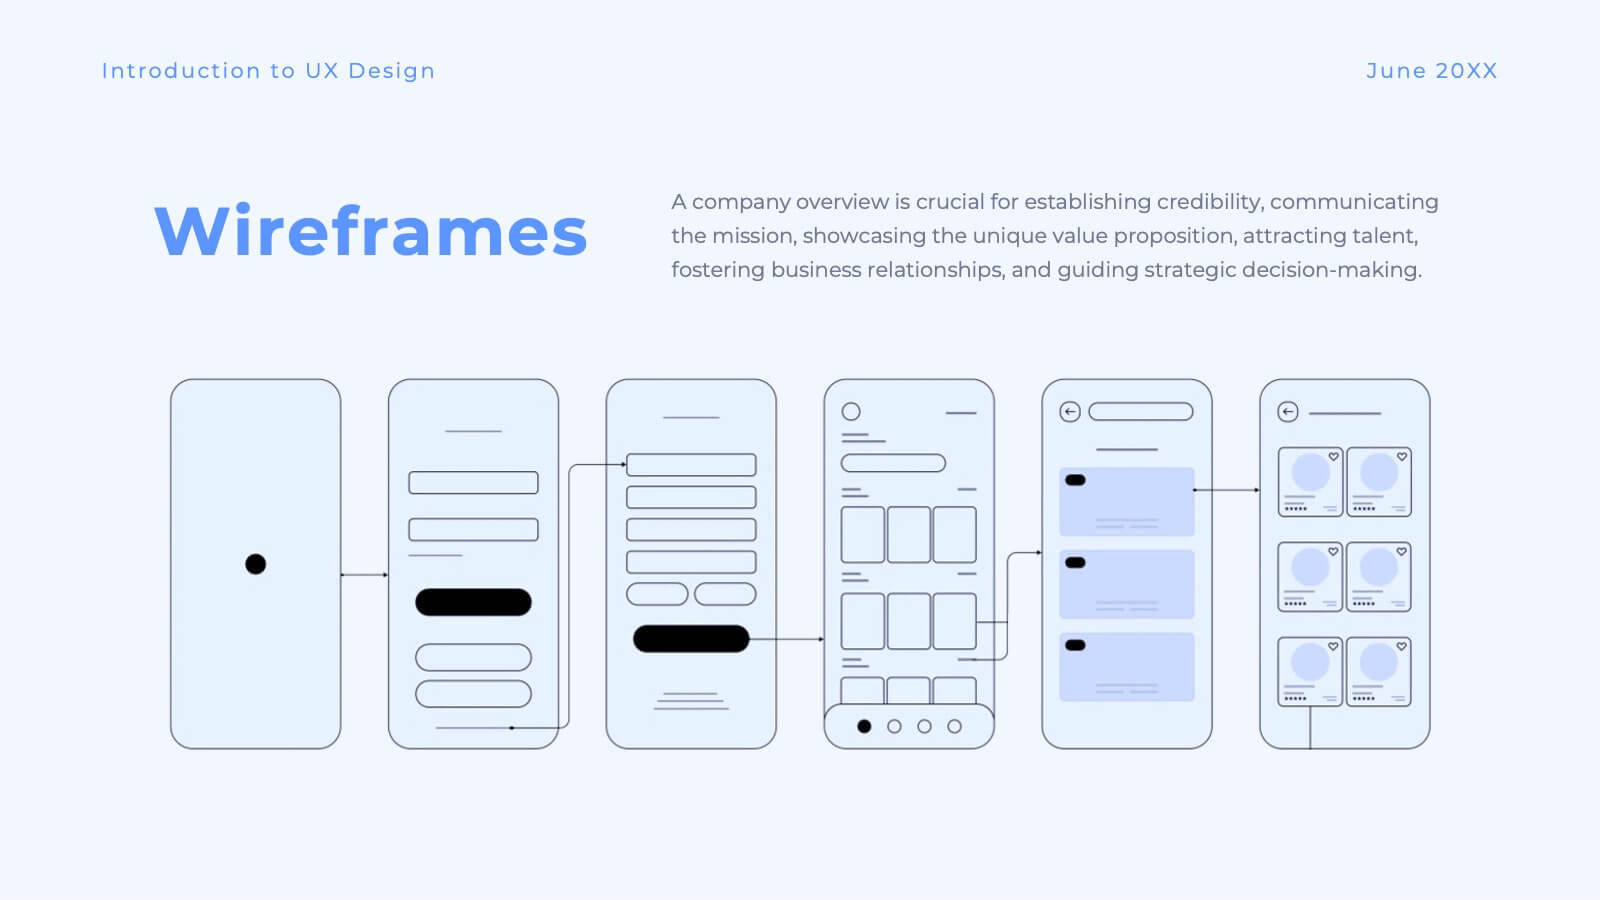
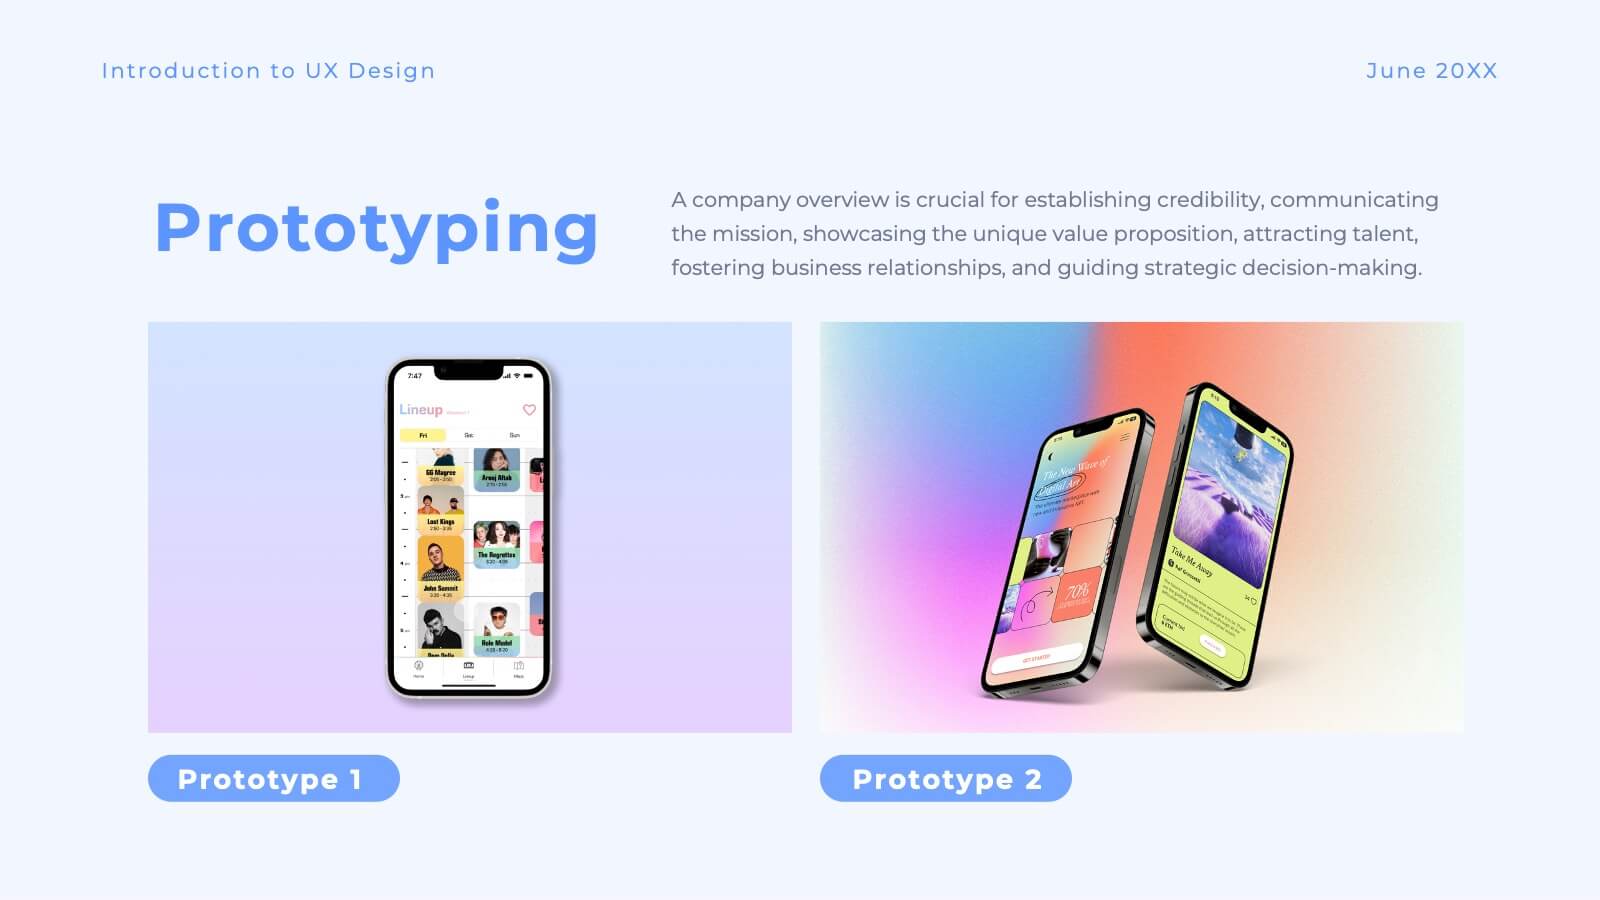
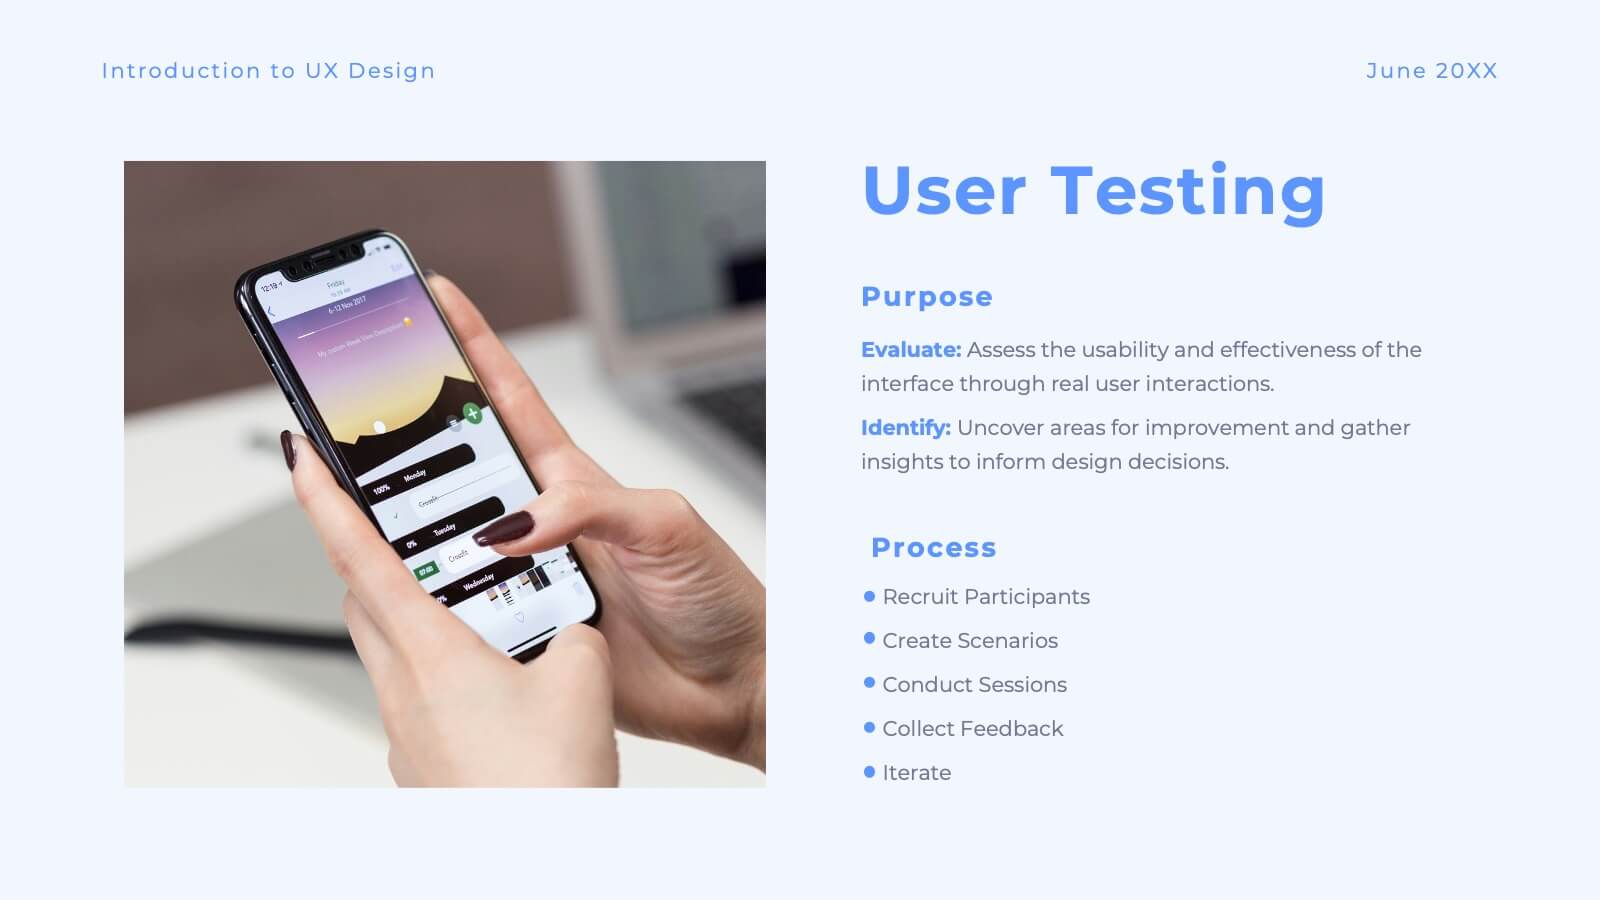
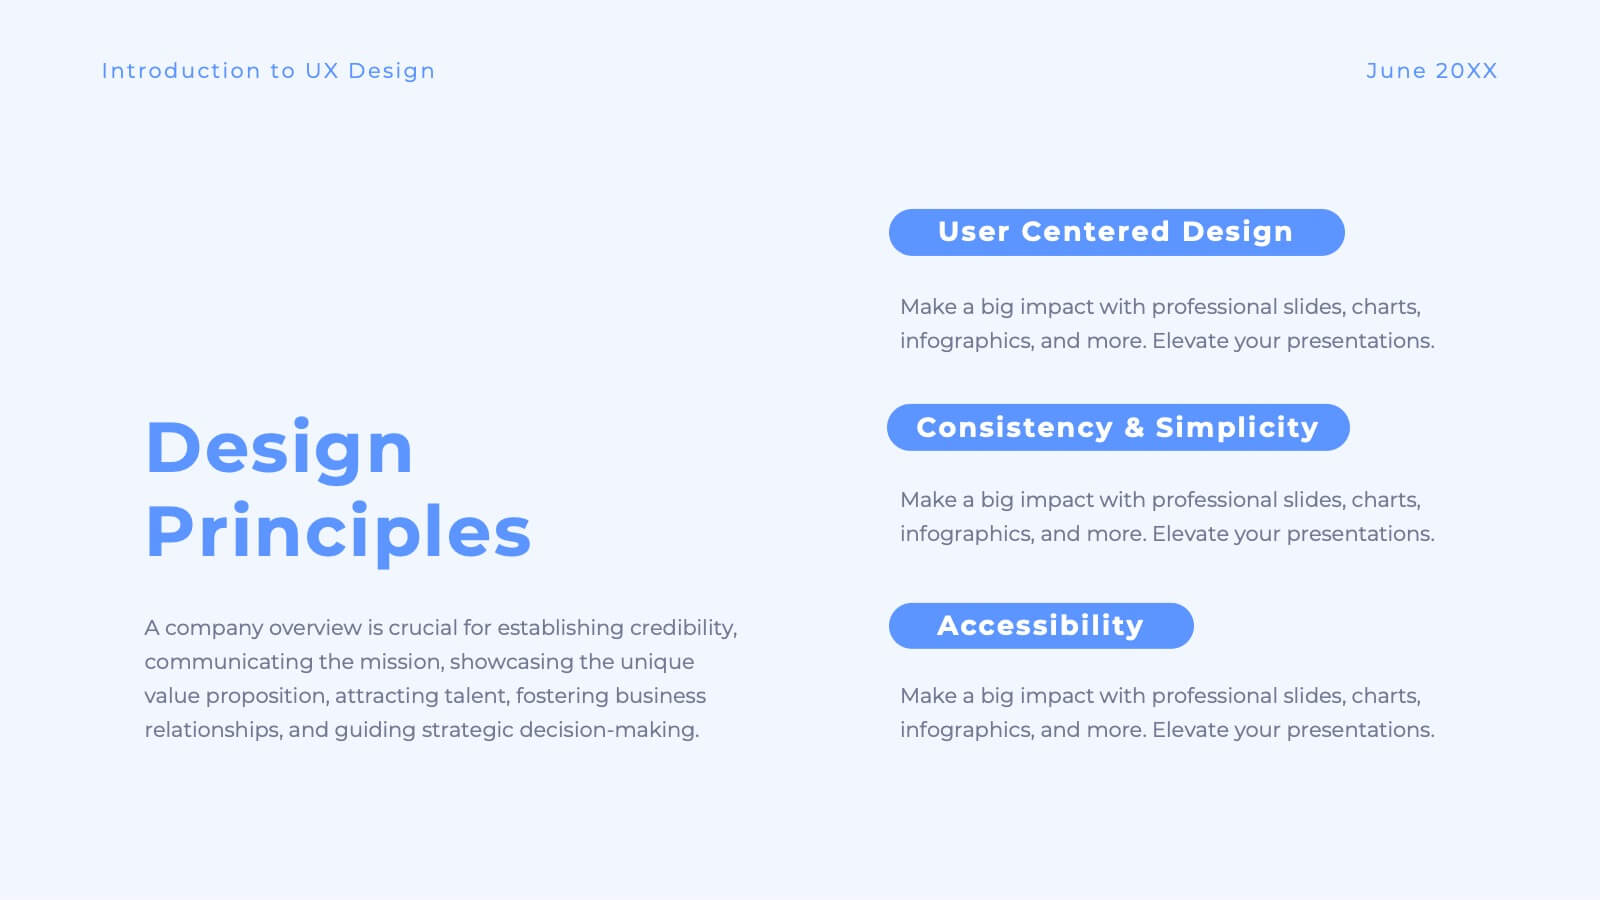
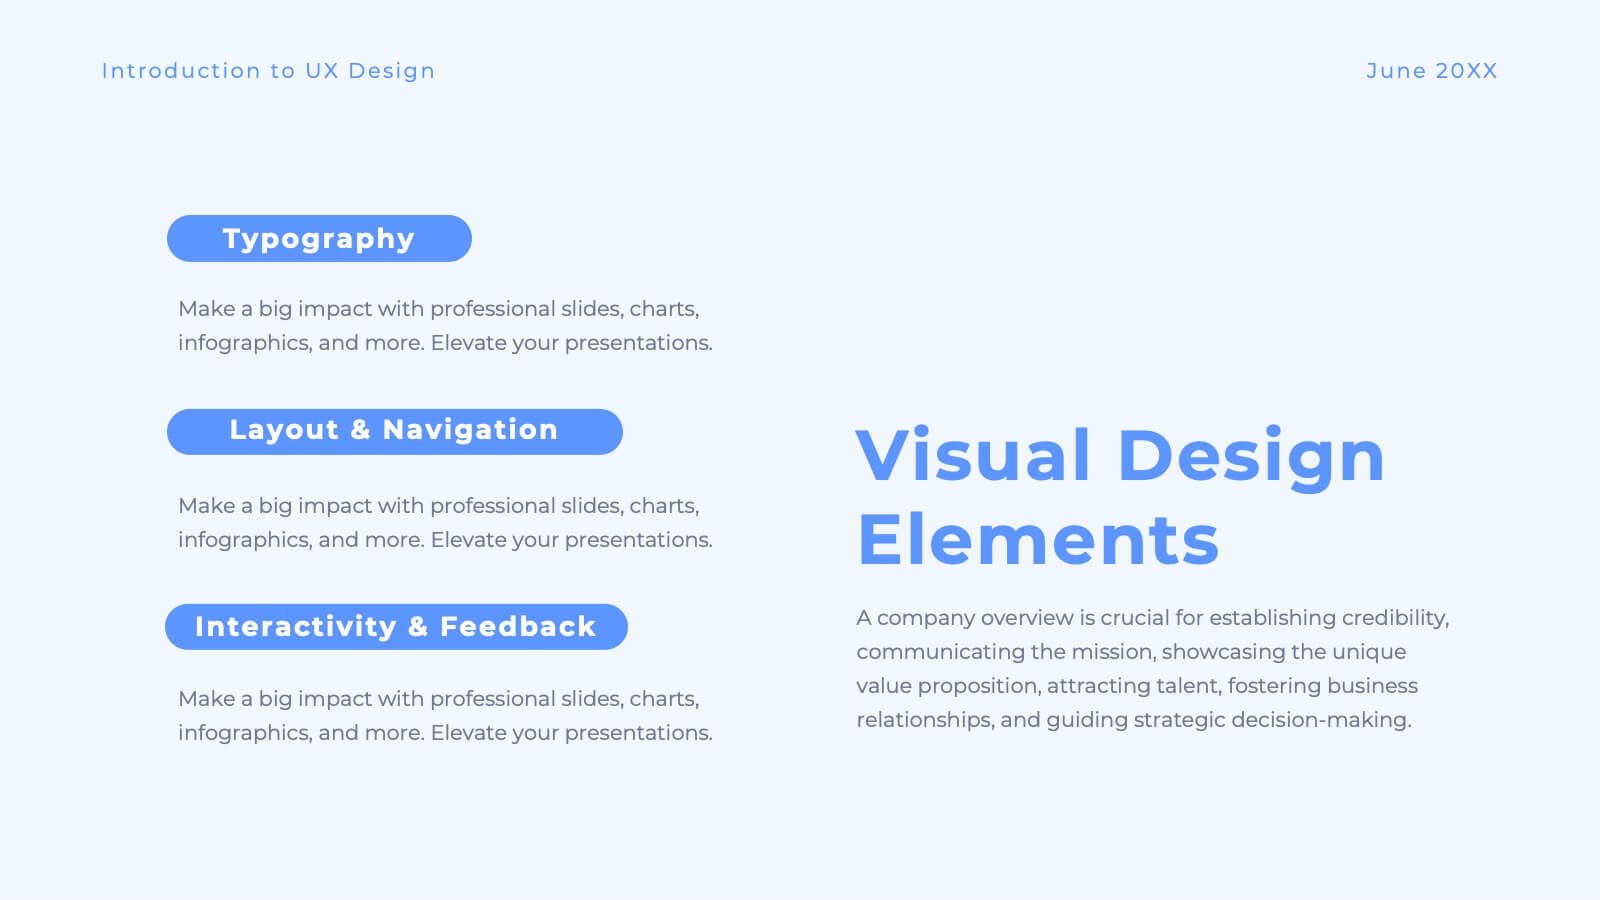
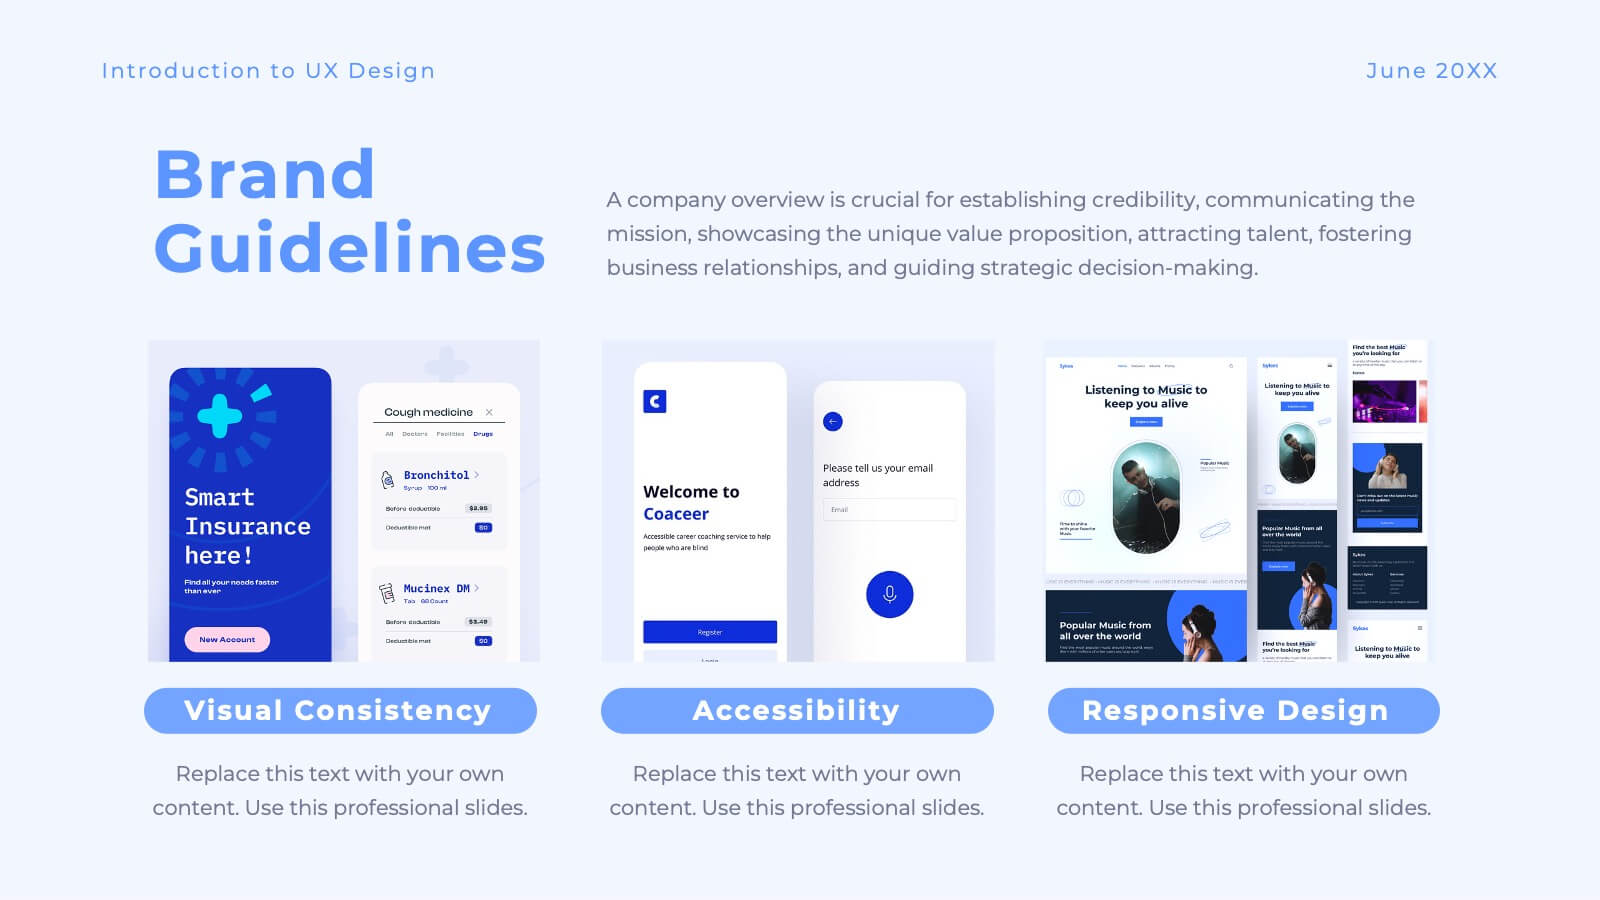
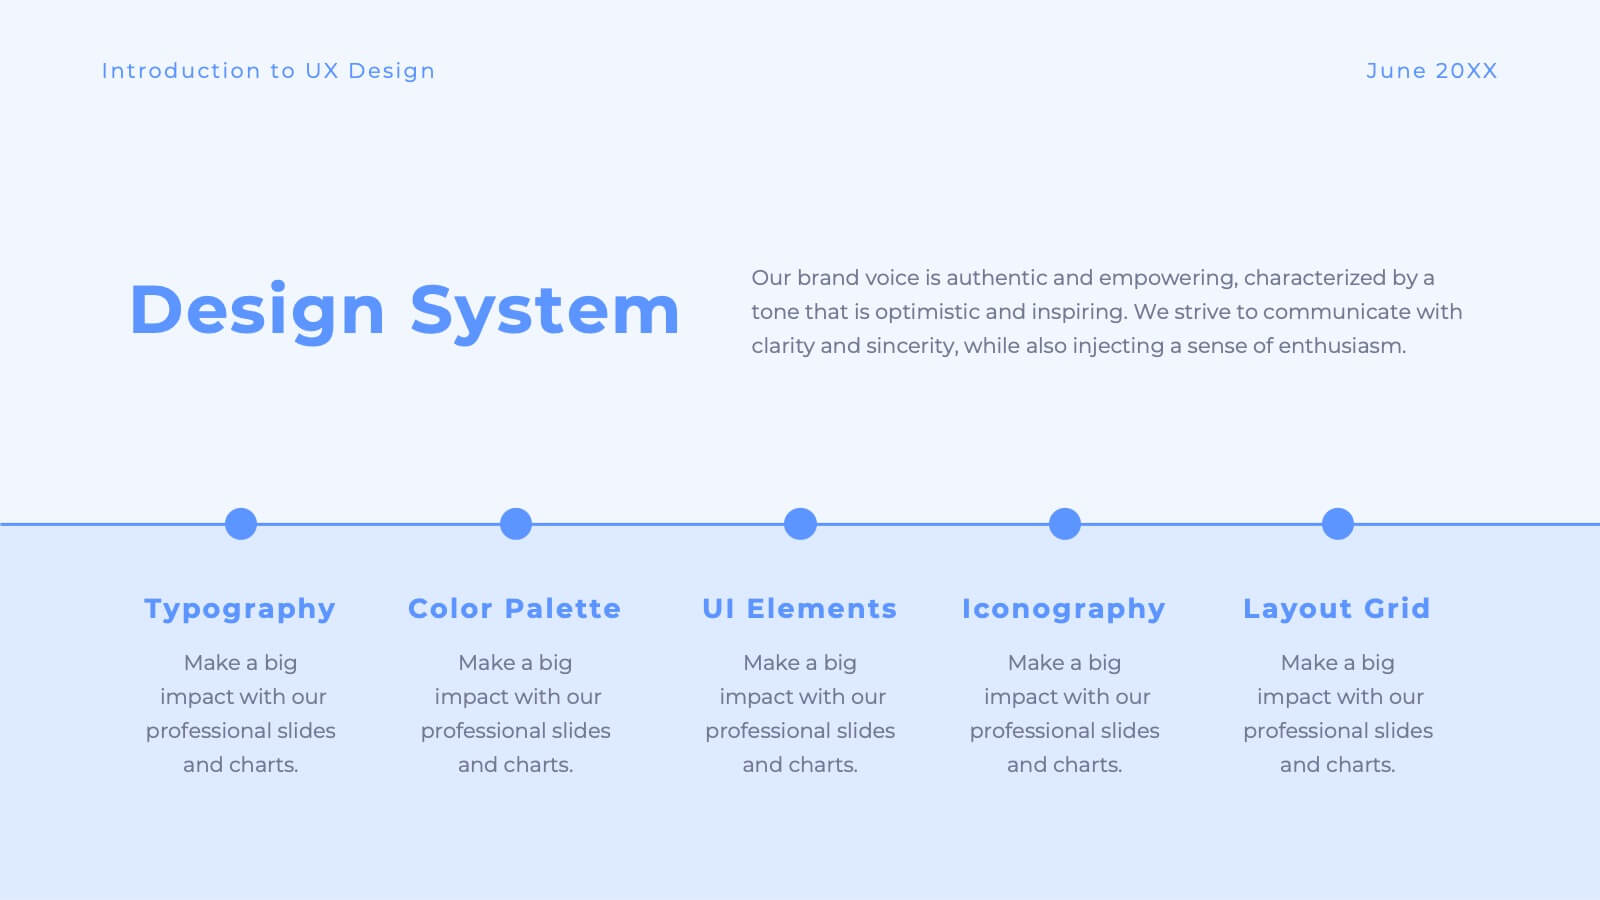
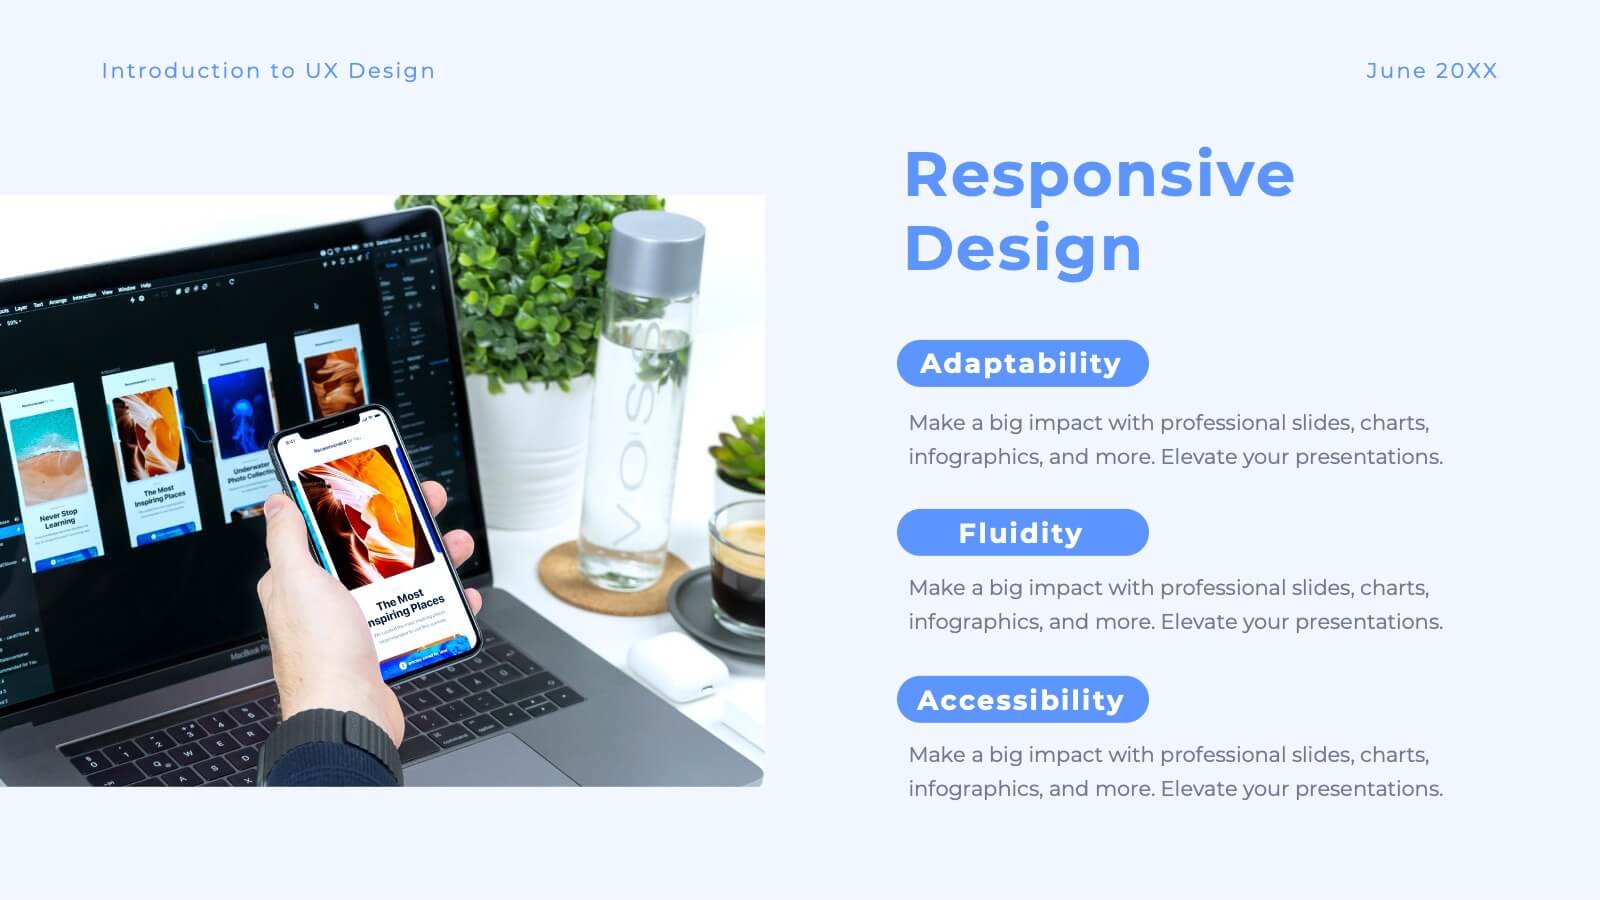
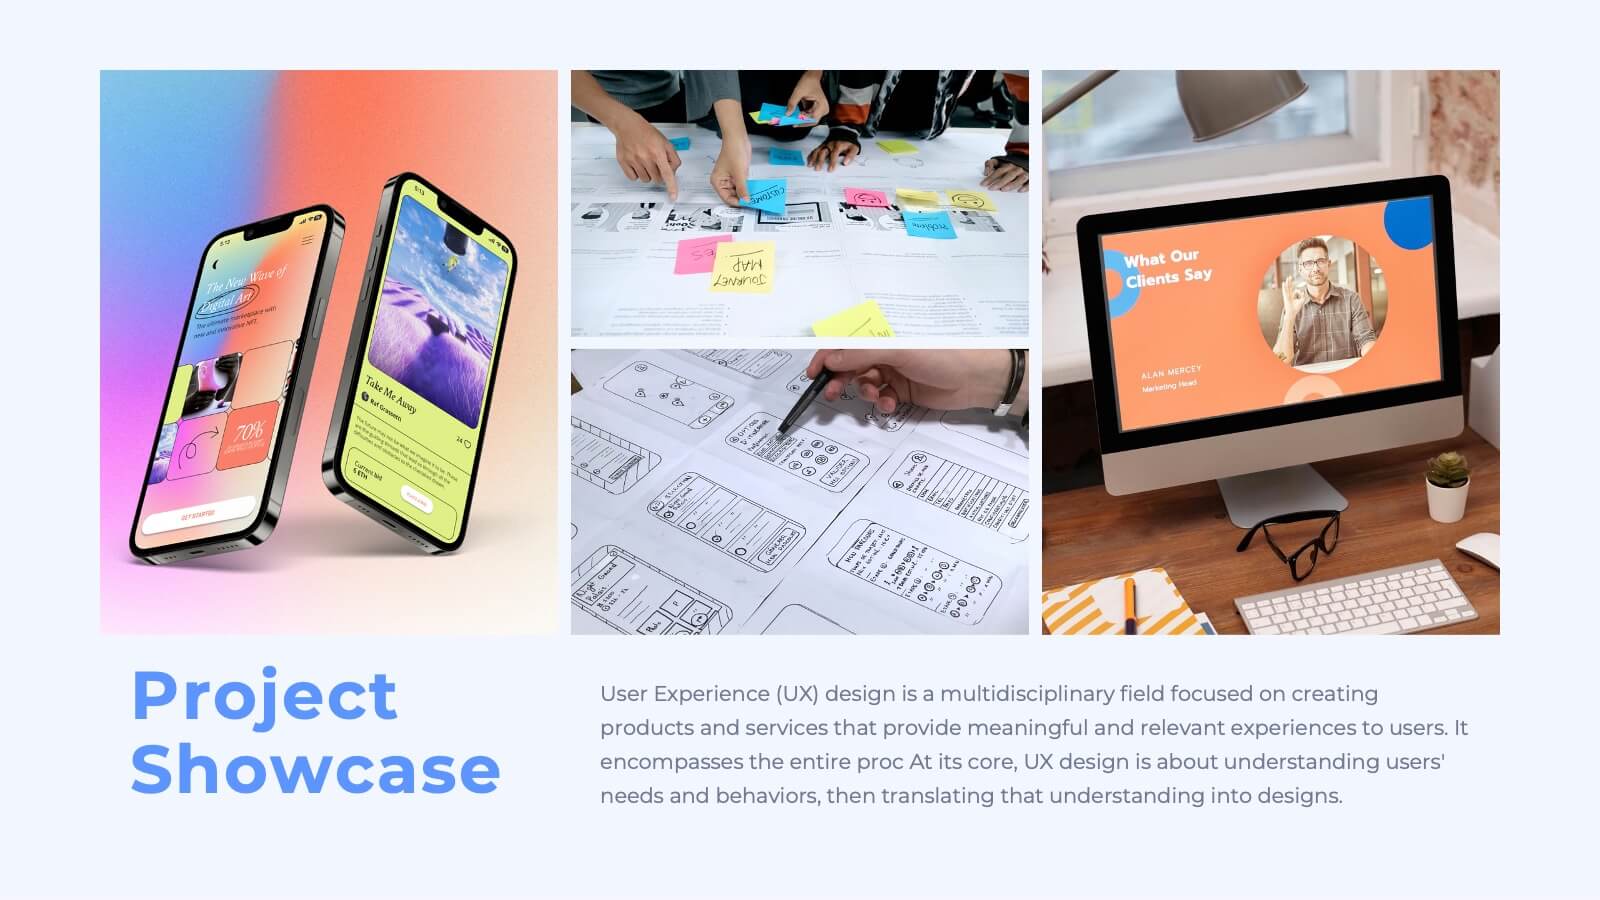
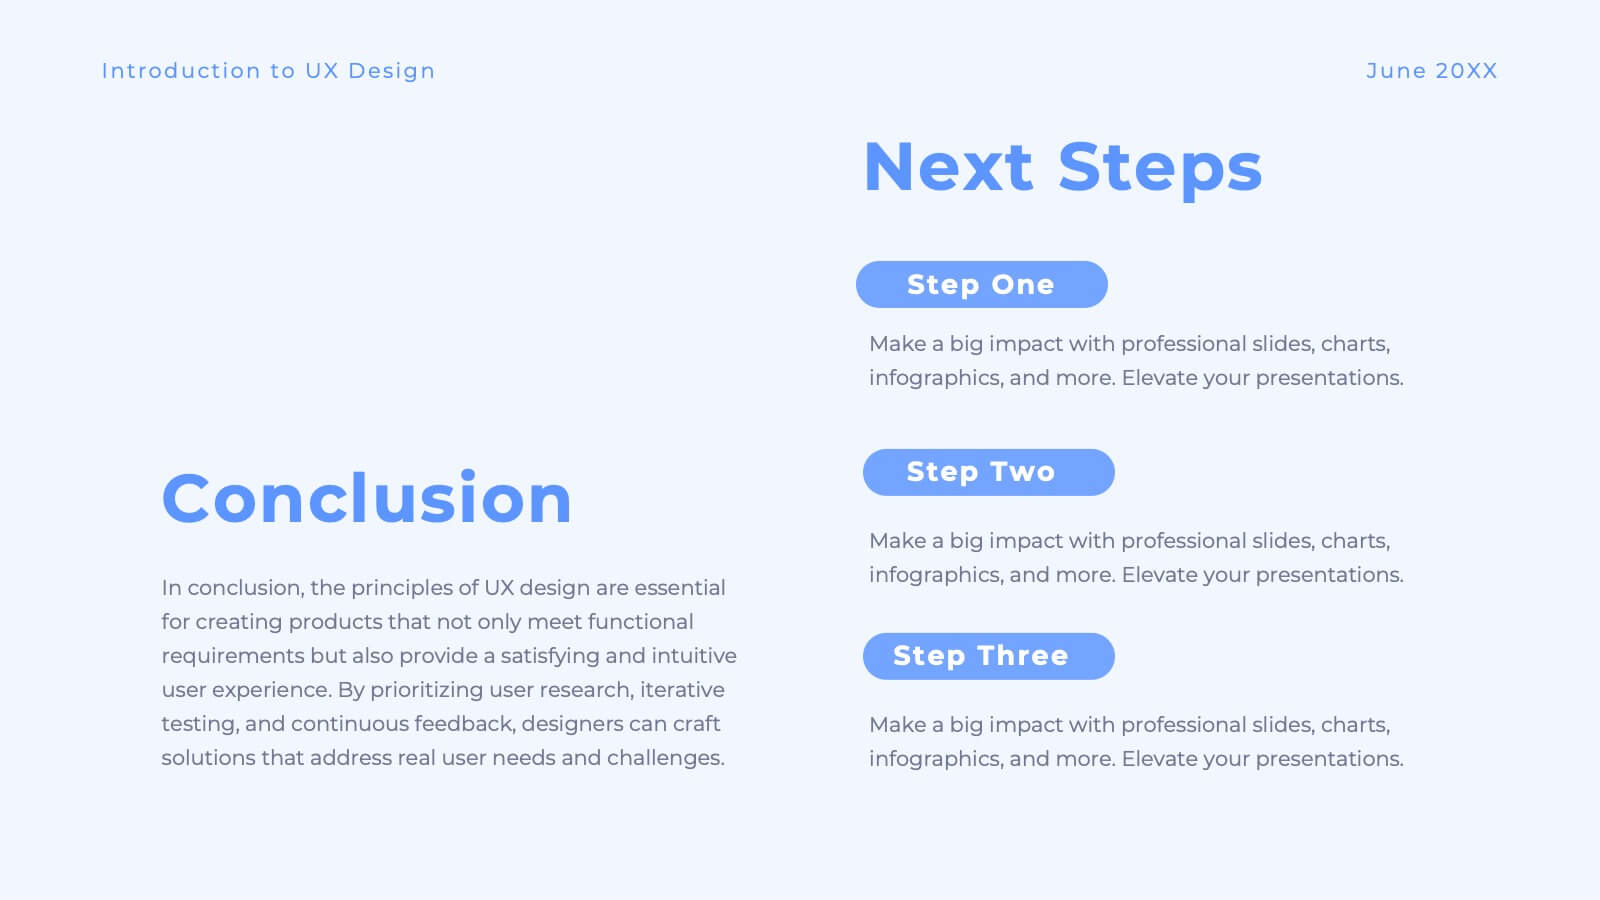
Jigsaw User Experience Proposal Presentation
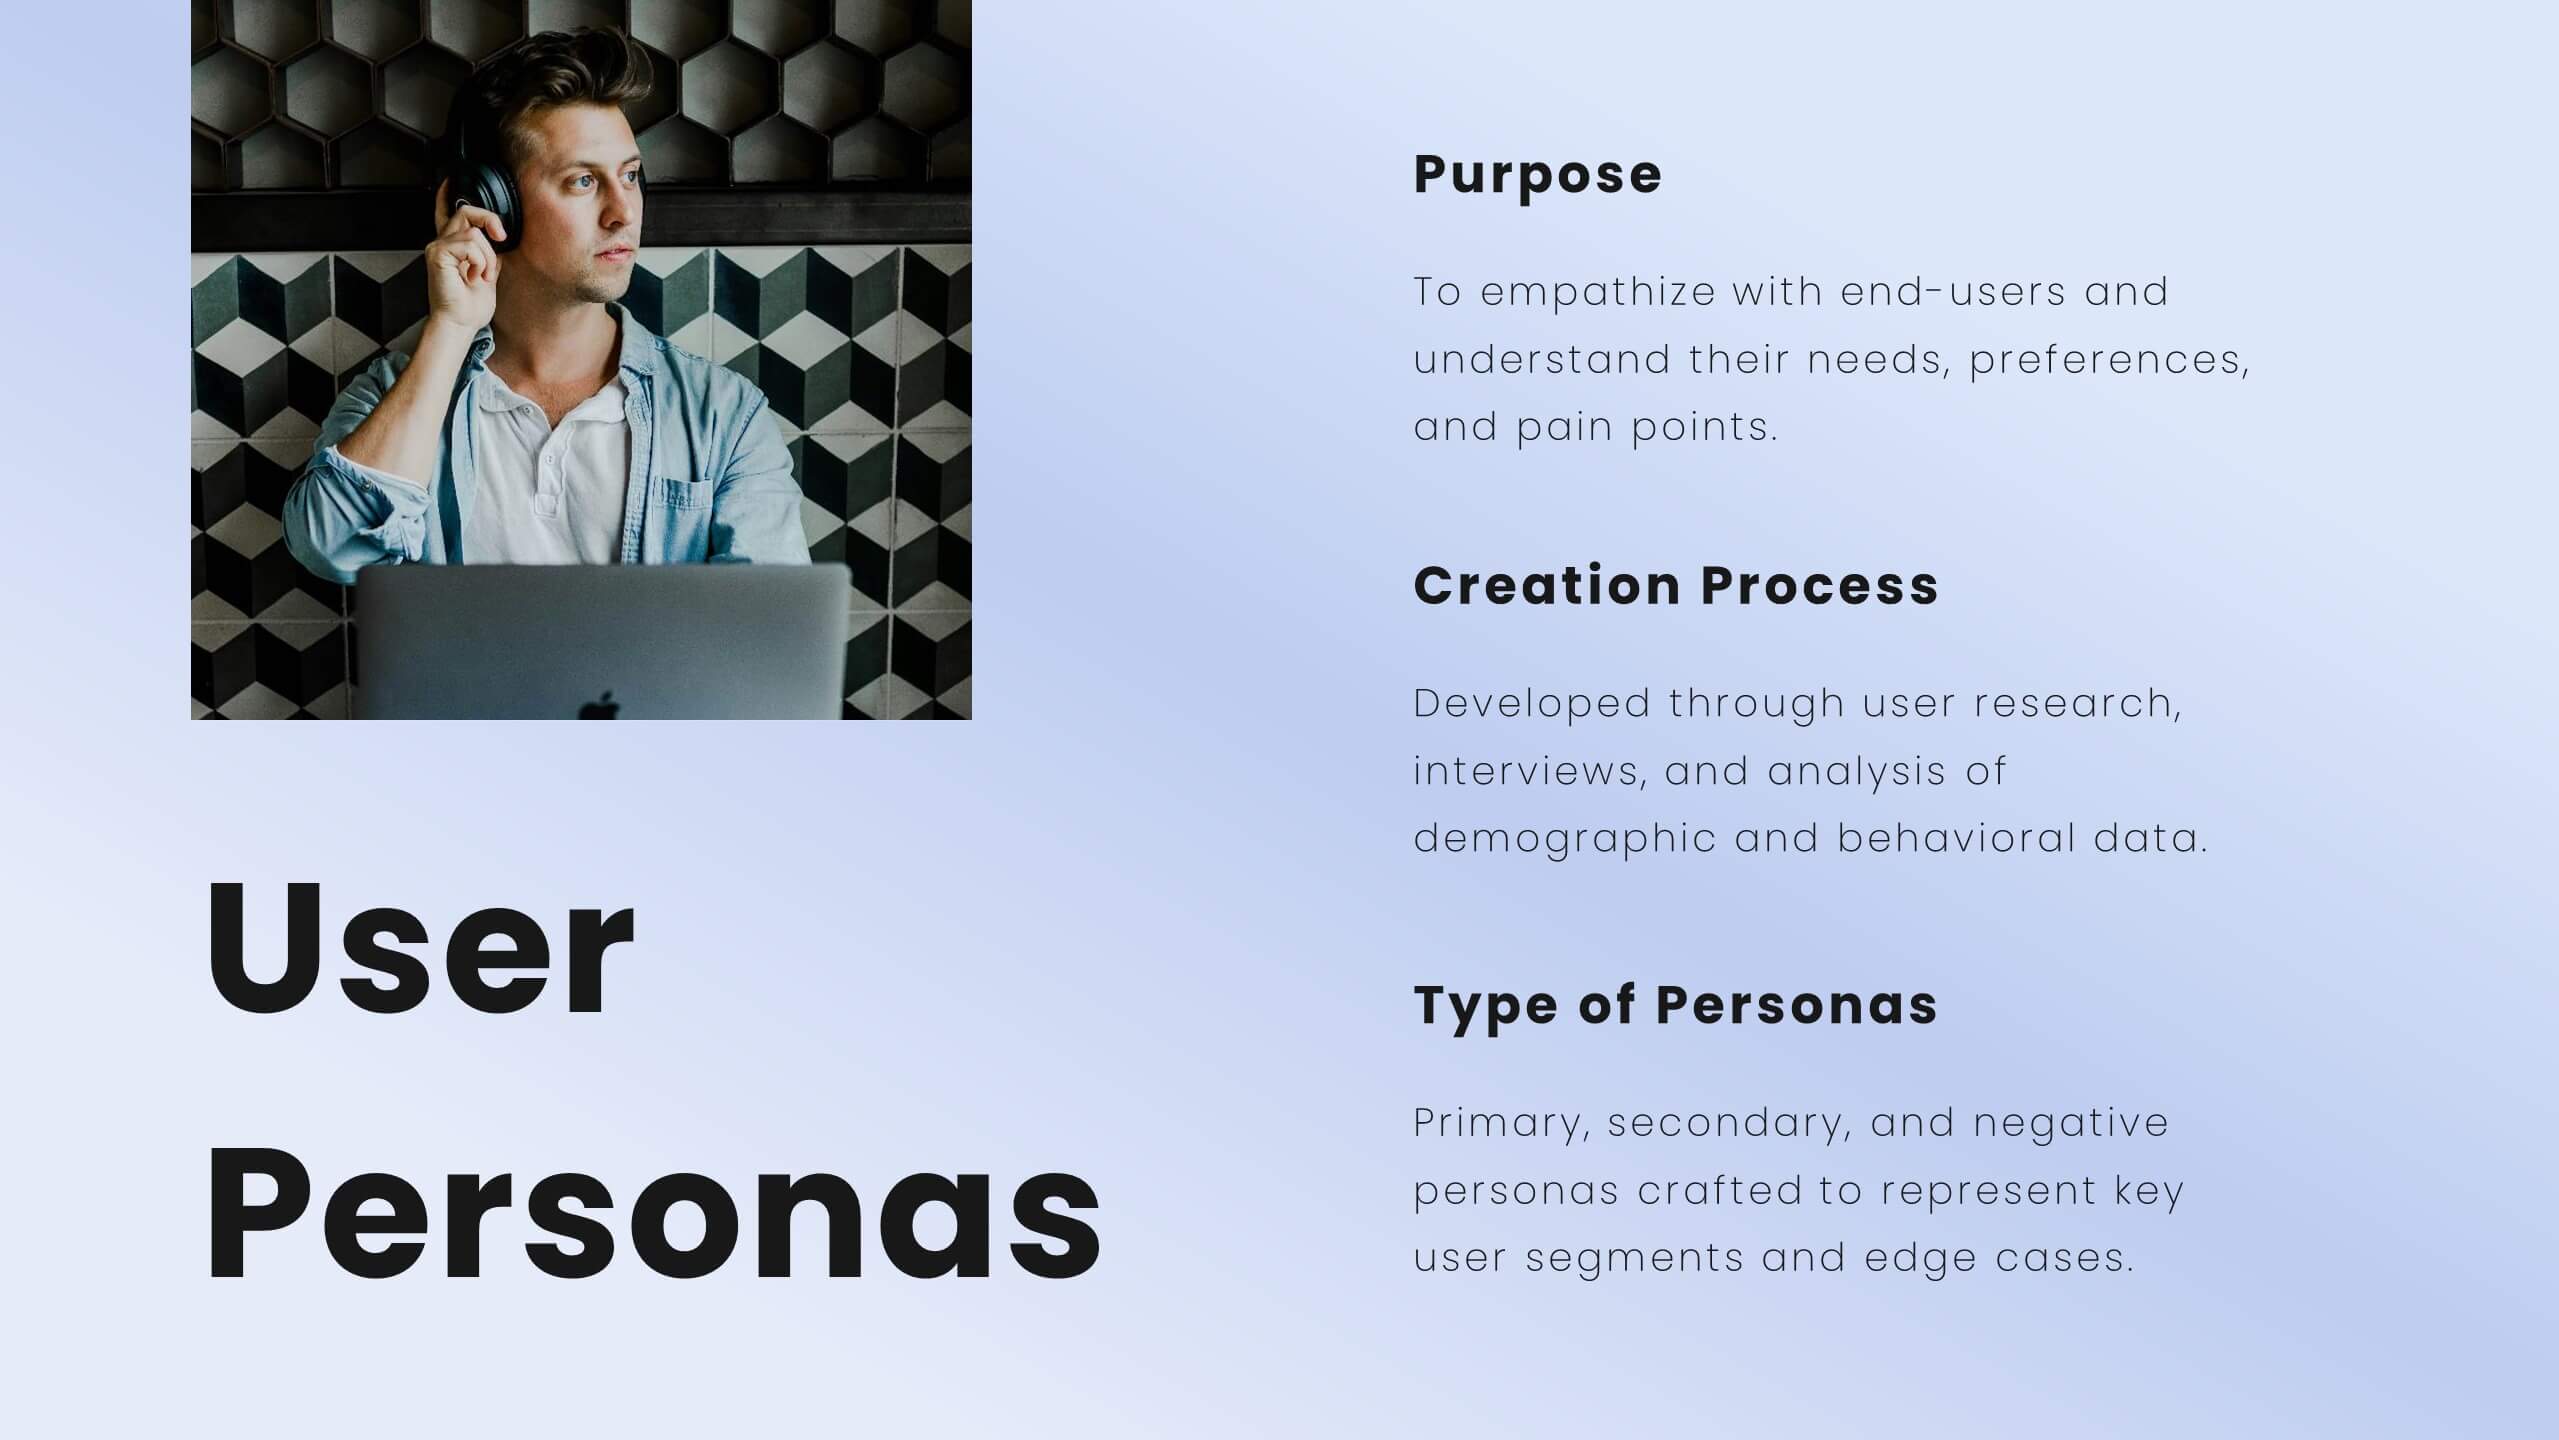
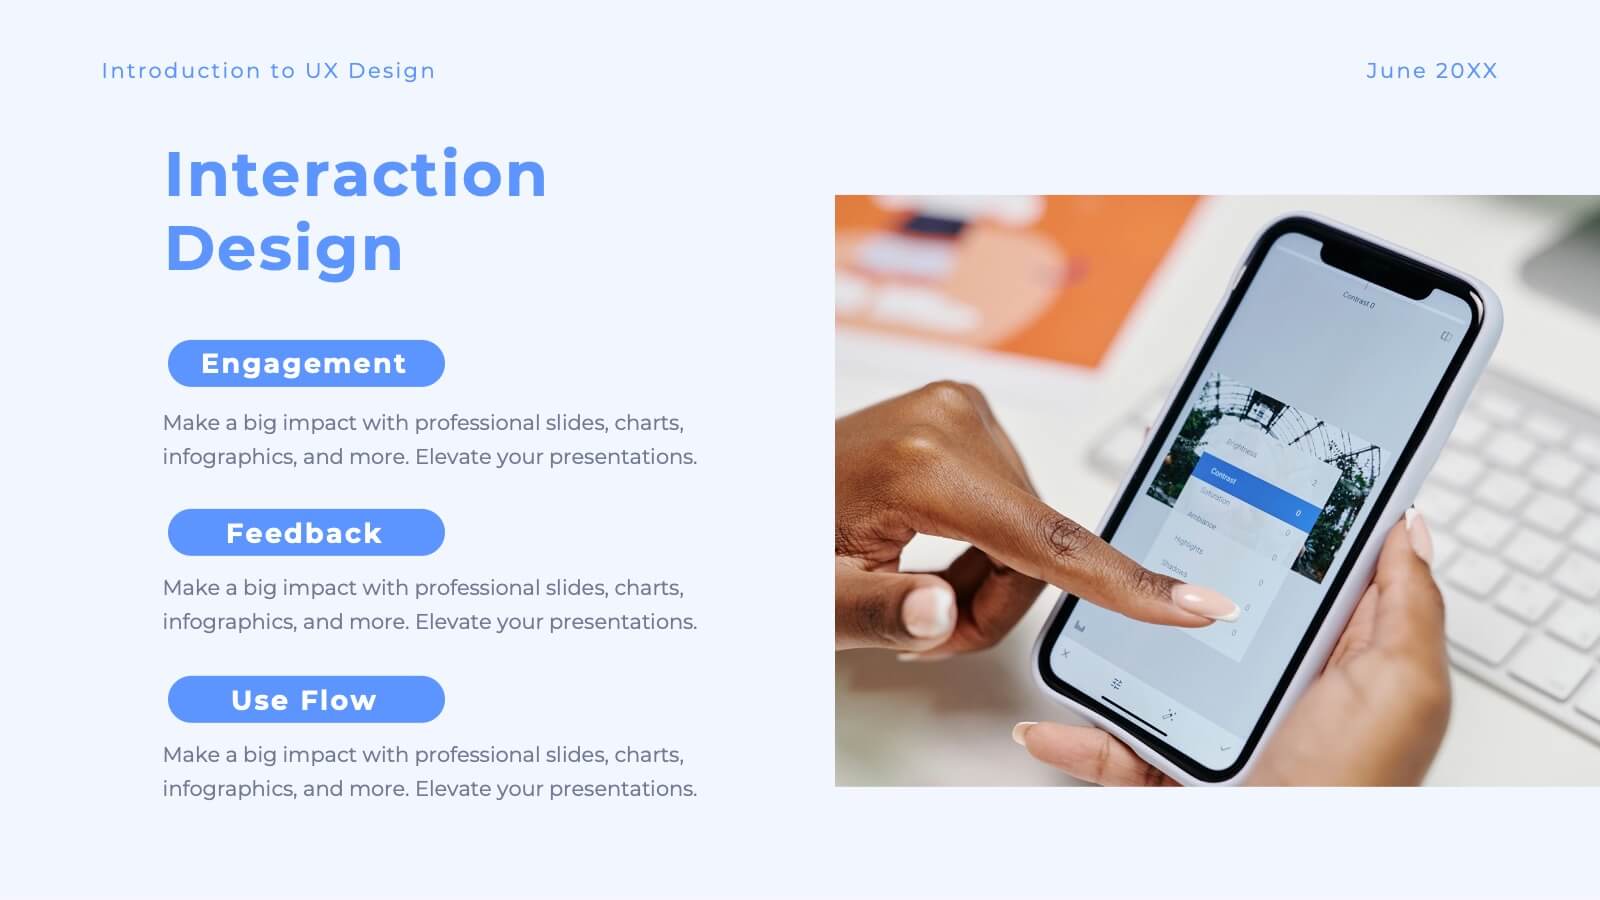
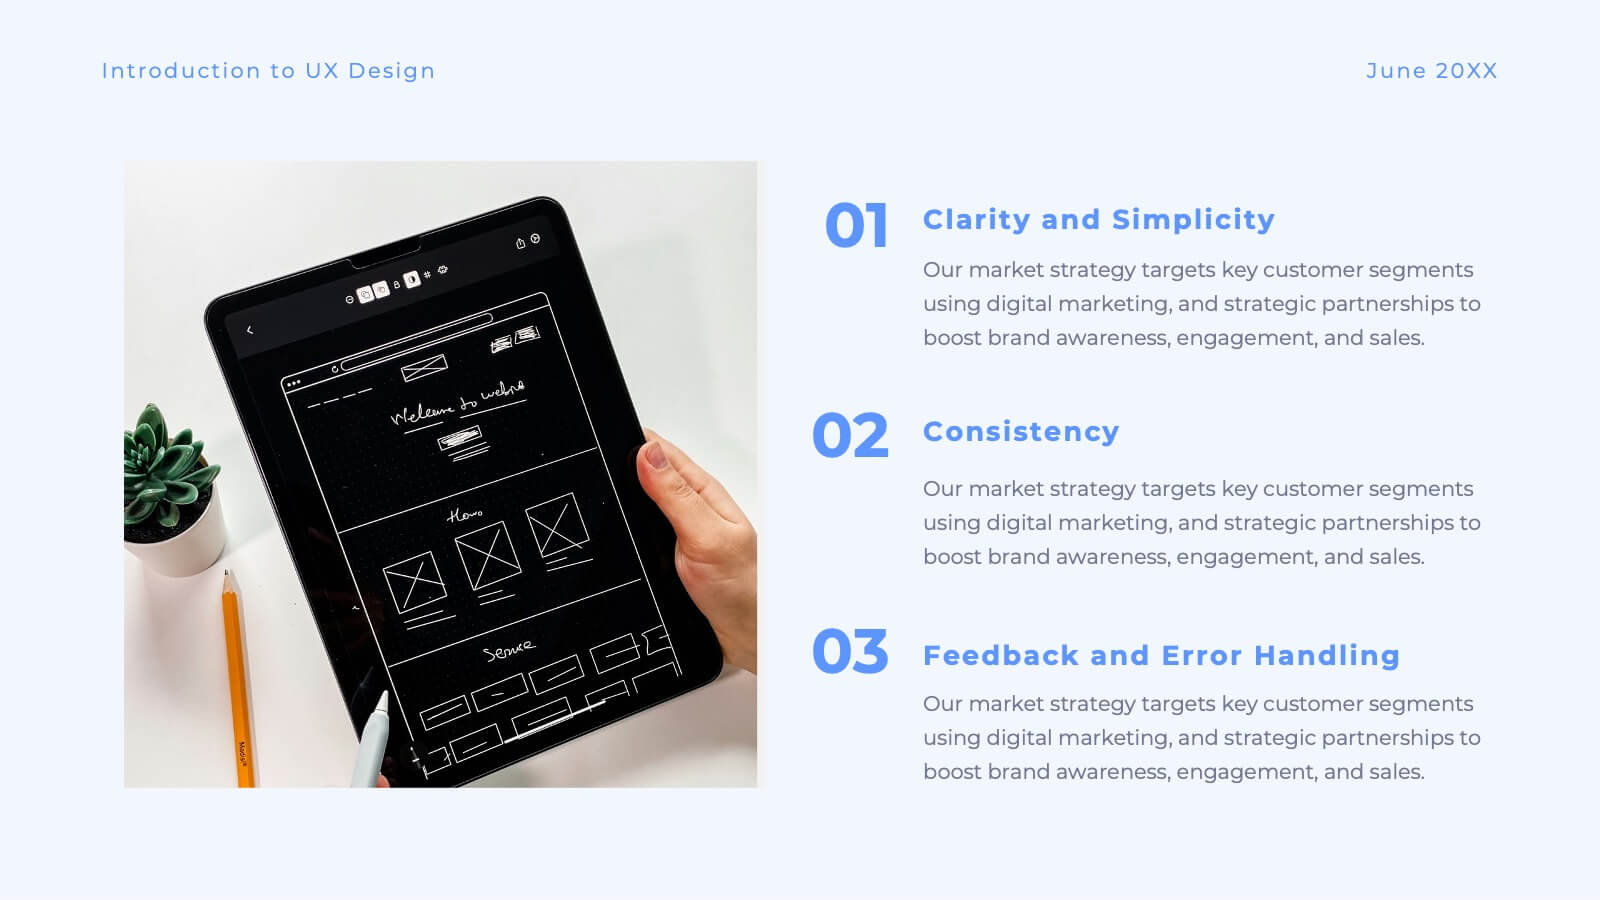
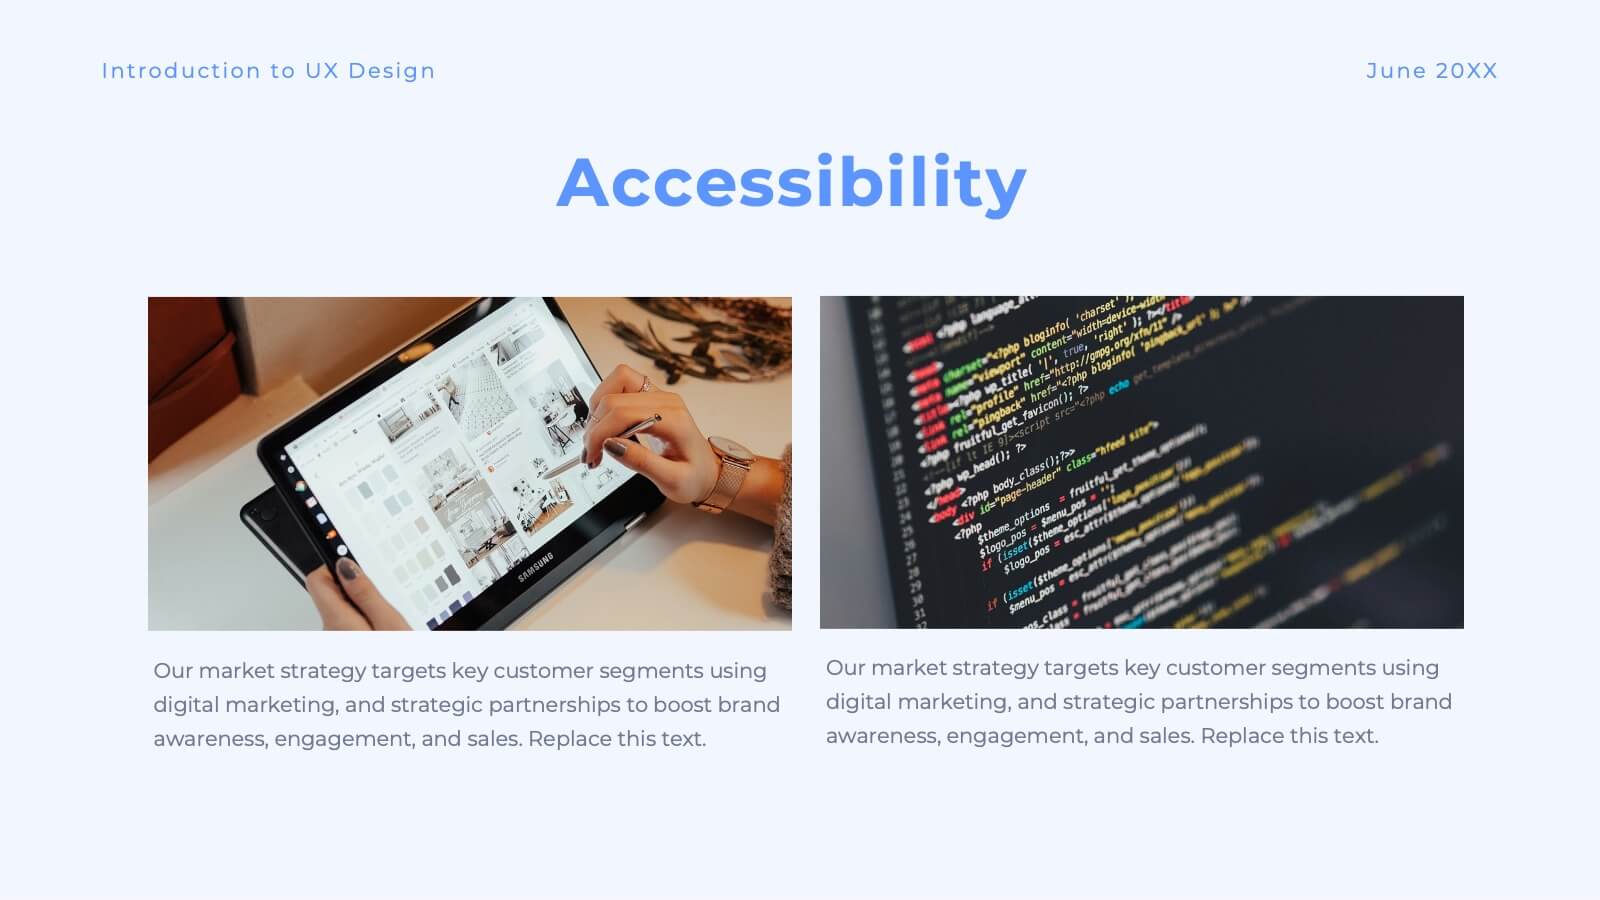
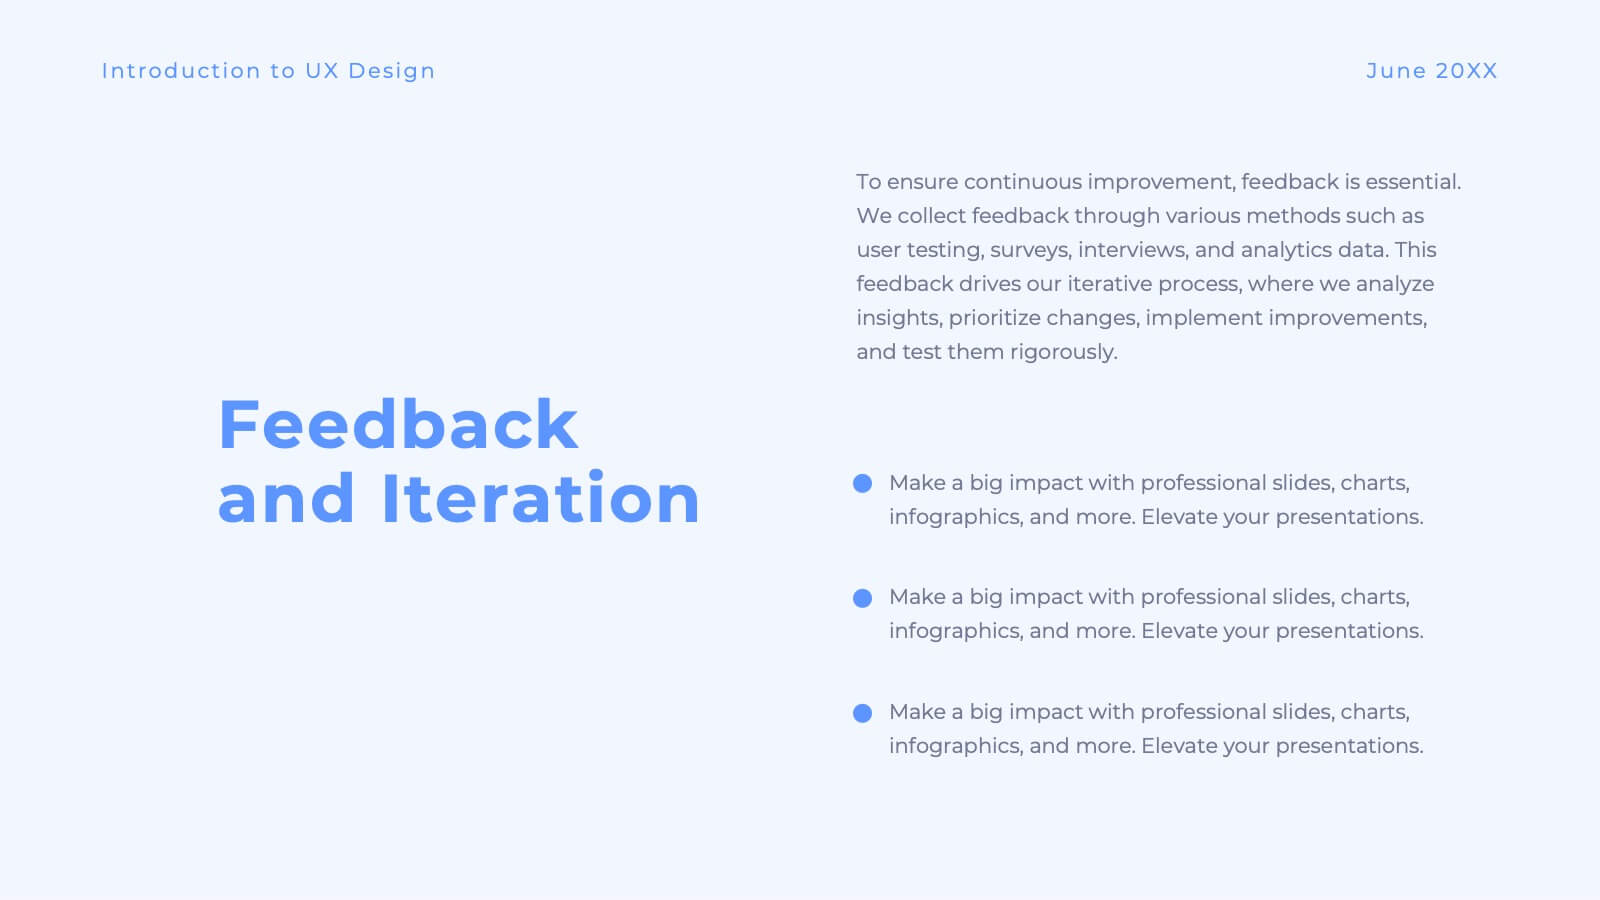
Enhance user experience with this comprehensive UX proposal template! Perfect for outlining user research, personas, and design principles. Ideal for UX/UI designers aiming to present their strategies and solutions. Compatible with PowerPoint, Keynote, and Google Slides, this template ensures your UX proposals are clear, professional, and impactful. Create exceptional user experiences today!


7 slides
Programming Framework Infographic
Delve into the intricate world of coding with the programming framework infographic. With a harmonious palette of blue, white, and green, this template visualizes the intricacies of different programming frameworks in a clear and engaging manner. Tailor-made for developers, software engineers, educators, and tech enthusiasts, it transforms complex concepts into digestible visual snippets. Embedded with custom graphics, relevant icons, and adaptable image placeholders, it enhances any tech presentation. Moreover, its seamless adaptability with PowerPoint, Keynote, and Google Slides ensures you leave a lasting impression.
23 slides
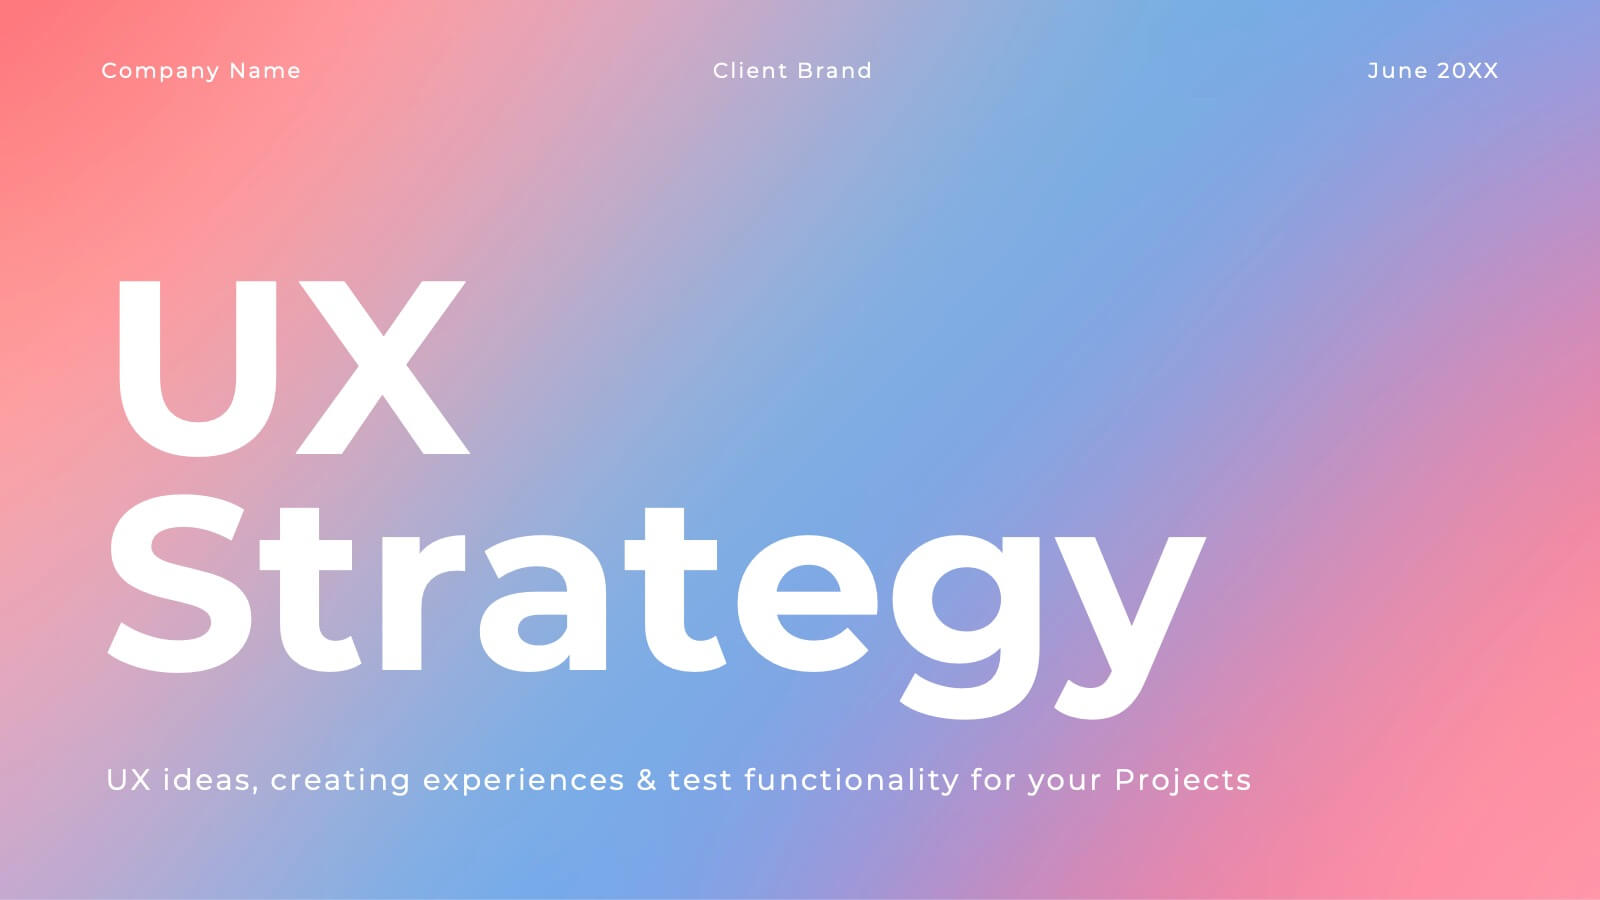
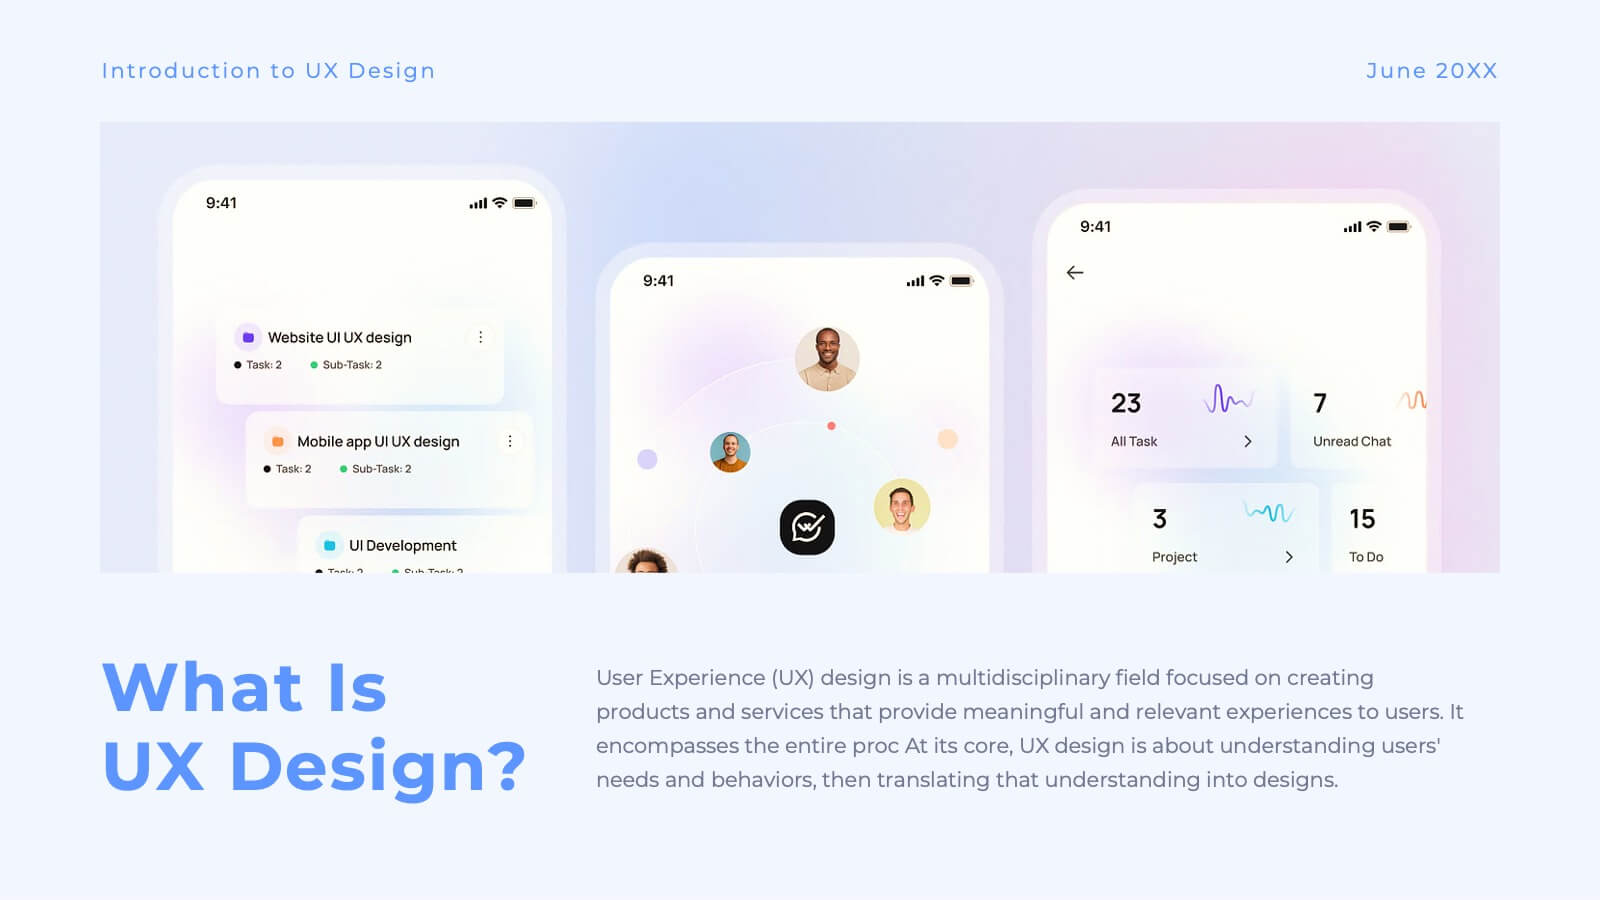
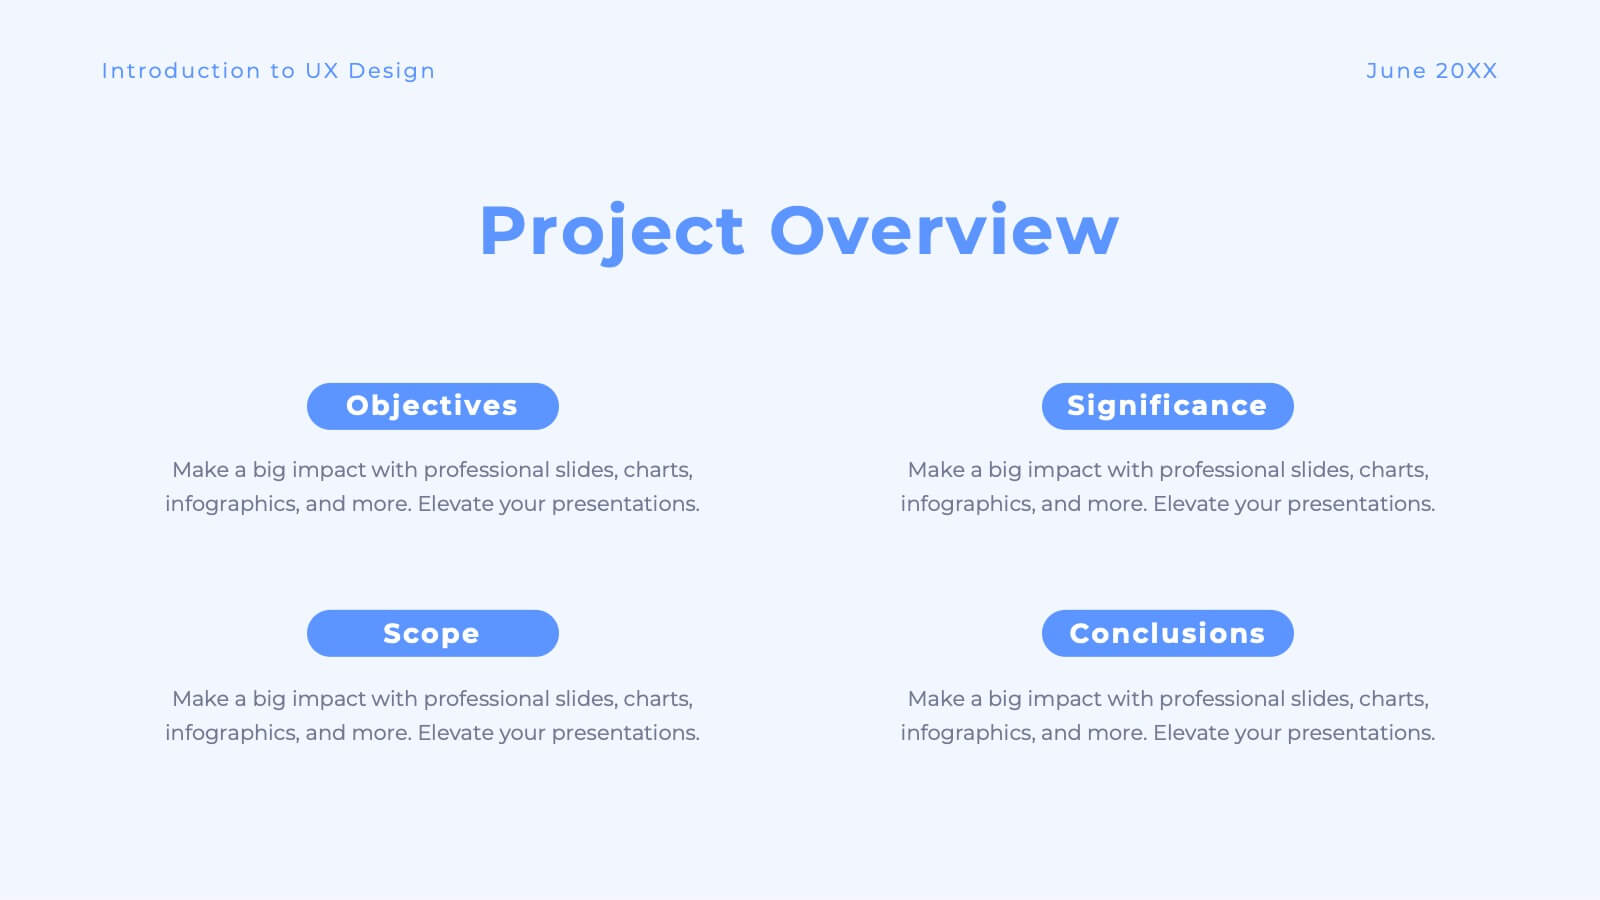
Luster UX Strategy Plan Presentation
Enhance user experience with this comprehensive UX strategy template! Perfect for outlining user research, personas, and design principles. Ideal for UX/UI designers aiming to present their strategies effectively. Compatible with PowerPoint, Keynote, and Google Slides, this template ensures your UX presentations are clear, professional, and impactful. Create exceptional user experiences today!


5 slides
Scaling Operations and Team Expansion Presentation
Illustrate your company’s growth journey with the Scaling Operations and Team Expansion Presentation. This dynamic layout uses a circular sequence to showcase five key phases of business scaling, from small teams to full-scale departments. Perfect for strategy sessions, investor updates, and team meetings. Fully editable in Canva, PowerPoint, Keynote, and Google Slides.


8 slides
Employee Onboarding Process
Guide new hires with clarity using the Employee Onboarding Process Presentation. This clean, step-by-step visual is perfect for HR managers, team leads, and company trainers. It includes four distinct onboarding phases, each with icons, titles, and editable descriptions to explain the key tasks in each stage—from welcome orientation to integration. Choose between dark and light background versions to suit your branding, and easily edit in PowerPoint, Keynote, or Google Slides.


20 slides
Chordstream Professional Portfolio Showcase Presentation
The Portfolio Presentation Template offers a modern and creative design, perfect for showcasing your projects, philosophy, and services. With 20 customizable slides, it includes sections for project highlights, pricing, client testimonials, and contact information. Compatible with PowerPoint, Keynote, and Google Slides, this template ensures professional impact for creatives.


21 slides
Polaris Startup Strategy Presentation
Set your startup on a path to success with this bold and dynamic strategy presentation template. Featuring key sections like mission and vision, market analysis, business model, and growth plans, it’s perfect for entrepreneurs and teams. Fully compatible with PowerPoint, Keynote, and Google Slides for a seamless presentation experience.


6 slides
Engagement Survey Results Infographics
Effectively communicate your engagement survey results with our Engagement Survey Results infographic template. This template is fully compatible with popular presentation software like PowerPoint, Keynote, and Google Slides, allowing you to easily customize it to illustrate and convey your survey findings. The Engagement Survey Results infographic template offers a visually engaging platform to present survey data, key findings, and insights related to employee or customer engagement. Whether you're an HR professional, manager, or business leader, this template provides a user-friendly canvas to create informative presentations and reports on engagement survey outcomes. Optimize your communication of survey results with this SEO-optimized Engagement Survey Results infographic template, thoughtfully designed for clarity and ease of use. Customize it to showcase survey methodology, response rates, visualizations of data, and action plans based on the findings, ensuring that your audience gains a comprehensive understanding of the survey results and their implications. Start crafting your personalized infographic today to effectively communicate engagement survey outcomes.


5 slides
Contracts and Law Obligations Infographics
Contracts and Law Obligations are crucial aspects of legal systems and business transactions. These infographic templates are designed to help you communicate complex legal concepts in an easy-to-understand format, making it suitable for legal professionals, businesses, or anyone seeking to educate others about contract law. These infographics features a unique, vintage law design with customizable layouts, visually appealing icons, and color schemes that can be tailored to match your presentation needs. It is compatible with PowerPoint, Keynote, and Google Slides, providing flexibility in editing.


4 slides
Corporate Networking Flow Presentation
Simplify complex communication systems with this dynamic and easy-to-follow presentation design. Perfect for visualizing workflow connections, team collaboration, or IT infrastructure, it brings clarity to multi-level processes with a clean and structured layout. Fully editable and compatible with PowerPoint, Keynote, and Google Slides for professional results.


5 slides
DMAIC Six Sigma Framework
Visualize process improvement with this clear and structured DMAIC Six Sigma slide. Perfect for business analysts, quality teams, and project managers, it highlights each phase—Define, Measure, Analyze, Improve, and Control—in a streamlined format. Fully editable in PowerPoint, Keynote, and Google Slides.


5 slides
Training and Development Onboarding
Streamline your employee learning journey with the Training and Development Onboarding Presentation. This modern, five-step roadmap uses a wave-style flow from A to E, allowing you to break down each stage of training with matching step labels and title placeholders. Ideal for HR professionals, team leaders, and onboarding managers, it’s perfect for introducing structured learning, role-specific training, or compliance modules. Compatible with PowerPoint, Keynote, and Google Slides, and fully editable to match your brand style.


12 slides
Business Strategy with 7S Model Presentation
Streamline your strategic discussions with our Business Strategy with 7S Model presentation template, crafted for professionals who demand precision and clarity. Each slide methodically details the seven interrelated elements—Structure, Strategy, Systems, Skills, Staff, Style, and Shared Values—ensuring a comprehensive analysis of your organization's alignment. This versatile template enhances your presentations in PowerPoint, Keynote, and Google Slides, providing a visually engaging way to explore complex business strategies and foster insightful conversations.


22 slides
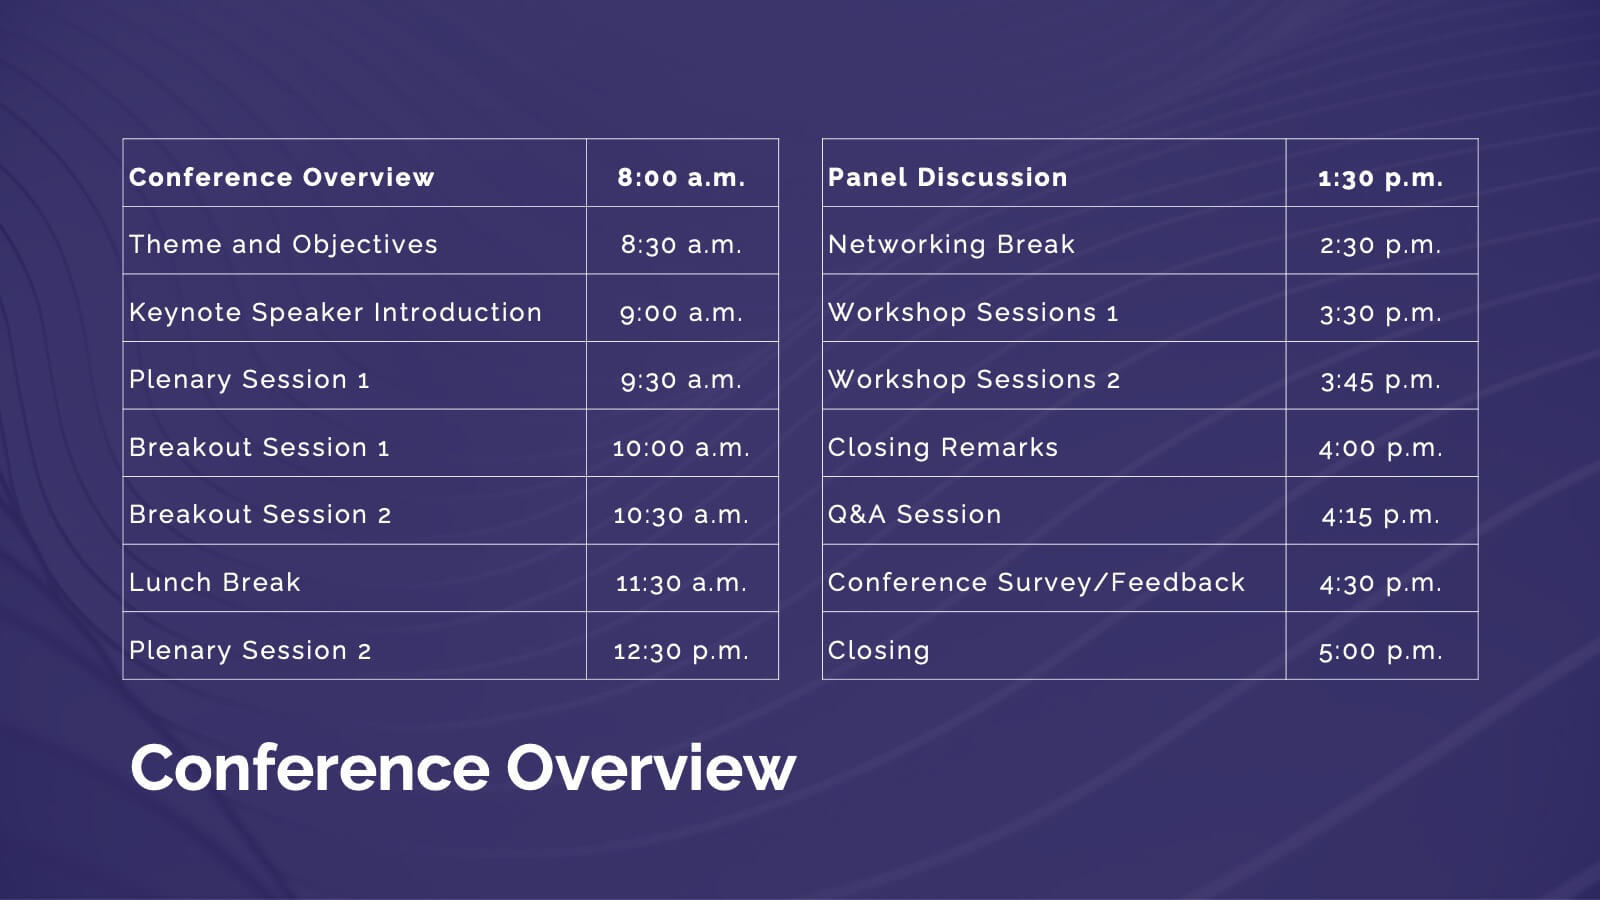
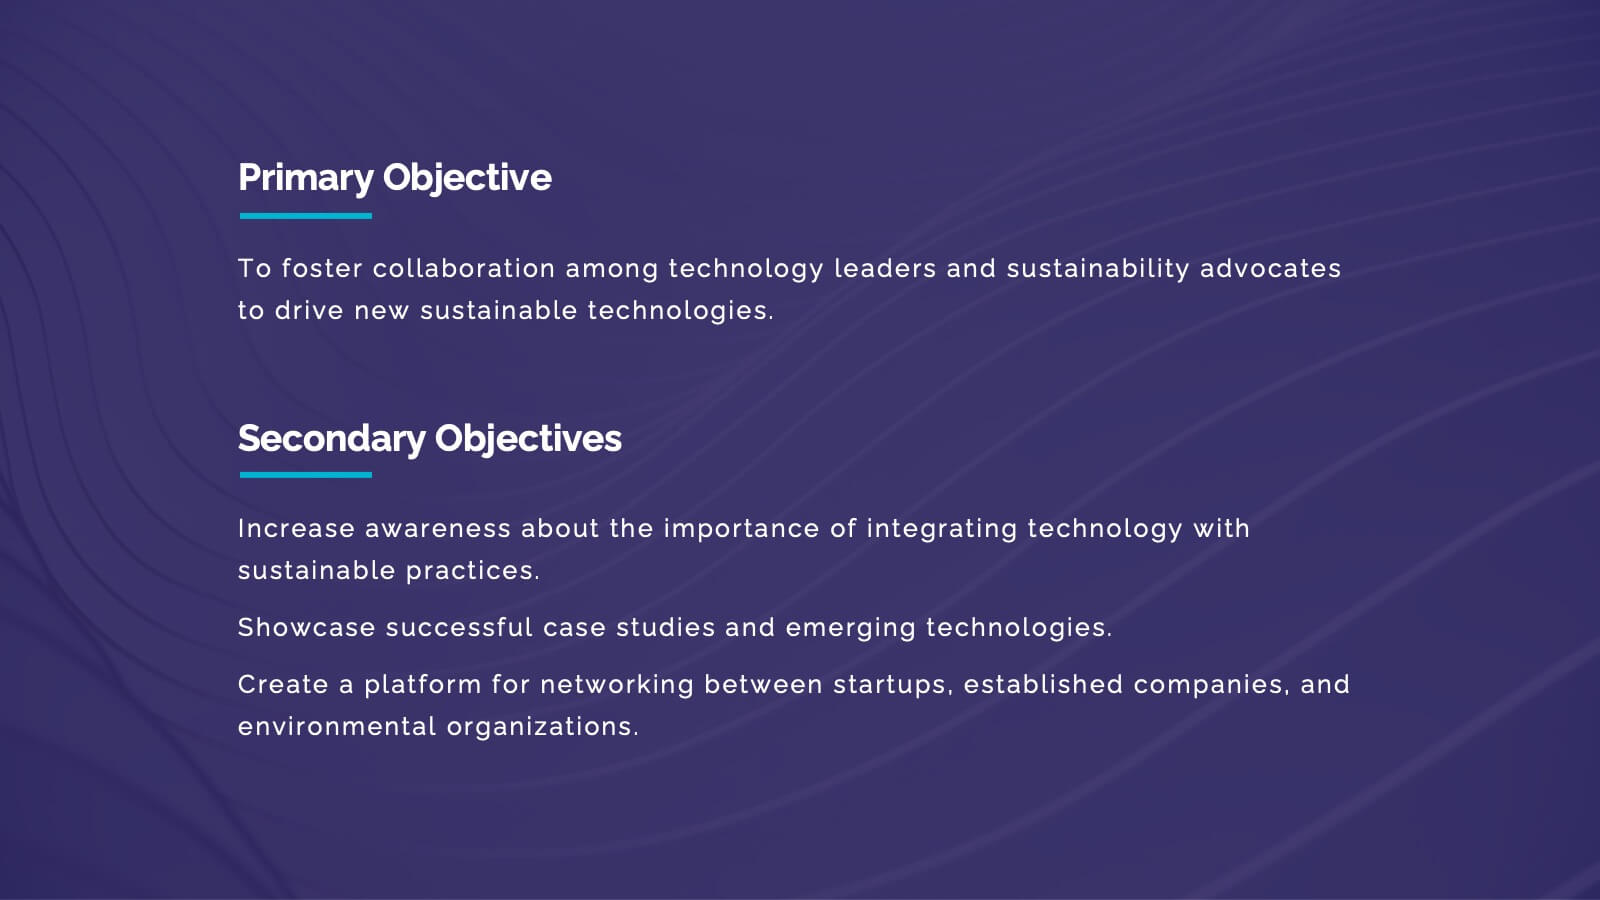
Nimbus Business Development Proposal Presentation
Boost your business presentations with this vibrant, professional template designed for business development proposals. Perfect for detailing conference overviews, themes, objectives, and keynotes, it features a clean and engaging layout. Highlight critical sessions and networking opportunities to captivate your audience. Compatible with PowerPoint, Keynote, and Google Slides, it ensures seamless presentations on any platform.