


Features
- 3 Unique slides
- Fully editable and easy to edit in Microsoft Powerpoint, Keynote and Google Slides
- 16:9 widescreen layout
- Clean and professional designs
- Export to JPG, PDF or send by email


Do you have any questions?
Recommend


7 slides
Smile Rating Importance Infographic Presentation
Smile Rating is a metric used in customer service to measure the level of customer satisfaction or happiness with a particular experience, interaction or service. This template will help you make a vibrant, friendly and original presentation. This smile rating infographic is easy to use and customize. It is fully editable and the layout allows you to personalize it. This template can be edited in PowerPoint, Keynote, and Google Slides. This is perfect for business presentations, strategic planning, idea-sharing sessions or just a fun way to share your thoughts on this design topic.


21 slides
Zephyrkin Product Roadmap Presentation
Outline your product’s journey with this roadmap template, covering essential elements like target market, customer pain points, competitive analysis, and marketing strategy. Showcase your product's features, unique value proposition, and development process. Ideal for PowerPoint, Keynote, and Google Slides, this template supports professional product presentations.


4 slides
Oceania Business Growth Opportunities Map Presentation
Highlight key business locations across Oceania with this clean and modern map slide. Featuring pinpoint icons and four customizable title areas, it’s ideal for showcasing market entry points, regional offices, or investment zones. Fully editable in PowerPoint, Keynote, and Google Slides for seamless business planning and strategic presentations.


7 slides
Inversion Table Infographic
A table infographic is a visual representation of data or information presented in a tabular format, using a combination of text, numbers, and visual elements to make the information more engaging and easily understandable. This infographic template is great for comparing two or more variables and is a powerful way to convey your data. This infographic is designed to show your audience the key points of your data in a visually appealing way. This template is a good option if you want to present your information as an easy-to-read table with labels and numbers. The bright colors and fun design make it easy to see at a glance.


6 slides
Root Cause Breakdown with Impact Lines Presentation
Visualize the path from causes to consequences with the Root Cause Breakdown with Impact Lines Presentation. Designed with a clear horizontal arrow flow and dual-level layout, this slide helps you dissect key issues and their cascading effects. Ideal for risk analysis, incident reviews, and operational strategy meetings. Fully customizable in PowerPoint, Keynote, and Google Slides.


6 slides
Strategic Next Steps Planning Presentation
Bring your strategy to life with a clear, visual roadmap that guides audiences through each phase of your plan. Ideal for outlining goals, milestones, and next steps, this layout makes progress easy to follow and professional to present. Compatible with PowerPoint, Keynote, and Google Slides for effortless customization.


7 slides
Buyer Journey Infographic
Embark on a visual adventure with our Buyer Journey Infographic Template, designed to map out the critical stages of the consumer experience with flair and precision. This template captures each phase of the buyer's journey, from initial awareness to the final purchase decision, using a combination of bold graphics and streamlined information. Ideal for marketing professionals and business strategists, this template breaks down complex consumer behavior into clear, actionable insights. Utilize this engaging tool to showcase how customers interact with your brand at every touchpoint, highlighting opportunities for engagement and conversion enhancement. Fully customizable, this template allows you to adjust the visuals and text to align with your company’s branding and the specific nuances of your customer base. It’s an essential tool for presentations, training, and marketing materials, providing a foundation for strategies that resonate deeply with audiences and drive successful outcomes.


5 slides
Oceania Business Opportunities Map Presentation
Unlock growth potential with the Oceania Business Opportunities Map template, crafted to showcase key investment zones and emerging markets across the region. Utilize interactive mapping tools to analyze market viability and sector-specific opportunities effectively. Ideal for businesses looking to expand in Oceania. Compatible with PowerPoint, Keynote, and Google Slides.


5 slides
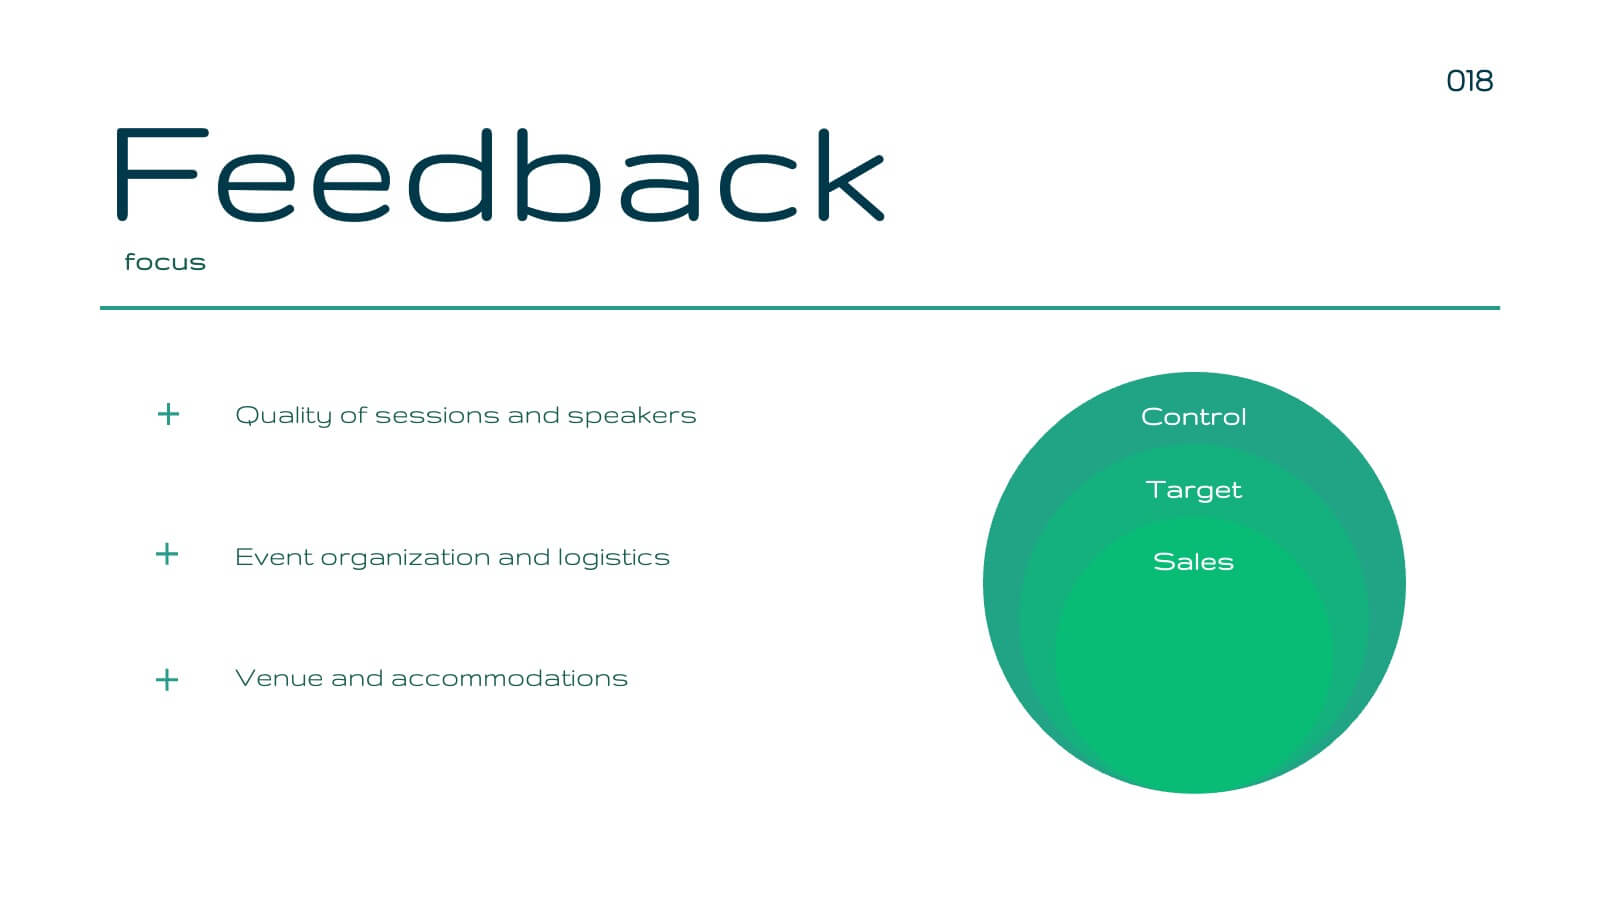
Layered Circular Model for Strategy Presentation
Communicate complex strategies with ease using the Layered Circular Model for Strategy Presentation. This 3D-style infographic breaks down your framework into five distinct levels, making it ideal for visualizing hierarchies, stages, or priorities. Each layer is fully editable and labeled for customization. Works with PowerPoint, Google Slides, and Canva.


7 slides
Fishbone Stitch Infographic
Thread together insights with our fishbone stitch infographic. Set on a crisp white canvas, accented with the depth of purple, the intensity of red, and the freshness of green, this template elegantly showcases the intricate details of the fishbone stitch technique. Accentuated with intuitive infographics, emblematic icons, and specific image placeholders, it provides a detailed walk-through of this unique stitching method. Perfectly tailored for Powerpoint, Keynote, or Google Slides. A must-have for fashion designers, textile students, craft enthusiasts, or anyone with a passion for intricate stitchwork.


22 slides
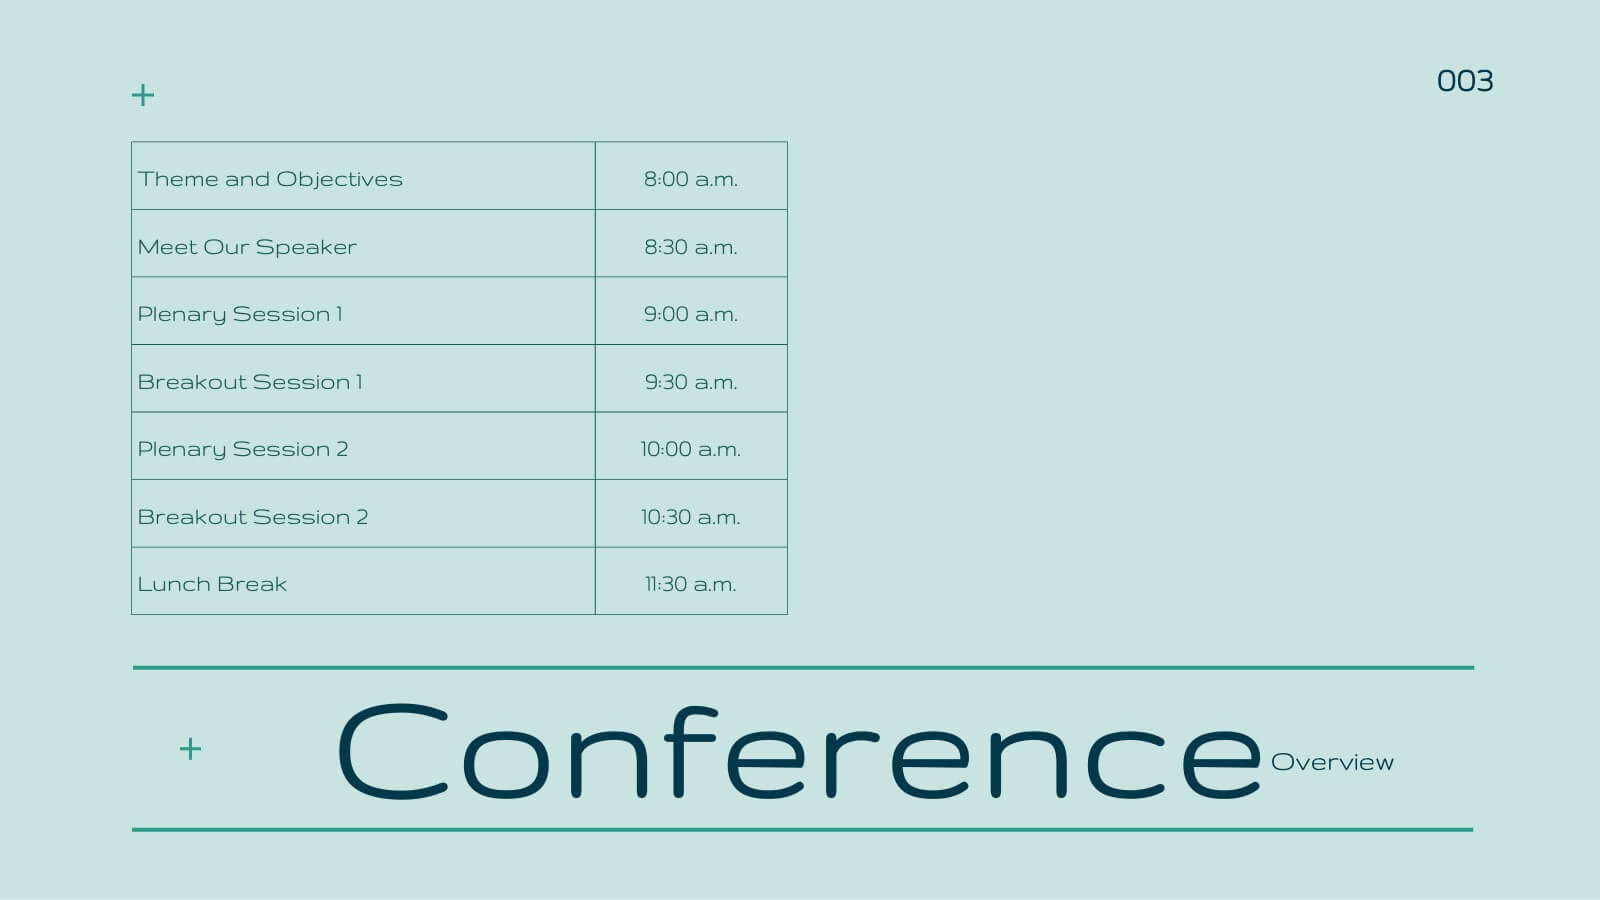
Blaze Business Operations Plan Presentation
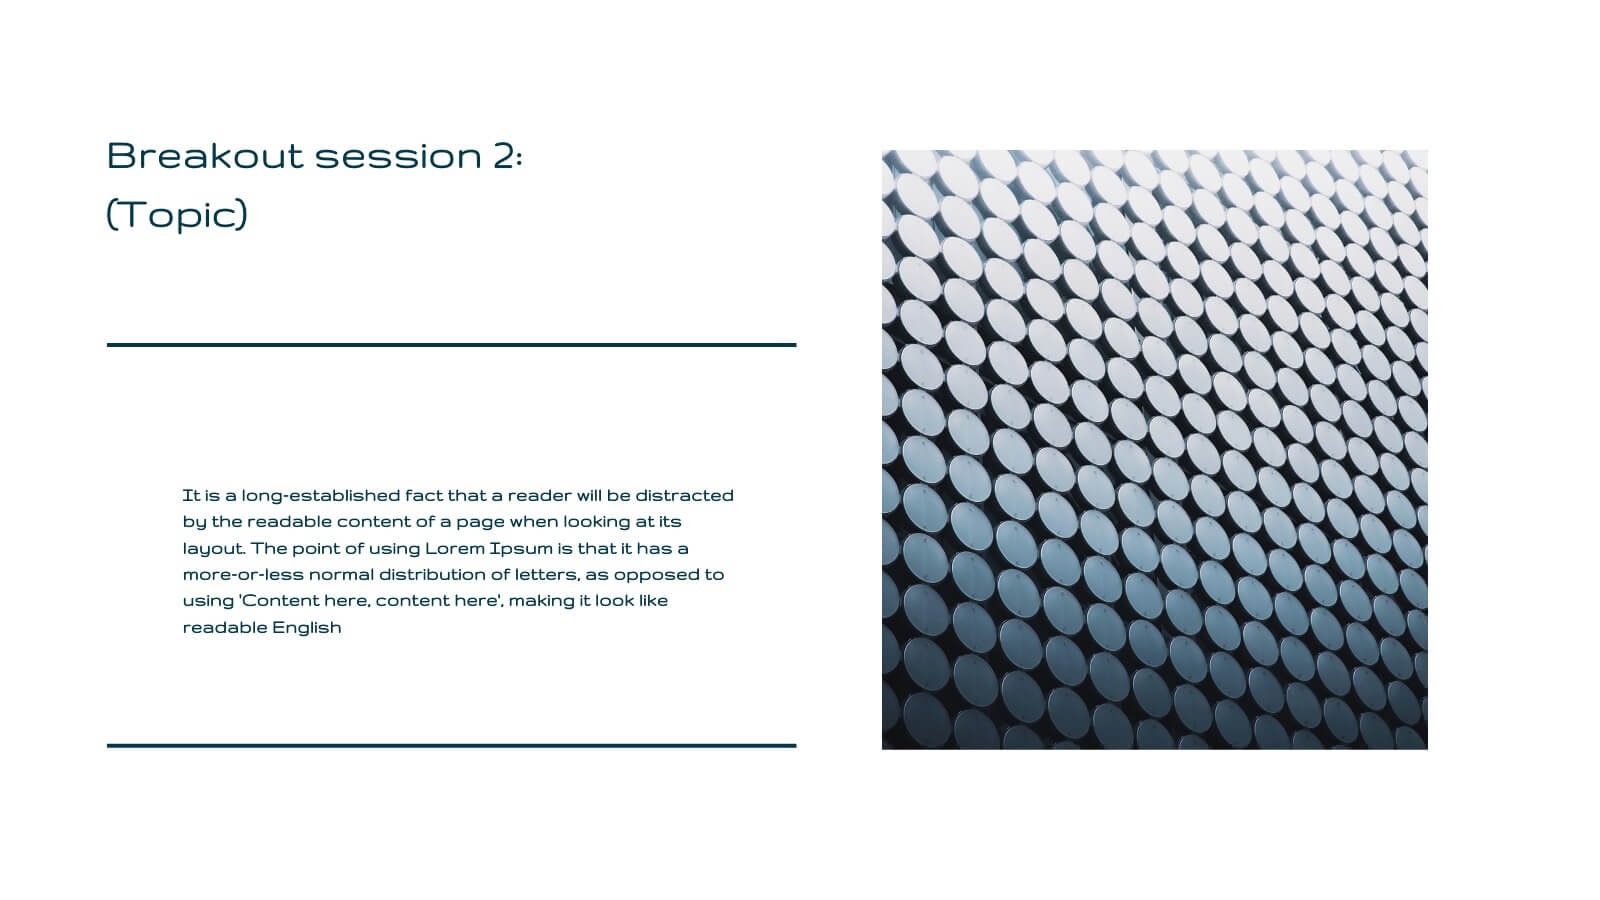
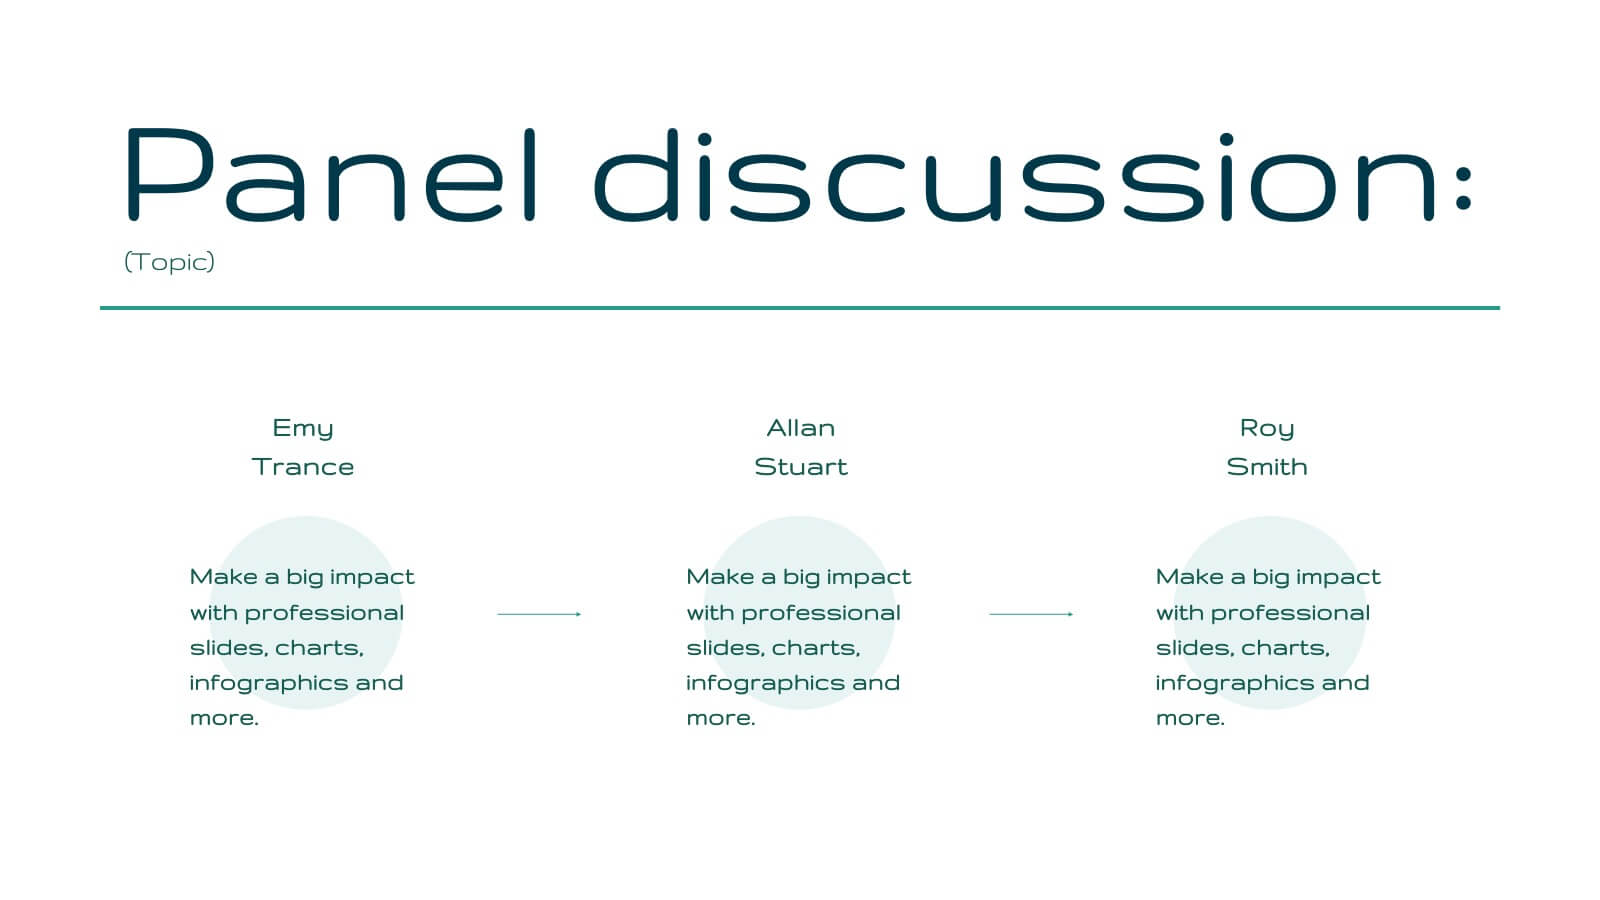
Elevate your business presentations with this elegant, modern template designed for comprehensive business operations. Perfect for covering themes, objectives, workshops, and panel discussions, it ensures a professional and engaging delivery. The clean design and structured layout enhance clarity and impact. Compatible with PowerPoint, Keynote, and Google Slides, it’s versatile for any platform.


7 slides
Thank You Message Infographic
Express gratitude with flair using this vibrant template, perfect for crafting messages that leave a lasting impression. Each slide is designed with a combination of bold colors, modern typography, and creative layouts, ensuring your thanks stands out. Tailor these slides to any occasion by adjusting the design to suit your unique style or corporate branding. This template is ideal for expressing appreciation in various contexts—whether thanking a team for their hard work, acknowledging a client's loyalty, or showing gratitude to participants at an event. Its versatility makes it suitable for digital or print formats, from email campaigns to thank you cards. Enhance your messages of thanks with a personal touch, ensuring they resonate more deeply with recipients. This approach not only communicates gratitude but also strengthens relationships with a professional and polished presentation.


6 slides
Product Life Cycle Stages and Management Presentation
Visualize the journey from product development to market maturity with this modern, conveyor-style layout. Designed to represent five sequential phases, this presentation is perfect for product managers, marketing teams, or business strategists explaining launch strategies, performance tracking, or growth planning. Fully editable in PowerPoint, Keynote, and Google Slides.


5 slides
Diabetes Treatments & Symptoms Infographics
Diabetes is a chronic medical condition that affects how the body processes glucose in the blood. There are three main types of diabetes: type 1 diabetes, type 2 diabetes, and gestational diabetes. These infographic templates are comprehensive and visually appealing tools designed to educate and create awareness about diabetes symptoms and treatment options. With its attractive design, concise information, and visually appealing graphics, this template will help individuals understand the importance of diabetes management and make informed decisions regarding their health. This template is completely customizable and compatible with Powerpoint, Keynote, and Google Slides.


4 slides
Networking Strategy Plan Presentation
Make every connection count with this clean and modern presentation design. Perfect for outlining relationship-building strategies, collaboration methods, or communication plans, it presents ideas clearly using a structured circular layout. Fully customizable and compatible with PowerPoint, Keynote, and Google Slides for a seamless and professional presentation experience.


26 slides
Managing Work-Life Balance Presentation
Find harmony between career and personal life with this insightful presentation on managing work-life balance. Covering key strategies like time management, stress reduction, remote work efficiency, and self-care practices, this template helps promote productivity and well-being. Fully customizable and compatible with PowerPoint, Keynote, and Google Slides for a seamless and engaging presentation experience.


8 slides
Business Lifecycle Circle Format Presentation
Present your business stages with clarity using this lifecycle circle diagram. Ideal for showcasing four key phases—planning, execution, growth, and review—in a circular format that emphasizes continuity. Each section includes icons and editable text. Fully customizable in PowerPoint, Keynote, or Google Slides for strategy meetings, reports, or progress updates.