


Features
- 5 Unique slides
- Fully editable and easy to edit in Microsoft Powerpoint, Keynote and Google Slides
- 16:9 widescreen layout
- Clean and professional designs
- Export to JPG, PDF or send by email


Do you have any questions?
Recommend


2 slides
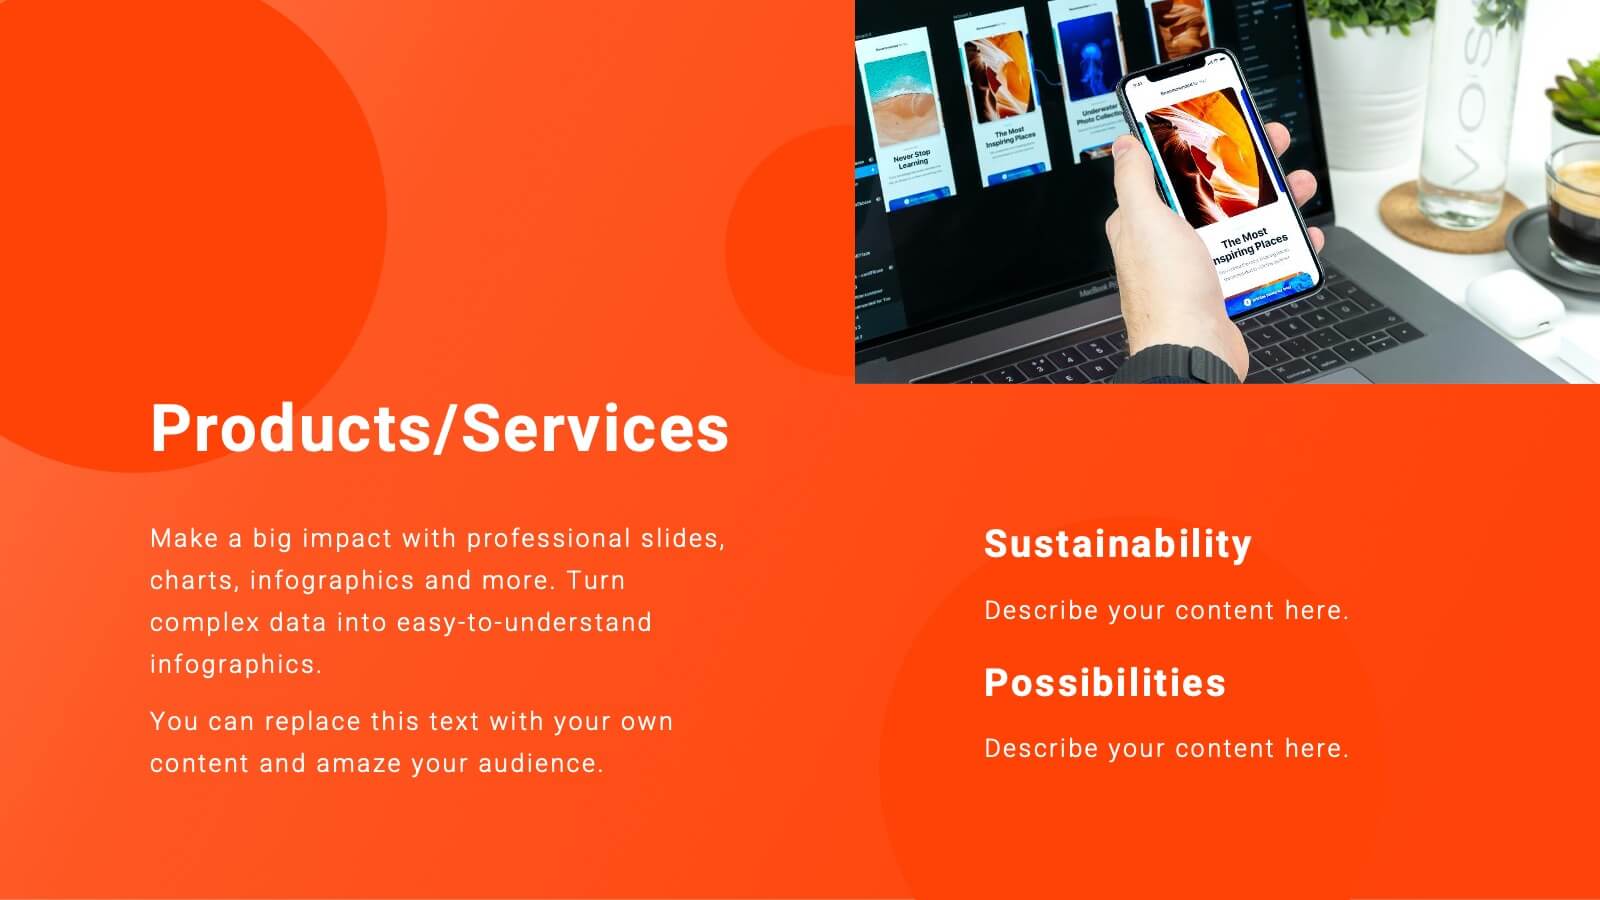
Mobile and Laptop Mockup Devices Presentation
Showcase your designs with the Mobile and Laptop Mockup Devices presentation template. Featuring clean and modern device frames, this slide helps you present responsive web designs, app interfaces, or digital content seamlessly. Ideal for designers, marketers, and tech presentations. Fully editable and compatible with PowerPoint, Keynote, and Google Slides.


4 slides
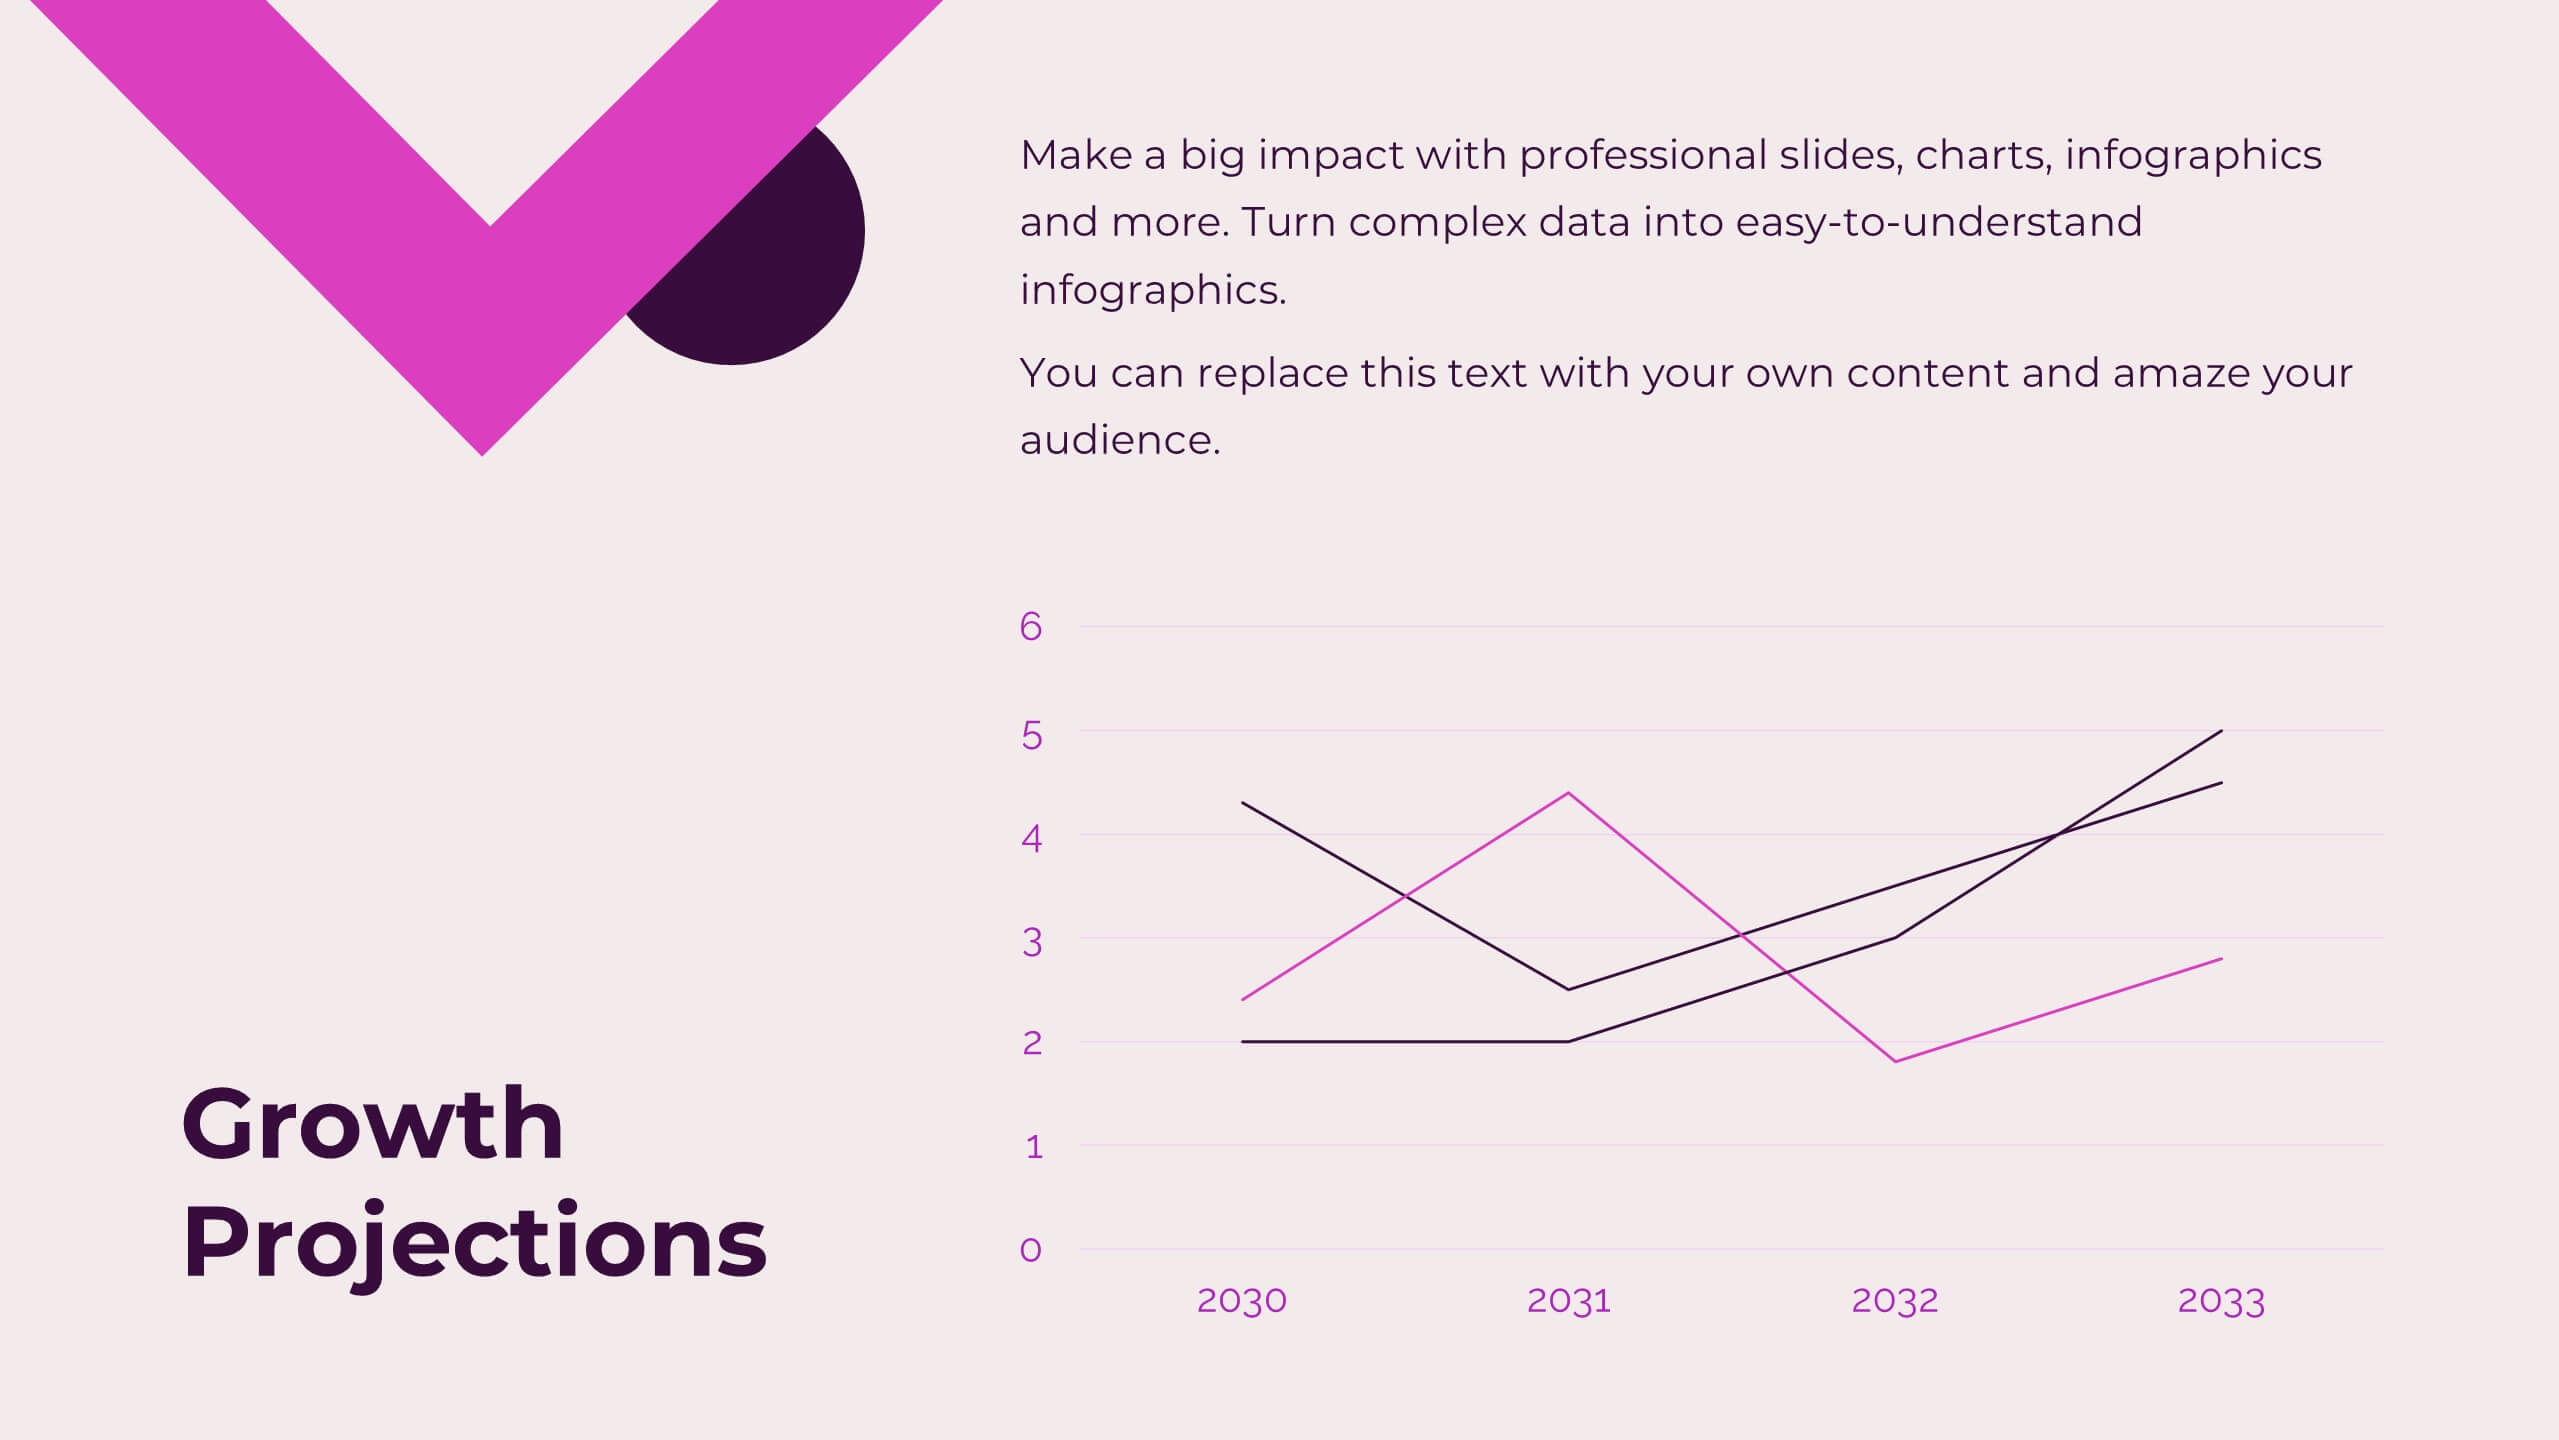
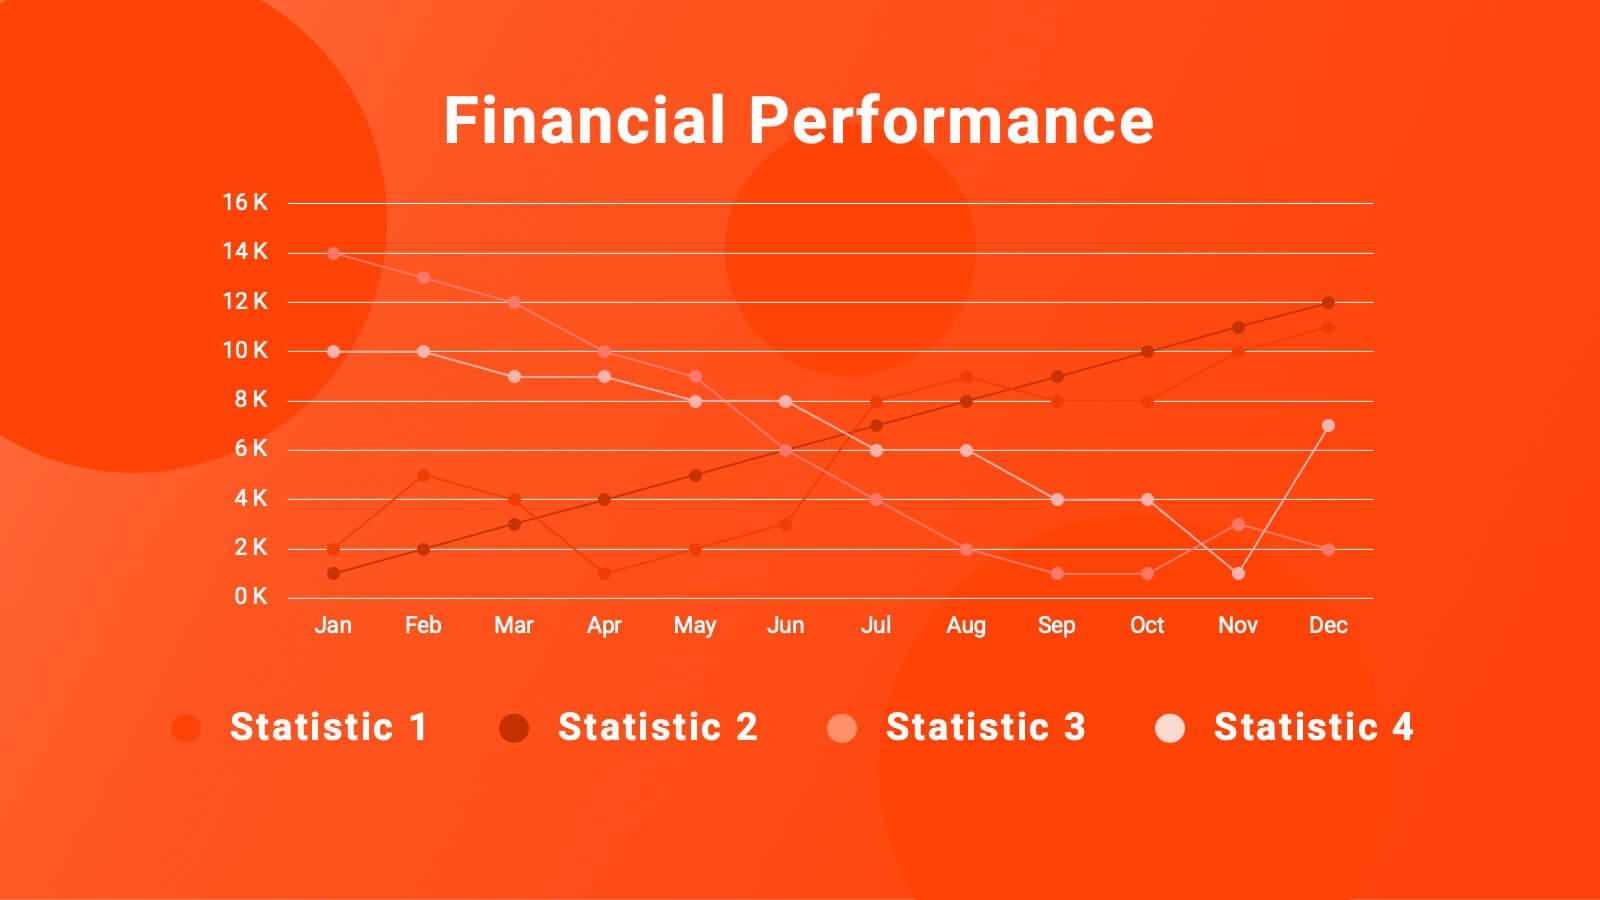
Stock Market Insights and Trends Presentation
Visualize complex financial data with ease using the Stock Market Insights and Trends presentation template. This layout features a bold line chart with labeled milestones to highlight key shifts in performance, market patterns, or strategic indicators. Ideal for investment reports, financial briefings, and economic updates. Perfect for analysts, finance professionals, and business strategists. Fully editable and compatible with PowerPoint, Keynote, and Google Slides.


7 slides
Root Cause Analysis for Problem Solving Presentation
Identify and Resolve Issues Effectively with this Root Cause Analysis for Problem Solving presentation template. Designed to streamline complex problem-solving, this layout features clear visual markers, structured iconography, and step-by-step segmentation to help teams analyze causes, pinpoint bottlenecks, and implement solutions efficiently. Ideal for project managers, business analysts, and operational teams, this template is fully customizable and works seamlessly in PowerPoint, Keynote, and Google Slides, ensuring a professional and engaging presentation experience.


5 slides
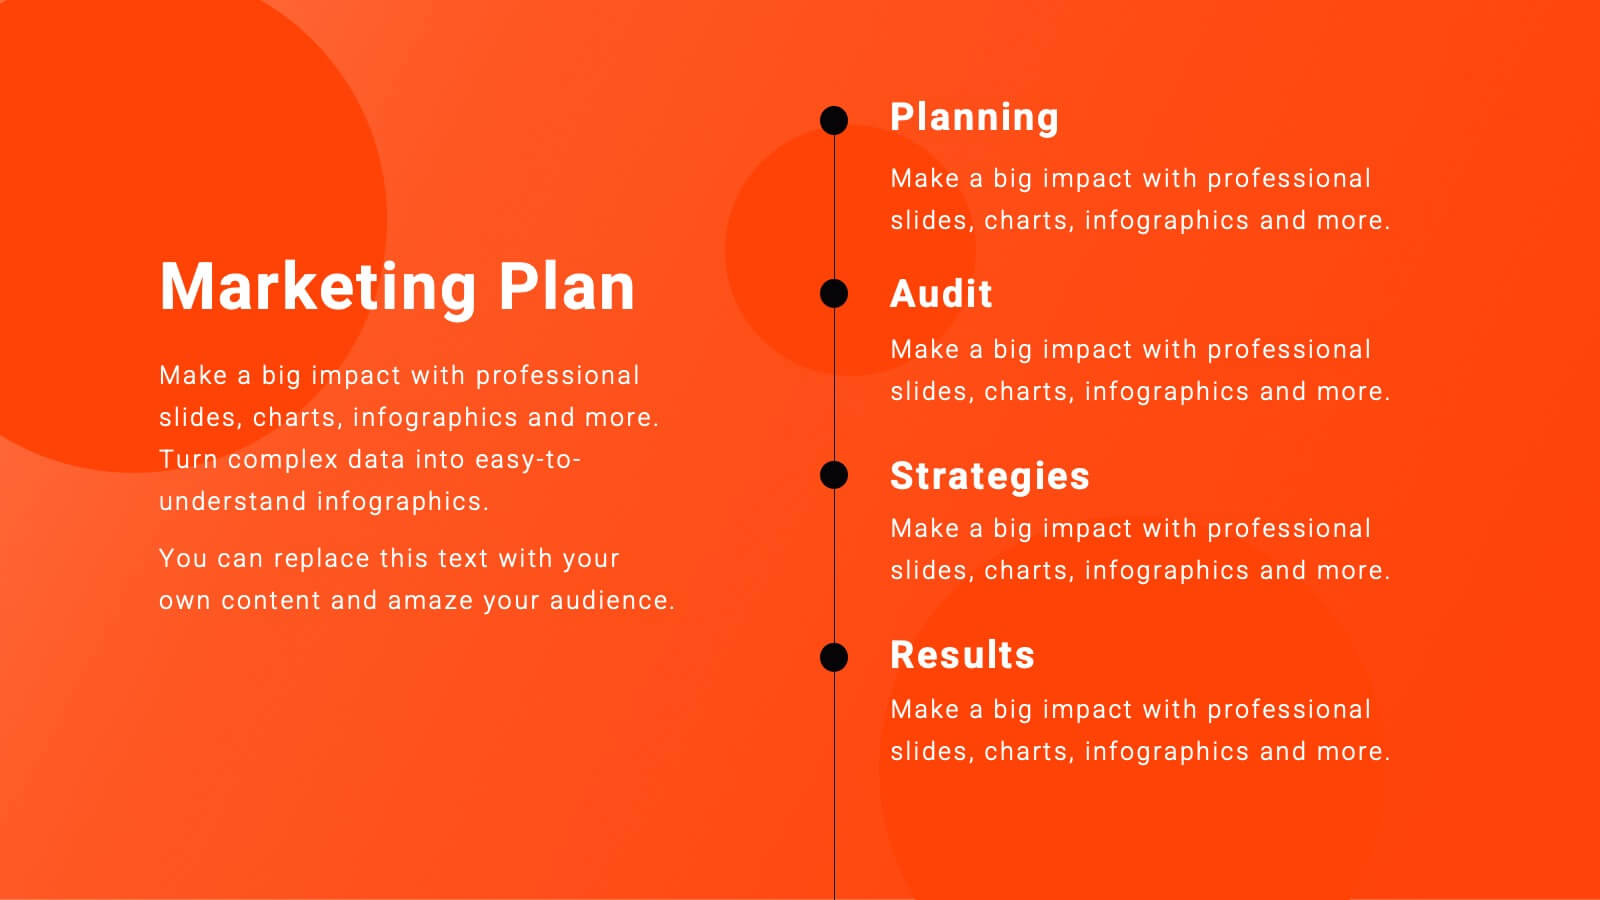
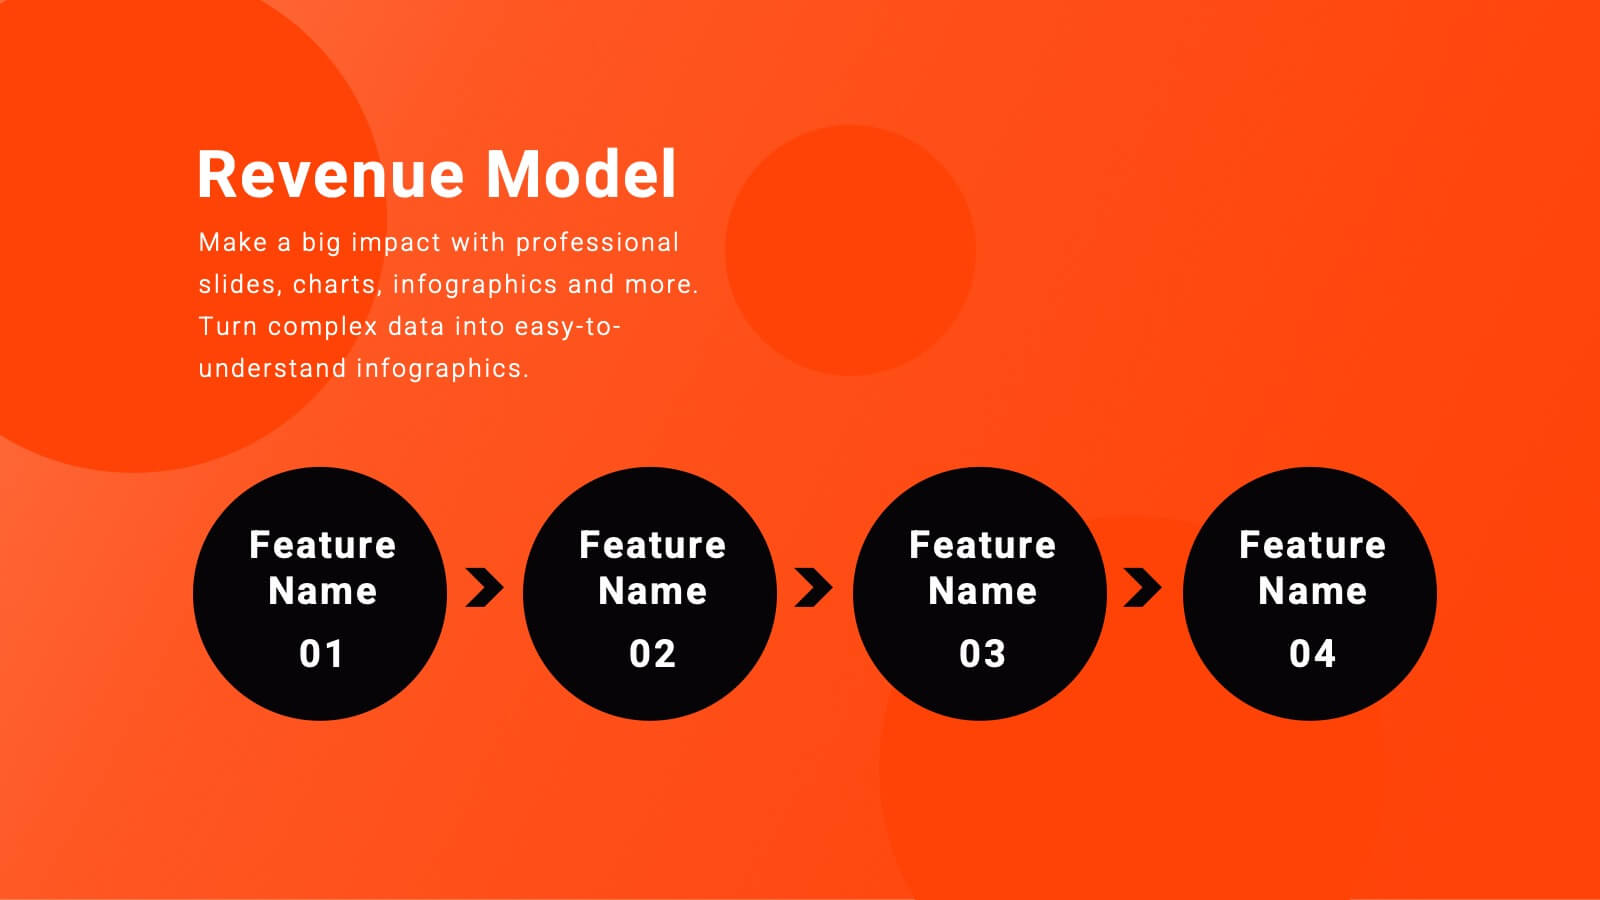
Project Management Framework
Guide your team through every project phase with this step-by-step framework presentation. Designed with a five-stage visual flow, this layout helps clearly communicate key milestones, tasks, and deliverables. Each stage is color-coded for easy tracking and includes editable text and icons. Perfect for planning, strategy, and agile workflows. Fully compatible with PowerPoint, Keynote, and Google Slides.


7 slides
Customer Journey Stages Infographic Presentation
A Customer Journey consists of a series of interactions that occur over time between your company and the customer. Our template uses a colorful color scheme and style to present a customer journey. This communicates how the customer moves through their process. The layout allows you to customize each text box with your own text. The stages are color coded, making it easy for you to identify them. This template is designed to provide the most up-to-date research and analytical data so you can effectively engage and connect with your audience. Capture your customer's journey with this template!


4 slides
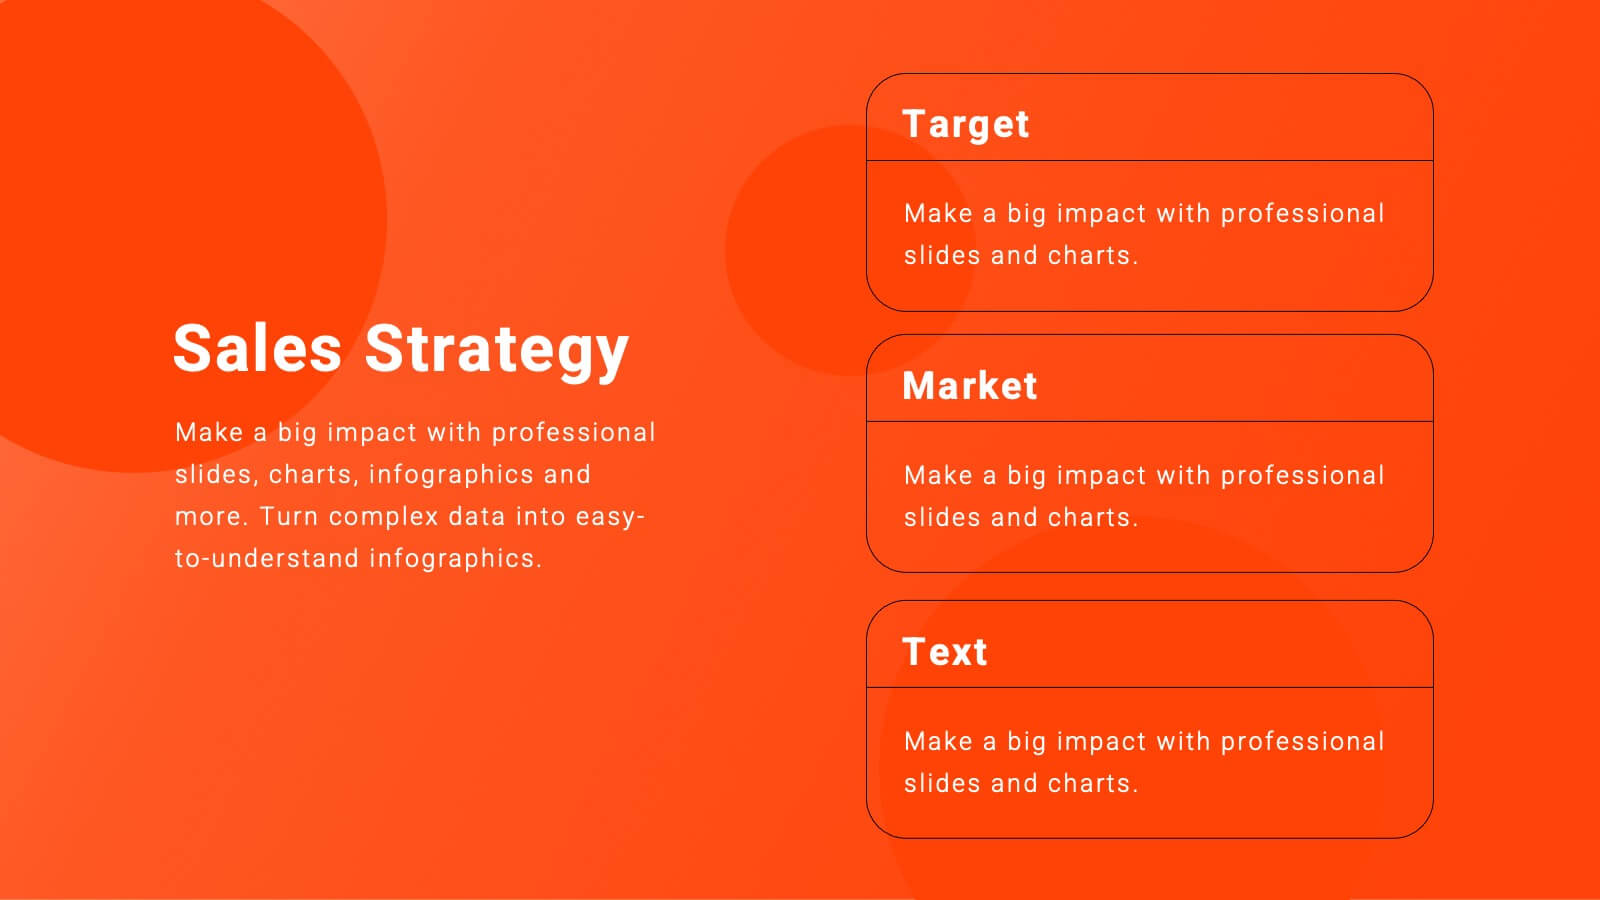
Problem-Solving Strategy Presentation
Navigate challenges with confidence using this problem-solving strategy template! Designed to break down complex issues into manageable steps, this structured layout helps teams identify solutions effectively. Perfect for business leaders, project managers, and strategists aiming for clarity and action. Fully customizable and compatible with PowerPoint, Keynote, and Google Slides.


23 slides
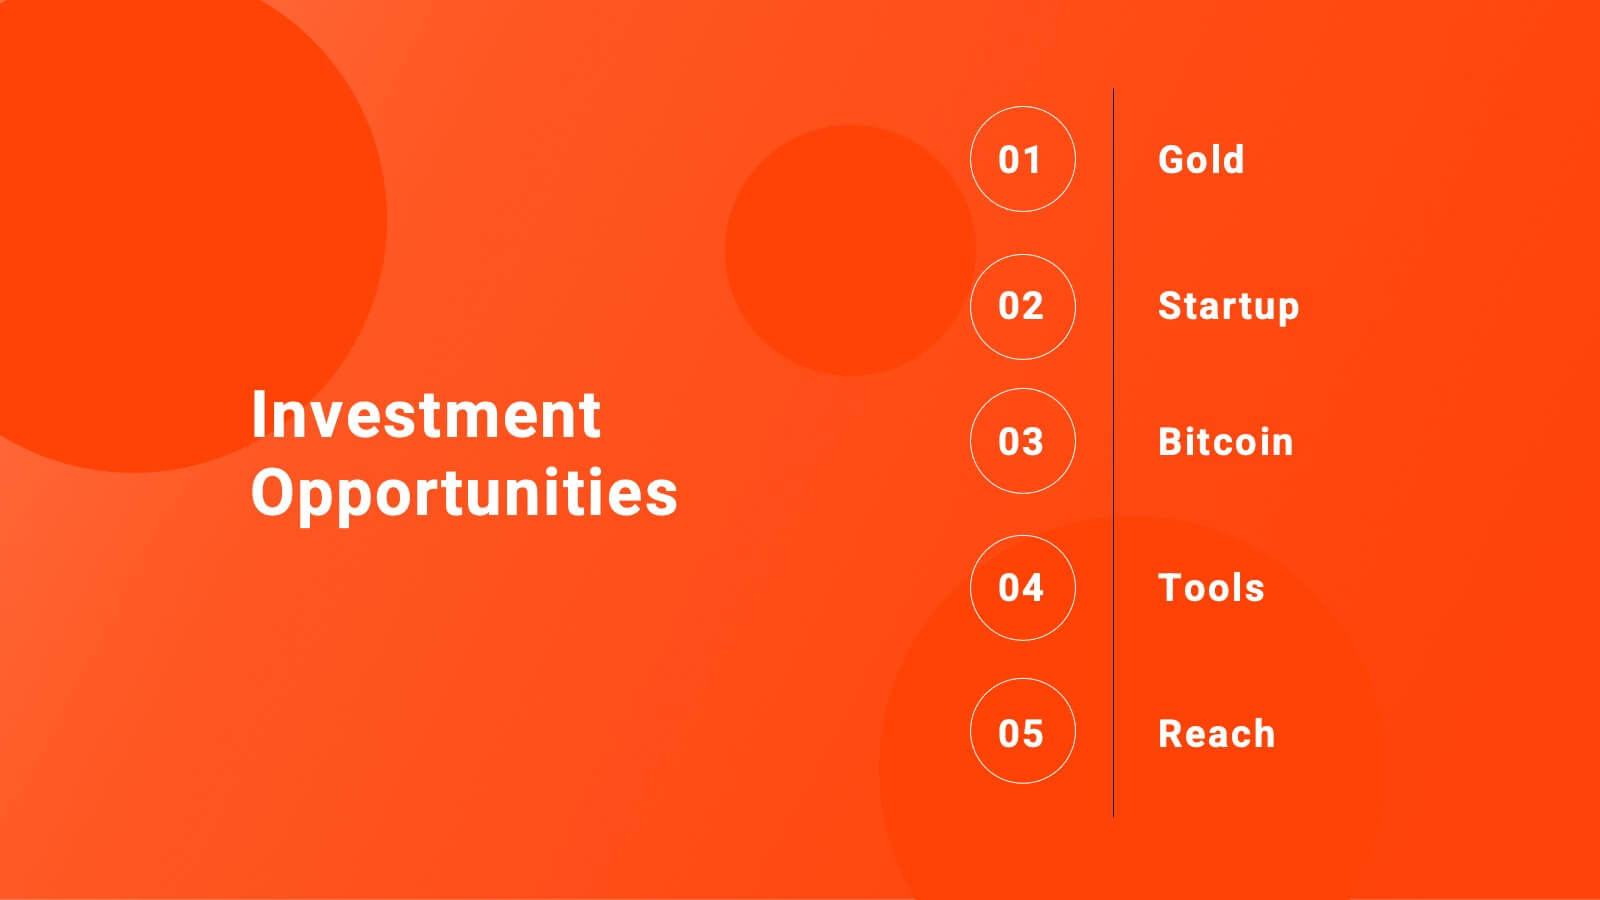
Skycrest Business Idea Pitch Deck Presentation
Present your innovative business idea with this bold pitch deck, featuring sections for problem statement, solution, business model, and financial projections. Ideal for capturing investor attention, this template supports PowerPoint, Keynote, and Google Slides, making it perfect for impactful presentations across multiple platforms.


20 slides
Creative Marketing Proposal Presentation
Elevate your business proposals with this sleek marketing proposal template, designed in dynamic purple tones. It comprehensively covers everything from company overview to pricing structures, making it perfect for detailing your marketing strategies effectively. Compatible with PowerPoint, Google Slides, and Keynote, it's ideal for professionals aiming to impress clients and secure projects.


7 slides
Geometric Infographic Presentation Template
Our Geometric Infographic template will help you quickly create an original, beautiful and professional presentation with charts and diagrams of any kind. The template includes fully editable slides with a number of built-in shapes, as well as transitions. You can use the template for any kind of presentation involving geometrics. It’s ideal for product presentations and market analysis, but you can also use it to showcase your business case. This geometric Infographic template is a great way to present a large amount of information to an audience and features a clean and modern design!


8 slides
Air Travel Safety and Operations Presentation
Capture your audience’s attention with this aviation window-inspired layout, designed to visualize safety protocols or operational steps in air travel. Featuring four distinct segments arranged like a view through a plane window, it’s ideal for airline safety briefings, operational workflows, or compliance overviews. Fully editable in PowerPoint, Keynote, and Google Slides.


7 slides
Meeting Infographic Presentation Template
Meetings are an important part of workplace culture. They help people build relationships, share ideas and make decisions. This template is a great way to show the importance of meetings to your managers and employees. This presentation can be used in a workplace to show how meetings help team members share knowledge and work. By providing an open dialogue, they can also be a useful tool for making employees feel valued and heard. Using the fun customizable illustrations provided in the template, keep your team members engaged on meetings and boost the entire team’s work ethic.


4 slides
30 60 90 Day Plan Goals Presentation
Set your roadmap in motion with a clean, visual timeline that makes each milestone easy to follow and present with confidence. This presentation helps you outline priorities, track progress, and communicate clear goals for the first three months. Fully editable and compatible with PowerPoint, Keynote, and Google Slides.


22 slides
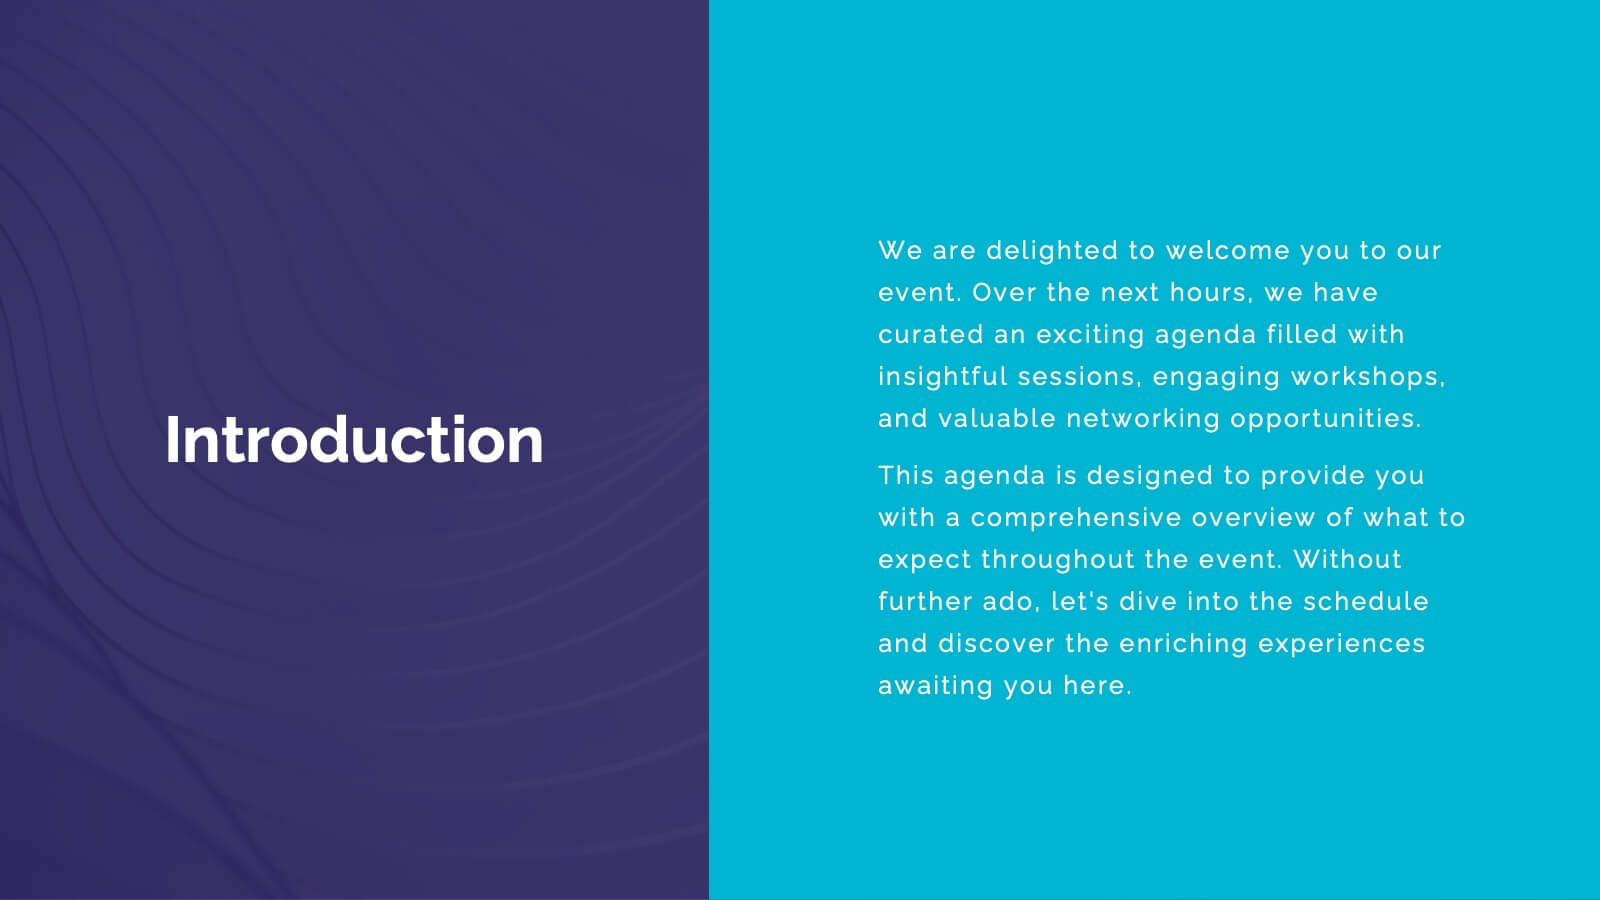
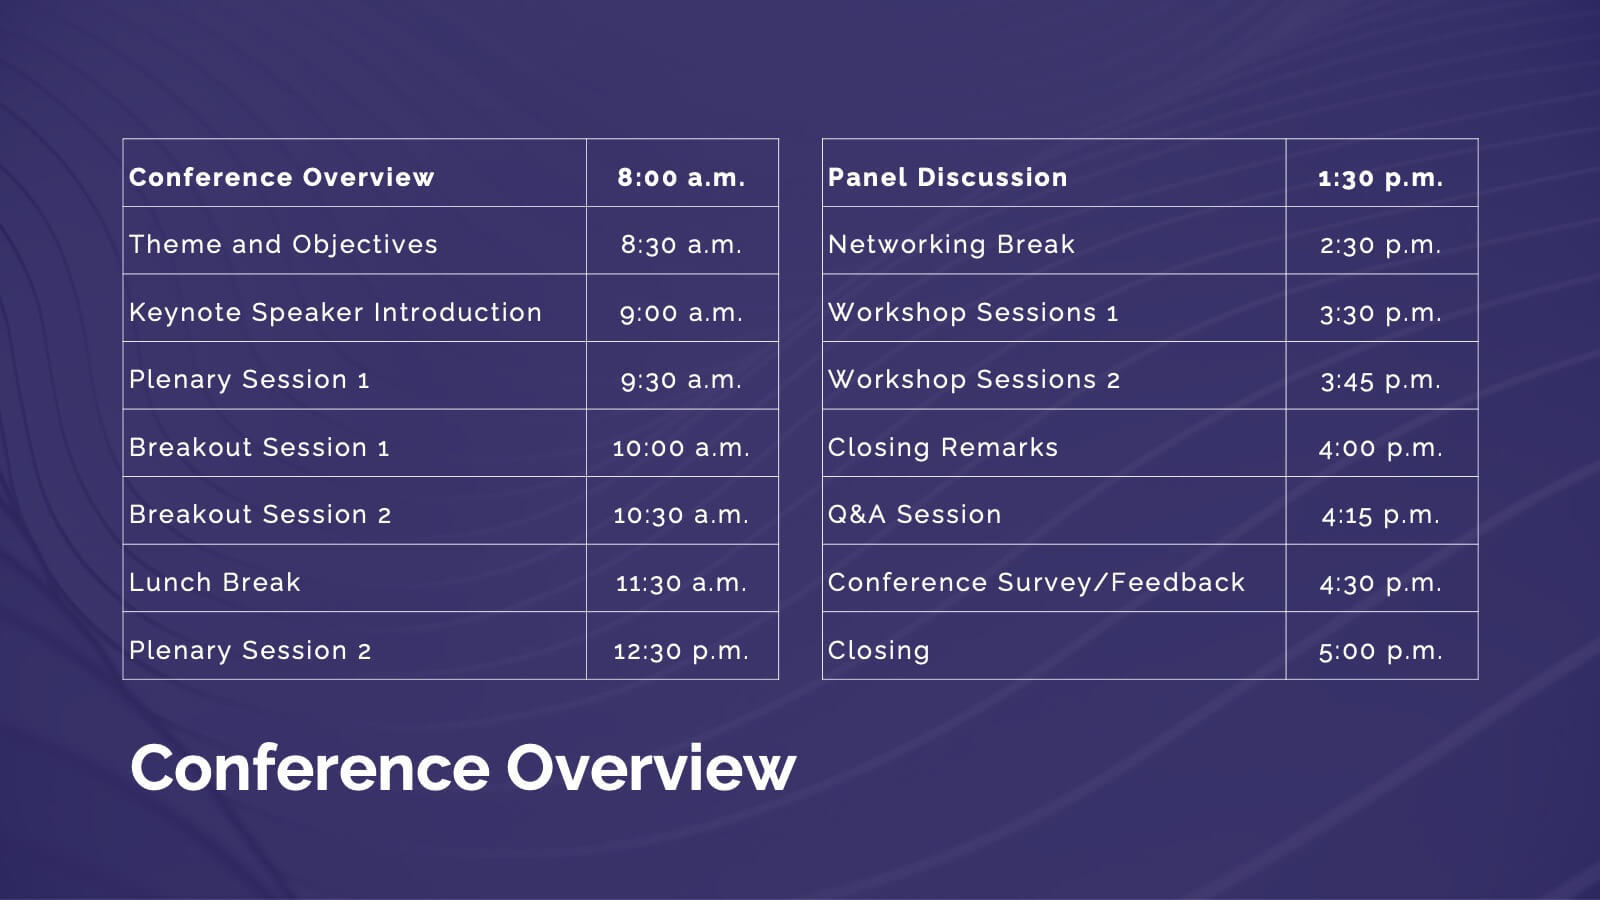
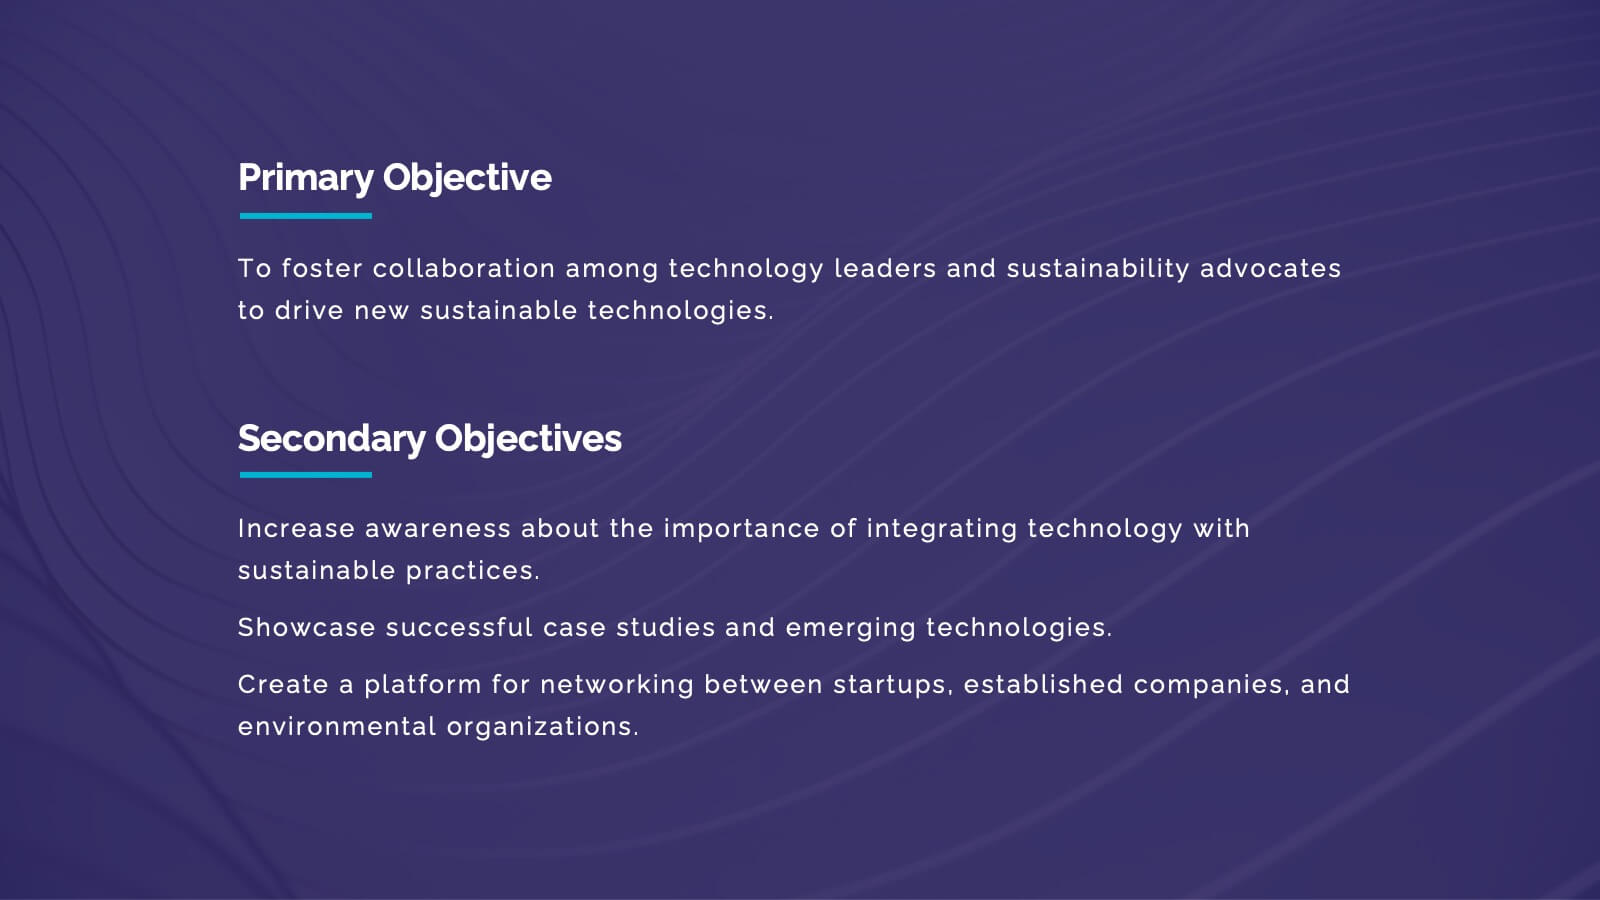
Nimbus Business Development Proposal Presentation
Boost your business presentations with this vibrant, professional template designed for business development proposals. Perfect for detailing conference overviews, themes, objectives, and keynotes, it features a clean and engaging layout. Highlight critical sessions and networking opportunities to captivate your audience. Compatible with PowerPoint, Keynote, and Google Slides, it ensures seamless presentations on any platform.


7 slides
Digital KPI Dashboard Infographic
A KPI Dashboard is a visual representation of the most important performance metrics or KPIs that track the progress of an organization or business activities. This infographic template is designed to showcase the KPIs and metrics that are crucial for evaluating the success of digital marketing efforts. This template provides an overview of various digital marketing KPIs in an easy-to-understand format. The template utilizes eye-catching charts, graphs, and diagrams to present digital marketing data in a visually appealing way. Bar graphs, line charts, pie charts, and other visual elements make it easy to grasp the performance trends at a glance.


23 slides
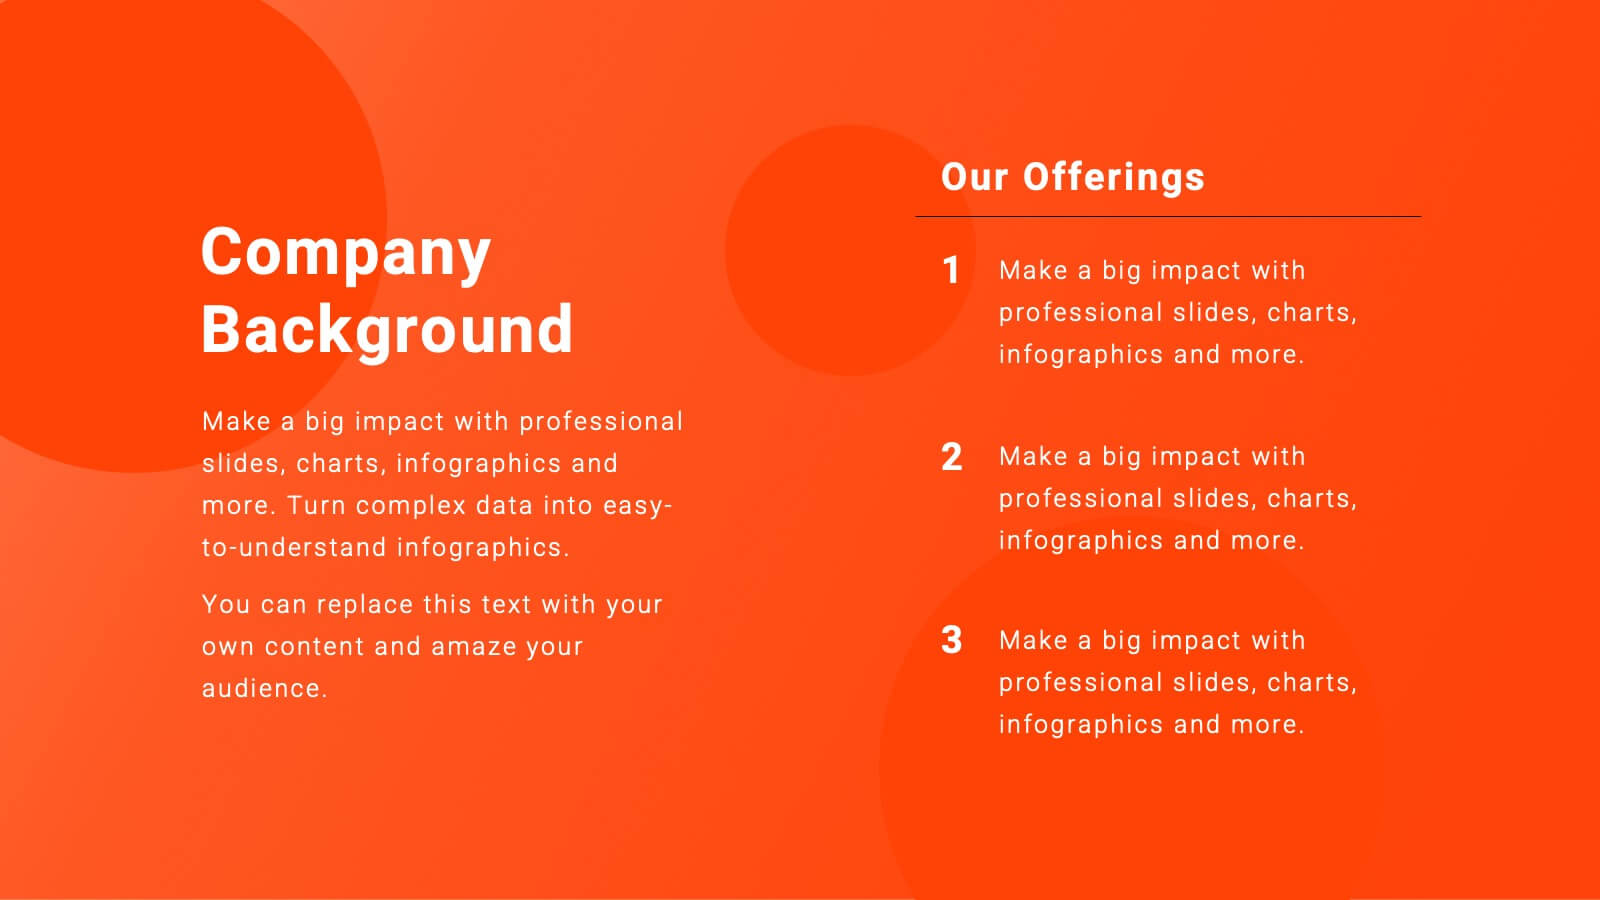
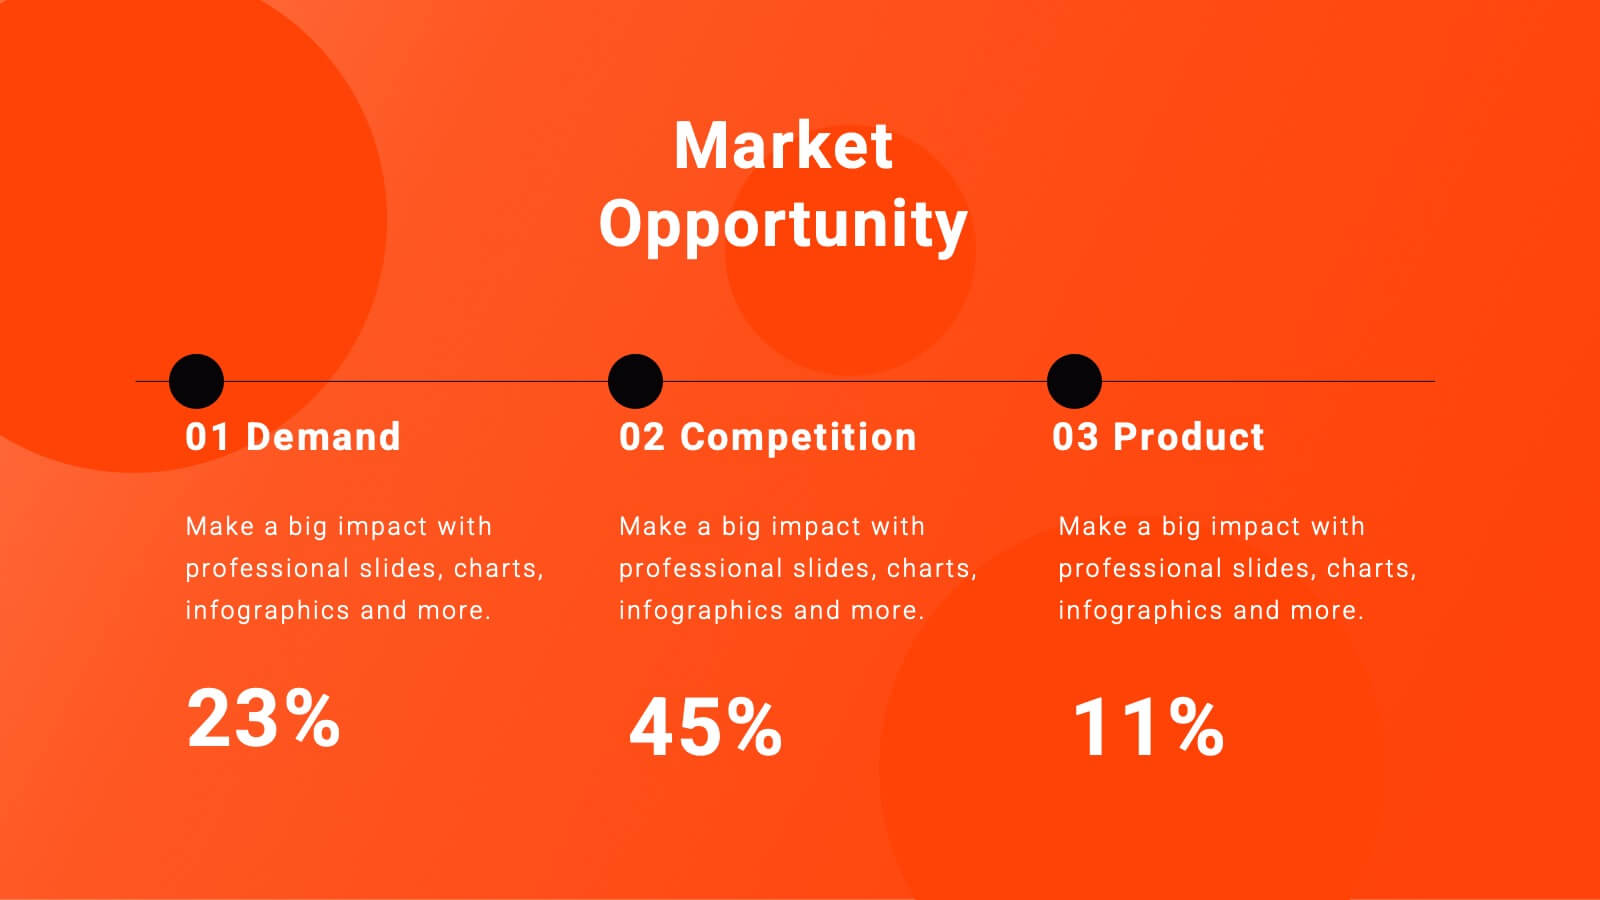
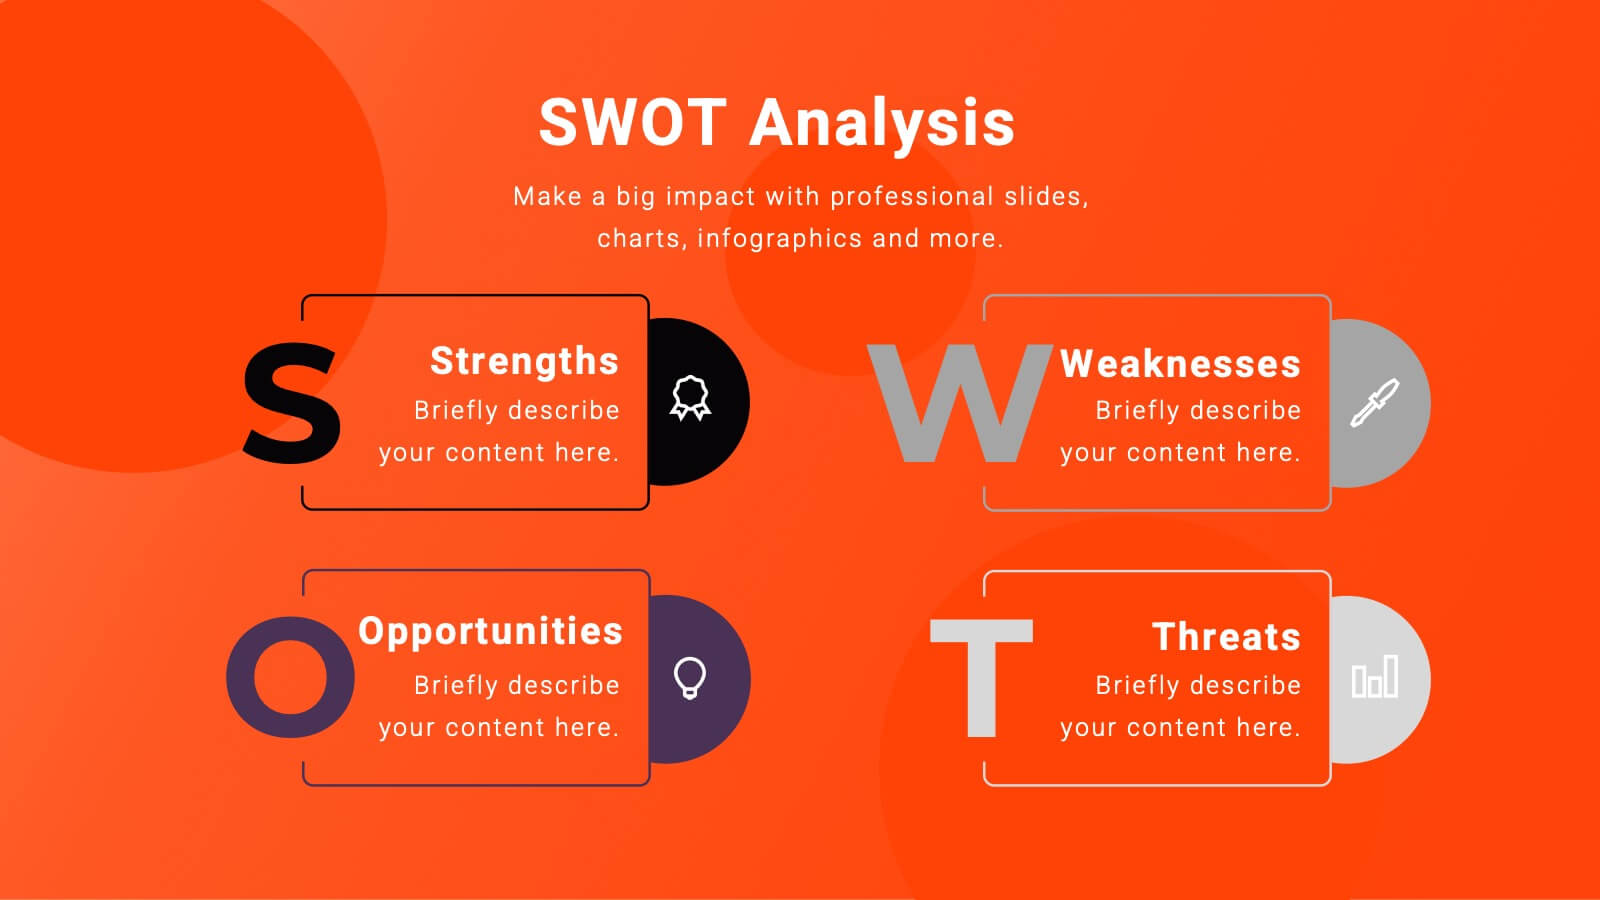
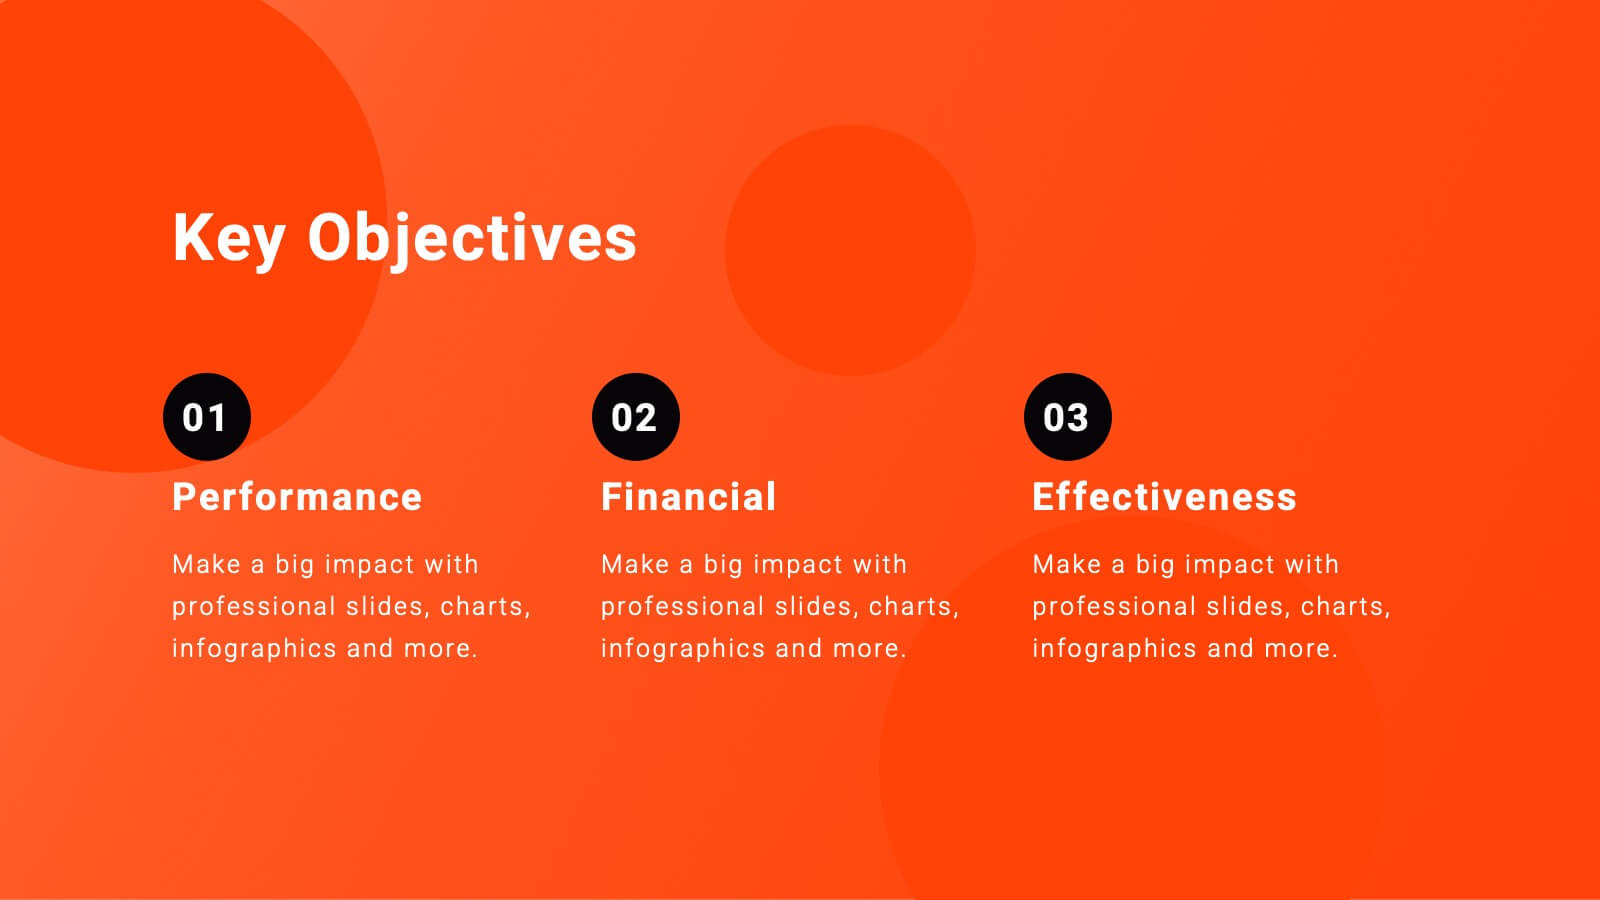
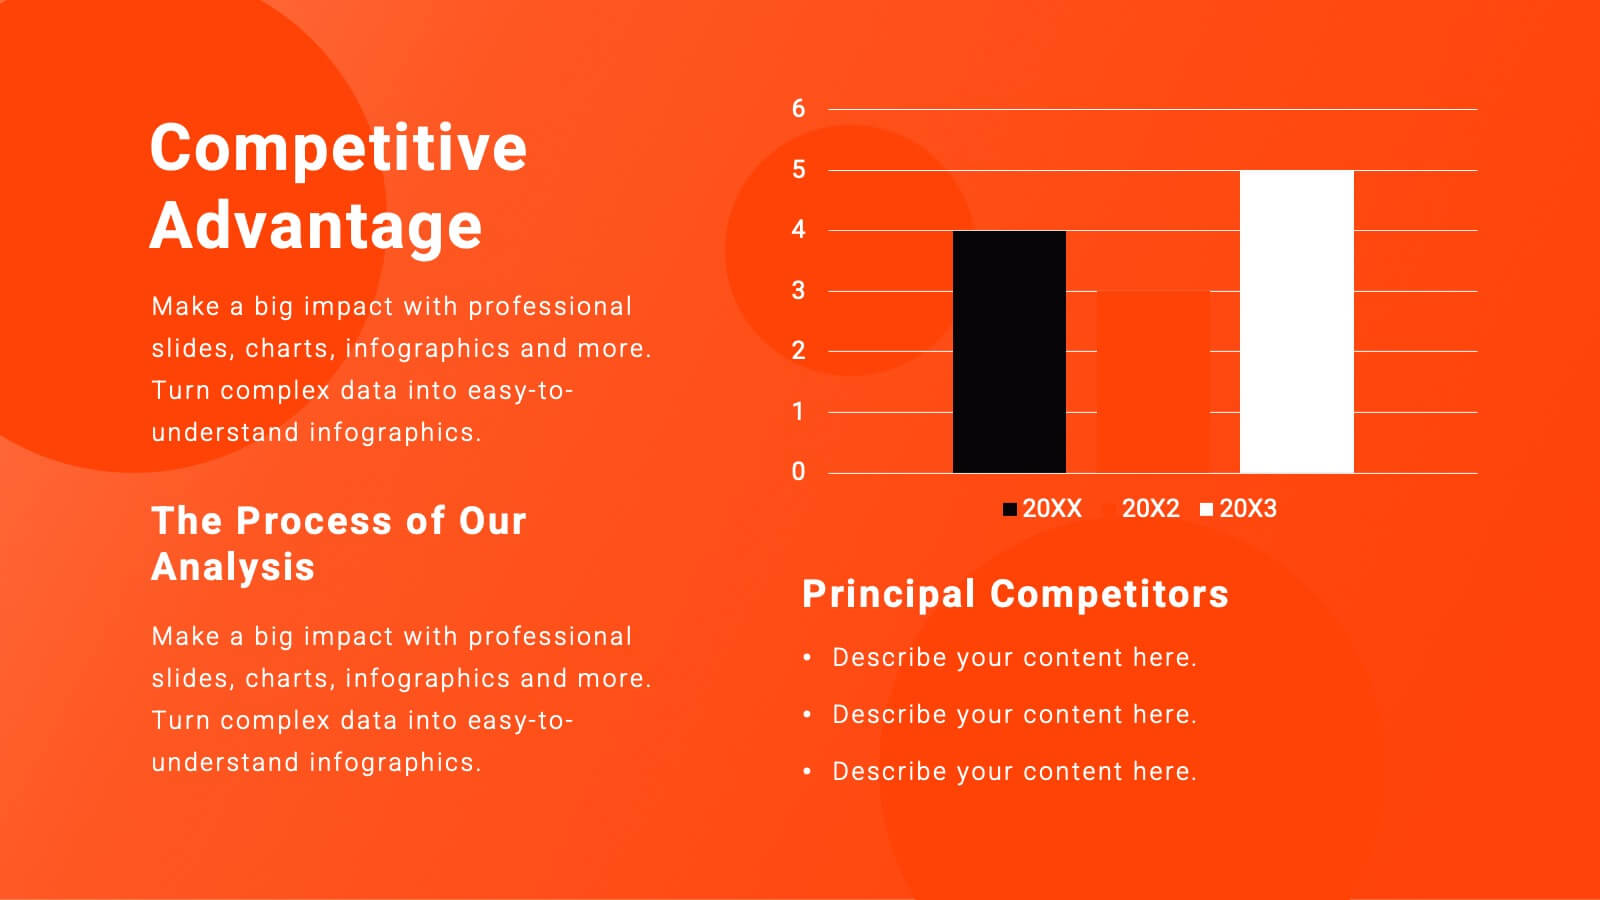
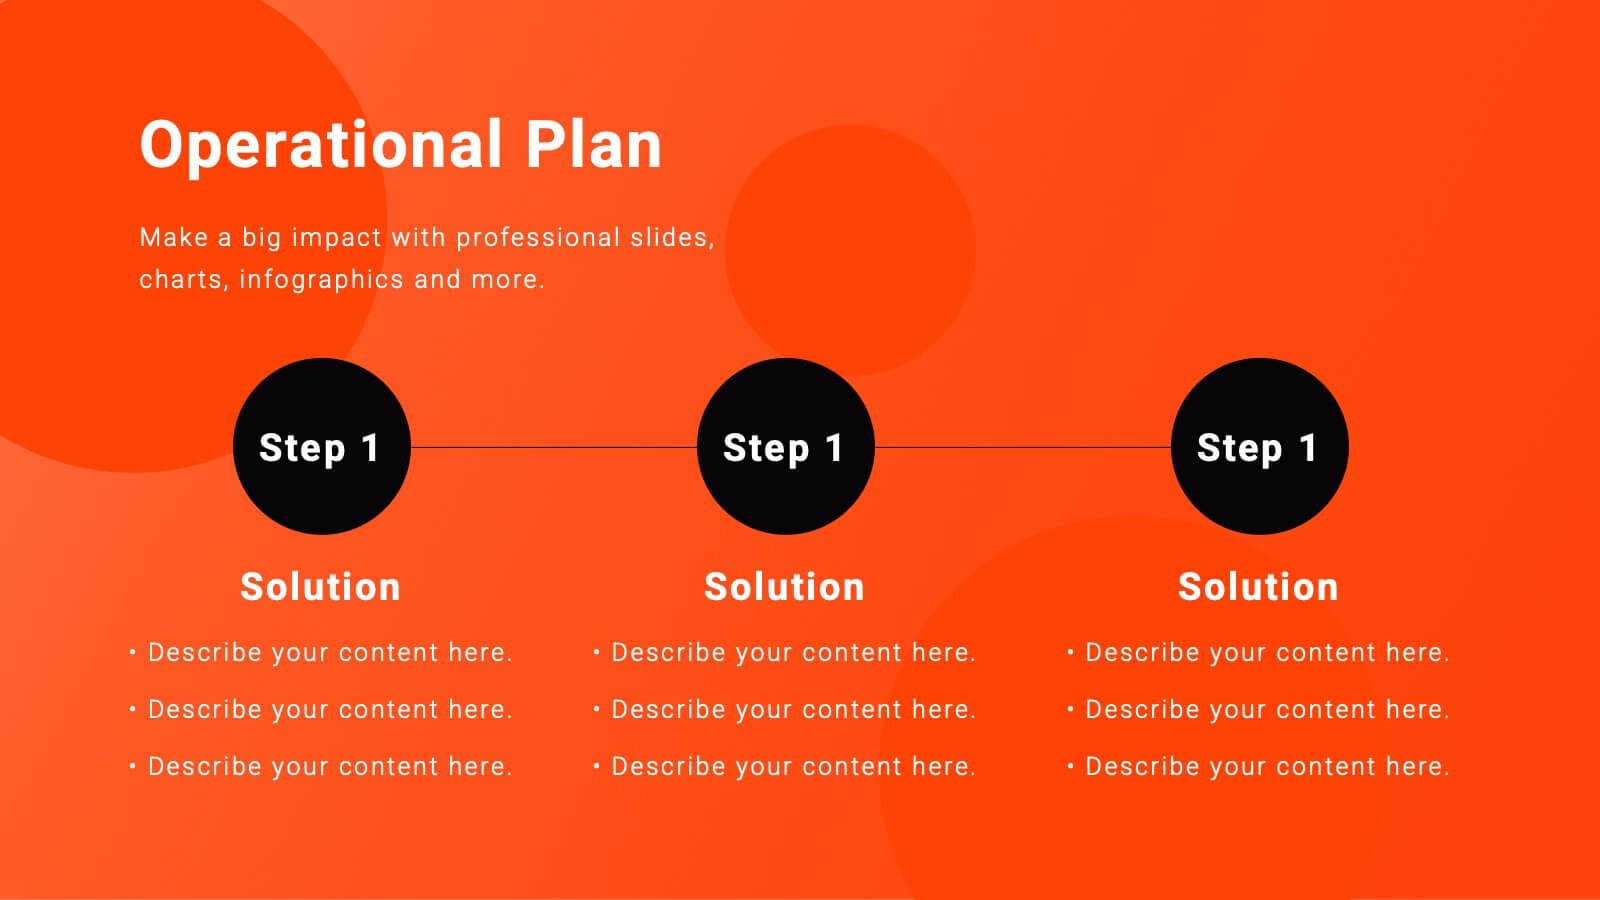
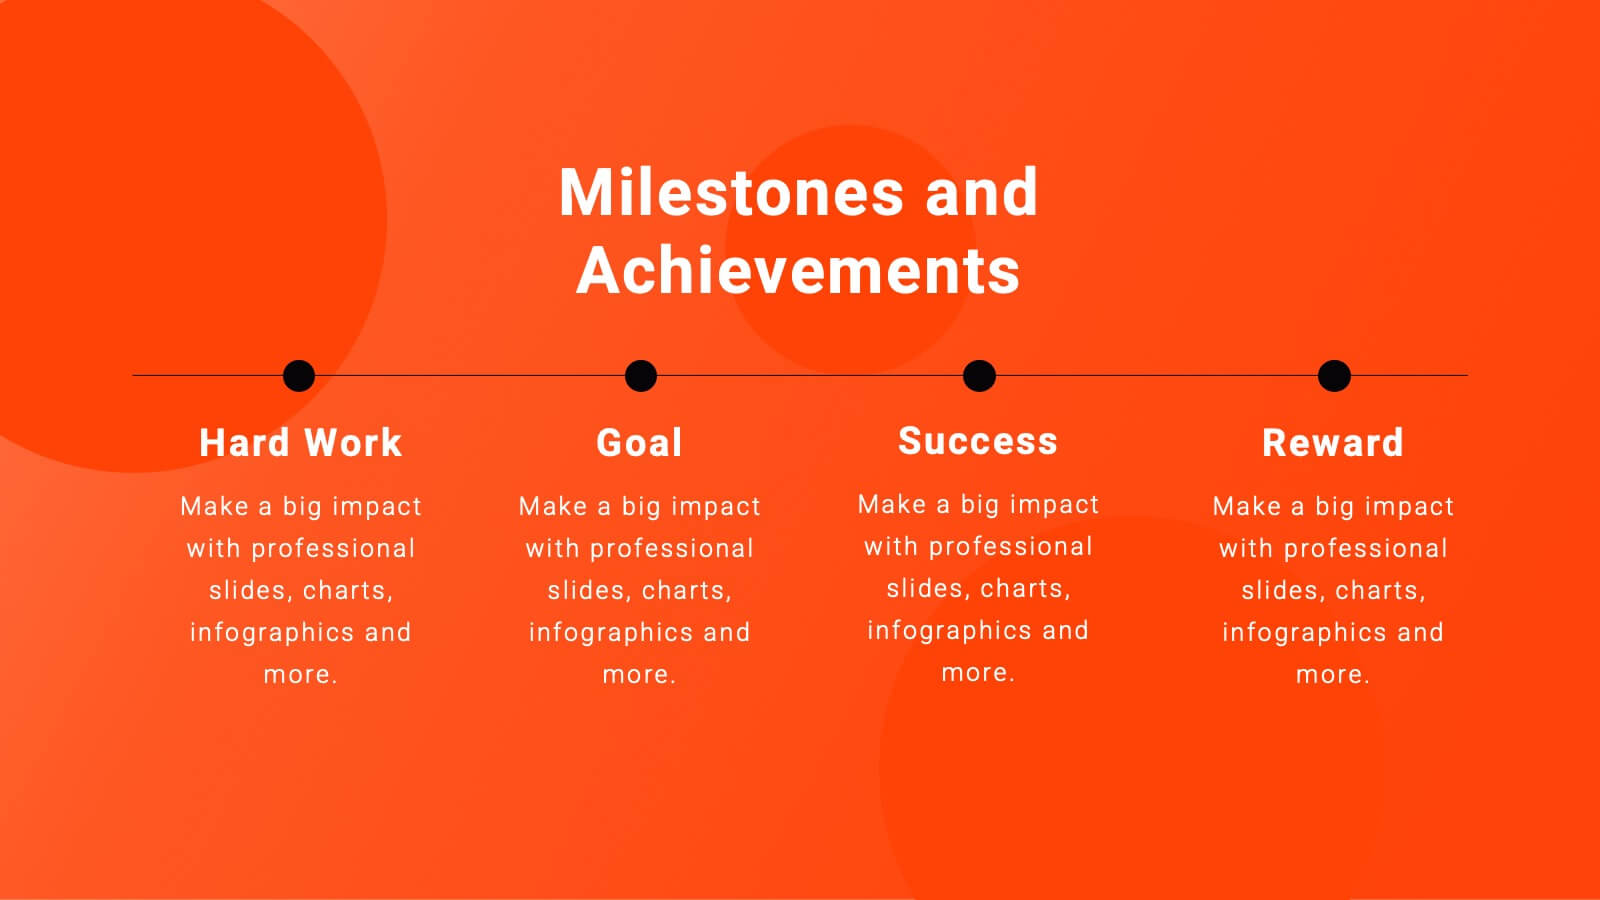
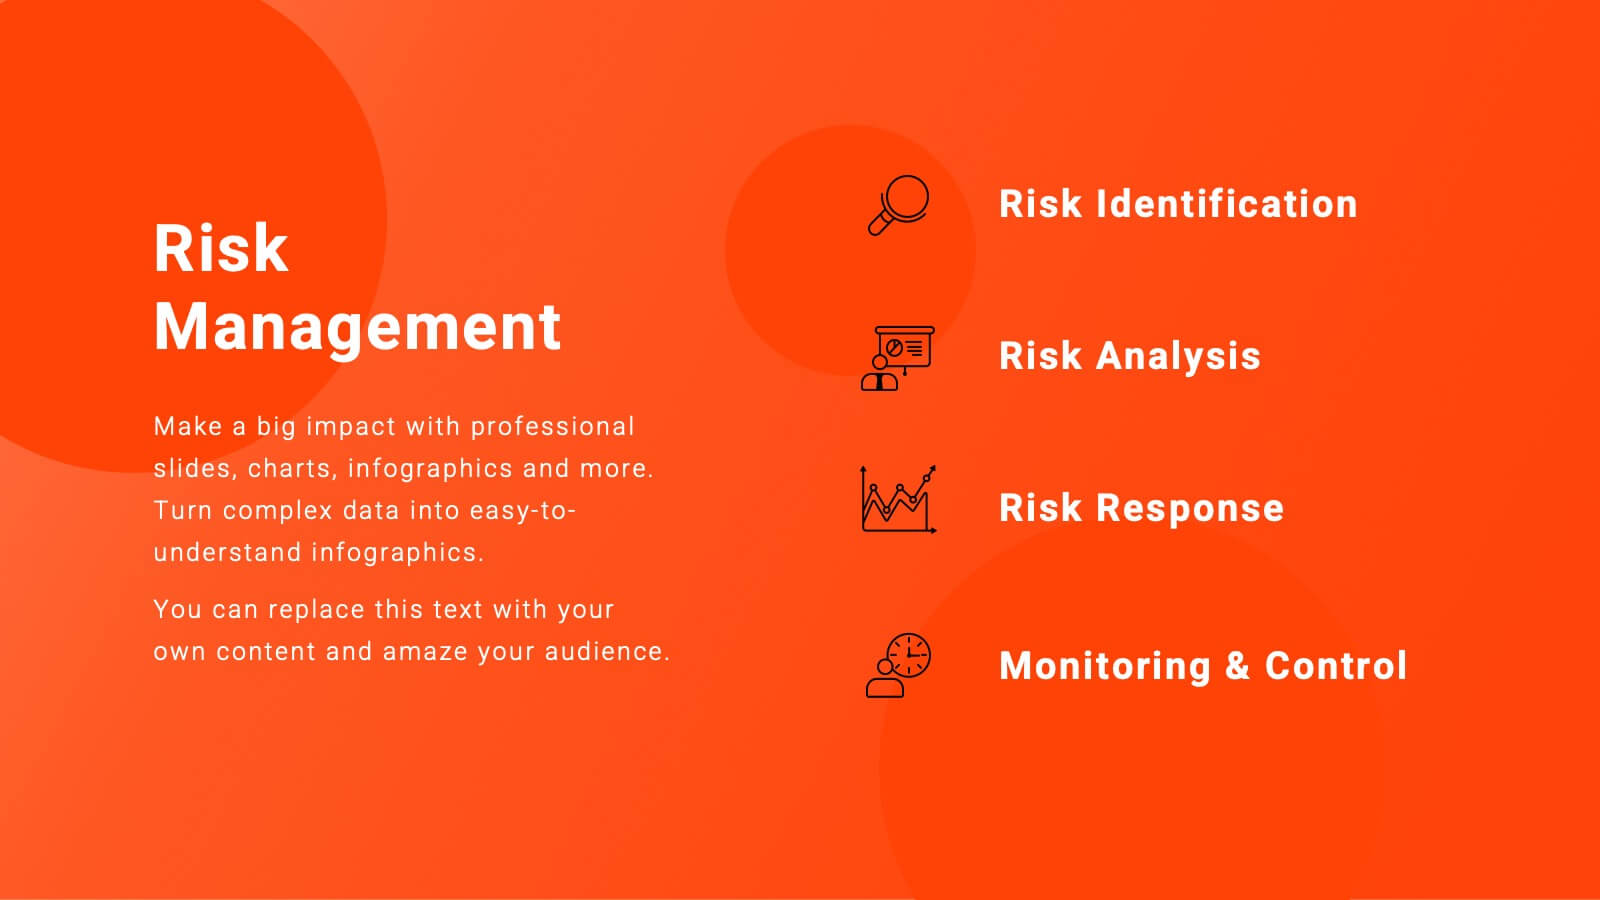
Equinox Business Operations Plan Presentation
Elevate your business operations with this dynamic plan template! Perfect for detailing company background, market opportunities, and strategic objectives. Ideal for business leaders and managers aiming to streamline operations and drive growth. Compatible with PowerPoint, Keynote, and Google Slides, this template ensures your business plan is clear, professional, and impactful. Drive success today!


4 slides
Social Media Content Strategy Presentation
Engage your audience with this Social Media Content Strategy Presentation. Featuring side-by-side thumbs-up icons, this template visually contrasts two key focus areas—ideal for comparing campaign goals, content pillars, or platform strategies. Each section includes editable text blocks to outline insights clearly. Fully customizable and compatible with PowerPoint, Keynote, and Google Slides.


5 slides
Educational A-Z Letter Design Presentation
Present your ideas with clarity using the Educational A-Z Letter Design Presentation. This slide uses a vertical layout with stylized book-like segments and bold A–D lettering, ideal for categorizing content or showcasing multi-part learning points. Fully editable and compatible with PowerPoint, Keynote, and Google Slides.