


Features
- 24 Unique Slides
- Fully editable and easy to edit in Microsoft Powerpoint, Keynote and Google Slides
- 16:9 widescreen layout
- Clean and professional designs
- Export to JPG, PDF or send by email


Do you have any questions?
Recommend


4 slides
Key Business Insights Executive Summary
Present your insights like a pro with this dynamic, timeline-inspired slide that makes key data points easy to follow. Designed to highlight four major takeaways or milestones, this visual format is ideal for summarizing business progress, strategy updates, or operational highlights. Fully editable in PowerPoint, Keynote, and Google Slides.


12 slides
Project Completion Checklist
Streamline project tracking with this clean and functional project completion checklist slide. Ideal for task management and progress reporting, it includes editable sections for task descriptions, process stages, current status, and additional notes. With toggles like “In Process,” “On Hold,” “Complete,” and “Overdue,” this layout is perfect for keeping teams aligned. Fully editable in PowerPoint, Keynote, and Google Slides.


26 slides
Innovative Business Strategies Presentation
Maximize your business's potential with our Innovative Business Strategies presentation template. This versatile template is a game-changer, compatible with PowerPoint, Keynote, and Google Slides, ensuring seamless integration into any platform you prefer. Crafted to propel your presentations to the next level, it is perfect for entrepreneurs, startups, and corporations aiming to showcase their strategic vision with clarity and impact. The Innovative Business Strategies template includes a variety of slides designed to present complex business strategies in a straightforward, digestible format. It features a clean, professional design that helps convey your message effectively, making it easier for your audience to grasp and remember key points. With customizable graphics and easy-to-edit layouts, you can tailor each slide to fit your brand's unique identity and strategic goals. Whether you're presenting to stakeholders, team members, or at a conference, this template provides the tools you need to communicate your business strategy with confidence. Boost your presentation's visibility and make it the go-to resource for individuals seeking a clear and engaging way to learn about innovative business strategies.


4 slides
Boardroom Strategy Meeting Overview Presentation
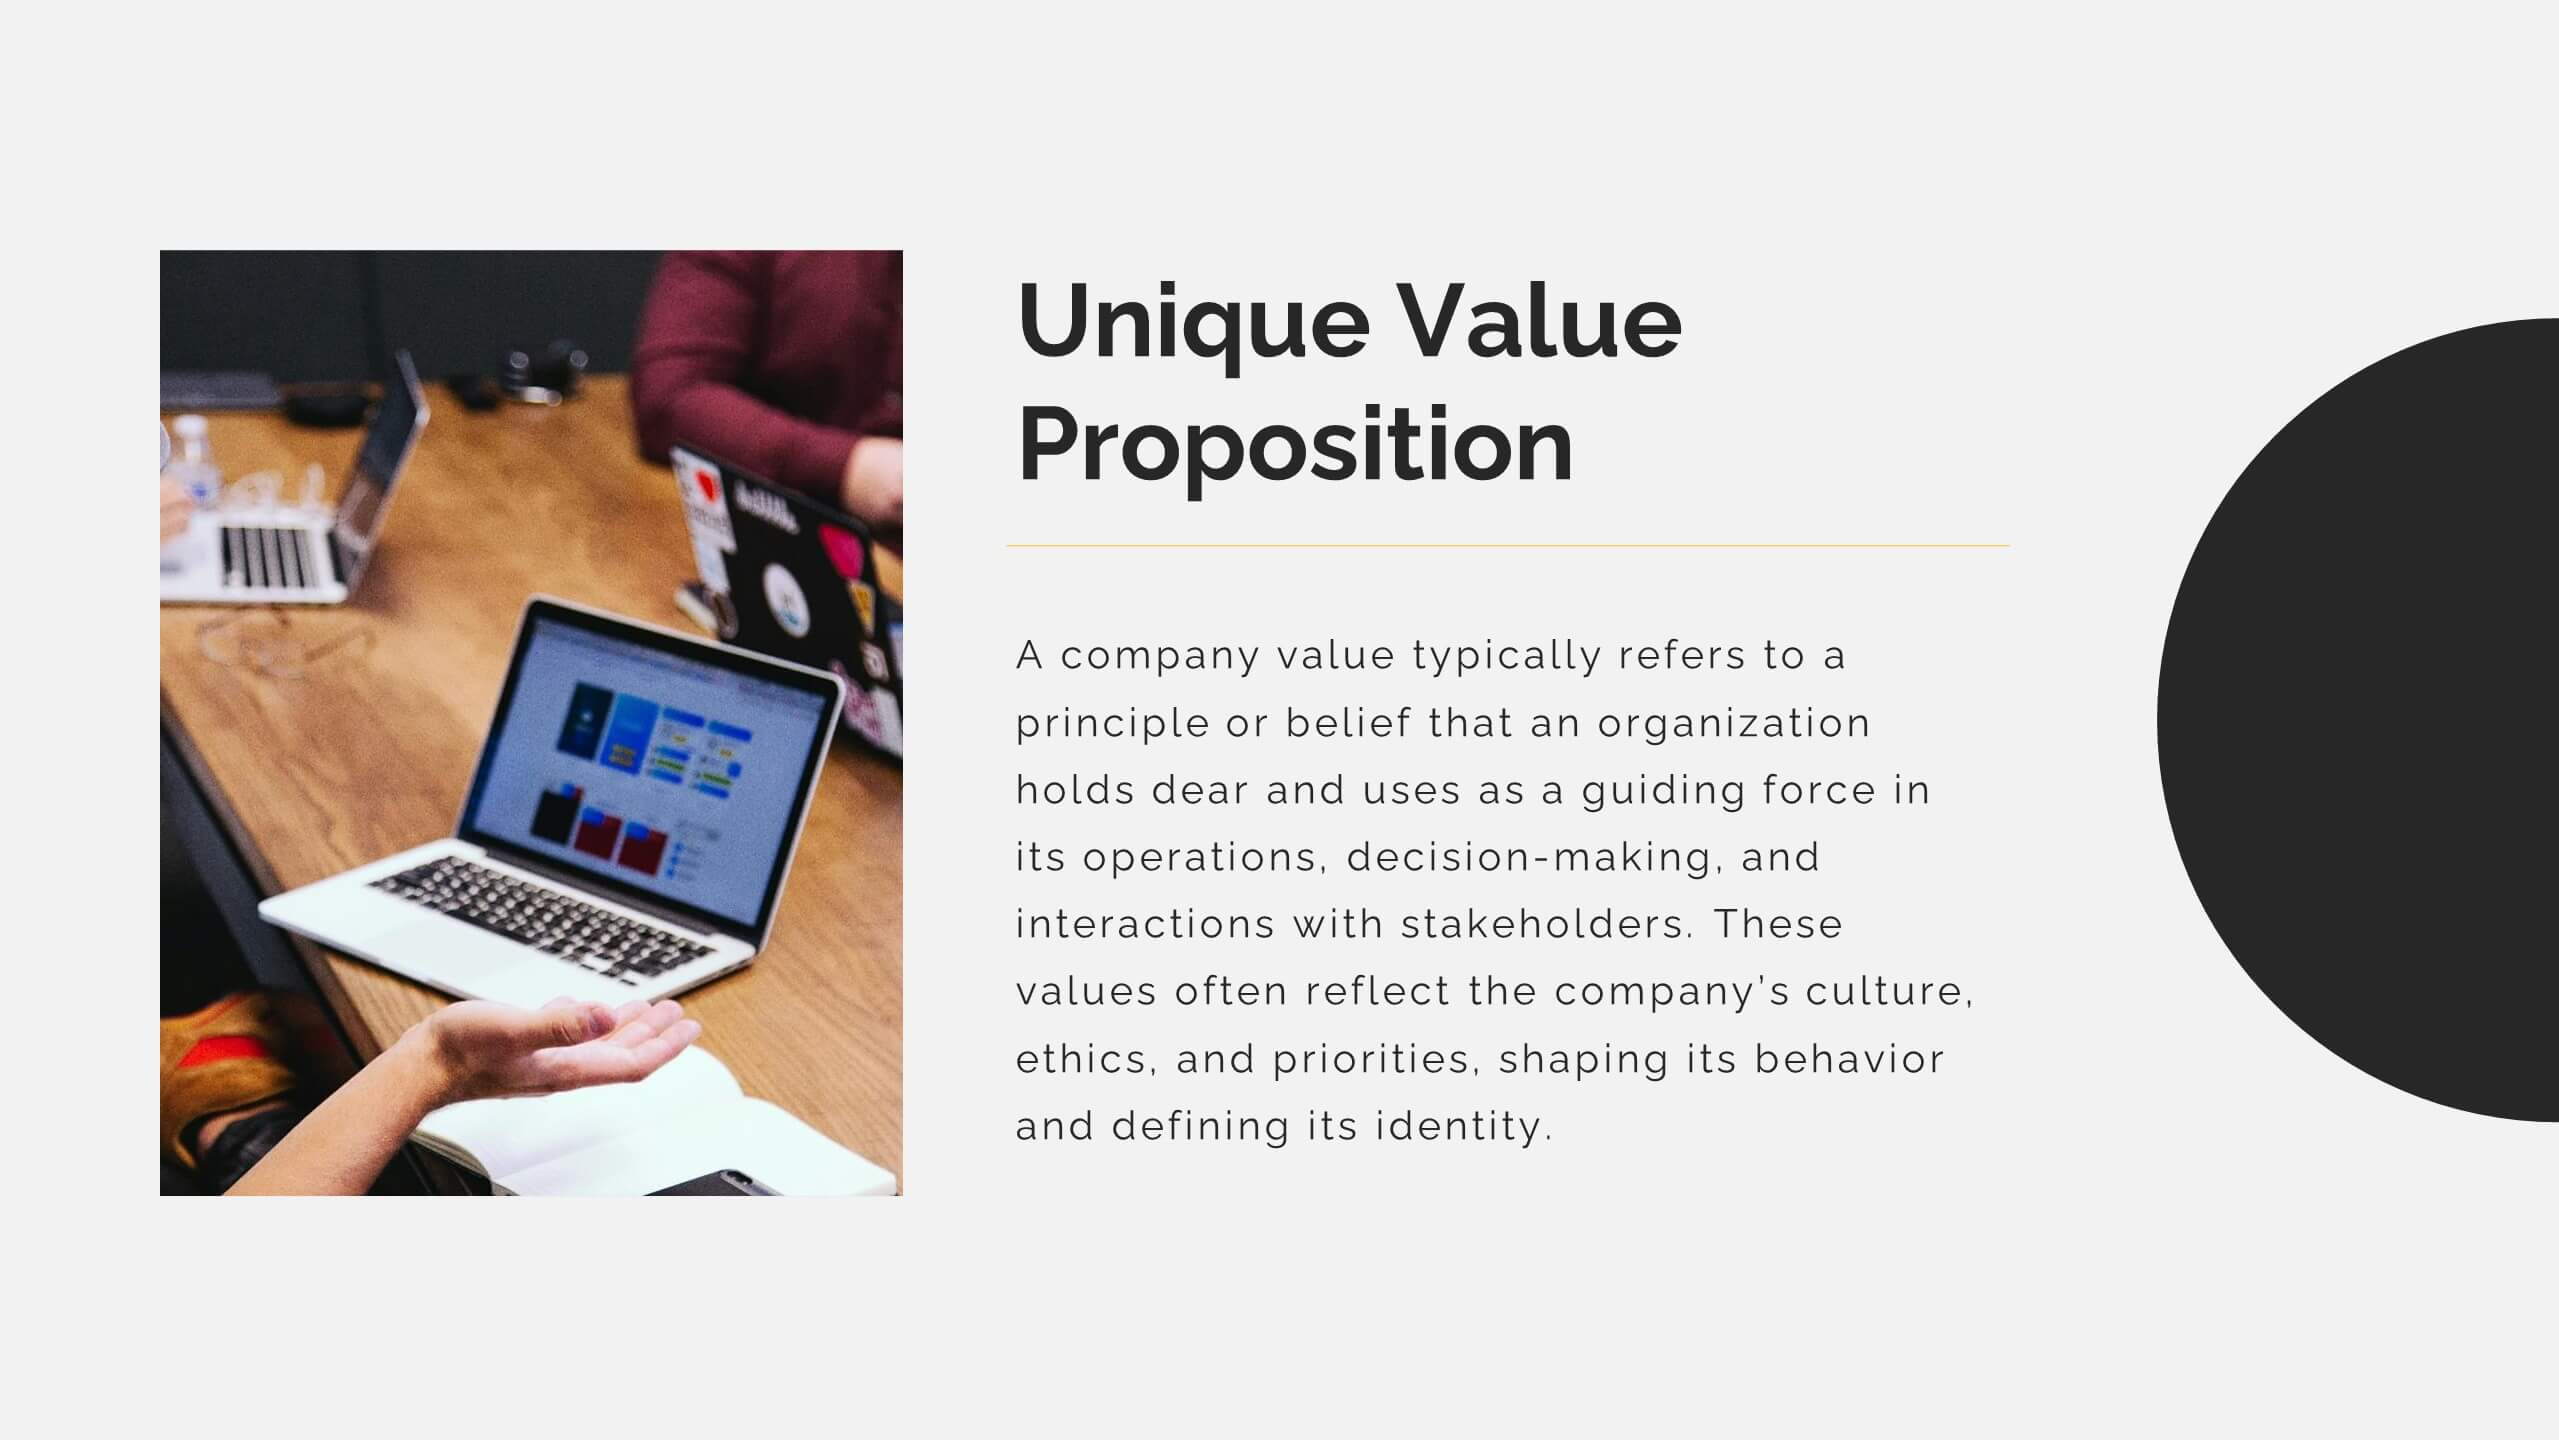
Align leadership goals and present strategic priorities with the Boardroom Strategy Meeting Overview presentation. Featuring a clean visual of executive collaboration, this template helps organize key discussion points, initiatives, and responsibilities in a structured layout. Ideal for quarterly planning, leadership updates, and strategic alignment sessions. Fully editable in PowerPoint, Keynote, and Google Slides.


5 slides
Insurance Risk Management Presentation
Make complex risk strategies easy to understand with this clean and professional presentation design. Perfect for explaining insurance coverage, threat assessment, or business protection plans, it blends clear visuals with modern design elements. Fully editable and compatible with PowerPoint, Keynote, and Google Slides for effortless customization and presentation.


22 slides
Mirage Startup Funding Proposal Presentation
Secure funding with this dynamic startup proposal template! Perfect for presenting your mission, vision, business model, and market analysis. Ideal for entrepreneurs aiming to impress investors and stakeholders. Compatible with PowerPoint, Keynote, and Google Slides, this template ensures your proposal is clear, professional, and compelling. Achieve your startup goals today!


23 slides
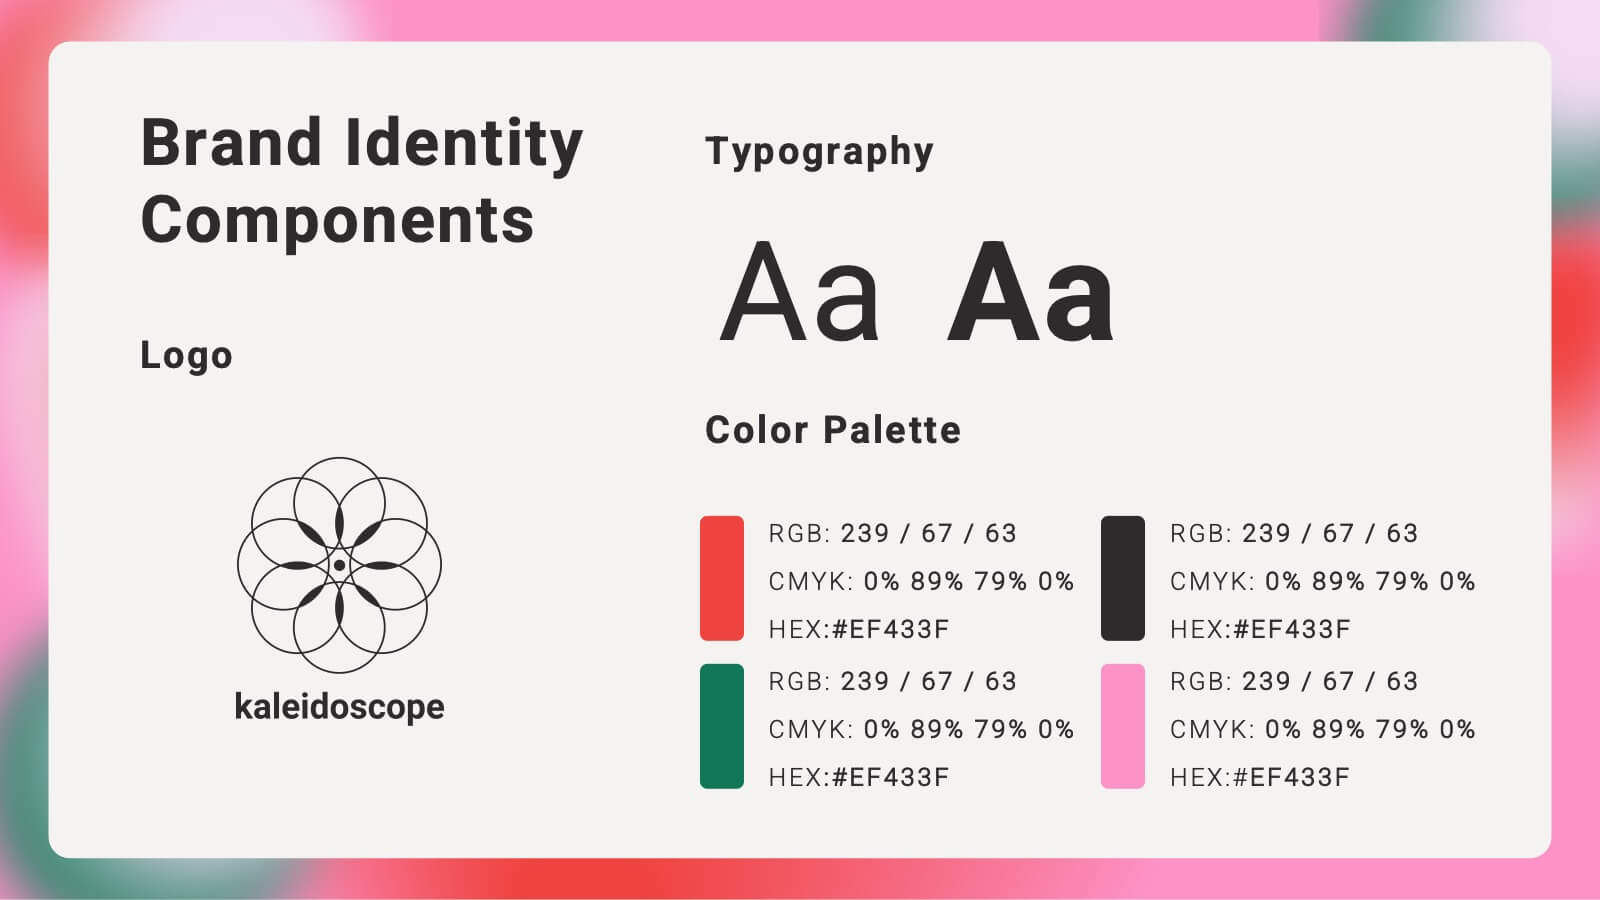
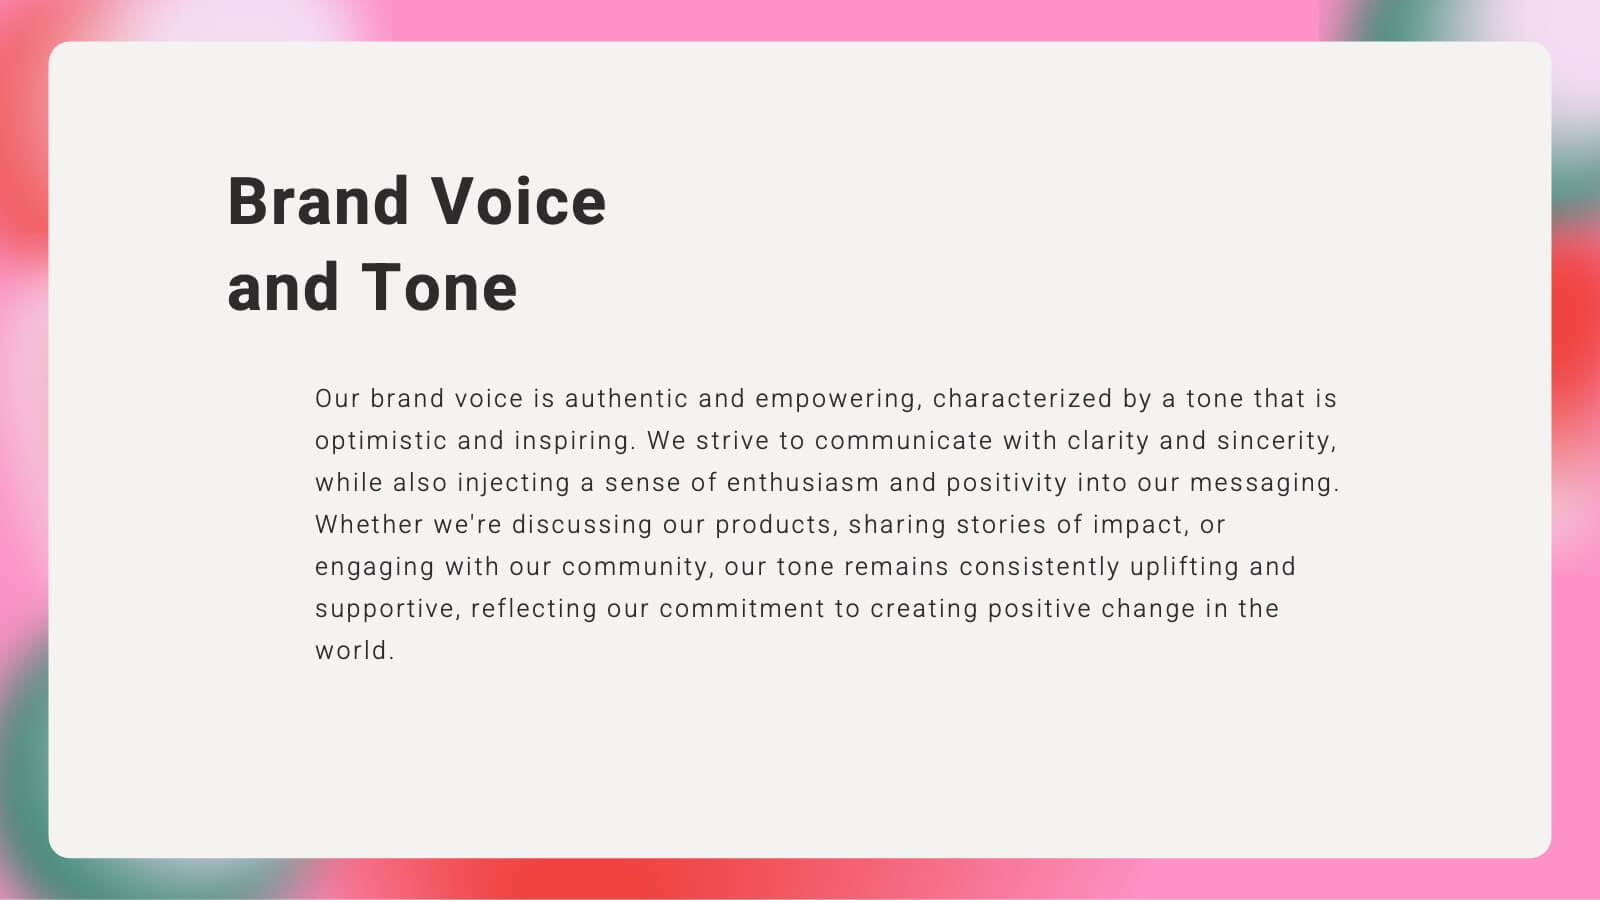
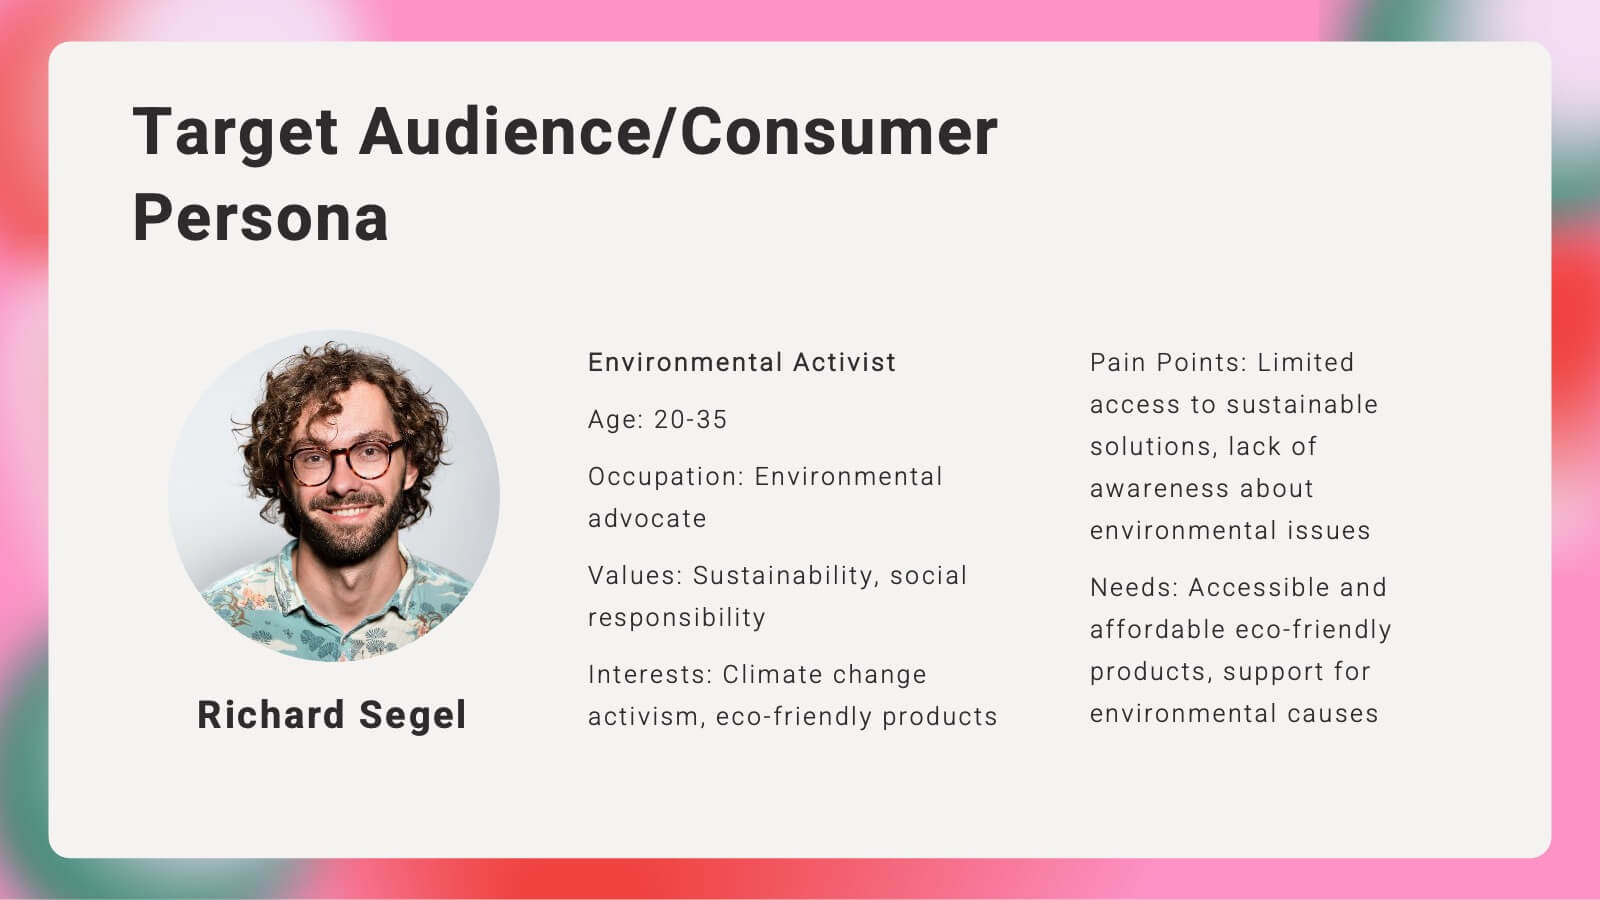
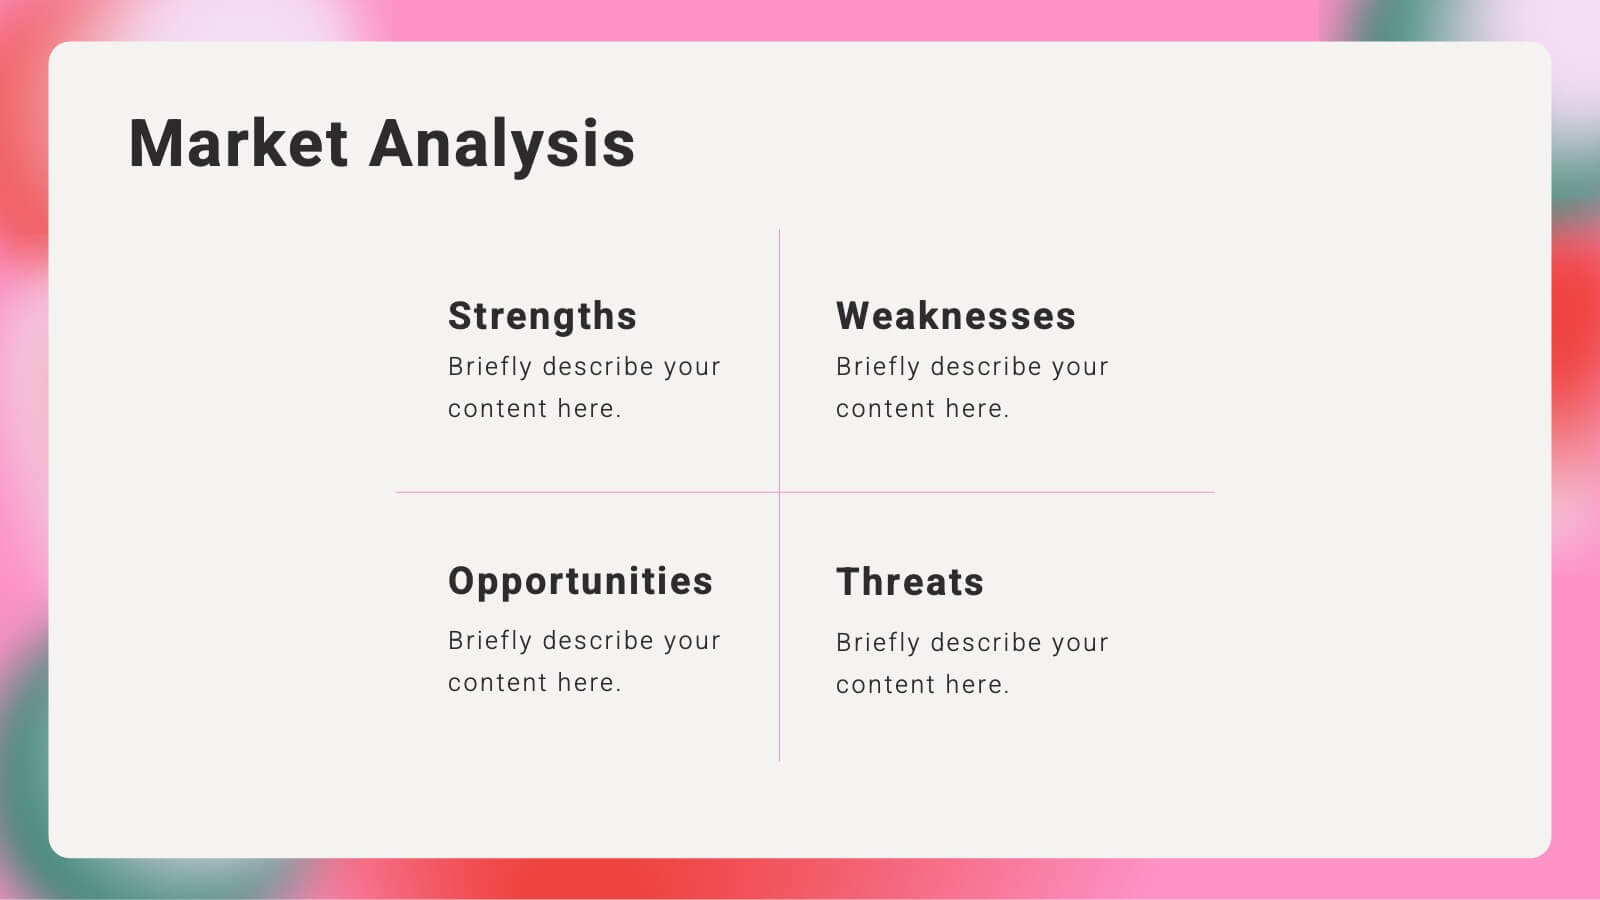
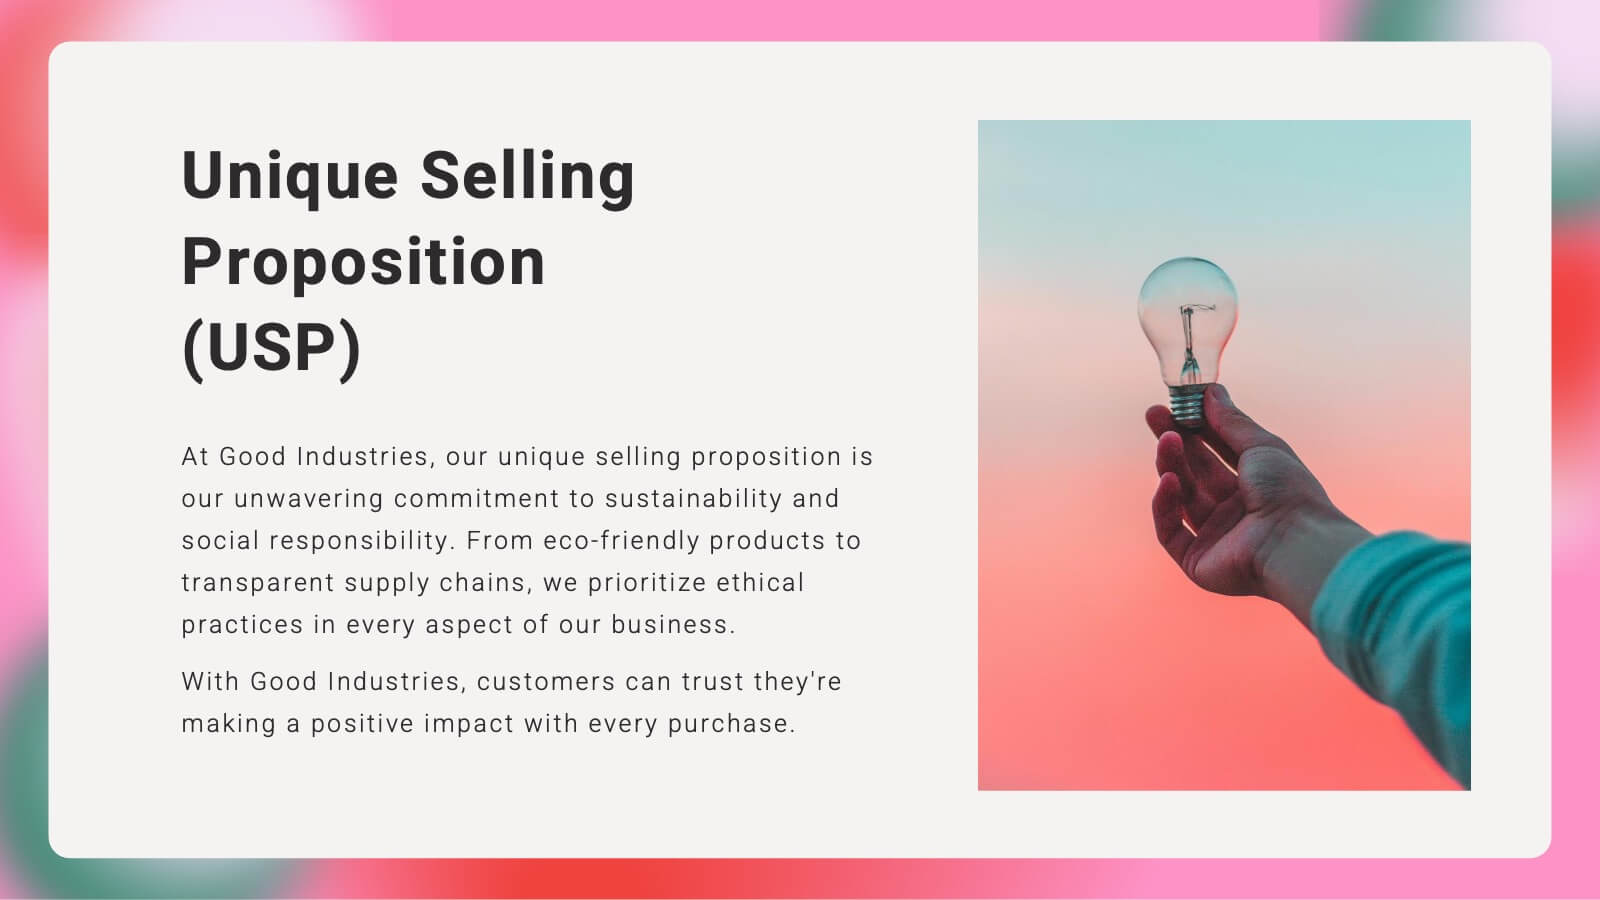
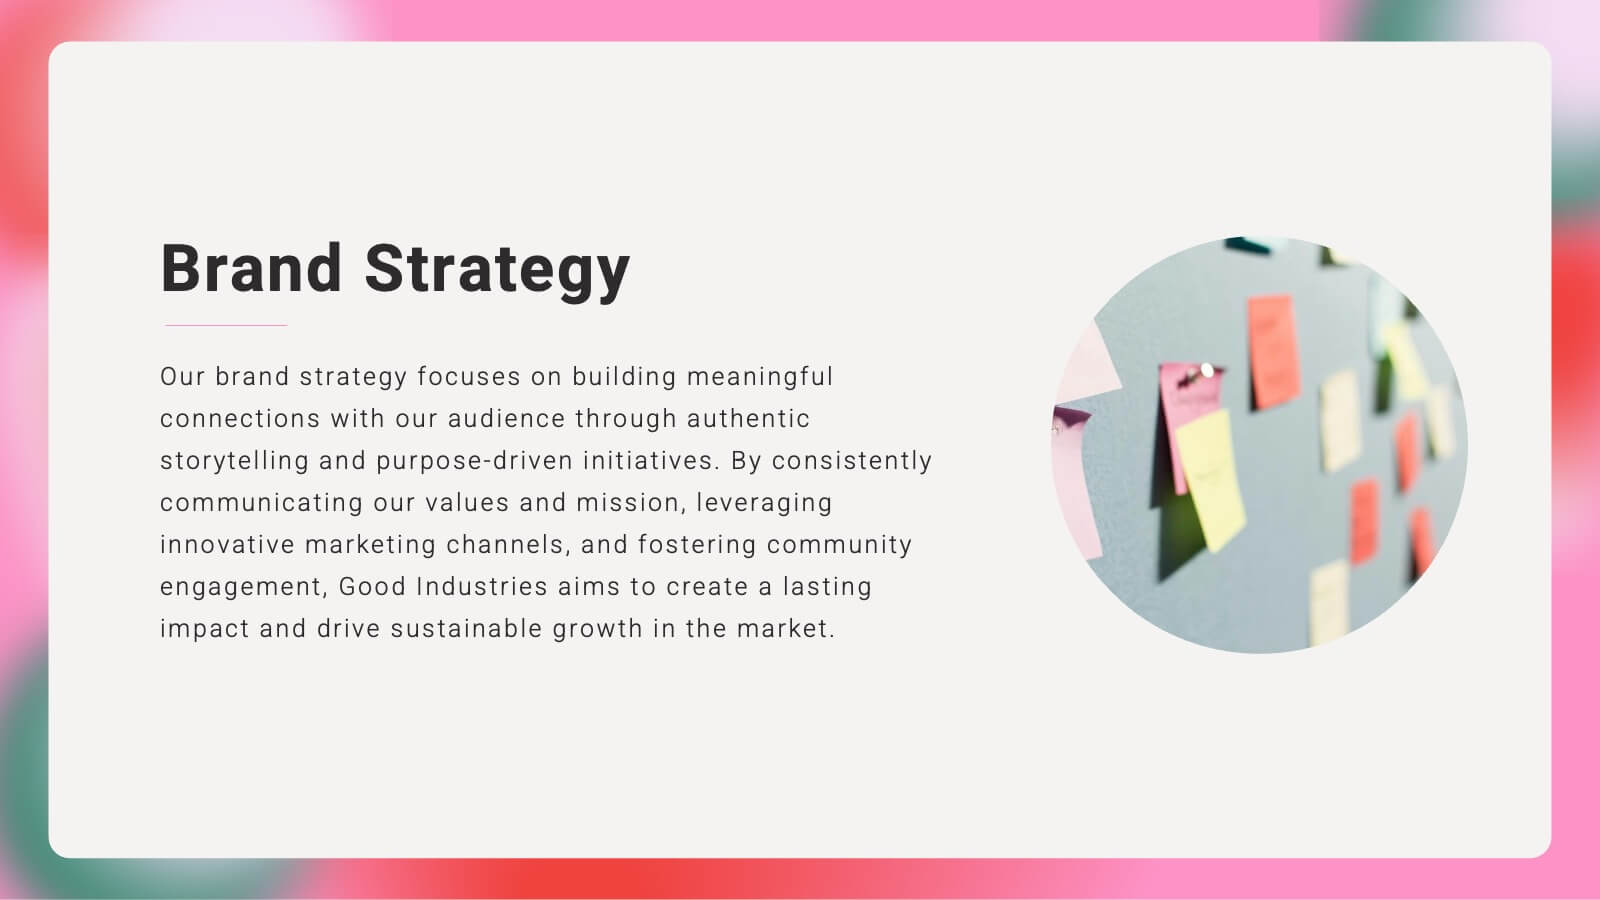
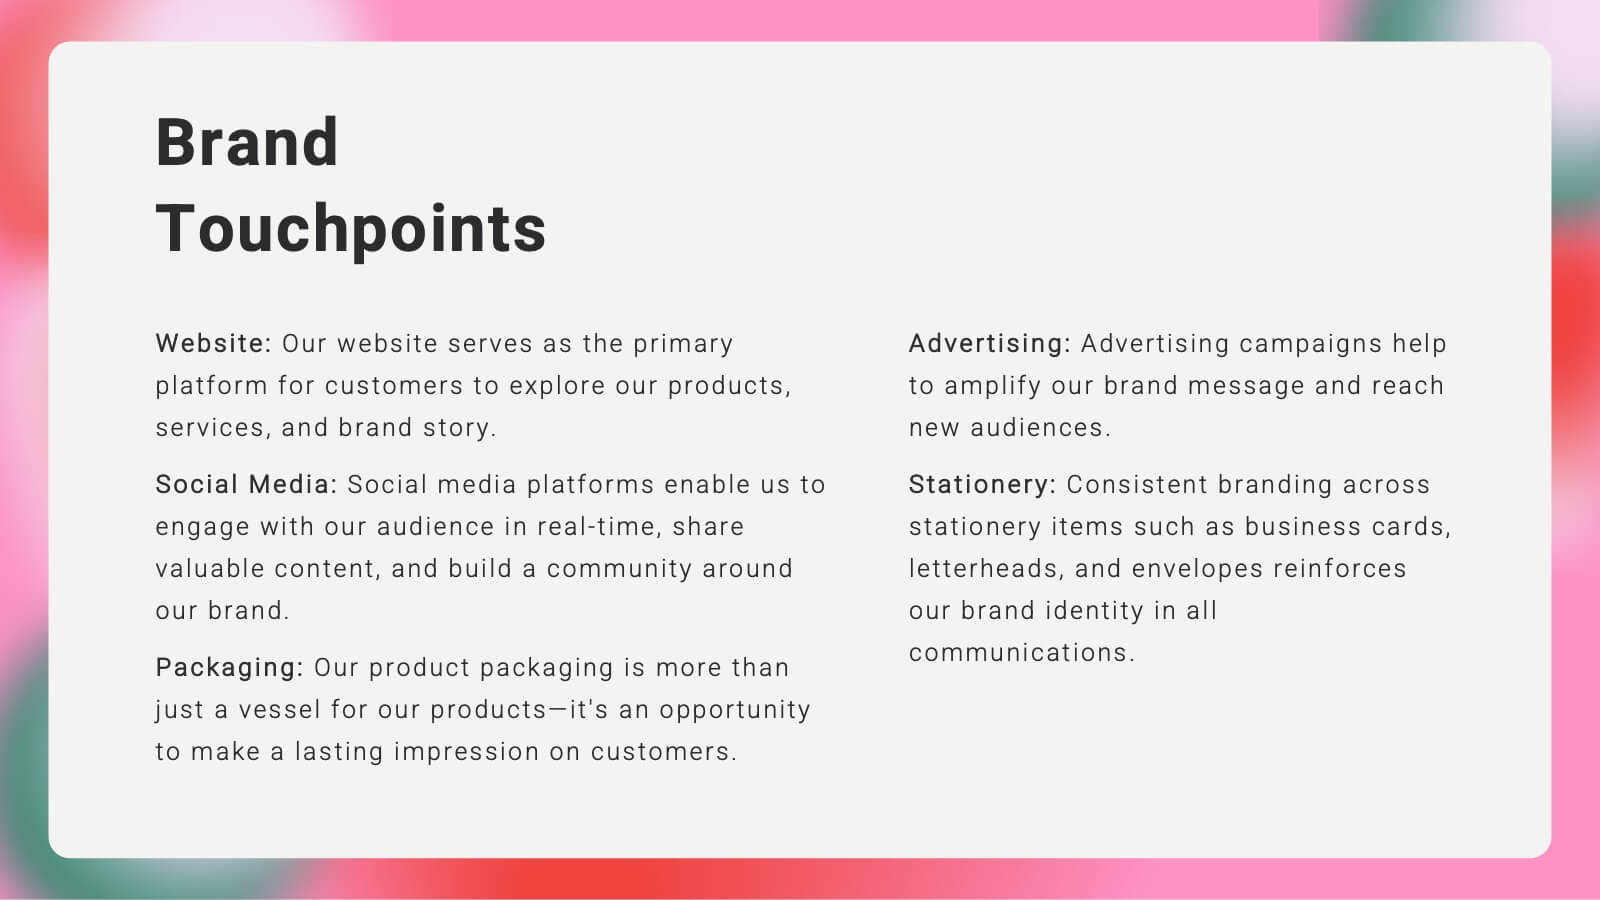
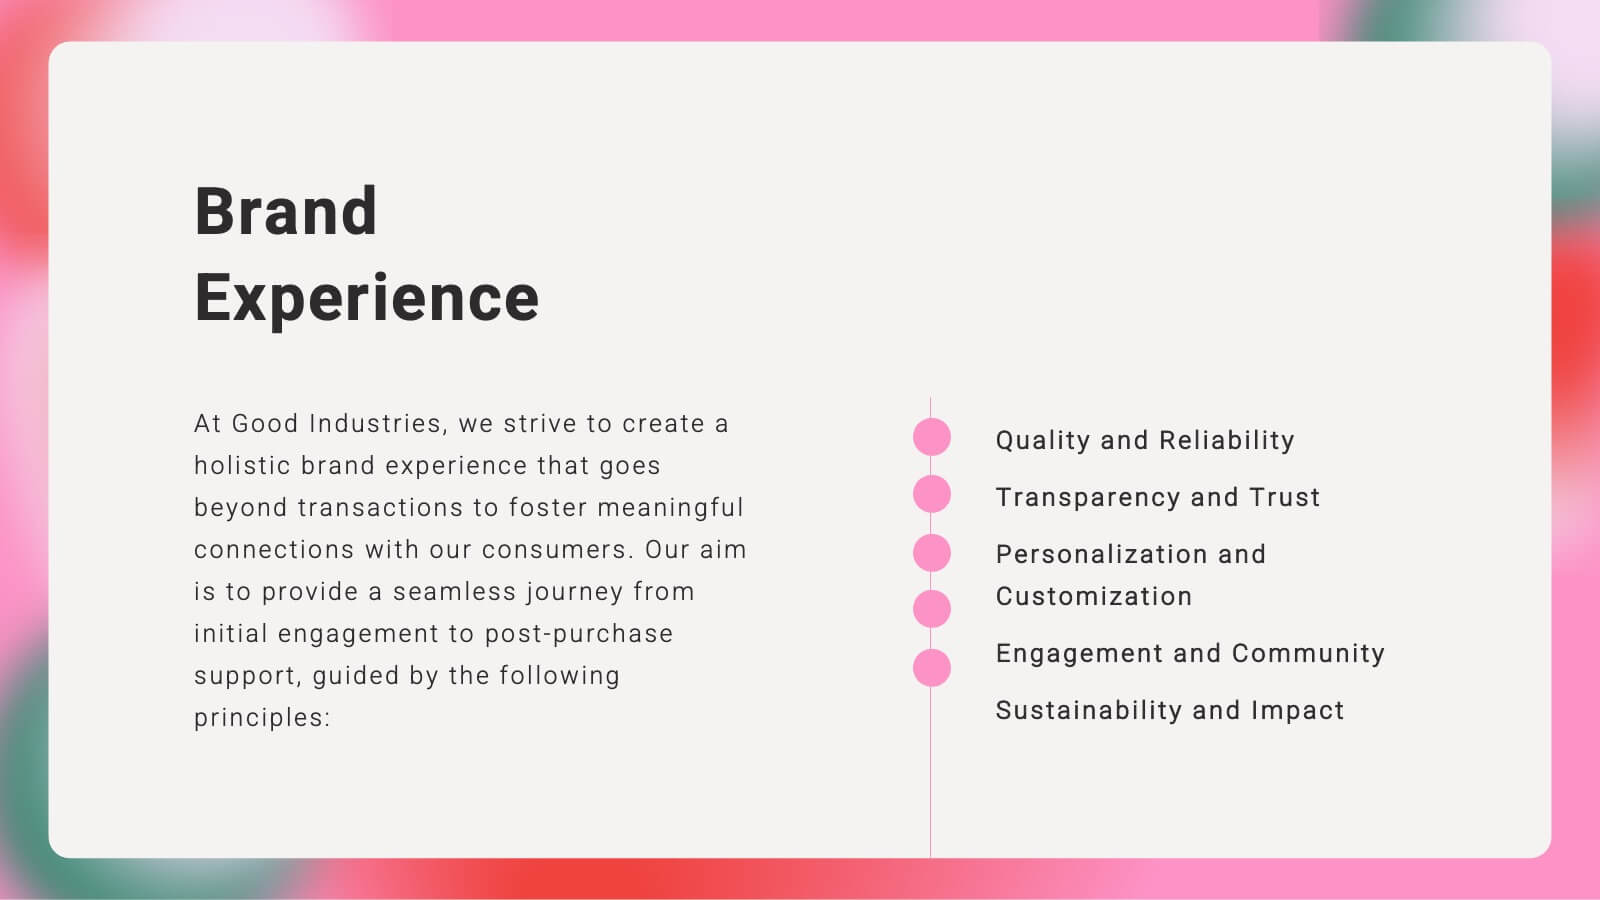
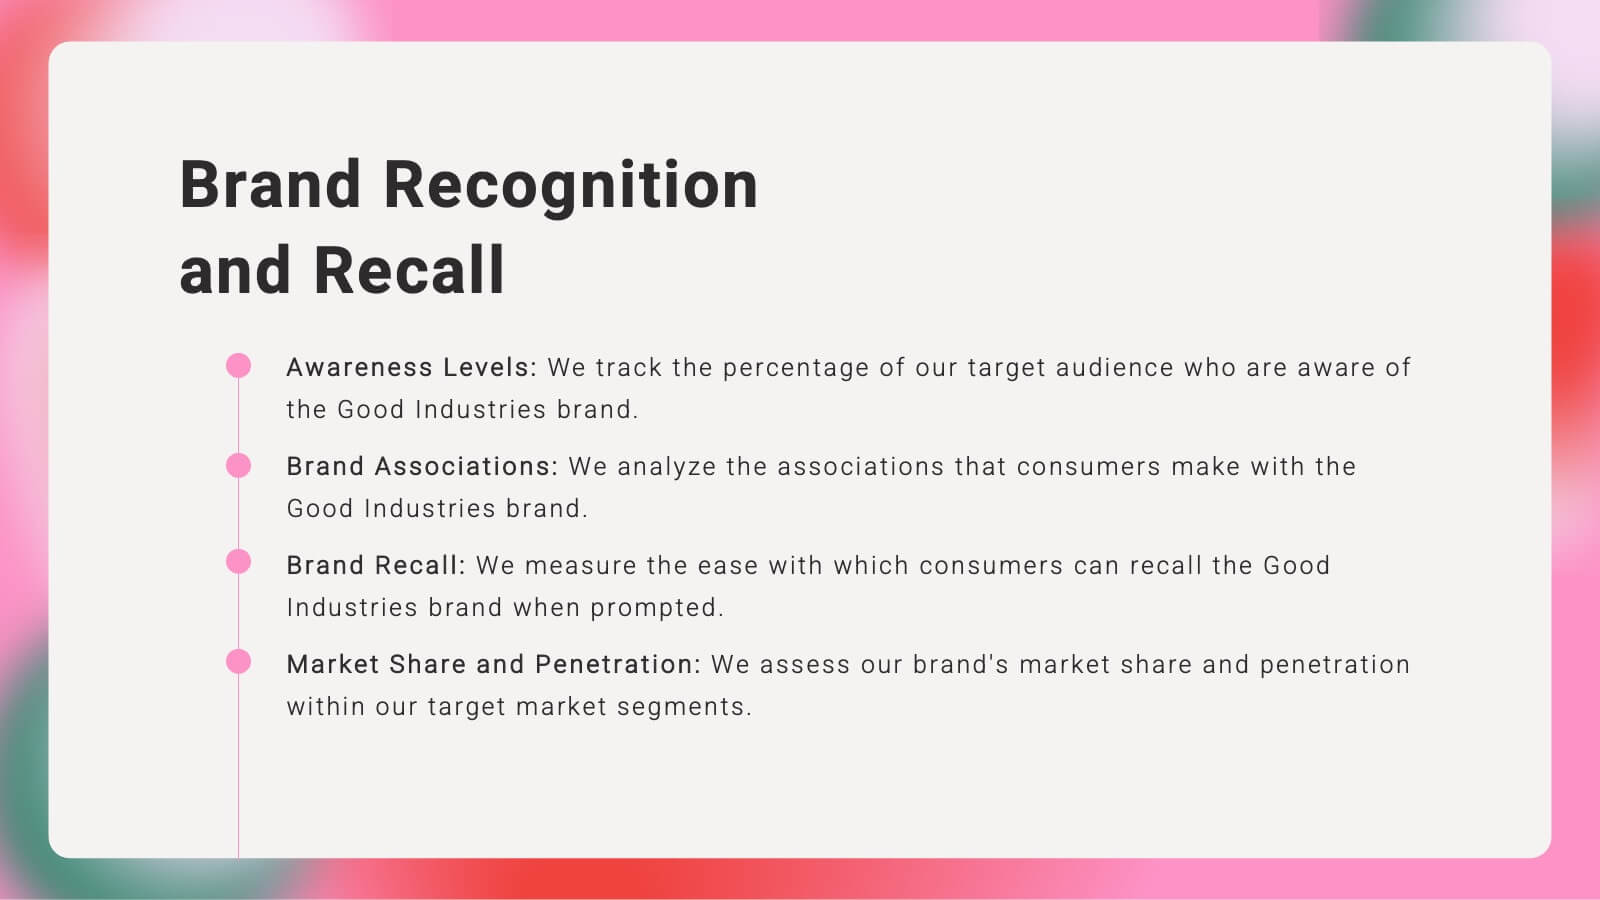
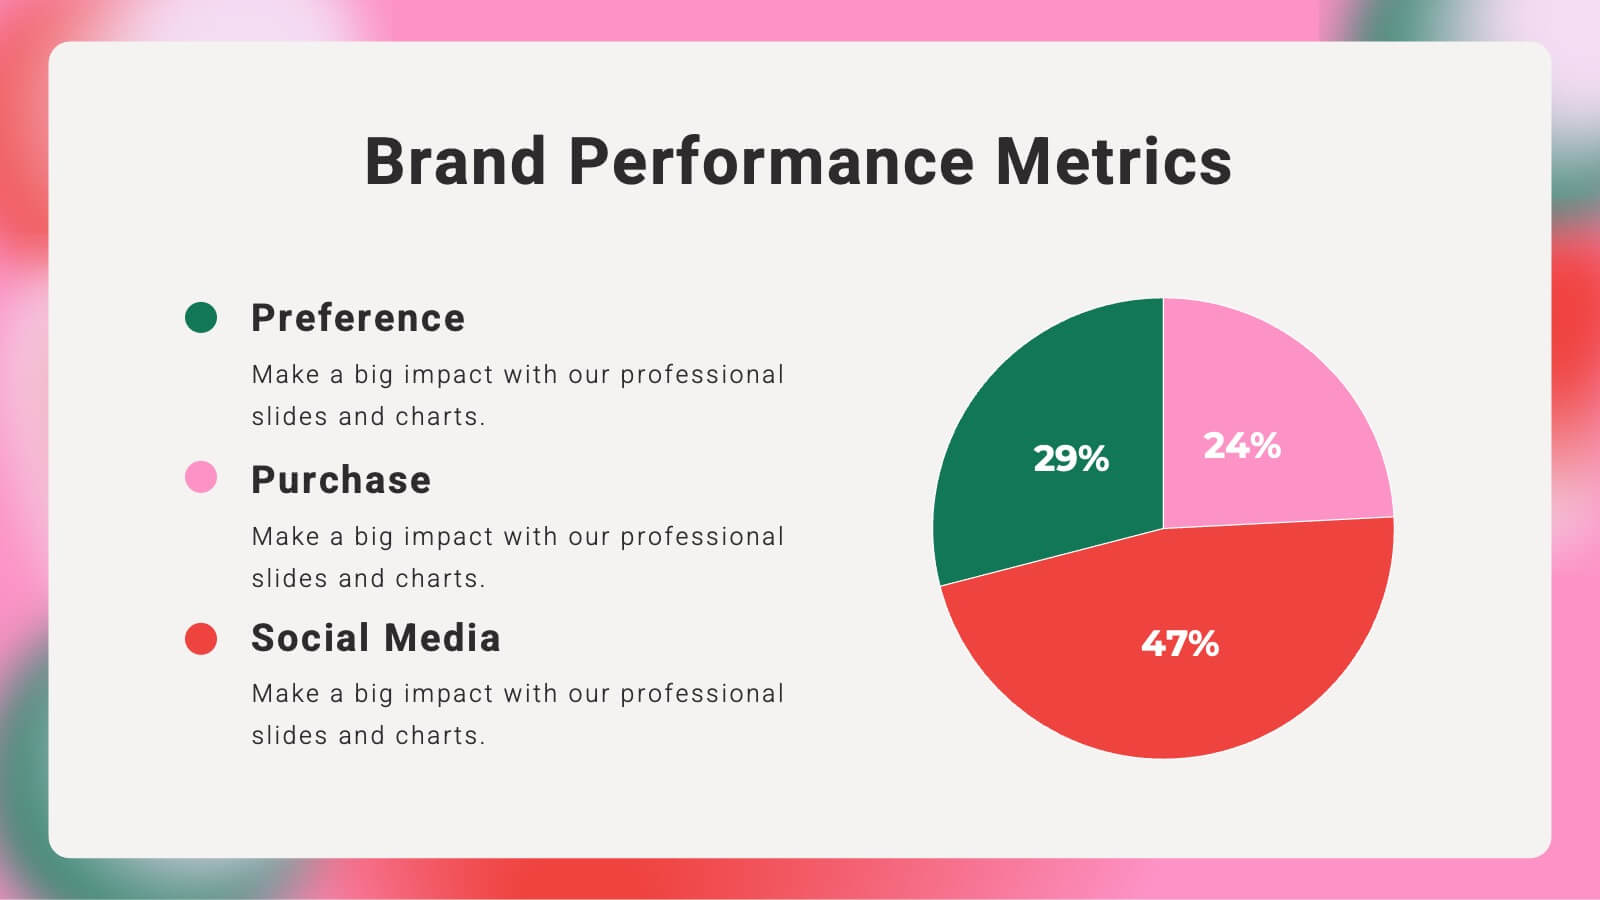
Kaleidoscope Brand Strategy Report Presentation
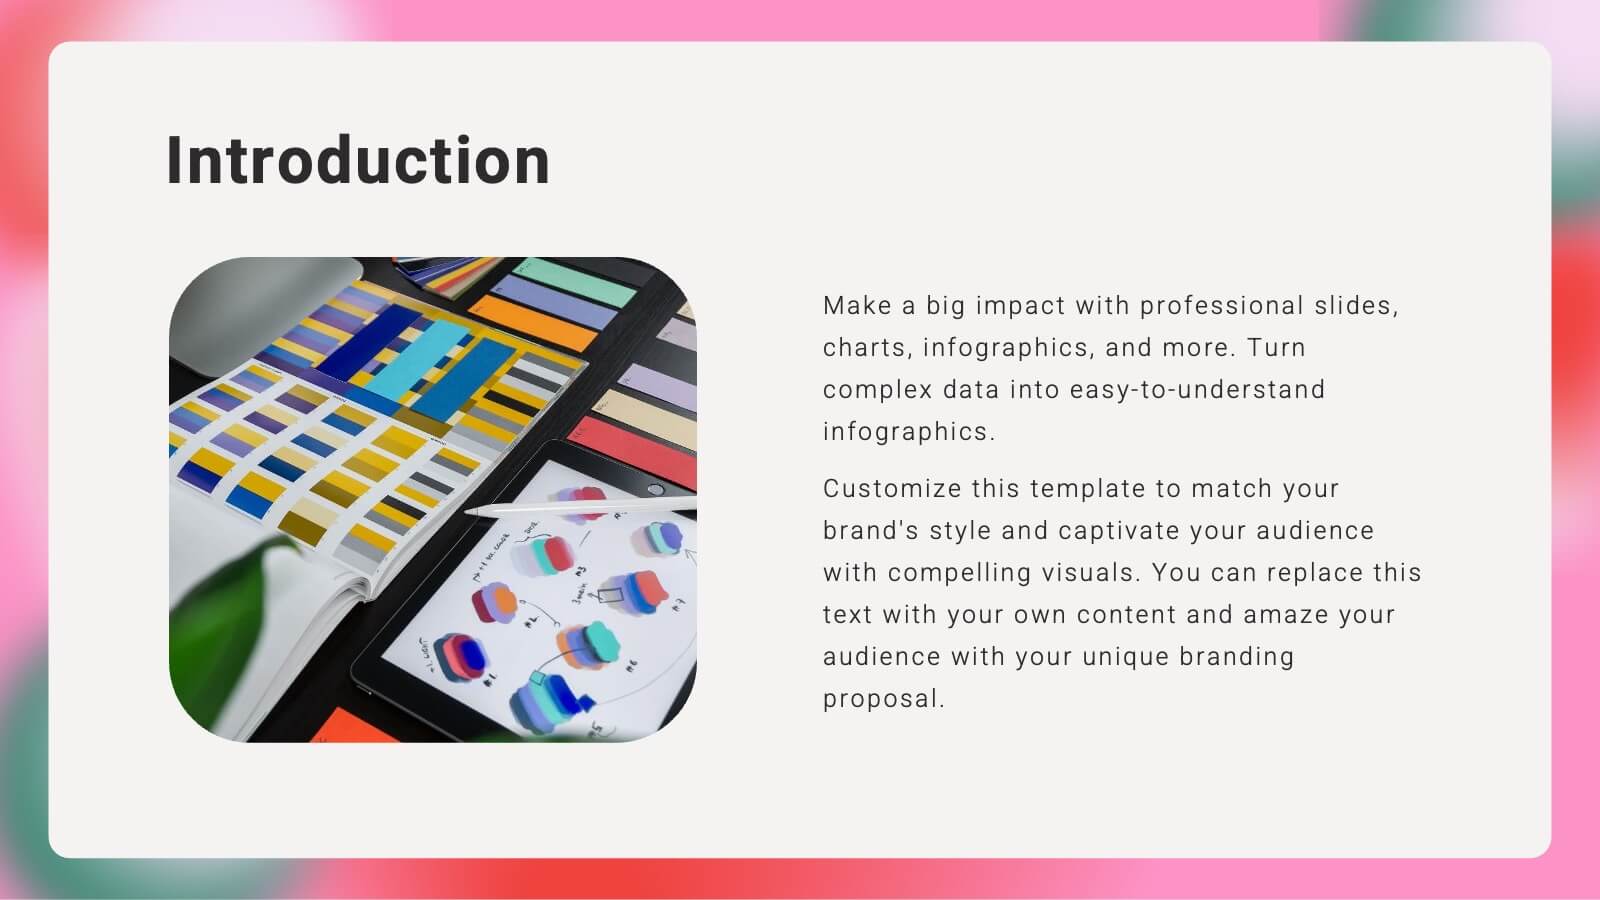
Craft a compelling narrative for your brand with this vibrant brand strategy presentation template. Designed to cover every facet of brand development, from vision and mission to market analysis and consumer personas, this template is an essential tool for businesses looking to establish a strong brand identity. It incorporates visually engaging slides that outline brand voice, values, and touchpoints, facilitating a thorough understanding of strategic branding. Compatible with platforms like PowerPoint, Google Slides, and Keynote, it is accessible across various devices, making it perfect for collaborative planning and presentations.


8 slides
Building Planning and Architecture Strategy Presentation
Bring structure and vision to your development plans with the Building Planning and Architecture Strategy Presentation. This visual template showcases an illustrated construction scene paired with four key planning pillars—ideal for presenting design phases, zoning steps, or project milestones. Fully customizable in PowerPoint, Keynote, and Google Slides.


21 slides
Nimbus Startup Growth Plan Presentation
Supercharge your startup's growth with this vibrant presentation template! Ideal for outlining your business plan, it includes slides for mission, market analysis, and financial overview. Capture investor attention with clear visuals and compelling content. Compatible with PowerPoint, Keynote, and Google Slides for a seamless presentation experience on any platform.
5 slides
PM Milestone Planning and Tracking Layout Presentation
Track your project progress with clarity using the PM Milestone Planning and Tracking Layout Presentation. This curved arrow timeline visually guides stakeholders through five key stages of your project plan, highlighting each milestone with clear labels. Fully editable in Canva, PowerPoint, Keynote, and Google Slides for flexible use.


22 slides
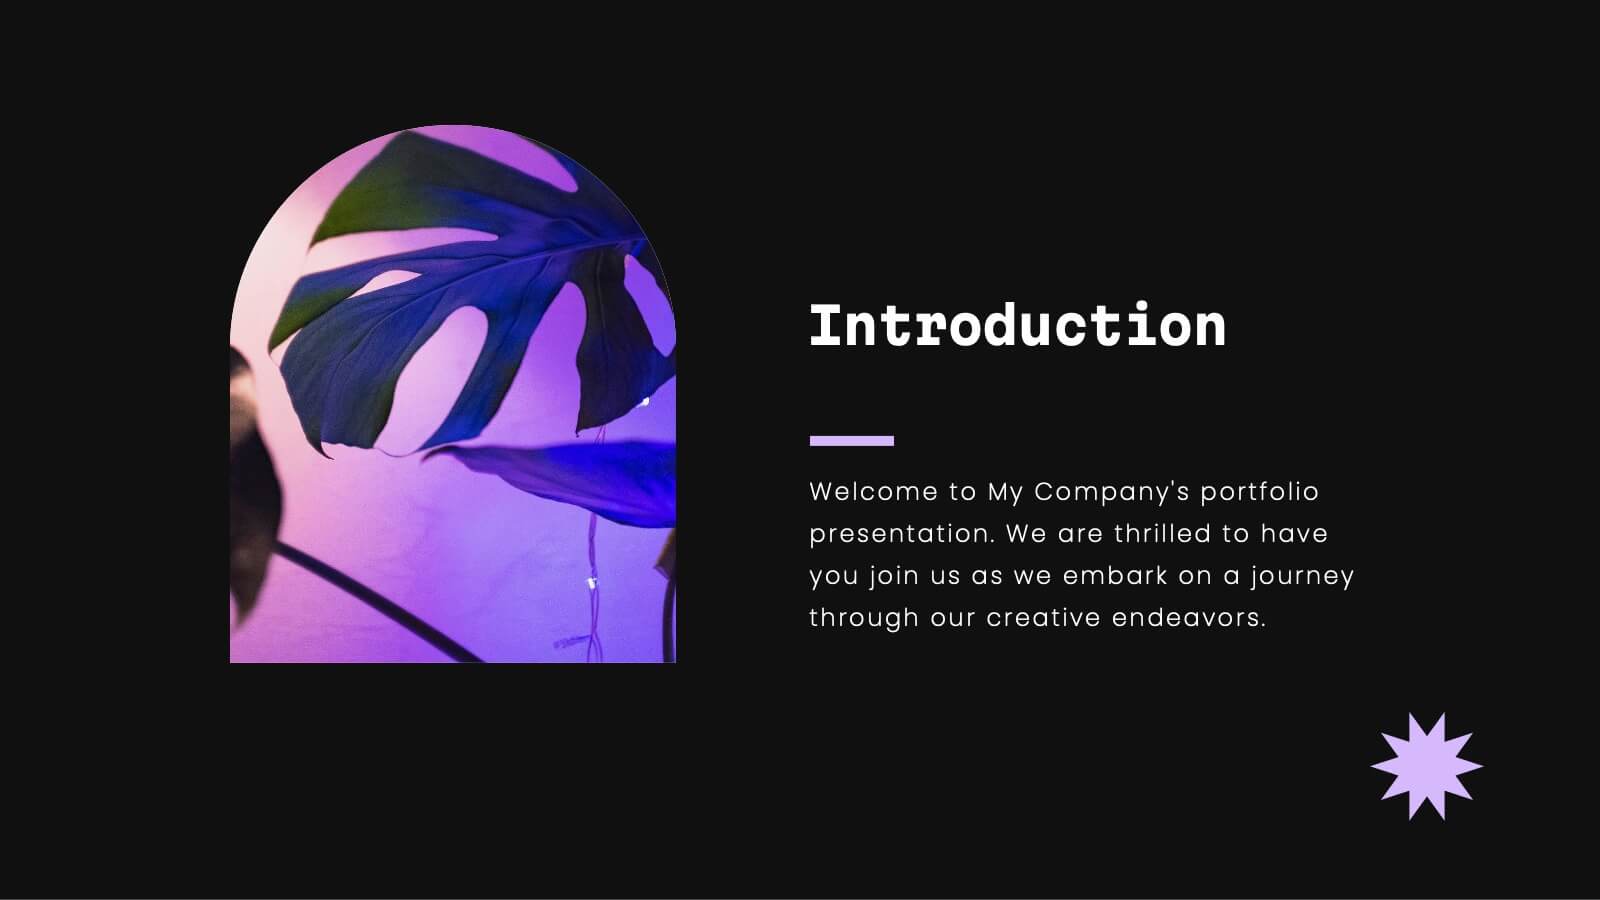
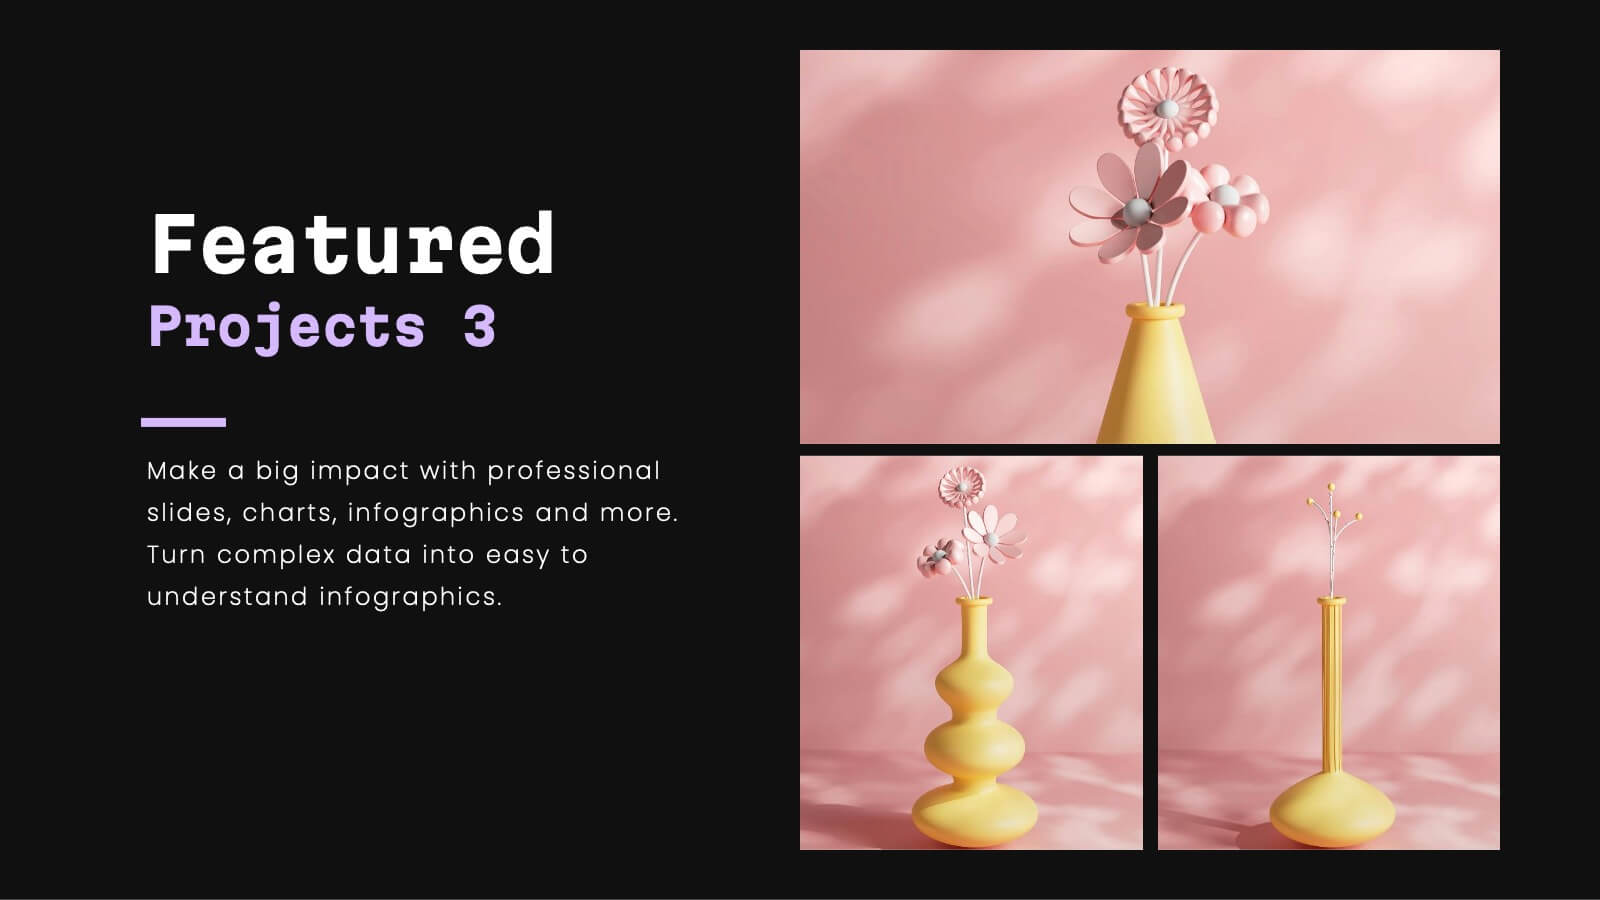
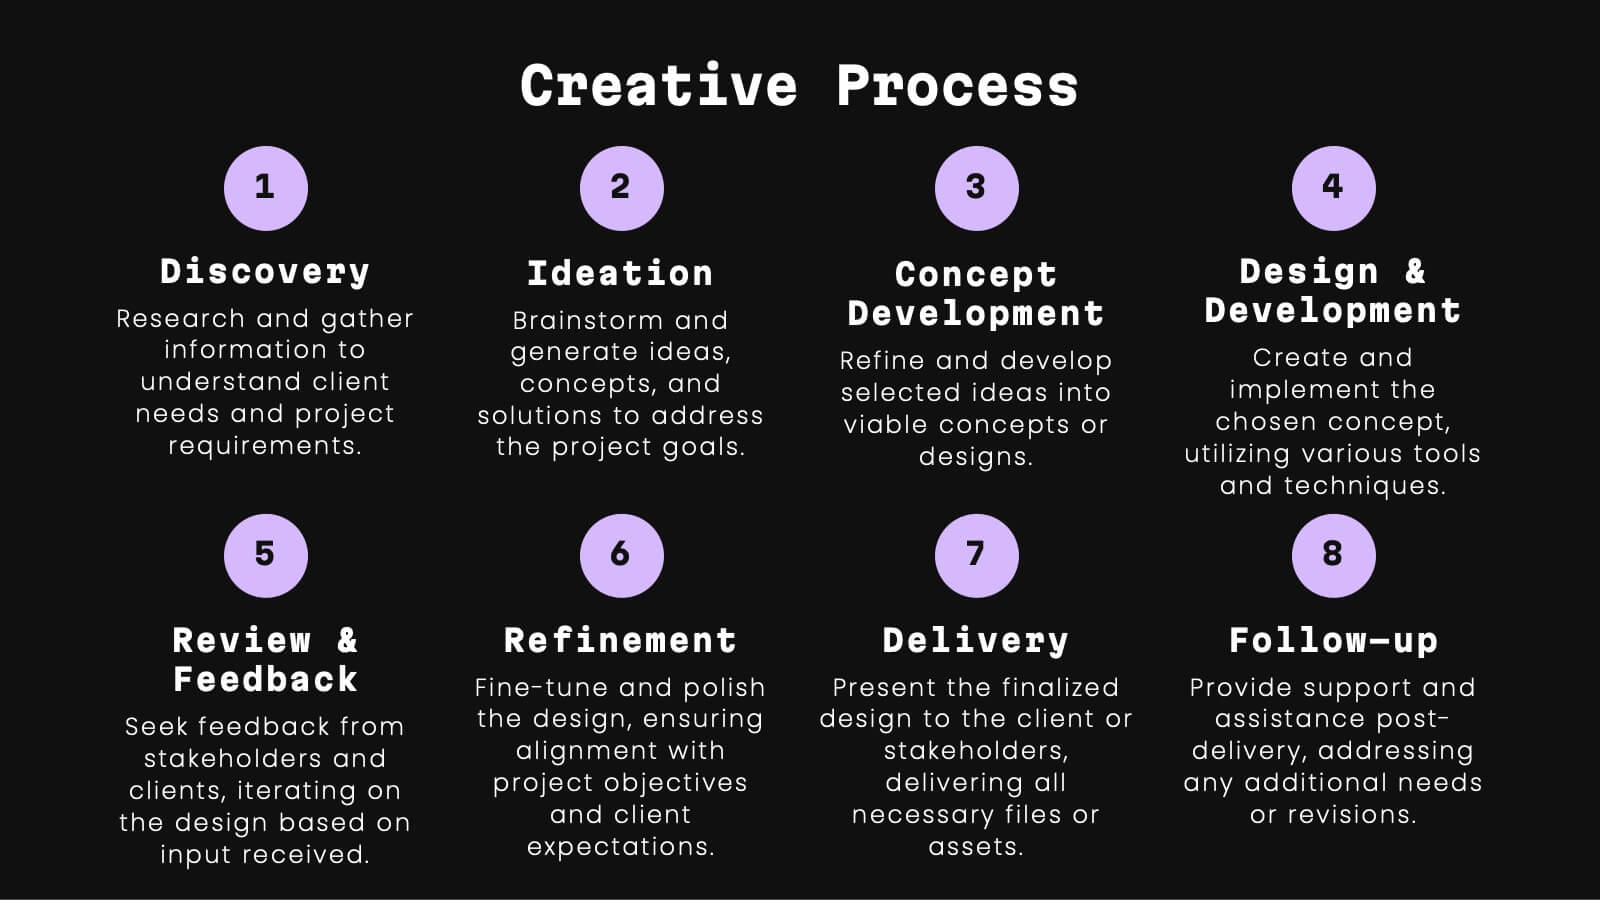
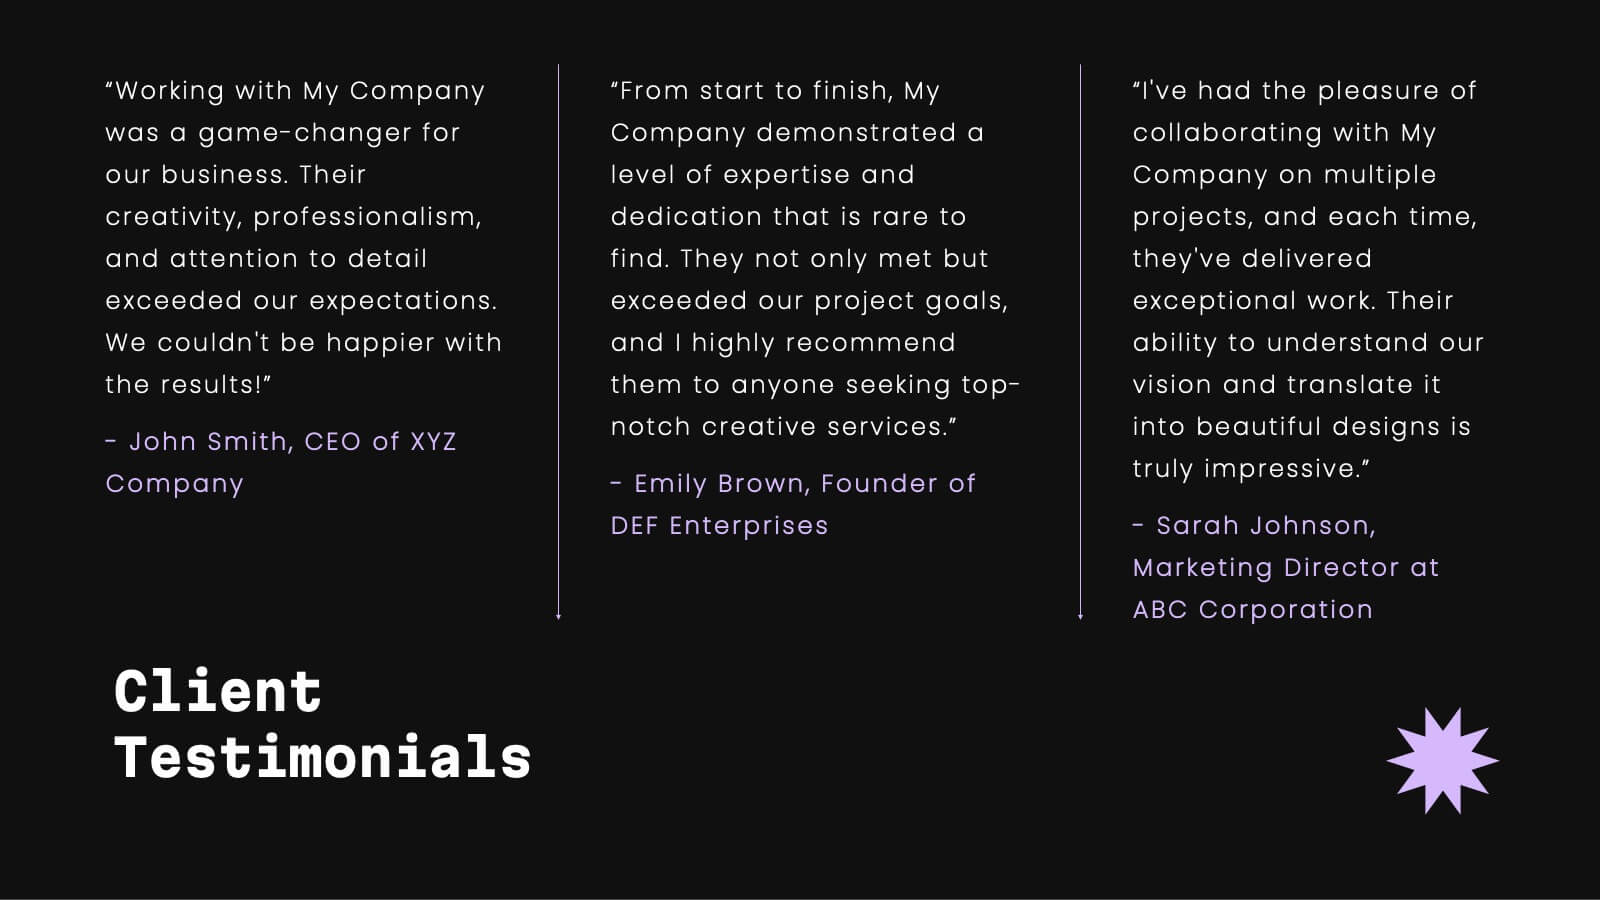
Celeste Professional Portfolio Showcase Presentation
Impress with style using this sophisticated portfolio presentation template. Perfect for showcasing featured projects, creative processes, and client testimonials, this template enhances the visual appeal of your work. Its modern, dark-themed design ensures your content stands out, making a lasting impression. Compatible with PowerPoint, Keynote, and Google Slides, it's versatile for any platform.


3 slides
Corporate Sustainabilitiy Management Strategy Presentation
Drive your company’s future with a presentation that blends strategy, innovation, and sustainability. Designed to communicate eco-friendly initiatives and long-term business goals, it helps visualize performance, impact, and growth clearly. Fully customizable and compatible with PowerPoint, Keynote, and Google Slides for seamless, professional, and engaging sustainability presentations.


4 slides
Risk and Reality Iceberg Diagram Presentation
Reveal underlying threats with this Risk and Reality Iceberg Diagram presentation. Ideal for risk analysis, strategic planning, or operations mapping, this slide visualizes visible vs. hidden challenges in a business or project. Fully editable in Canva, PowerPoint, and Google Slides—perfect for impactful and professional presentations.


3 slides
Automation and AI Strategy Framework Presentation
Take your ideas for a high-tech spin with this bold and modern layout! This template visually breaks down strategic frameworks for automation and AI by using a clean, segmented circular flow. Ideal for showcasing processes, data integration, or tech-driven initiatives. Fully compatible with PowerPoint, Keynote, and Google Slides for seamless editing.


5 slides
Company Vision and Operations Overview Presentation
Present your company’s mission and structure with this Company Vision and Operations Overview Presentation. Designed around a central eye graphic, it highlights four strategic pillars or core values. Ideal for executive summaries, leadership decks, or internal briefings. Fully editable in Canva, PowerPoint, or Google Slides.


23 slides
Cycladic UX Design Presentation
The Cycladic UX Design Presentation Template is a bold and vibrant choice for showcasing your UX/UI design projects. With its striking pink and black color scheme, this template is designed to grab attention and keep your audience engaged. It covers all essential aspects of UX design, from project overviews and user research to wireframes, prototyping, and UI design principles. Each slide is thoughtfully designed to present your content clearly and effectively, making it ideal for designers who want to highlight their process, showcase their work, and communicate their design thinking.


21 slides
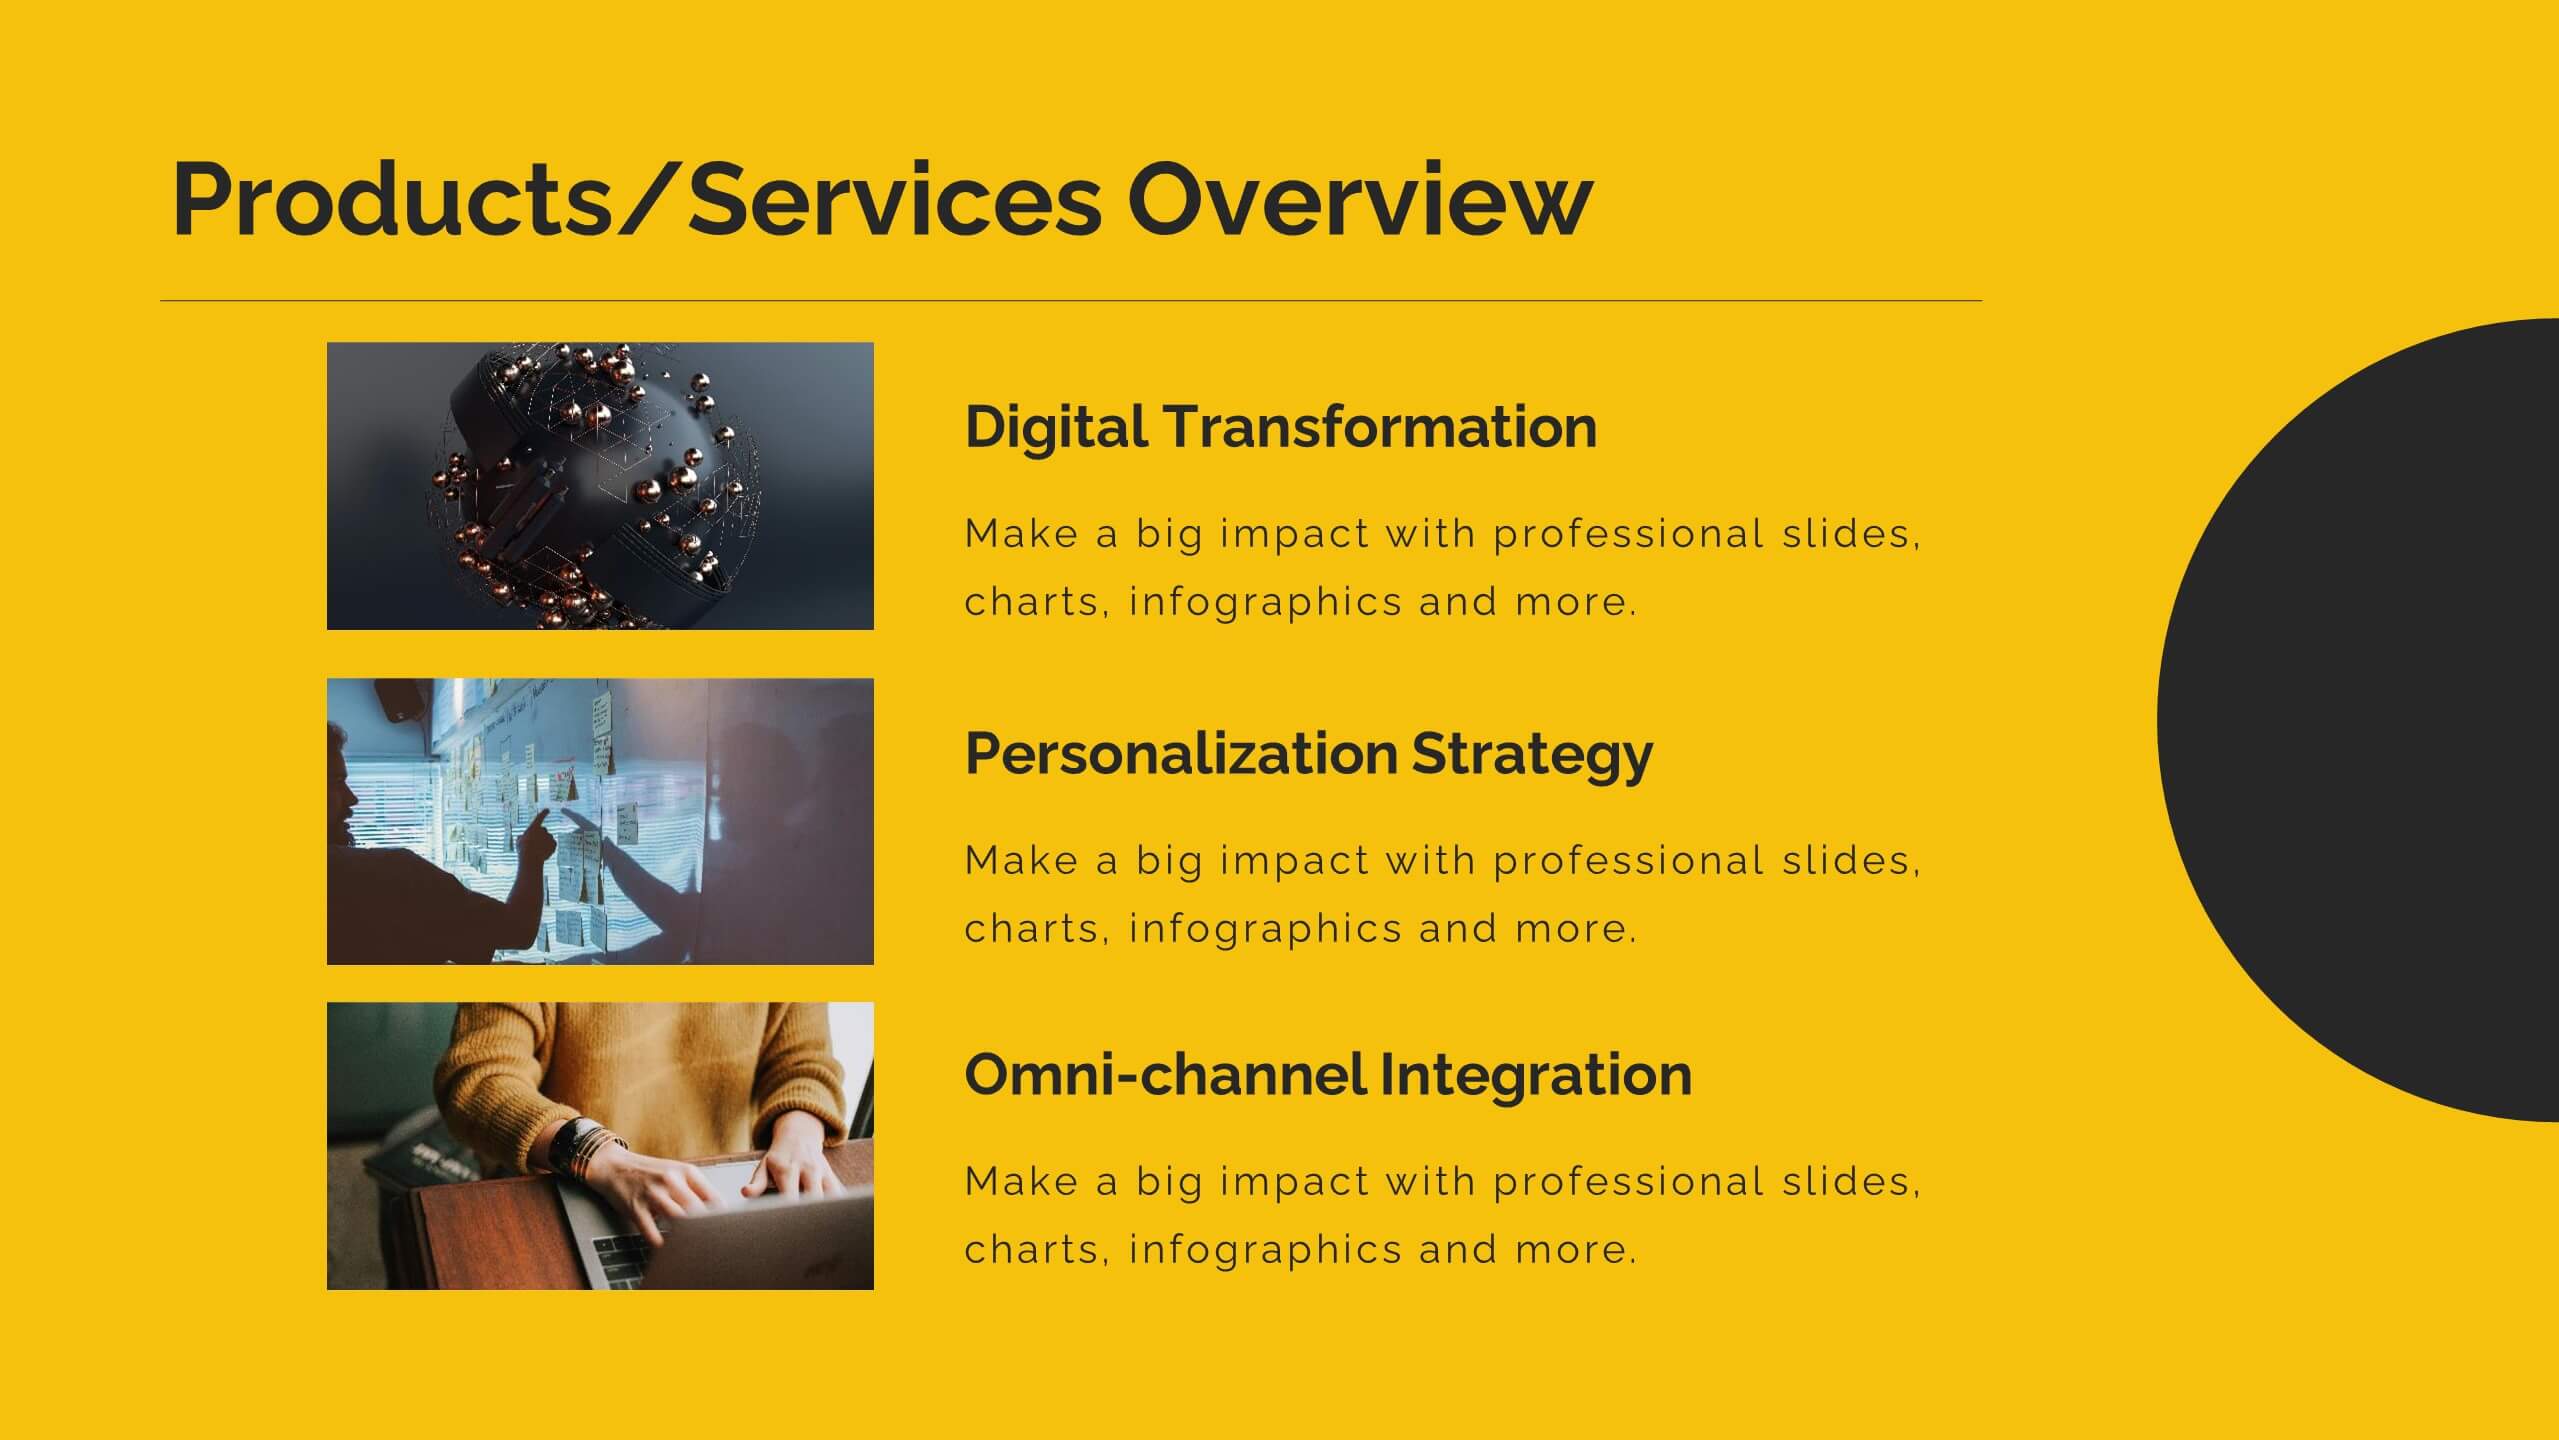
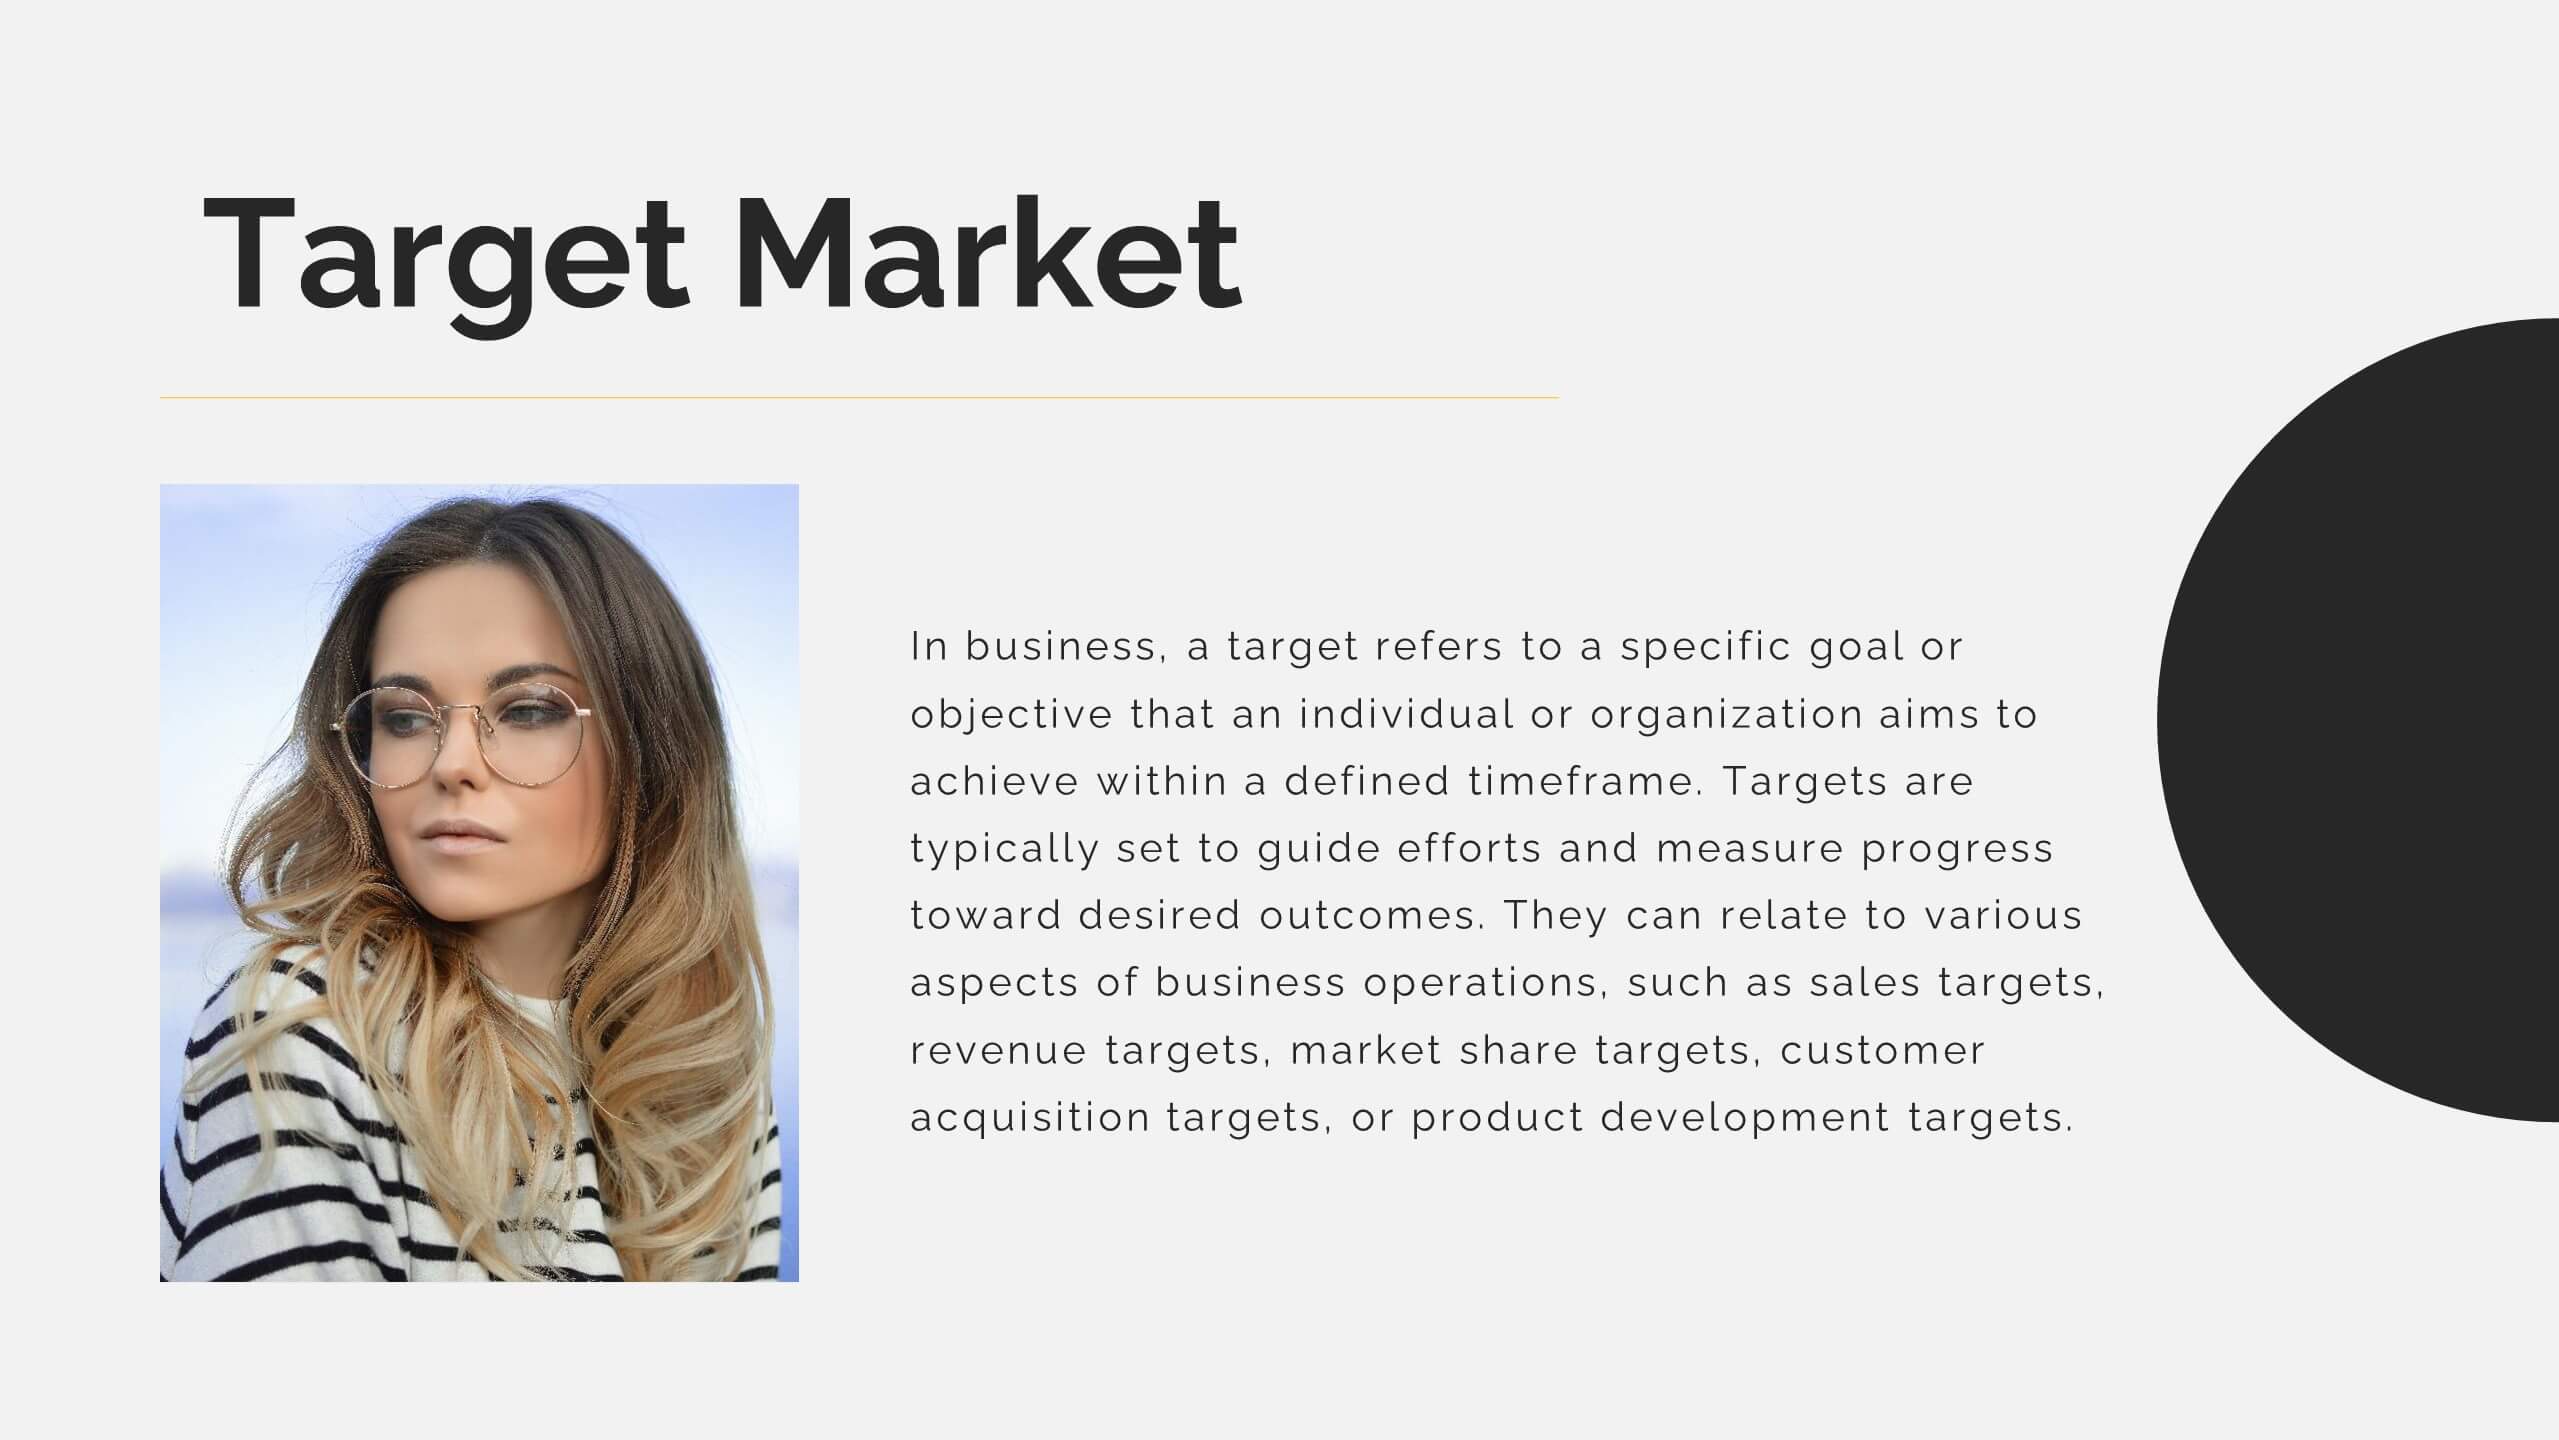
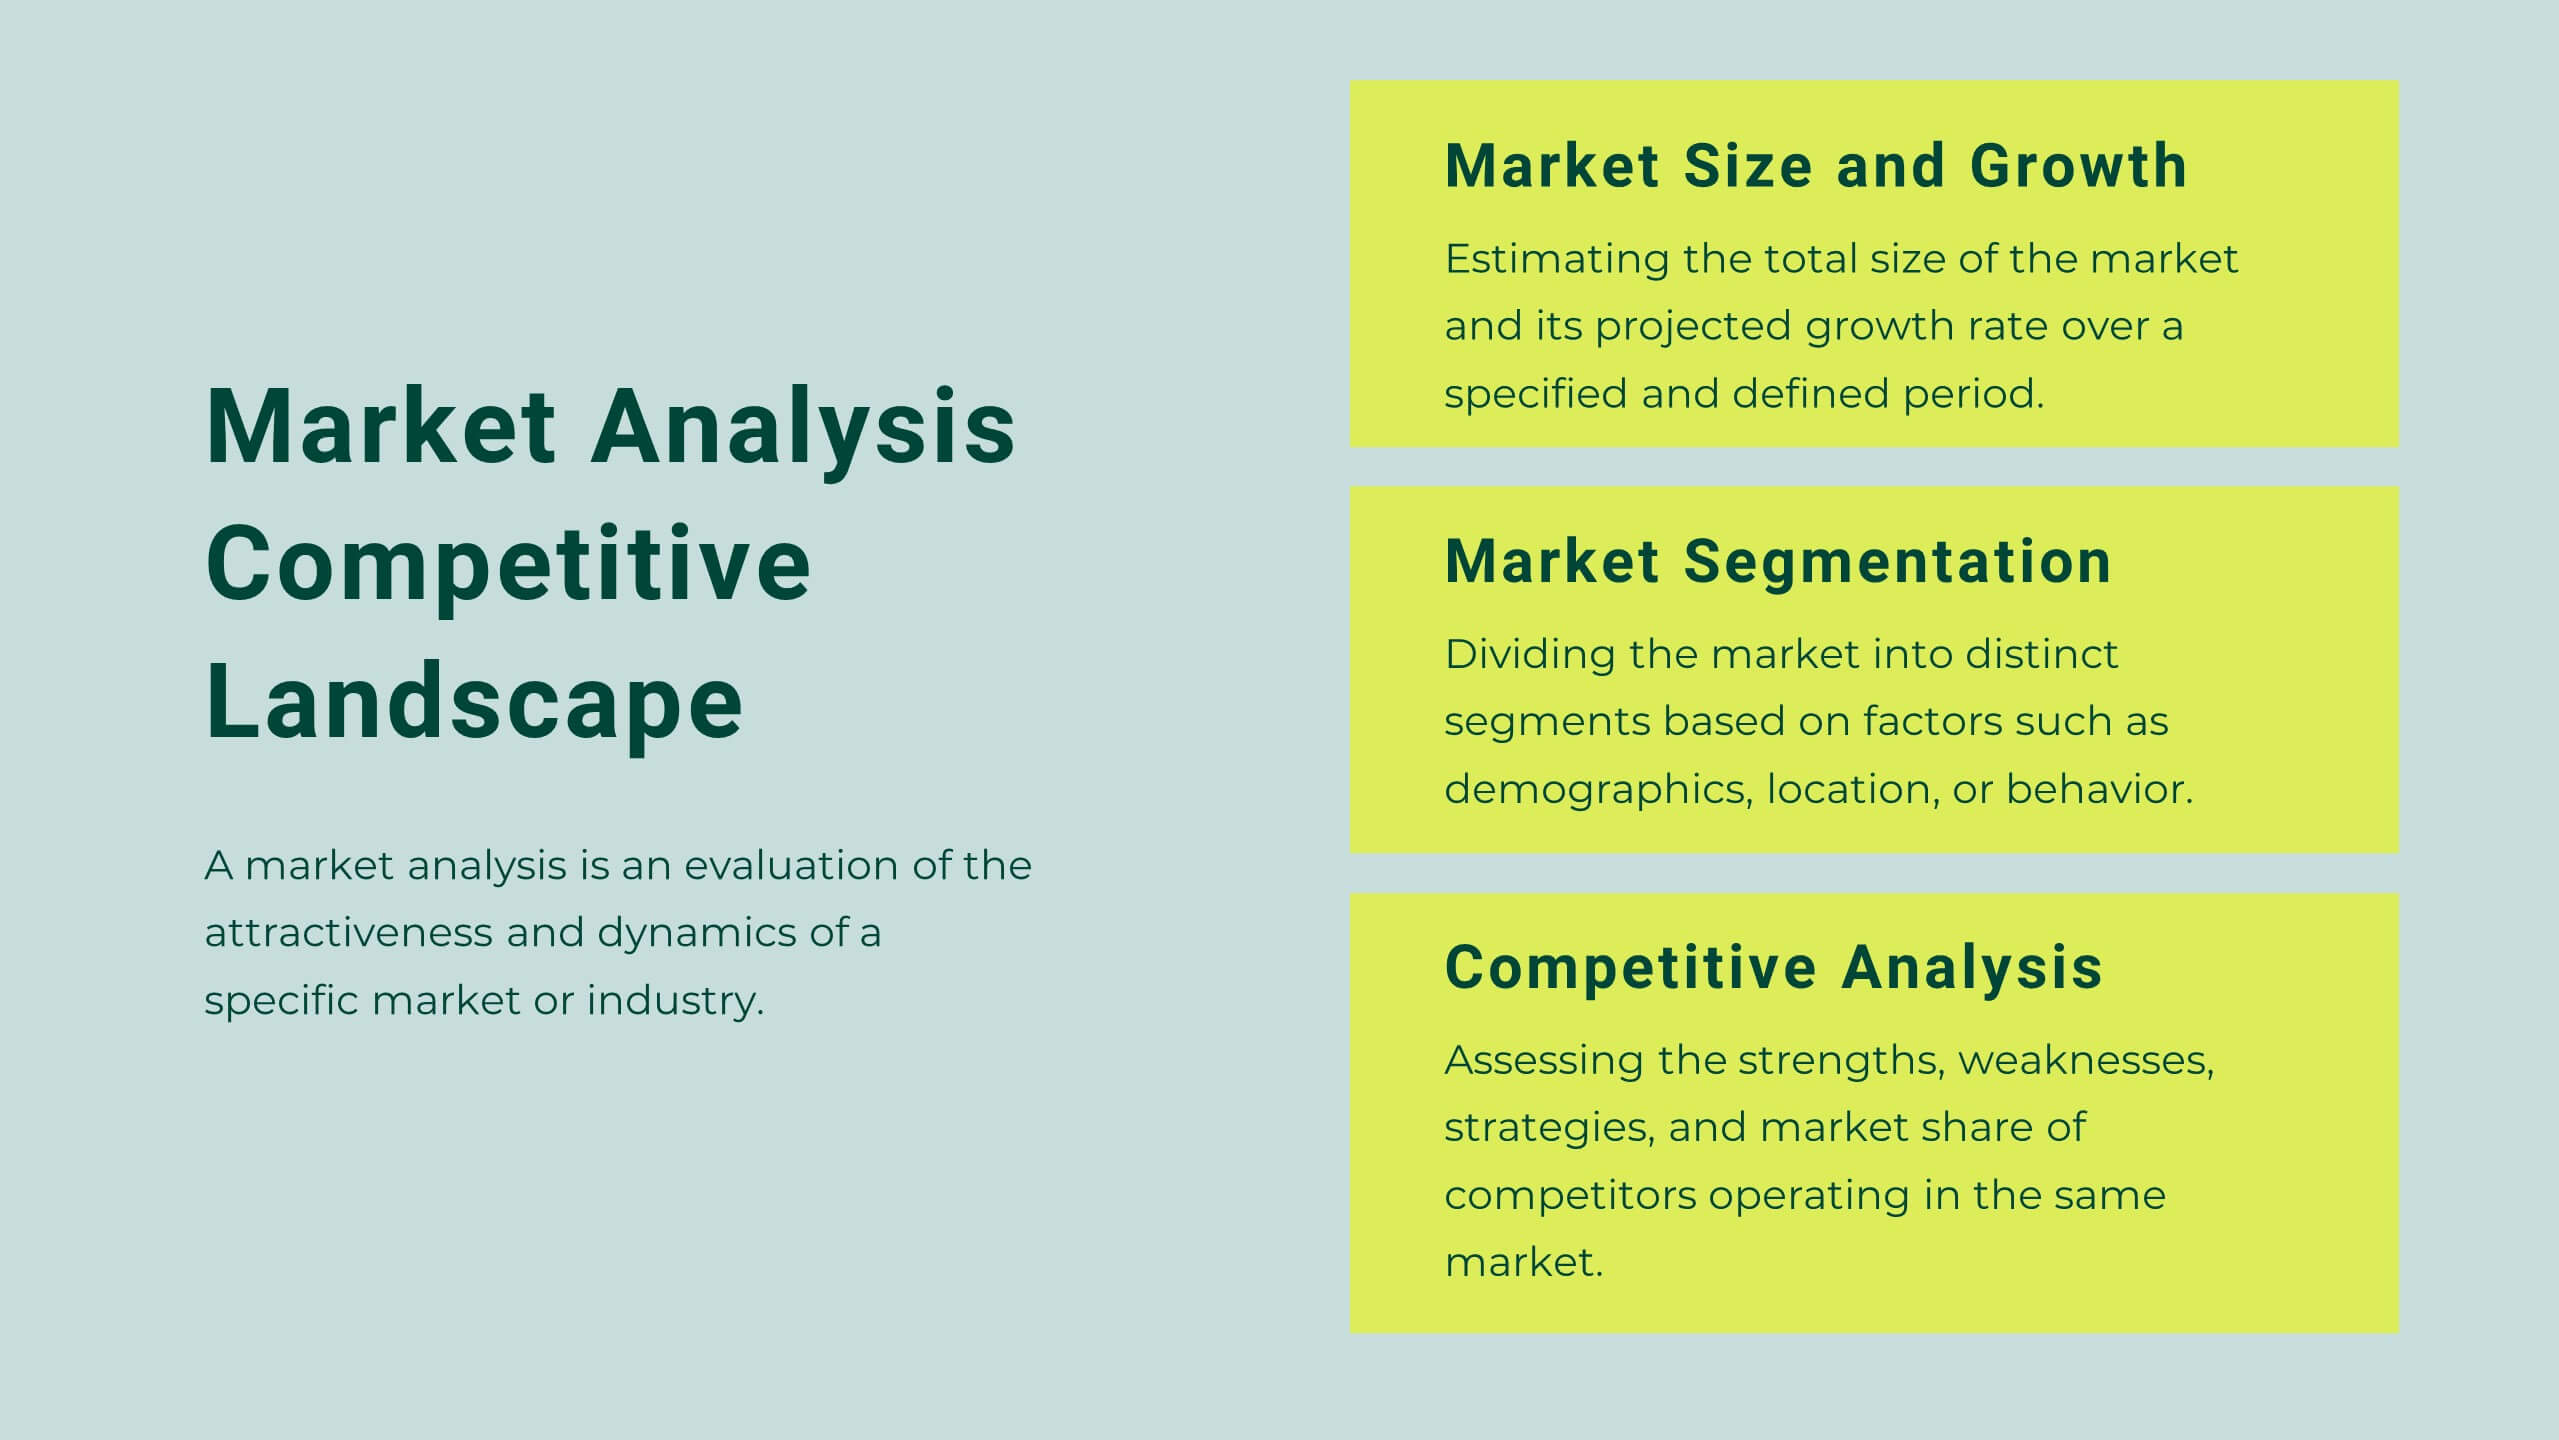
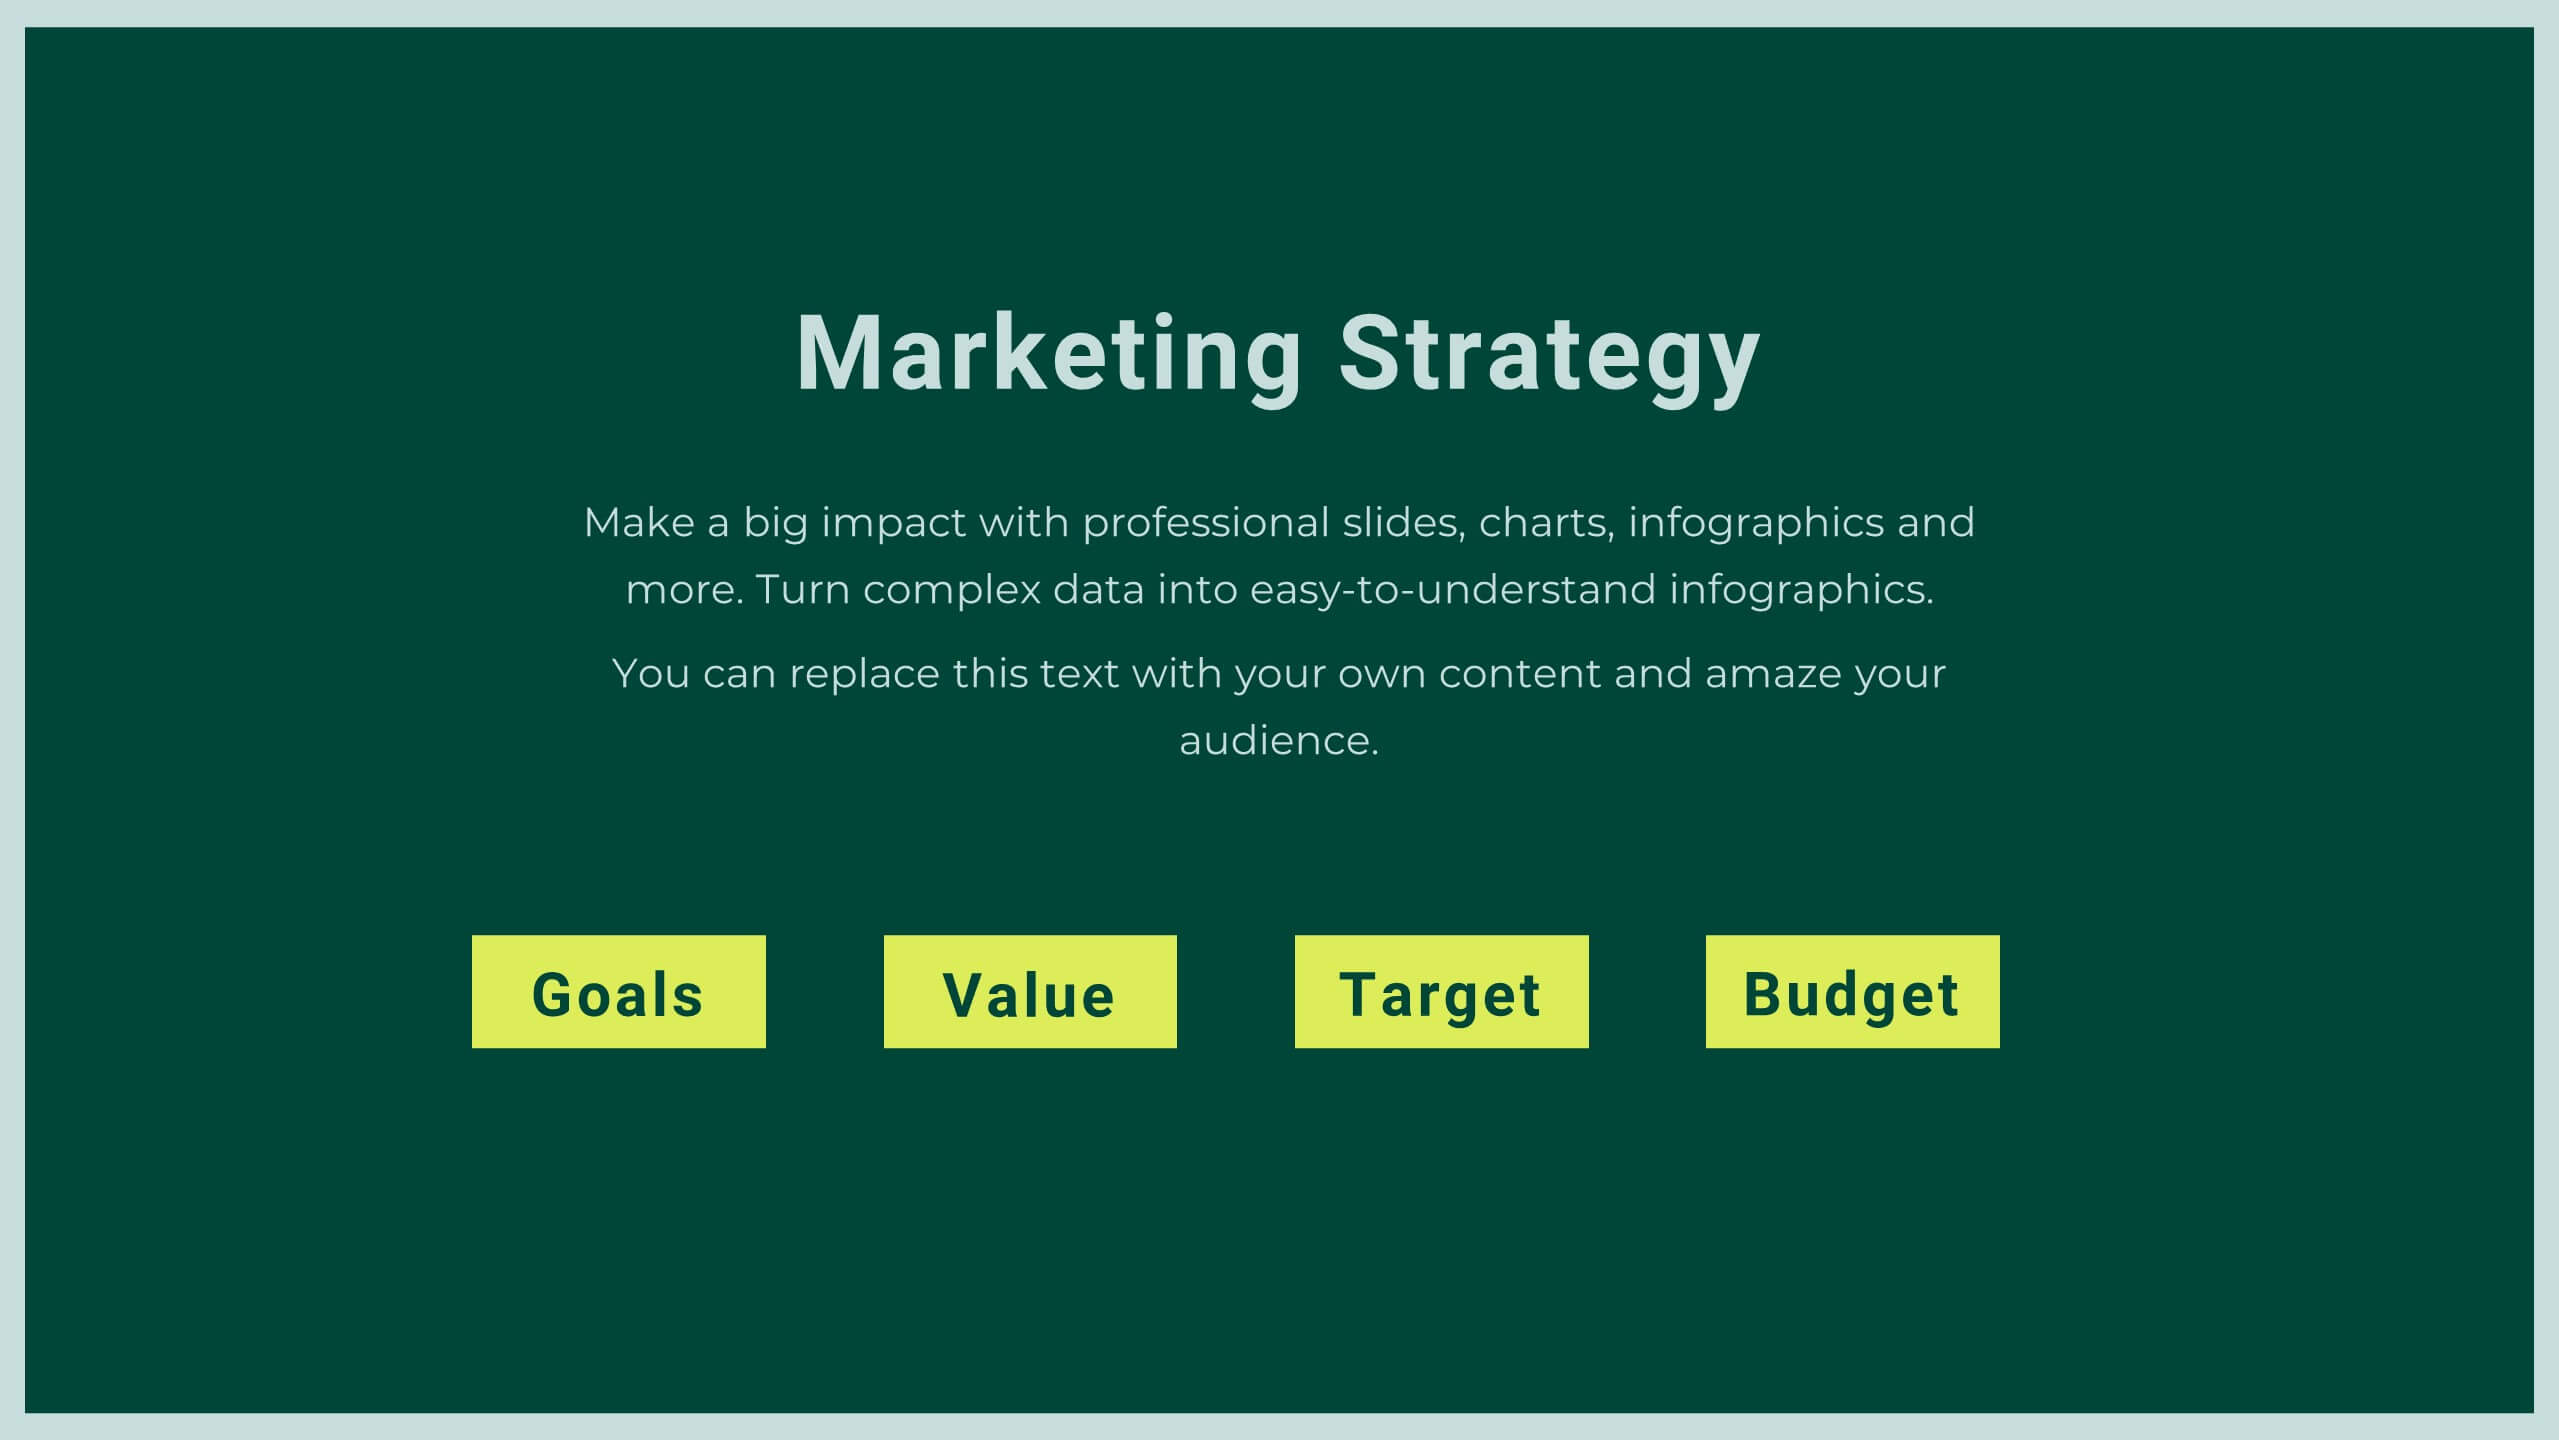
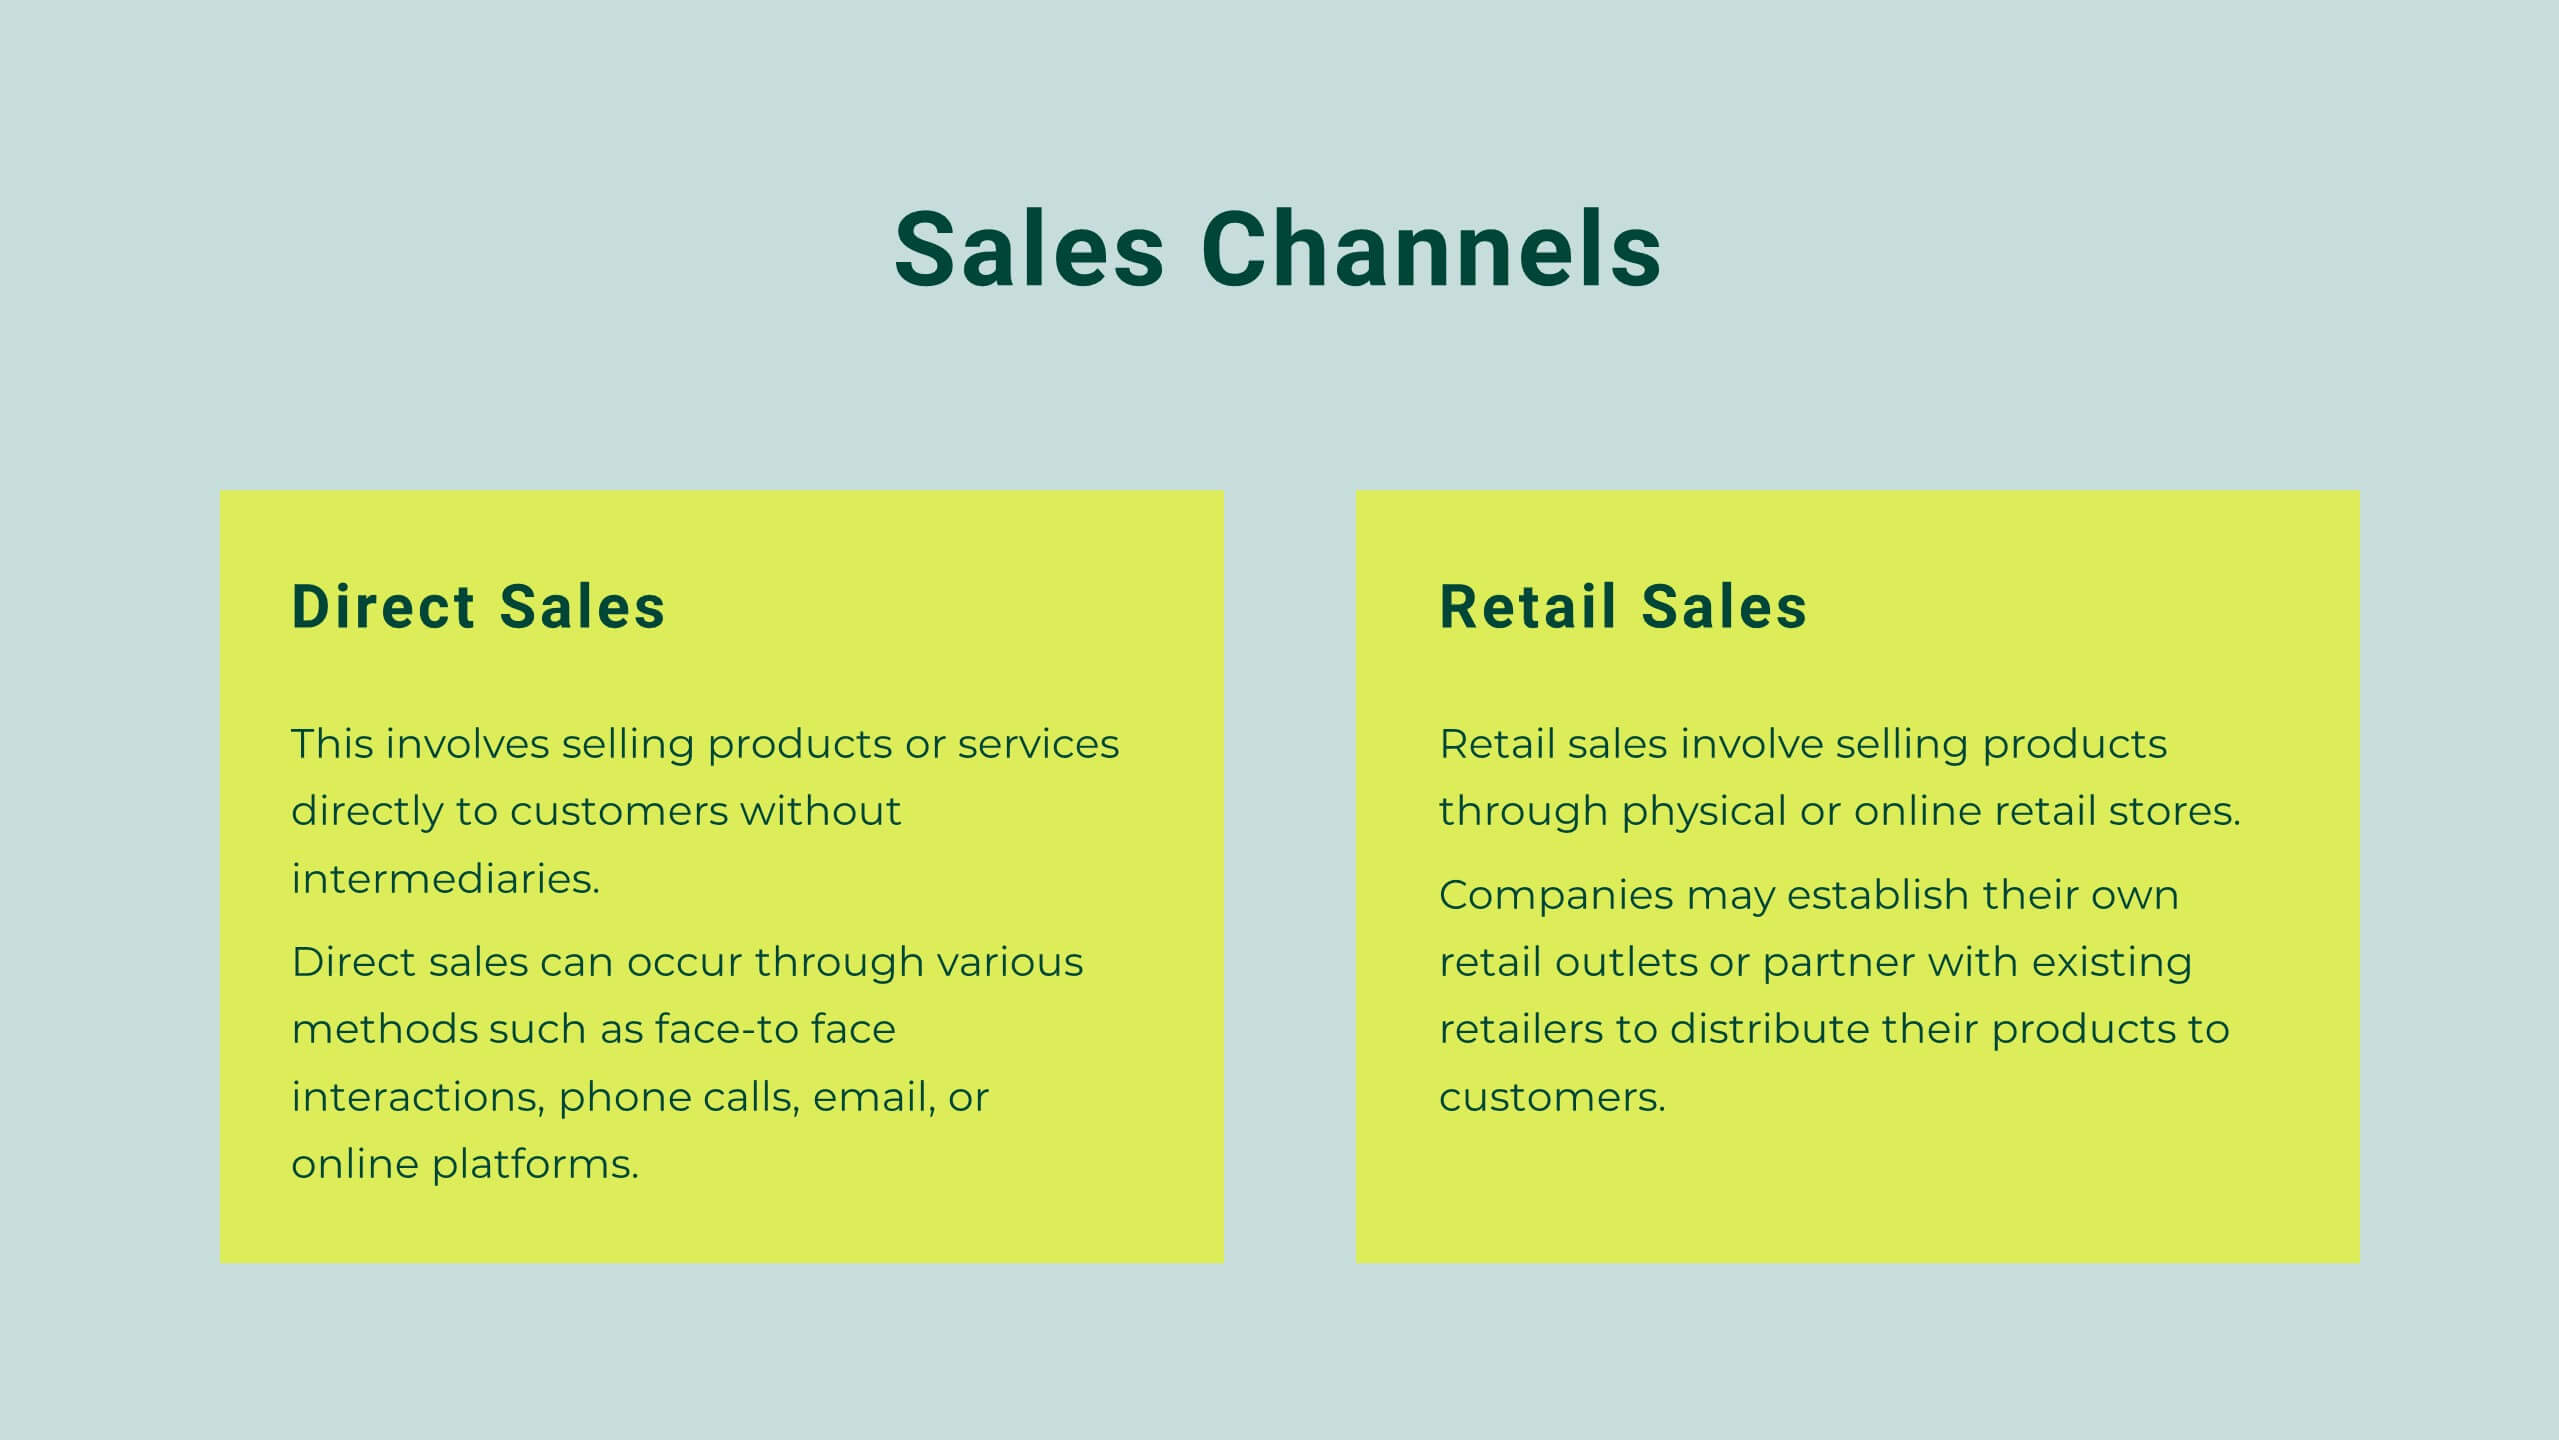
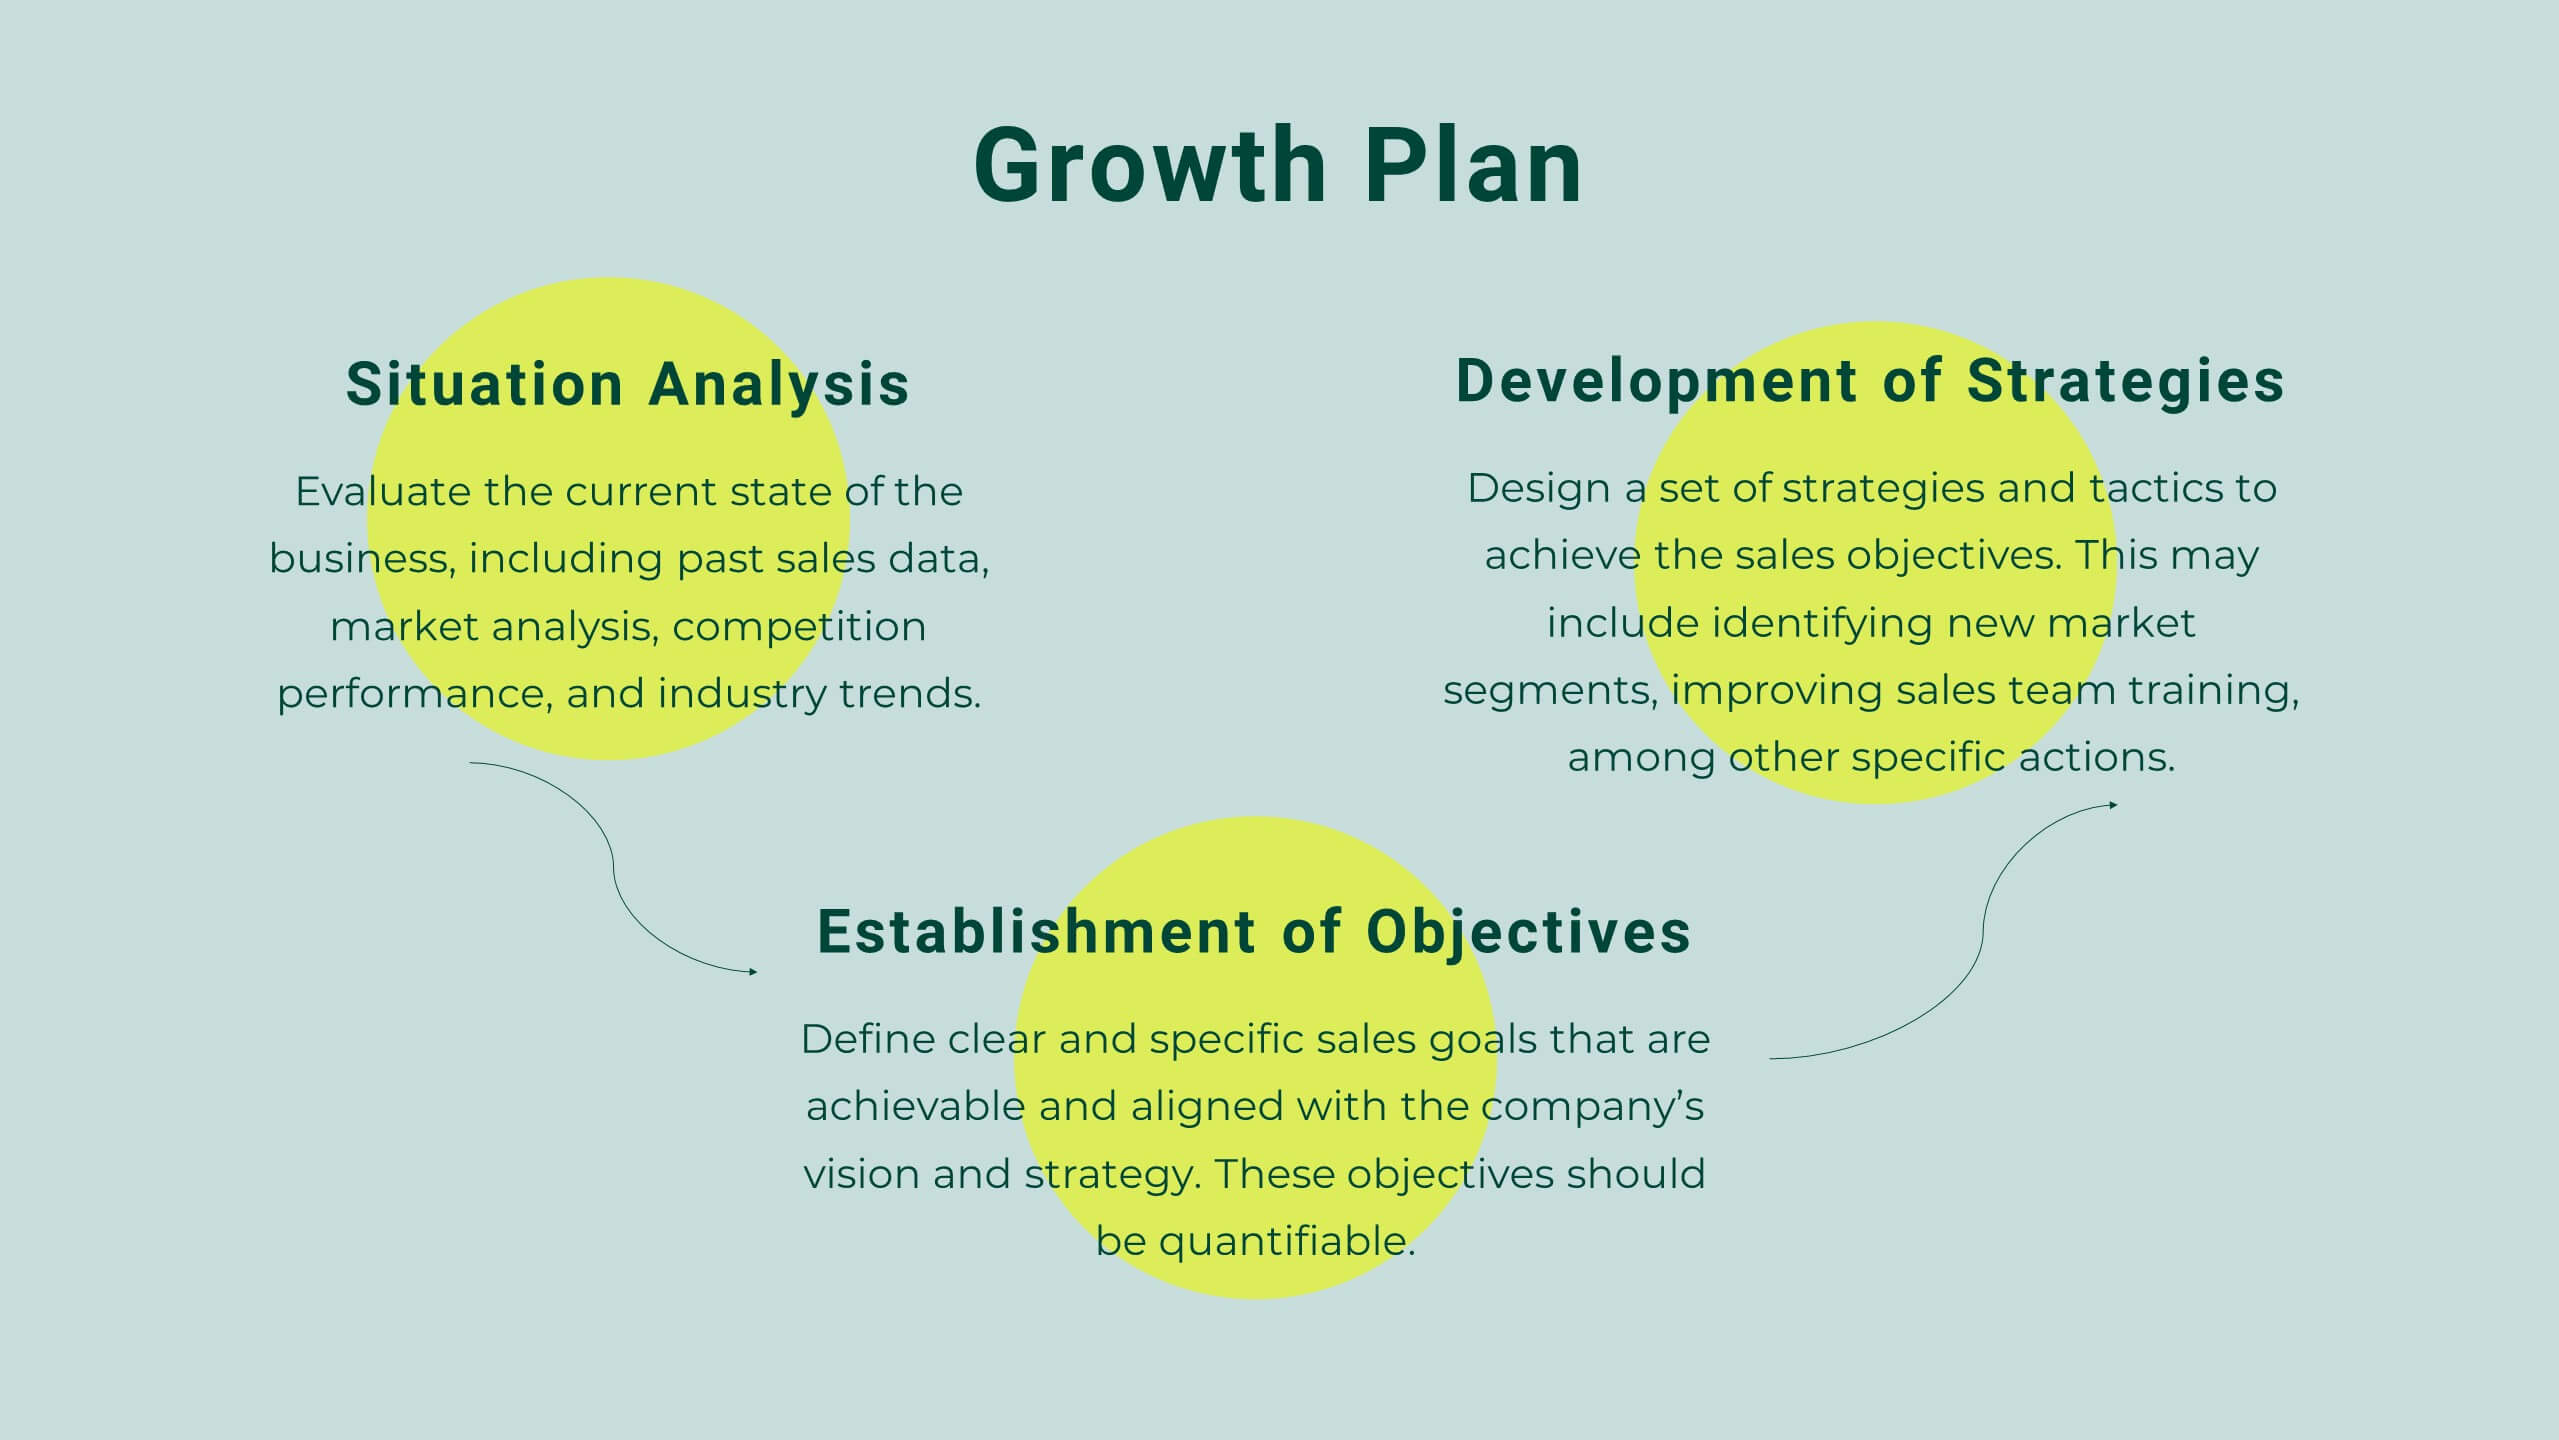
Kinetic Startup Funding Proposal Presentation
Get ready to impress potential investors with the Kinetic Startup Funding Proposal template! This dynamic and modern template is designed to help you present your startup's vision, mission, and growth potential in the most compelling way possible. From introducing your team and services to highlighting your unique value proposition and business model, every slide is crafted to showcase your startup's strengths. The template includes sections for market analysis, customer needs, and pain points, ensuring your presentation is data-driven and focused on solving real problems. With slides dedicated to your marketing strategy, sales channels, and financial overview, you can provide a comprehensive plan for success. The sleek design, combined with easy-to-edit slides, allows you to customize the presentation to reflect your startup's brand identity. Whether you're pitching to angel investors or venture capitalists, the Kinetic Startup Funding Proposal template will help you stand out and secure the funding you need. Compatible with PowerPoint, Keynote, and Google Slides, this template is your key to delivering a winning pitch.