


Features
- 5 Unique slides
- Fully editable and easy to edit in Microsoft Powerpoint, Keynote and Google Slides
- 16:9 widescreen layout
- Clean and professional designs
- Export to JPG, PDF or send by email


Do you have any questions?
Recommend


22 slides
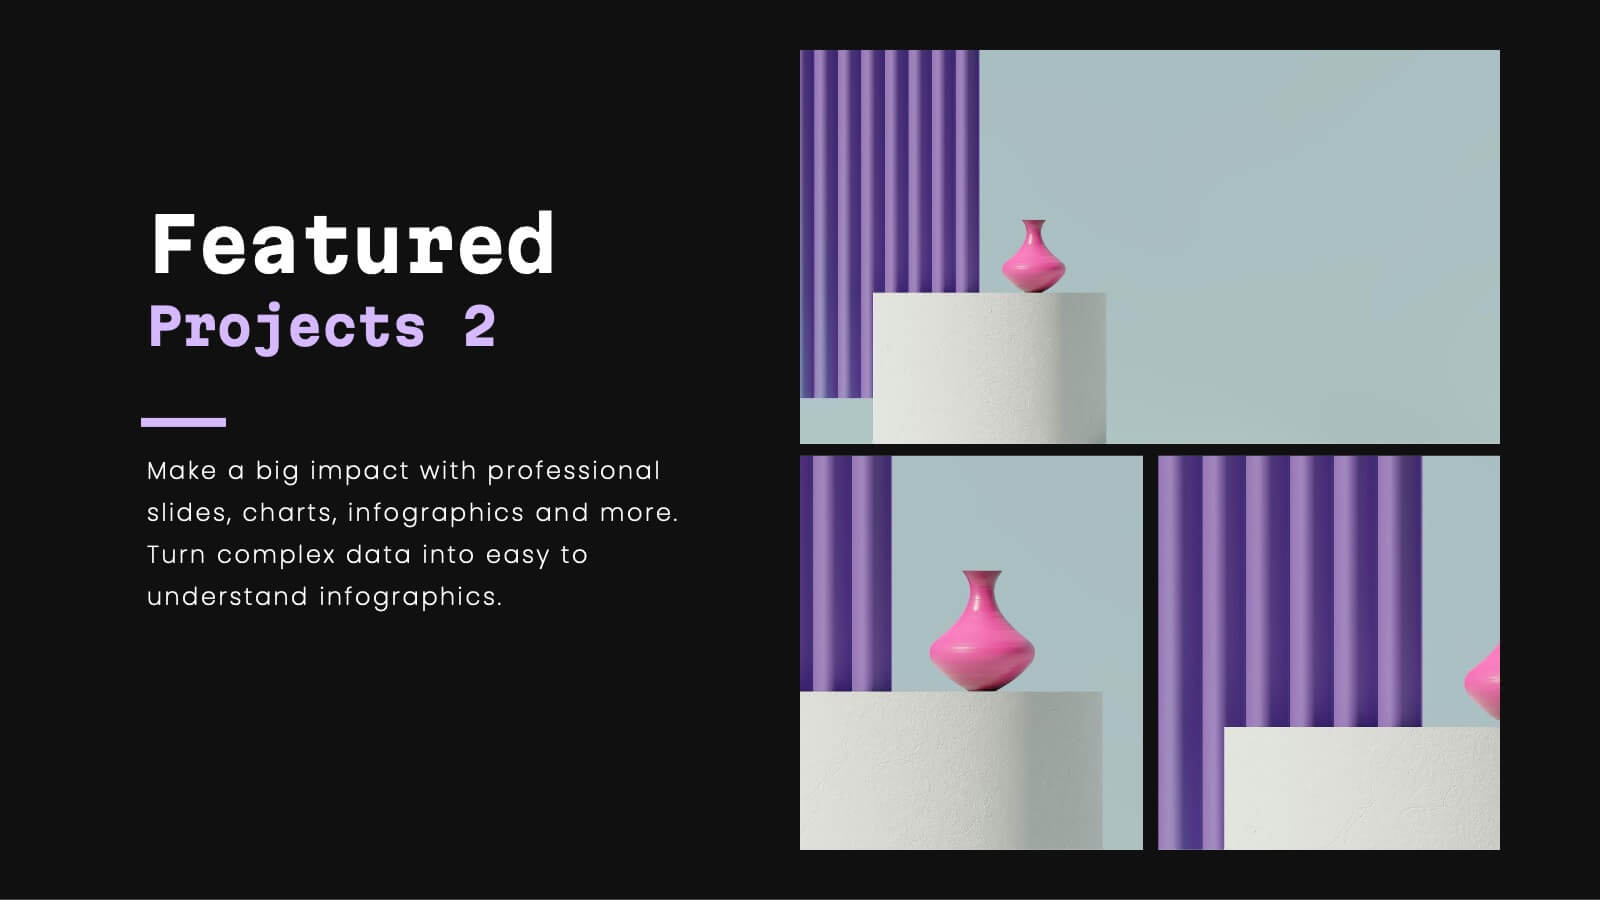
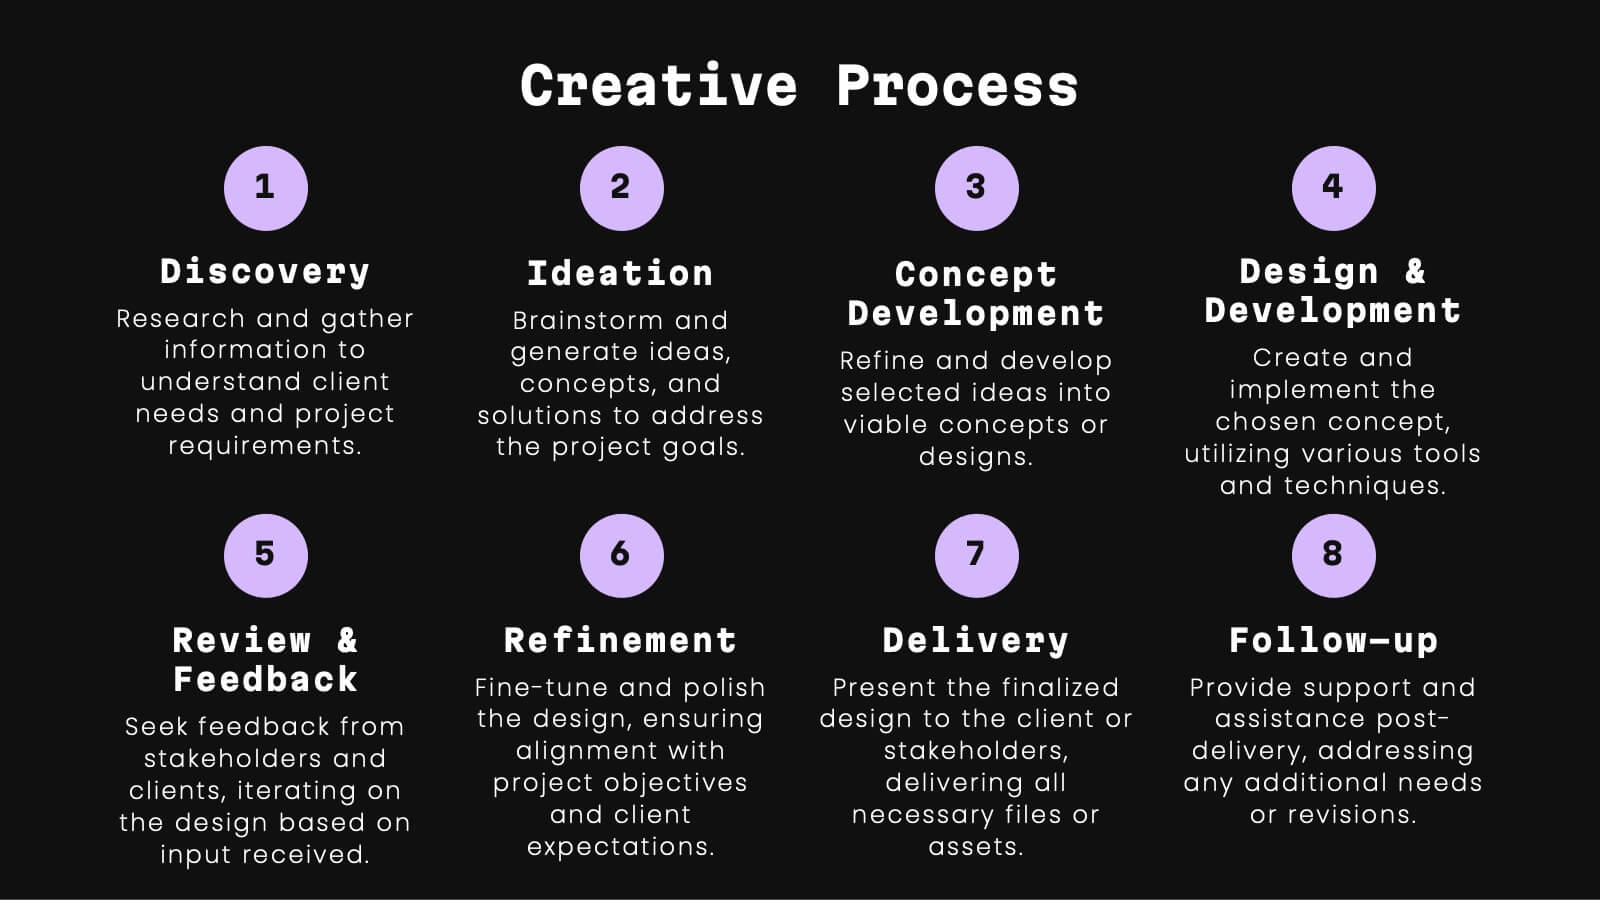
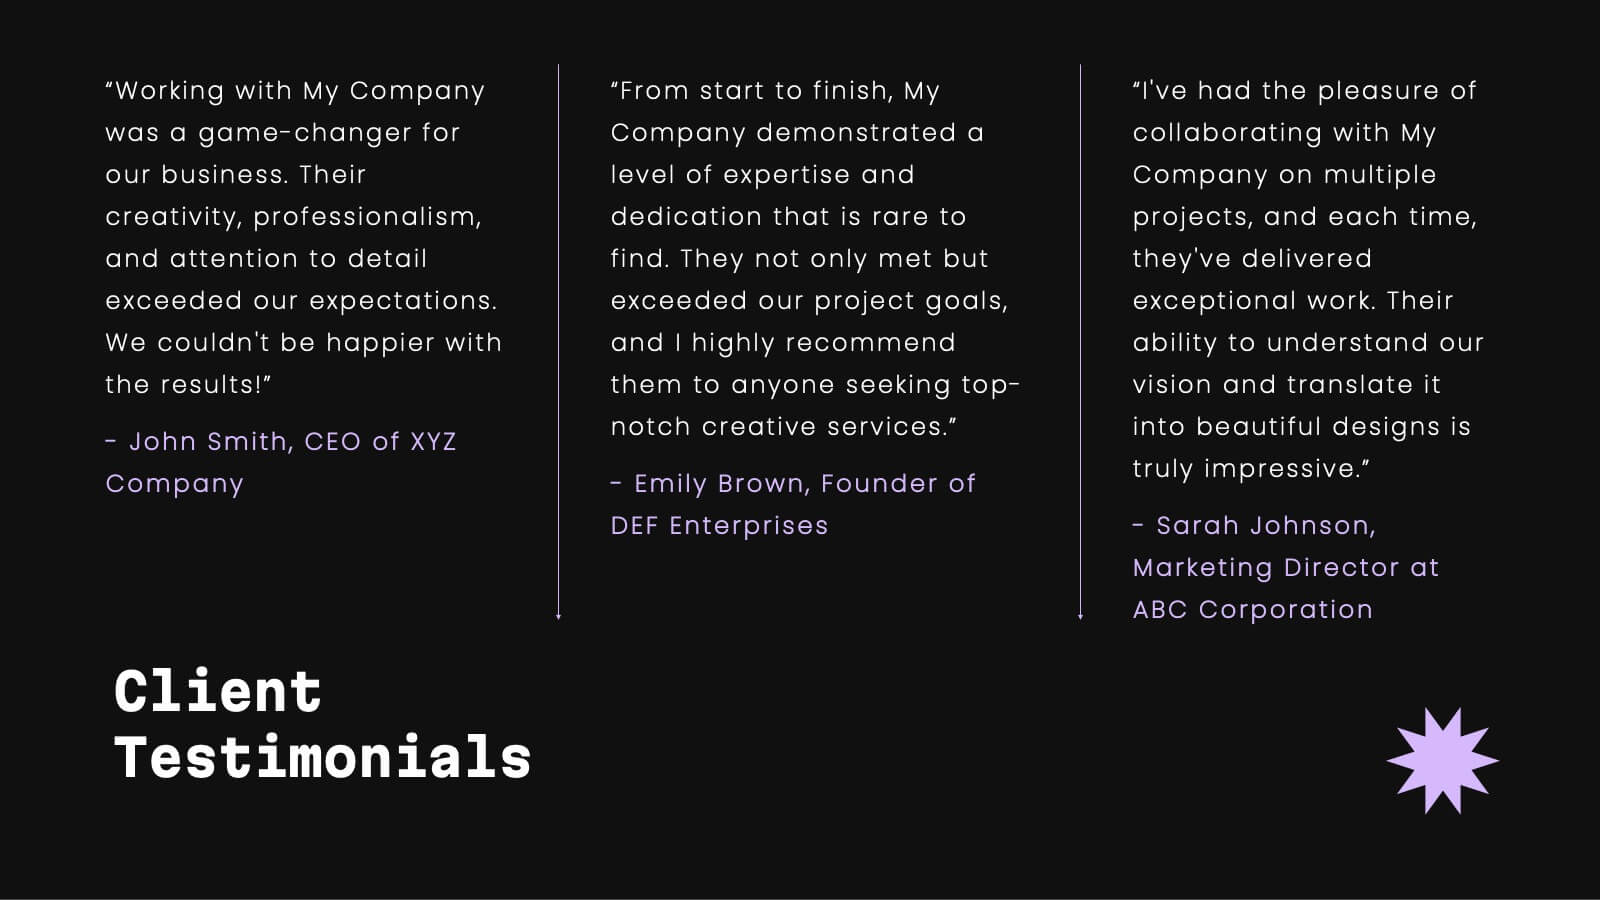
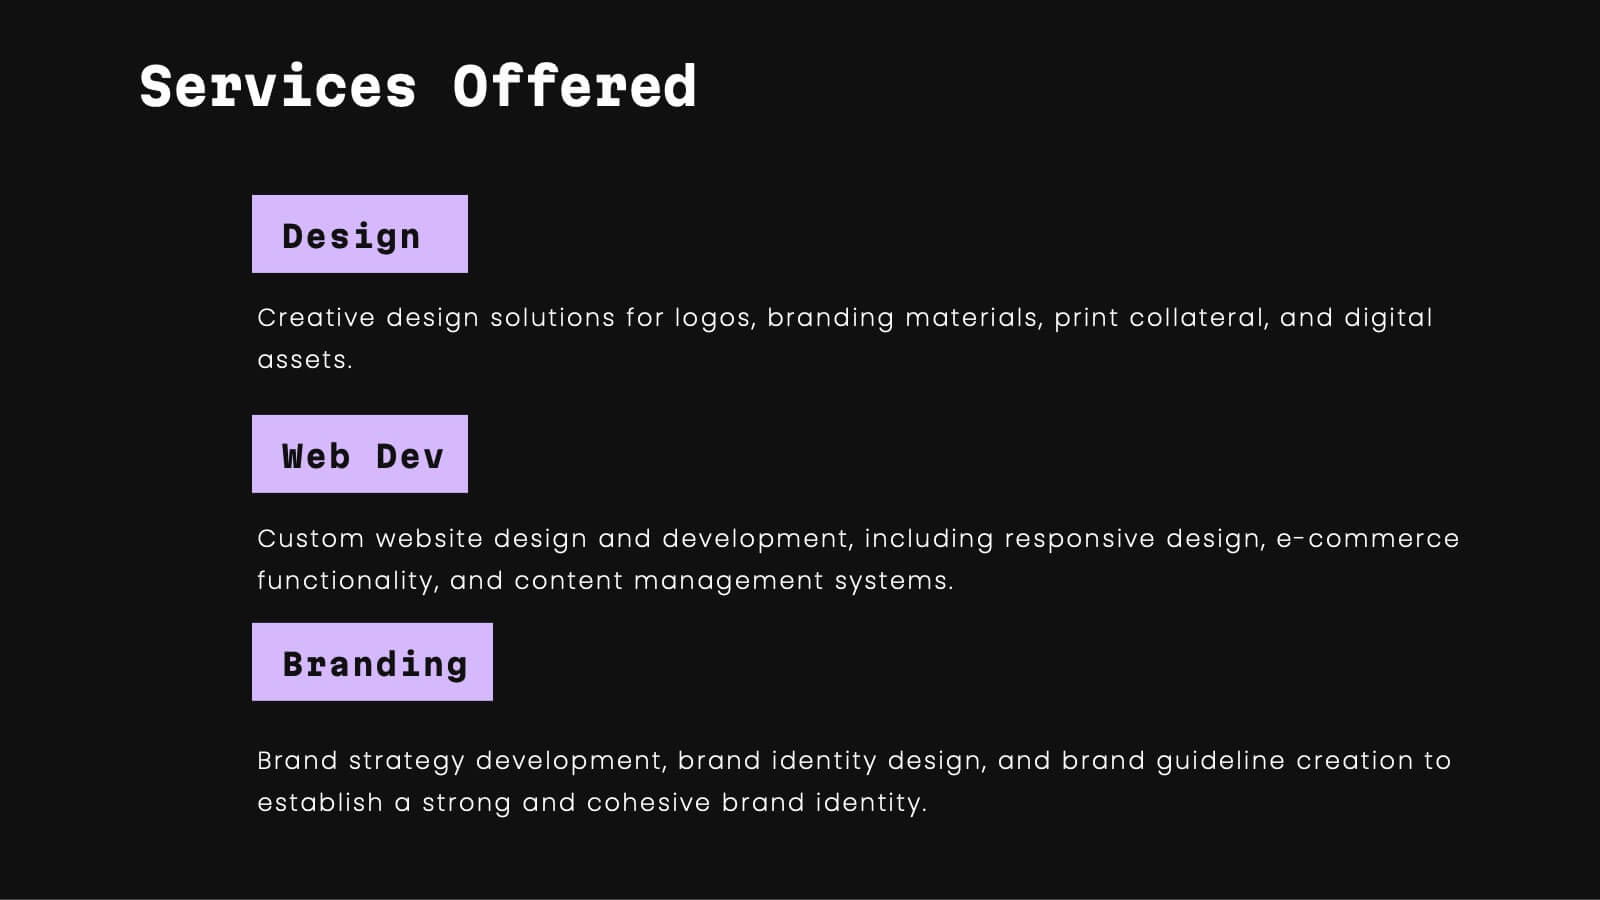
Celeste Professional Portfolio Showcase Presentation
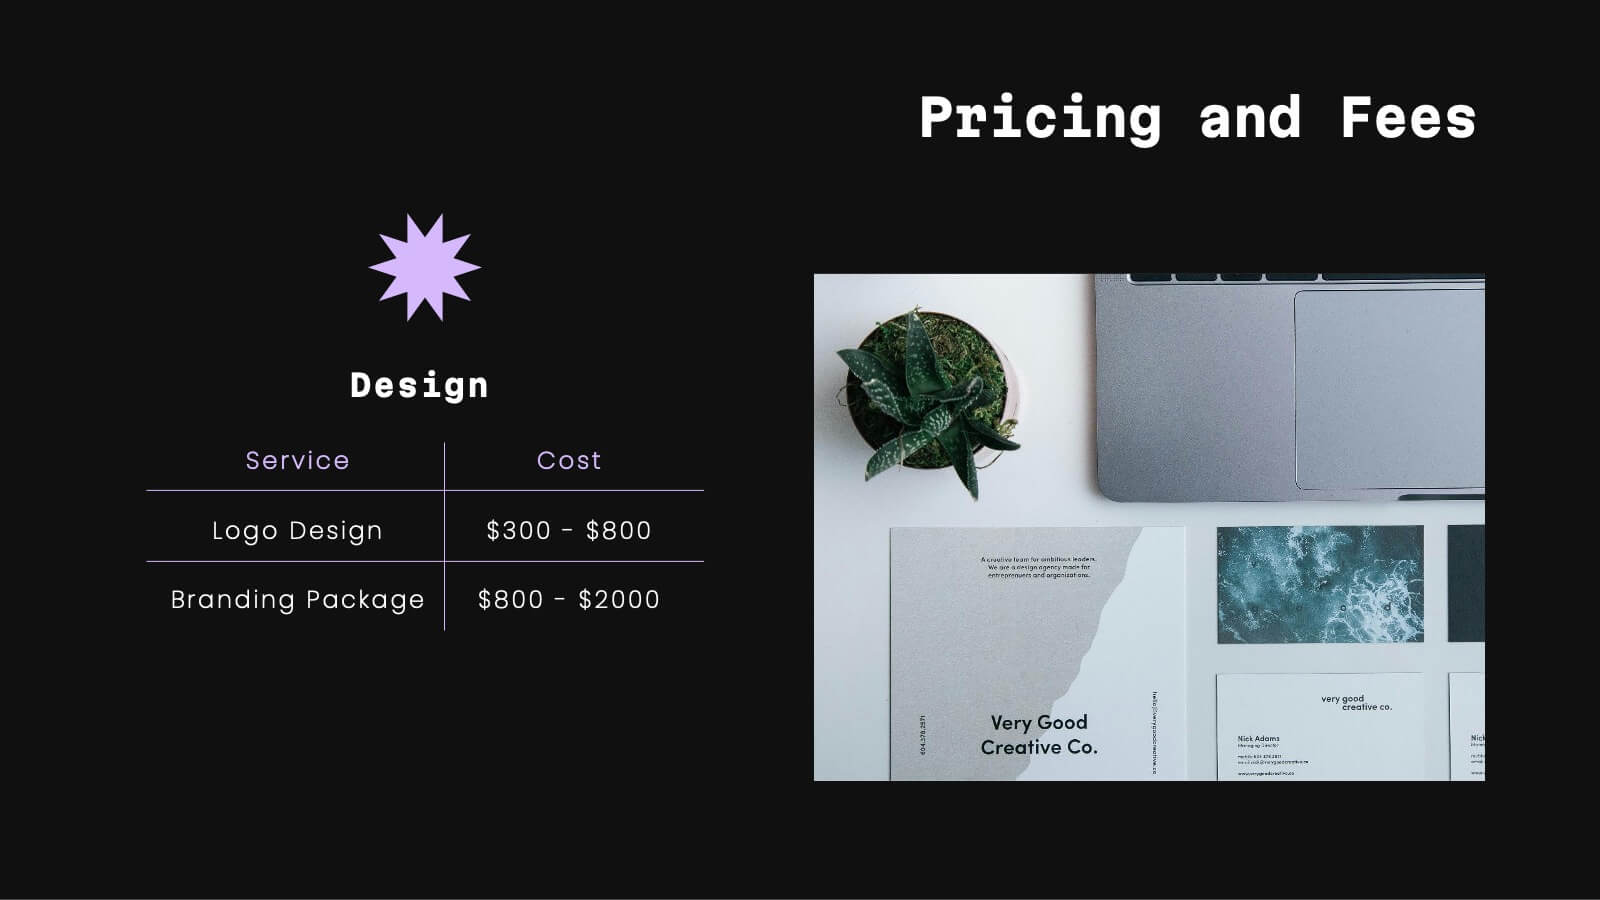
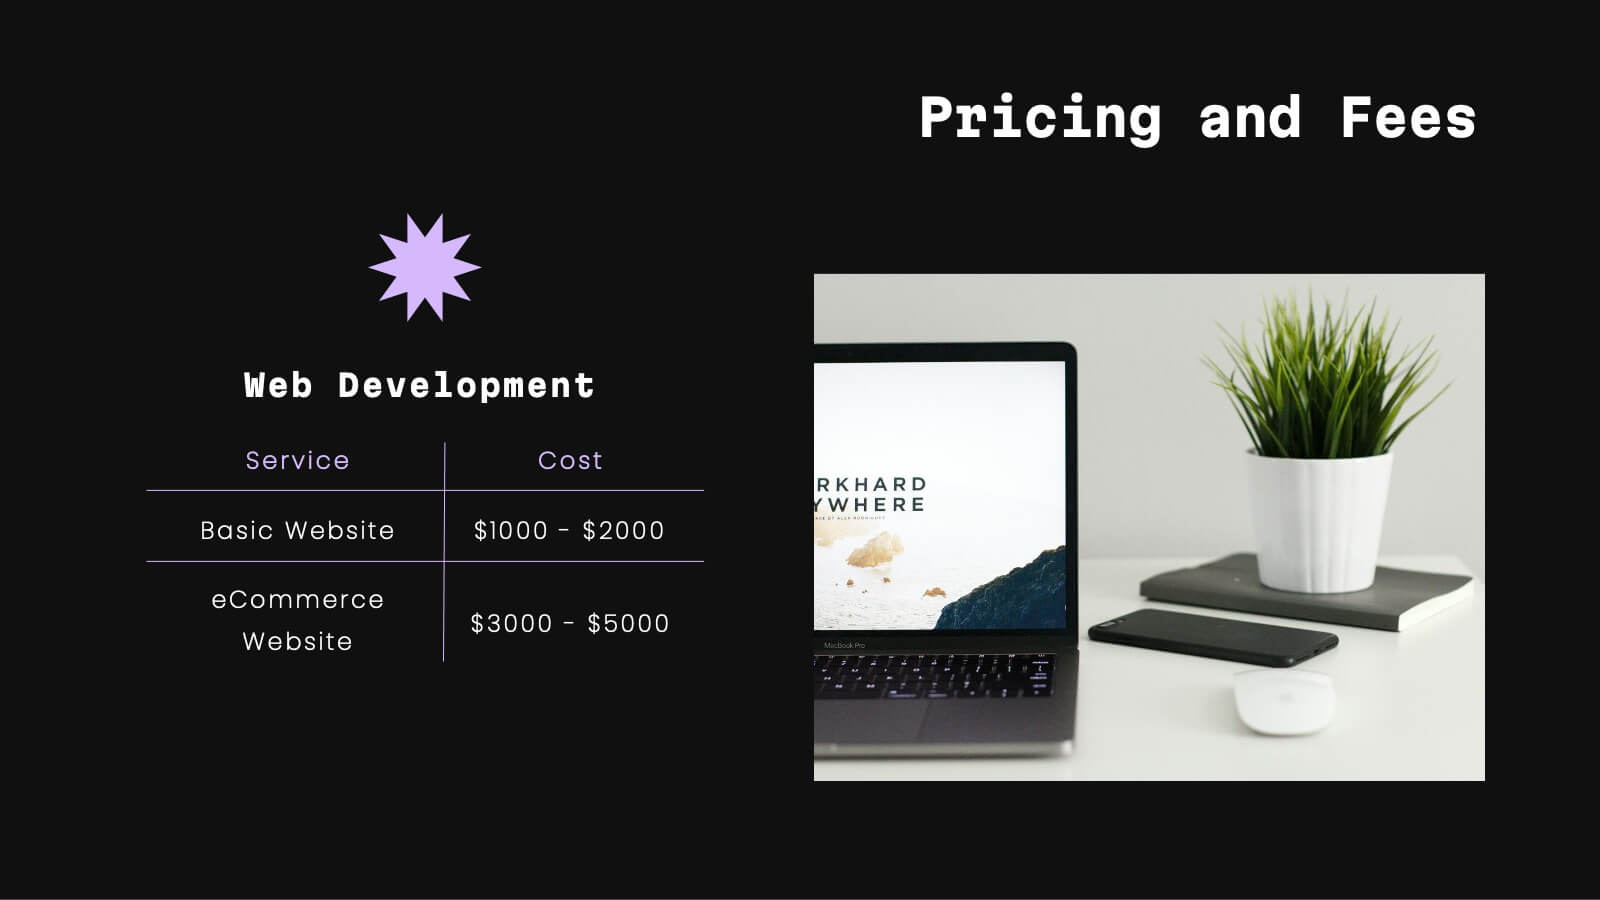
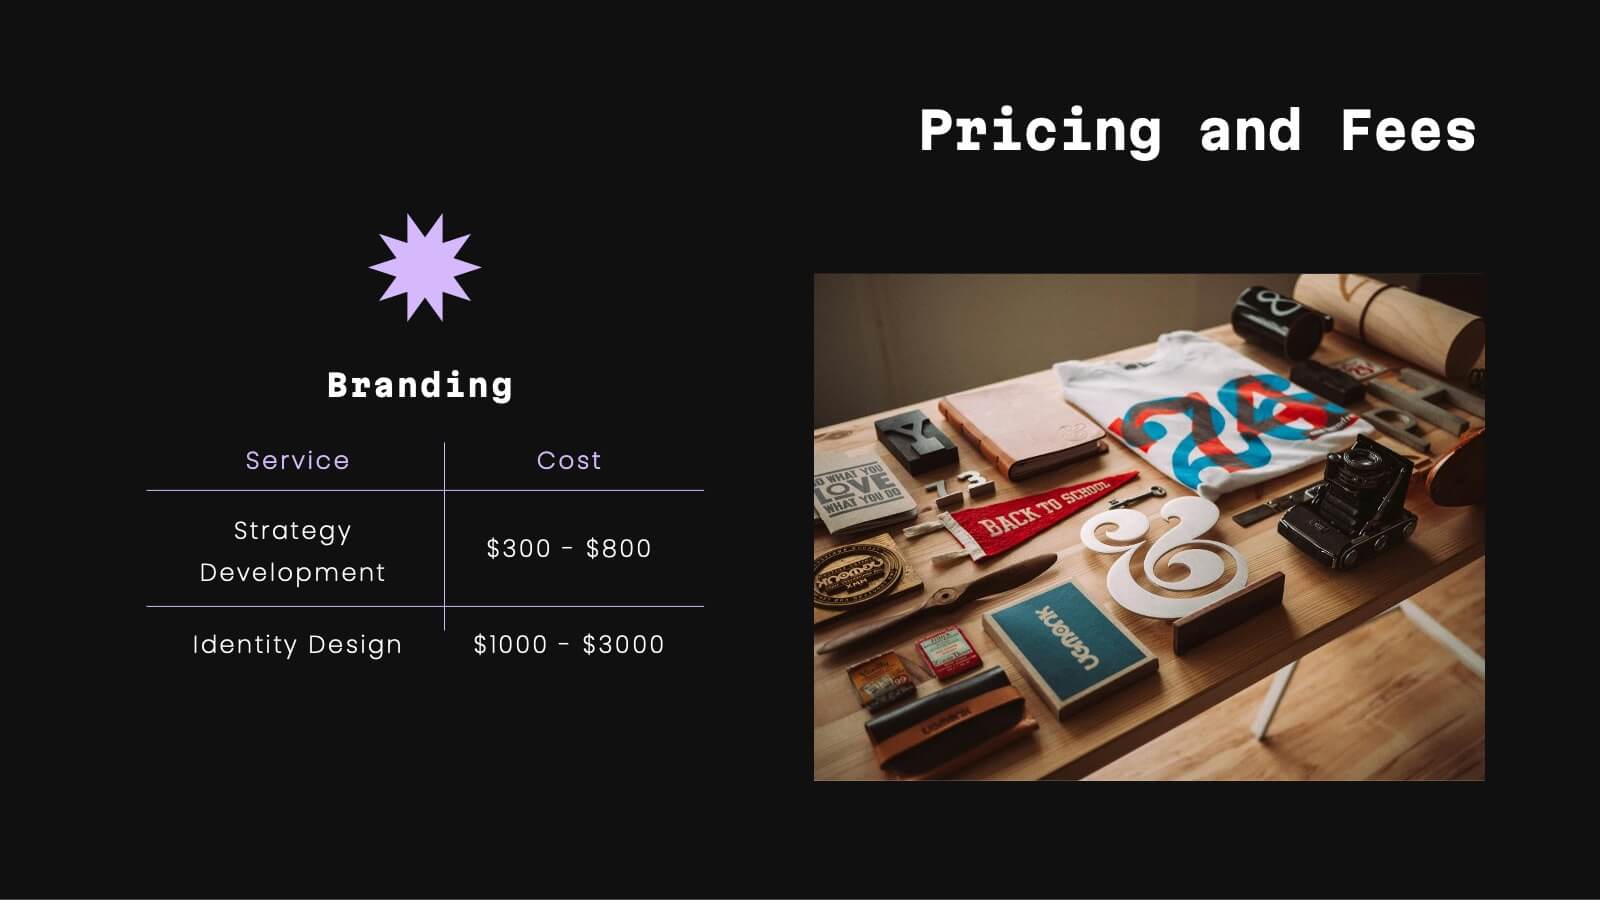
Impress with style using this sophisticated portfolio presentation template. Perfect for showcasing featured projects, creative processes, and client testimonials, this template enhances the visual appeal of your work. Its modern, dark-themed design ensures your content stands out, making a lasting impression. Compatible with PowerPoint, Keynote, and Google Slides, it's versatile for any platform.


5 slides
Oil Industry Revenue Infographics
The oil industry, also known as the petroleum industry, is a global sector that involves the exploration, production, refining, transportation, and marketing of petroleum products. These vertical infographics present key statistics and insights about the revenue generated by the oil industry. This infographic provides an overview of the financial aspects of the oil industry, including revenue sources, market trends, and economic impact. The template showcases the revenue trends of the oil industry over a specific period. It utilizes line graphs, bar charts, or other visual elements to illustrate the growth or fluctuations in revenue over time.


7 slides
Decision Points Infographic
Decision points are specific moments or junctures within a process, project, or any situation where a decision needs to be made. This infographic template is designed to illuminate the path of choices, empowering you to make informed decisions and steer towards success. Compatible with Powerpoint, Keynote, and Google Slides. This infographic symbolizes the diverse options one encounters in their journey, and the importance of choosing wisely. The graphs and charts depicting the dilemmas encountered, emphasize the analytical process of weighing pros and cons to arrive at the best decision.


7 slides
Customer Empathy Map Infographic Presentation
An Empathy Map infographic is a visual tool used to help understand the needs, wants, and behaviors of a particular customer. This template is a perfect way to gather and organize information about a person's experience and perspective, in order to better understand their motivations and desires. This empathy map infographic consists of a diagram that is divided into four quadrants: what the user thinks and feels, what they hear, what they see, and what they do. In each quadrant, information is gathered about the user's thoughts, feelings, and actions related to a particular product or service.


6 slides
Real Estate Classes Infographic
Real estate classes are educational programs or courses that provide individuals with the knowledge and skills needed to succeed in the real estate industry. This infographic template provides an overview of different types of real estate classes and what real estate is. This is designed to help individuals interested in the real estate industry understand the various educational opportunities available to them. Help your audience make informed decisions about their educational journey in the real estate field. Fully customizable and compatible with Powerpoint, Keynote, and Google Slides.


6 slides
Europe Regions Infographic
Europe is a diverse continent with various regions that have their own unique characteristics and cultural identities. This infographic provides an overview of the different regions in Europe. It is designed to help viewers understand the diverse geography, culture, and characteristics of each region within Europe. The template features a map of Europe that highlights the various regions. Viewers can easily identify and explore each region on the map. The template includes slides dedicated to providing key information such as capital cities and major landmarks. The template incorporates statistical data to showcase key facts and figures about each region.


6 slides
Three-Part Comparative Venn Layout Presentation
Showcase relationships, overlaps, and distinctions across three core elements with this elegant petal-style Venn layout. Perfect for comparing strategies, audiences, or product features. Each section includes customizable labels and icons. Fully editable in PowerPoint, Keynote, and Google Slides—ideal for business analysis, educational presentations, and marketing plans.


5 slides
Website UI Mockup Device Display
Present your web interface with clarity and flair using this clean device display slide. Designed around a desktop monitor mockup, it’s perfect for showcasing UI designs, website pages, or digital layouts. Fully customizable in PowerPoint, Keynote, and Google Slides—edit colors, fonts, and content to match your project needs.


7 slides
IT Architecture Infographics Presentation Template
Our IT Architecture Infographic template is designed to help you create a quick, easy and simple-to-understand presentation that explains your IT Architecture. This template will provide you with material to set out your ideas and give an overview of what’s important so that you can rapidly make progress in this area. This is a perfect choice to impress your clients, teachers, students, or employees. This presentation creates an extravagant feeling that will invite investors and clients to become invested in your project. This template is well-organized and perfect for your next presentation!


5 slides
Sub-Saharan Africa Region Presentation
Showcase regional insights with a sleek, professional map highlighting key areas across Africa’s southern nations. Ideal for presenting economic data, development initiatives, or regional comparisons, this layout balances clarity with visual impact. Fully compatible with PowerPoint, Keynote, and Google Slides for smooth editing and impactful presentations.


4 slides
Cost Analysis and Budget Overview Presentation
Break down financial details with clarity using the Cost Analysis and Budget Overview Presentation. This slide helps you present cost structures, budget allocations, and key financial metrics side by side using icons and visual data blocks. Perfect for reports, planning, or investment decks. Fully editable in PowerPoint, Google Slides, Keynote, and Canva.


6 slides
Editable Weekly Calendar Slide Presentation
Bring your week into focus with a vibrant layout that turns daily planning into something you actually look forward to. This presentation helps you outline tasks, deadlines, and priorities in a clear, color-coded structure perfect for productivity. Fully editable and compatible with PowerPoint, Keynote, and Google Slides.


7 slides
SWOT Analysis Infographic Presentation Template
SWOT analysis is a strategic tool that's usually done to help you determine your company's strengths and weaknesses, as well as opportunities and threats that could affect your company's future. With this template you can visually present the results of a SWOT analysis. They are used too quickly and easily communicate the key findings of the analysis to stakeholders, such as investors and employees. This templates infographics typically include four quadrants, each representing one of the SWOT elements. Use this template to make an easy-to-read infographic of your company's success factors.


5 slides
Letter Recognition Chart Presentation
Enhance learning and data visualization with this Letter Recognition Chart Presentation template. Featuring a modern, stepwise design with speech bubbles, this layout is perfect for education, branding, and business-related presentations. Fully customizable and compatible with PowerPoint, Keynote, and Google Slides.


6 slides
Education and Learning Strategy Presentation
Enhance educational planning with the Education and Learning Strategy Presentation template. This structured and visually compelling layout is designed to outline learning initiatives, training programs, and academic strategies effectively. Ideal for educators, trainers, and institutions, this template ensures clarity and engagement. Fully customizable and compatible with PowerPoint, Keynote, and Google Slides for seamless presentation creation.


6 slides
User Empathy Map Infographic
An Empathy Map is a visual tool used in design thinking and customer-centric approaches to understand the needs, thoughts, feelings, and behaviors of a specific target user or customer. This infographic template is a tool used in user-centered design and product development to better understand and empathize with the needs, thoughts, emotions, and experiences of the target users. It helps teams gain deeper insights into the users' perspectives and develop more user-focused solutions. The infographic consists of four quadrants, each representing different aspects of the user's experience. Compatible with Powerpoint, Keynote, and Google Slides.


4 slides
Executive Data Overview Dashboard Presentation
Drive informed decision-making with the Executive Data Overview Dashboard Presentation. This sleek, data-centric slide layout features clean blocks for KPIs, progress percentages, and simple bar or donut charts—ideal for summarizing business insights, performance metrics, or operational updates. Fully editable in PowerPoint, Keynote, and Google Slides, it's designed for clarity, speed, and high-level reporting.