


Features
- 4 Unique slides
- Fully editable and easy to edit in Microsoft Powerpoint, Keynote and Google Slides
- Vertical widescreen layout
- Clean and professional designs
- Export to JPG, PDF or send by email


Do you have any questions?
Recommend


6 slides
North America Weather Map Infographics
Explore our customizable North America Weather Map infographic template, a valuable tool for understanding regional weather patterns. Compatible with PowerPoint, Keynote, and Google Slides, this template simplifies complex data into user-friendly visuals, allowing you to tailor it to your specific requirements. This infographic template offers a foundation for displaying current and historical weather data, temperature trends, precipitation patterns, and more. Whether you're a meteorologist, educator, or just curious, this template provides a versatile platform to create weather-related presentations that suit your unique needs. Impress your audience with this SEO-optimized North America Weather Map infographic template, designed for clarity and ease of use. Customize it to stay informed, plan outdoor activities, and effectively communicate weather information. Get started with your customized infographic today!


4 slides
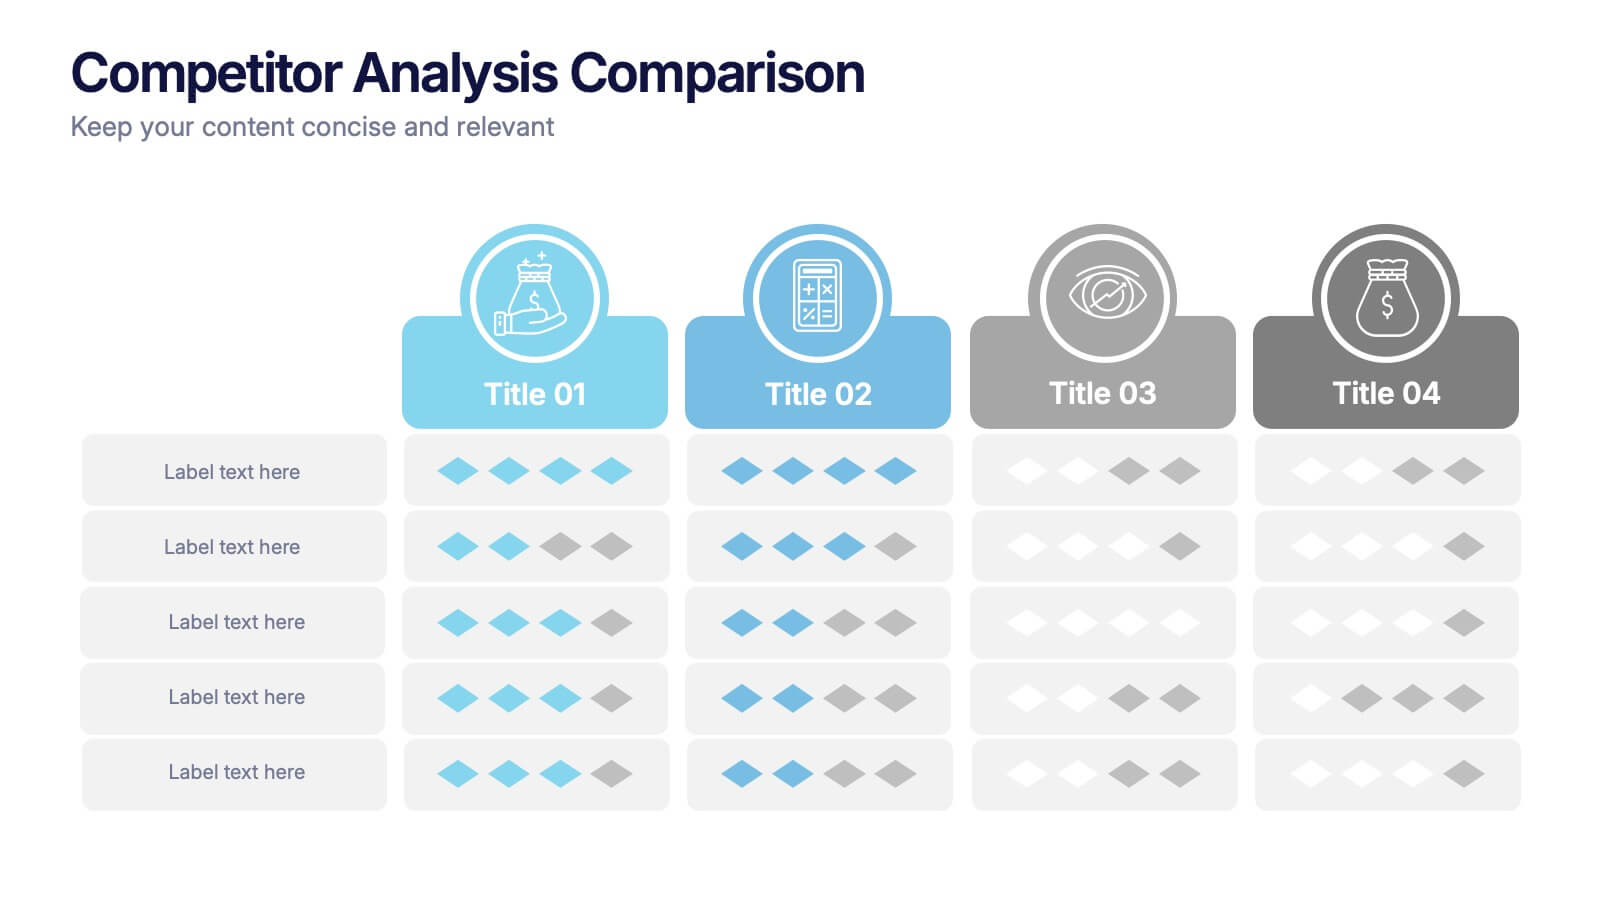
Competitor Analysis Comparison Presentation
Quickly evaluate strengths and weaknesses across your market landscape with this Competitor Analysis Comparison Presentation. Featuring clean tables, icons, and rating visuals, it's ideal for highlighting where your brand stands out. Fully editable in PowerPoint, Keynote, and Google Slides.


7 slides
North America Map Infographic Presentation Template
North America is a continent entirely within the Northern Hemisphere and almost all within the Western Hemisphere. It can also be considered a northern subcontinent of the Americas. North America is the third largest continent in the world, and home to some of the world's most iconic landmarks. This North America template is great for creating a simple and clean map. This easy-to-customize map includes icons in both light and dark color variations. This North America map template is great for presentations, reports and more. Add your data to create a professional presentation.


7 slides
Asia Map Infographic Presentation Template
Asia is the largest, most populous, and most culturally diverse continent. Asia constitutes of nearly one-third of Earth's landmass and is lying entirely north of the equator. The continent is home to a variety of cultures, ethnic groups, and religions. This Asian map template includes the different labeled countries, and graphs with statistics. This can be used to show your audience the geographical layout of Asia, or as an example of what a modern, professional presentation should look like. This template is a great resource for students, teachers and people who want to learn more about Asia.


8 slides
Brainstorming Visualization
Spark creativity with the Brainstorming Visualization Presentation—a dynamic diagram built to energize your ideation process. Featuring a lightning bolt cloud as the central symbol, this layout radiates out to four key thought nodes, each with space to highlight insights, solutions, or topics. Ideal for team ideation, strategic planning, or mind mapping. Fully editable in PowerPoint, Keynote, and Google Slides.


8 slides
Market Research Survey Analysis Presentation
Present your Market Research Survey Analysis with this visually engaging template, designed for clear data visualization and insights presentation. Featuring an intuitive infographic layout, this template allows you to highlight key survey findings, customer insights, and strategic takeaways. Fully customizable in PowerPoint, Keynote, and Google Slides, you can adjust colors, edit text, and modify icons to align with your business needs.


7 slides
Supply Chain Logistic Infographics
Streamline your logistics insights with our Supply Chain Logistics Infographic, tailored for logistics managers, supply chain analysts, and operations directors. This infographic provides a visual tool to depict the intricacies and flow of your supply chain from procurement to distribution. Our infographic offers a comprehensive layout to map out each step of the supply chain, highlighting key processes such as supplier selection, manufacturing, inventory management, and logistics. It's designed to facilitate a better understanding of each segment's role in the overall efficiency and effectiveness of the supply chain. Customize this infographic with specific data points, such as lead times, turnover rates, and transportation modes, to provide a detailed view of your logistics operations. This SEO-optimized infographic is crafted to make your supply chain data accessible and actionable. Implement our infographic to communicate the complexities of supply chain logistics succinctly, ensuring that stakeholders grasp the full scope of your supply chain dynamics.


6 slides
Detailed Info Table with Metrics
Present complex insights with clarity using the Detailed Info Table with Metrics Presentation. Designed to showcase up to five key items or categories, this layout includes structured rows and multiple columns—perfect for comparing metrics, milestones, or KPIs across several dimensions. With bold numbering and clean typography, this editable slide works in PowerPoint, Keynote, and Google Slides.


4 slides
Digital Course Creation Flow Presentation
Guide your audience through the steps of building a digital course with this clear and modern flowchart layout. Designed to simplify complex processes, this visual template is ideal for educators, instructional designers, or online coaches. Fully compatible with PowerPoint, Keynote, and Google Slides for easy customization and seamless use.


4 slides
AIDA Marketing Funnel Slide Presentation
Capture attention from the very first slide with a bold, structured layout that turns each stage of your message into a clear, engaging flow. This presentation helps simplify complex decision paths and guide viewers through each step with ease. Fully editable and compatible with PowerPoint, Keynote, and Google Slides.


4 slides
Preventive Health Services Layout Presentation
Make health data more human with this modern infographic layout for service-based reporting. This preventive health slide design clearly maps wellness categories to body parts, making it easy to communicate medical insights and early intervention strategies. Fully editable and compatible with PowerPoint, Keynote, and Google Slides for smooth integration into any deck.


6 slides
Quarterly Sales Overview Presentation
Bring your numbers to life with a clear, colorful layout that makes quarterly progress instantly easy to understand. This presentation helps you break down trends, compare performance across quarters, and highlight key insights with simple bar visuals. Perfect for reports and meetings, and fully compatible with PowerPoint, Keynote, and Google Slides.


7 slides
Process Solution Infographic
Streamline intricate workflows with our process solution infographic. Anchored in a pristine white base and infused with varying shades of professional blue, our template elegantly delineates step-by-step solutions and systematic approaches. Decked with meticulous infographics, representative icons, and versatile image placeholders, it transforms complexities into a navigable visual journey. Masterfully curated for Powerpoint, Keynote, or Google Slides. An invaluable asset for process managers, business analysts, strategists, or any organization keen on optimizing workflows. Navigate processes with confidence; let each slide chart the path to optimized solutions.


12 slides
Real Estate House Market Trends Presentation
Analyze Real Estate House Market Trends with this insightful presentation template. Featuring a house-shaped hexagonal layout, this design helps illustrate key factors such as market demand, property values, investment opportunities, and housing policies. Ideal for real estate professionals, investors, and analysts looking to present market insights with clarity and impact. Fully customizable and compatible with PowerPoint, Keynote, and Google Slides.


6 slides
Corporate Performance Annual Report
Present key business metrics with precision using this Corporate Performance Annual Report slide. Designed with progress bars and intuitive icons, this layout clearly communicates departmental or project-based performance. Ideal for year-end reviews, board meetings, and investor updates. Fully editable in PowerPoint, Keynote, and Google Slides.


6 slides
Thank You Note Infographic
Make every thank you memorable with this stylish template, designed to elevate your messages of gratitude. Each slide combines bold design elements, vibrant colors, and thoughtful layouts to ensure your message not only conveys thanks but also leaves a lasting impact. Customize the slides to match any occasion, from professional acknowledgements to personal notes of appreciation. Ideal for anyone looking to express gratitude with a modern twist, this template suits a variety of contexts—celebrating team achievements, thanking customers for their business, or acknowledging event attendees. Its flexibility allows it to fit seamlessly into both digital and print mediums, enhancing emails, social media posts, or traditional thank you cards. Add a personal touch to your expressions of thanks, creating a distinctive and engaging experience that strengthens connections and underscores your appreciation with elegance and flair.


6 slides
Children's Smile Rating Infographic
Smile Rating refers to a method of evaluating customer satisfaction or user experience by measuring the positive emotional response elicited, often in the form of a smile. This infographic template is a visually engaging way to showcase customer satisfaction or feedback using smiley faces to represent different levels of happiness or contentment. This type of infographic is commonly used in customer service, user experience, and feedback analysis. This can provide valuable insights into emotional engagement and satisfaction. This infographic is designed to focus on providing services or products that are intended to create a positive and enjoyable experience.