


Features
- 4 Unique slides
- Fully editable and easy to edit in Microsoft Powerpoint, Keynote and Google Slides
- 16:9 widescreen layout
- Clean and professional designs
- Export to JPG, PDF or send by email


Do you have any questions?
Recommend


7 slides
Network Solutions Infographics
The Network Solutions Infographic is designed to showcase the complexities and interconnectivity of network systems in a clear, visual format. It is perfect for IT professionals, educators, and students to communicate the intricacies of network architecture, pathways, and protocols. This infographic can be tailored to highlight various network types, such as LAN, WAN, or VPN, and to illustrate the flow of data through different network layers and devices. It can also be used to explain concepts like network security, data management, and the impact of emerging technologies on networking. Whether used for training purposes, presentations, or as part of a marketing strategy for tech companies, the Network Solutions Infographic simplifies the transfer of detailed network information and engages the audience with its visual appeal.


12 slides
Breast Cancer Awareness Day Presentation
The Breast Cancer Awareness Day presentation template is an essential tool for health awareness campaigns. With distinctive pink icons symbolizing support and education, this template is perfect for seminars and presentations. It's fully compatible with PowerPoint, Keynote, and Google Slides, enhancing accessibility and user experience.


4 slides
Healthcare Impact on Breast Cancer Day Presentation
Educate and inspire with the Healthcare Impact on Breast Cancer Day Presentation. This thoughtfully designed layout uses meaningful visuals to highlight data, awareness efforts, and key messages around breast cancer healthcare. Ideal for awareness campaigns, health reports, or nonprofit presentations. Fully editable in PowerPoint, Google Slides, Keynote, and Canva.


6 slides
Basic Numbers Infographic
This Basic Numbers Infographic is a visual representation of numerical data or information using simple graphical elements. This infographic template is a straightforward way to convey statistics, facts, or comparisons to your audience in a clear and engaging manner. The infographic includes a clean and uncluttered design while effectively presenting the numerical information. The visual elements enhance understanding and make the infographic visually appealing to your audience. The icons, symbols, and simple illustrations enhance the appeal of the infographic. Compatible with Powerpoint, Keynote, and Google Slides.


6 slides
Onboarding 30-60-90 Day Roadmap Presentation
Get your team excited from day one with this colorful, easy-to-follow visual layout! This presentation template helps clearly map out onboarding goals and key activities across 30, 60, and 90 days. Perfect for HR professionals and team leads, it's fully editable and works with PowerPoint, Keynote, and Google Slides.


10 slides
Buyer Persona Journey Presentation
Understand your audience better with the Buyer Persona Journey Presentation. This intuitive layout showcases the key stages of your ideal customer’s experience—from discovery to decision-making. Great for marketing campaigns, product development, and sales alignment. Fully editable and compatible with PowerPoint, Keynote, and Google Slides.


7 slides
Relationship Polices Infographic
Navigate the intricacies of interpersonal dynamics with our relationship policies infographic. Adorned in the purity of white, complemented by shades of understanding blue and harmonious green, this template elucidates the principles and boundaries that shape healthy relationships. Detailed with relevant infographics, symbolic icons, and illustrative image placeholders, it provides a visual roadmap to successful connections and interactions. Impeccably designed for Powerpoint, Keynote, or Google Slides. An essential tool for HR professionals, relationship counselors, team leaders, or any organization emphasizing healthy interpersonal dynamics. Foster connections; let each slide guide the way to relationship excellence.


26 slides
Entrepreneurship in the Digital Age Presentation Template
Navigate the evolving world of business with this modern and engaging presentation template focused on entrepreneurship in the digital age. Featuring sleek layouts, dynamic infographics, and data-driven visuals, this template is perfect for exploring digital strategies, startup growth, and innovation trends. Whether you're presenting business plans, sharing insights on market dynamics, or showcasing case studies, each slide is fully customizable to suit your needs. The professional yet creative design ensures your message stands out, inspiring your audience to embrace the opportunities of the digital era. Fully compatible with PowerPoint, Keynote, and Google Slides, this template is an essential tool for impactful and compelling presentations.


6 slides
Demographic Data Analysis Presentation
The "Demographic Data Analysis" presentation effectively visualizes demographic splits using a simple yet engaging pie chart. The template features a clean layout with distinct sections labeled for different demographic metrics, represented by the percentage splits of 35% and 65%. Each section includes placeholder text for inserting detailed insights, making it an excellent tool for presentations that need to communicate demographic data clearly and attractively. The design is versatile and can be adapted for various analysis needs in business or research contexts.


6 slides
External Business Factors PESTEL Model Presentation
Present your strategic analysis with clarity using this External Business Factors PESTEL Model Presentation. Designed to break down Political, Economic, Social, Technological, Environmental, and Legal influences, this layout helps convey complex macro-environmental insights in a simple, color-coded visual format. Ideal for consultants, business analysts, and corporate strategists. Fully editable in PowerPoint, Keynote, and Google Slides.


4 slides
Agricultural Business Strategy Presentation
Cultivate success in the field of agriculture with our dynamic Agricultural Business Strategy Presentation template. This visually appealing and easy-to-use template is perfect for showcasing innovative strategies that drive agricultural growth and efficiency. Each slide is thoughtfully designed to help you present crucial business insights and foster sustainable development in the farming sector. Ideal for agribusiness professionals seeking to make a meaningful impact, this template is fully compatible with PowerPoint, Keynote, and Google Slides, ensuring a smooth presentation experience across various platforms.


6 slides
Sales Strategy 30-60-90 Day Plan Presentation
Drive sales success with this structured 30-60-90 day strategy template! Designed to help sales teams and professionals set clear objectives, track progress, and optimize performance, this layout ensures a smooth transition from planning to execution. Fully customizable and compatible with PowerPoint, Keynote, and Google Slides for seamless presentations.


6 slides
High-Performance Team Building Presentation
Boost team efficiency with the High-Performance Team Building presentation template. Designed to visualize team development stages, leadership strategies, and collaboration efforts, this template is perfect for managers, HR teams, and trainers. The pyramid and rocket-themed design illustrates goal progression, making it easy to track growth. Fully customizable and compatible with PowerPoint, Keynote, and Google Slides.


22 slides
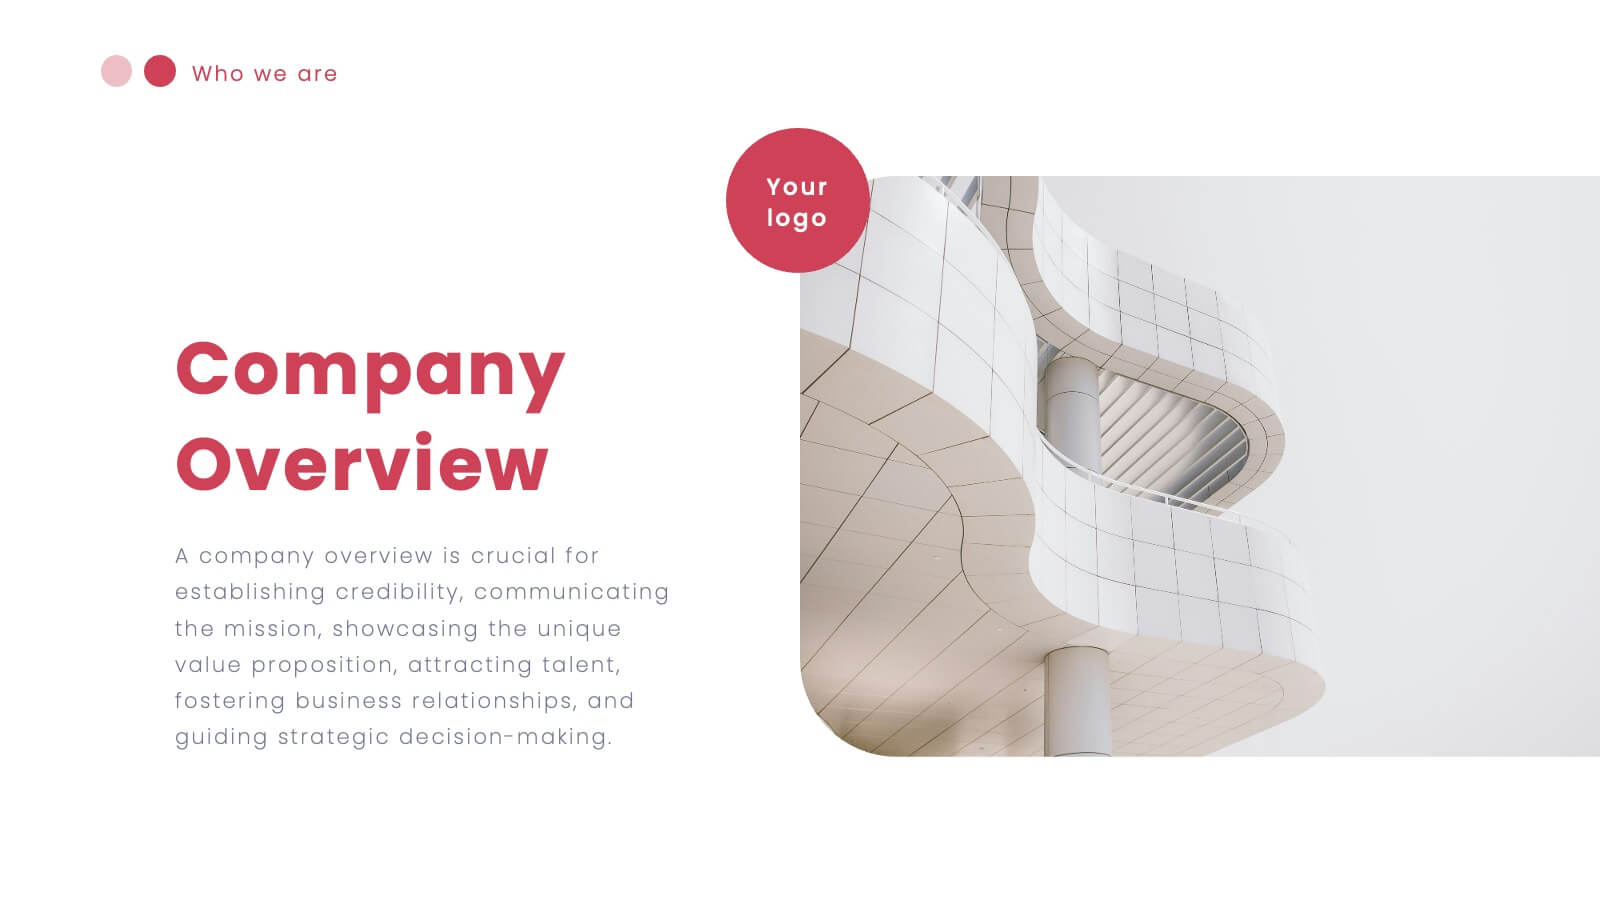
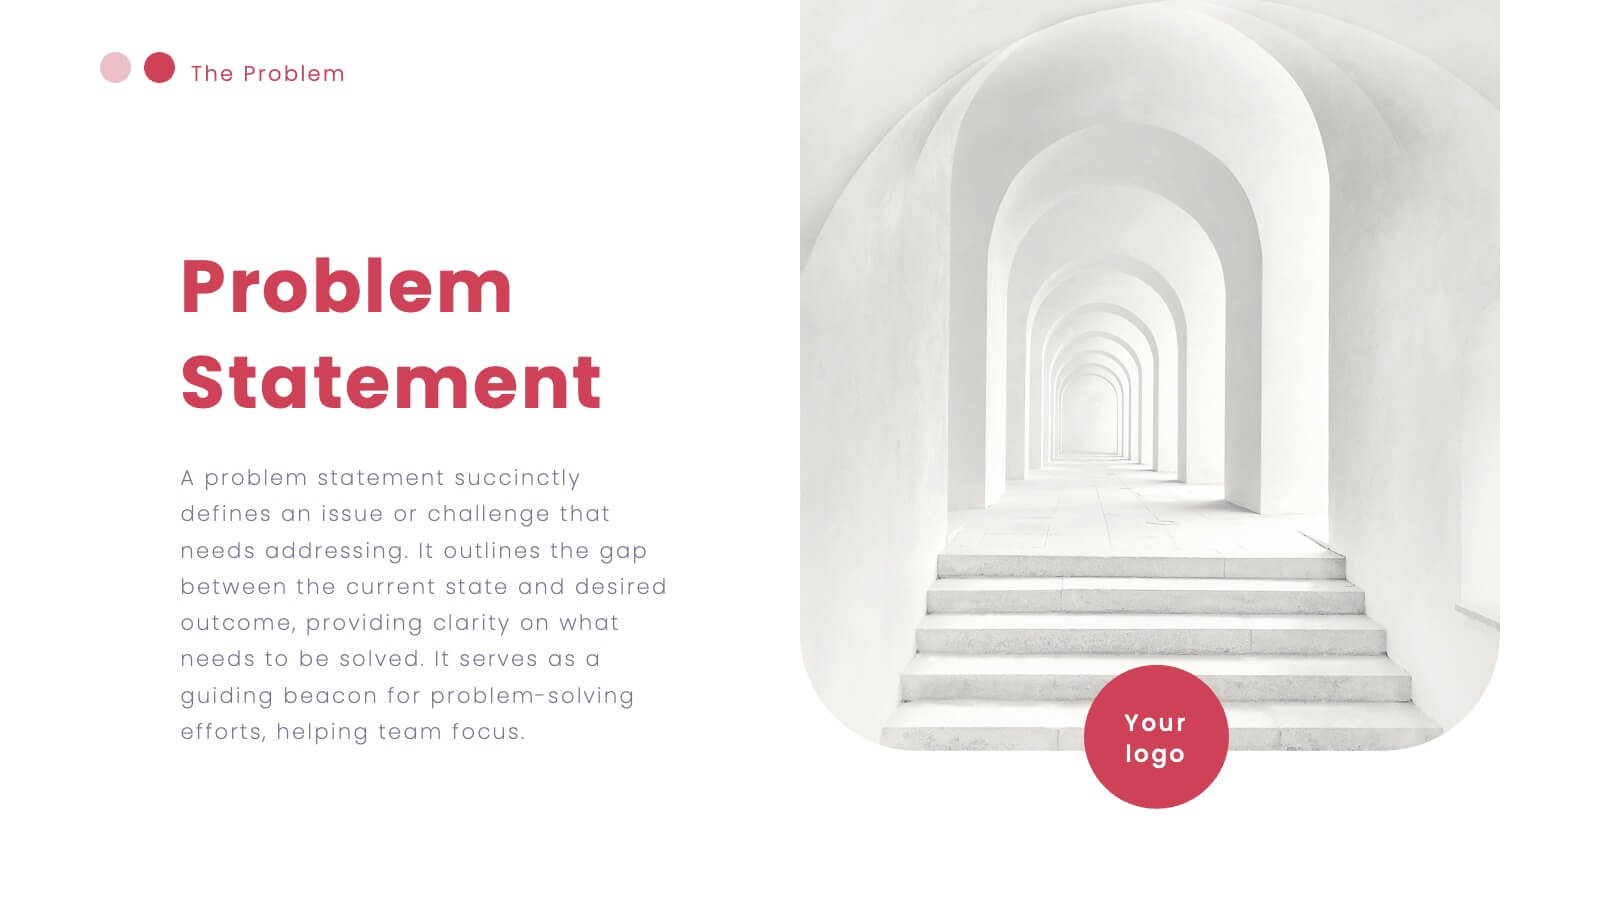
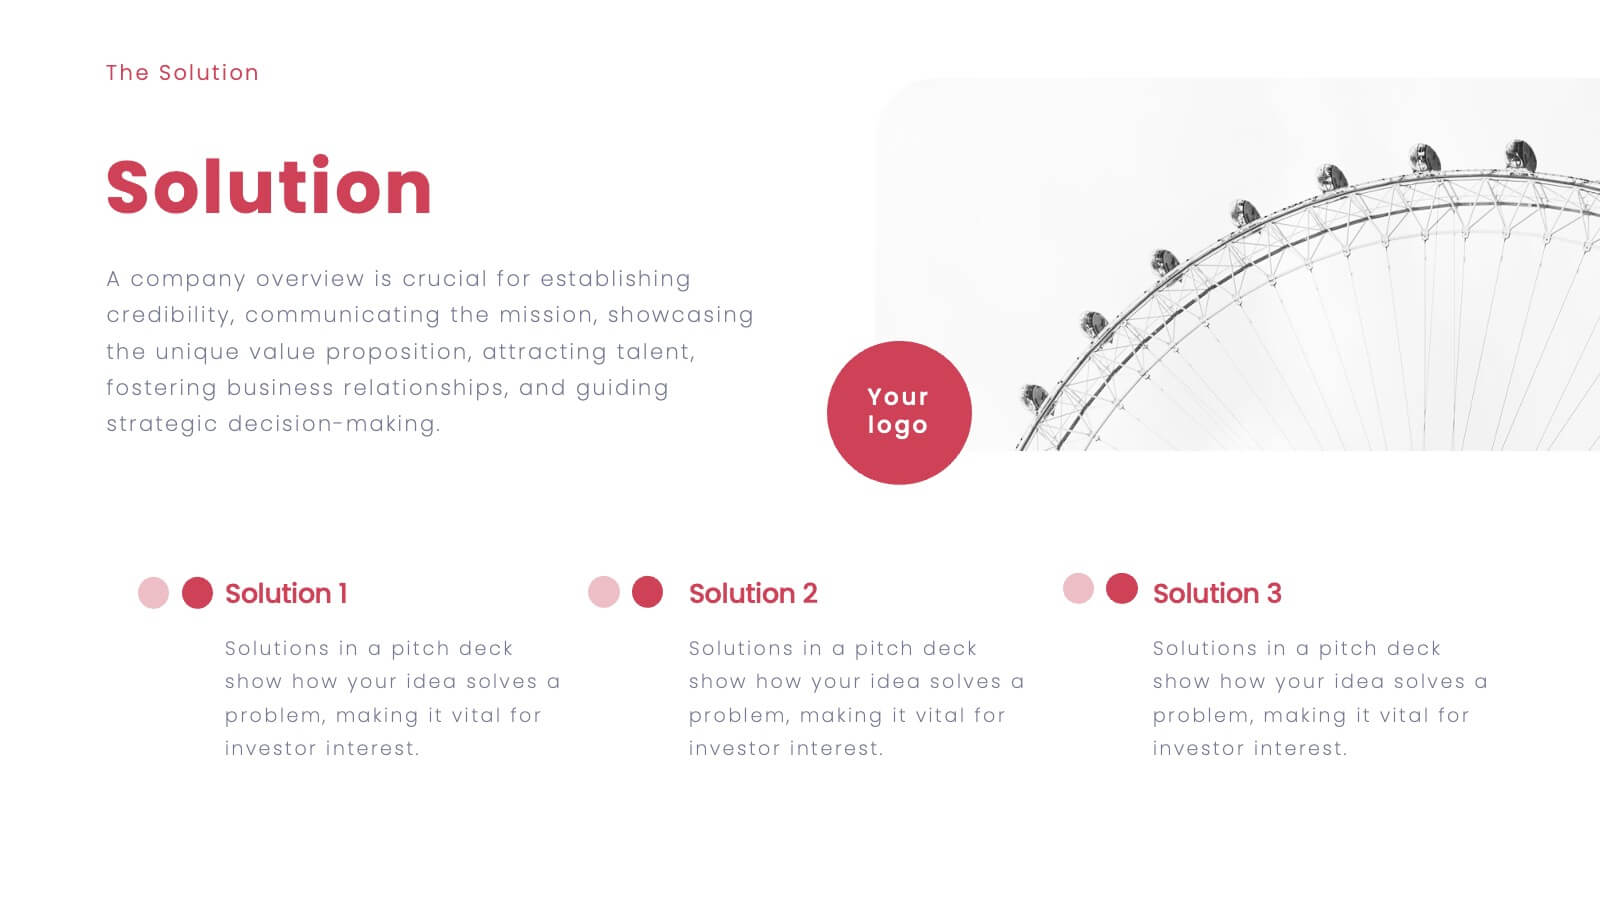
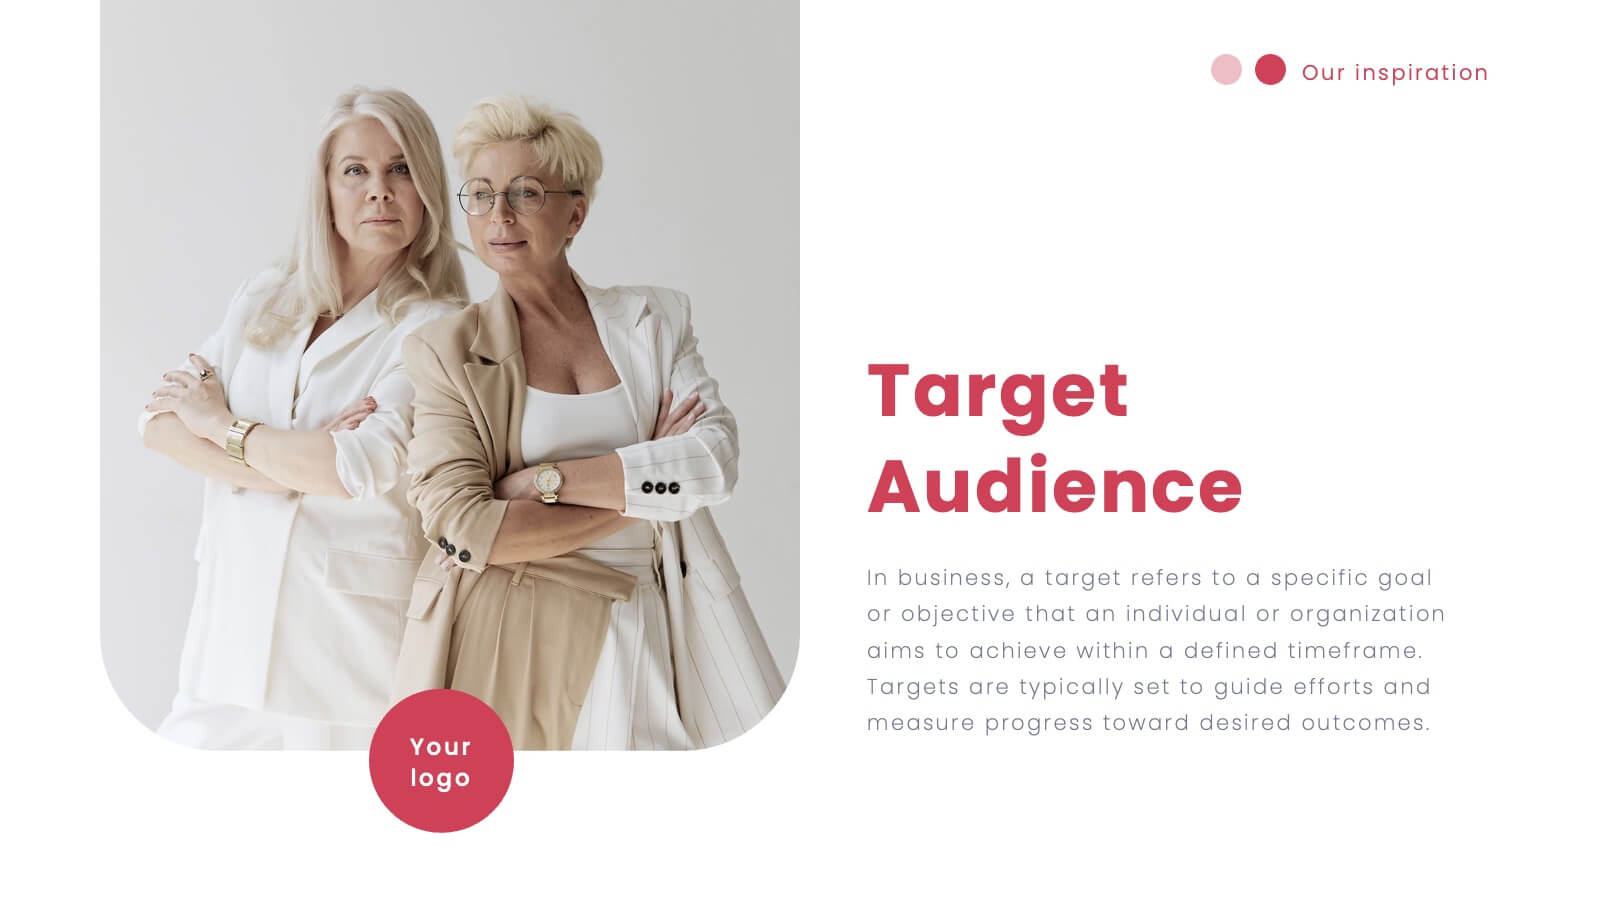
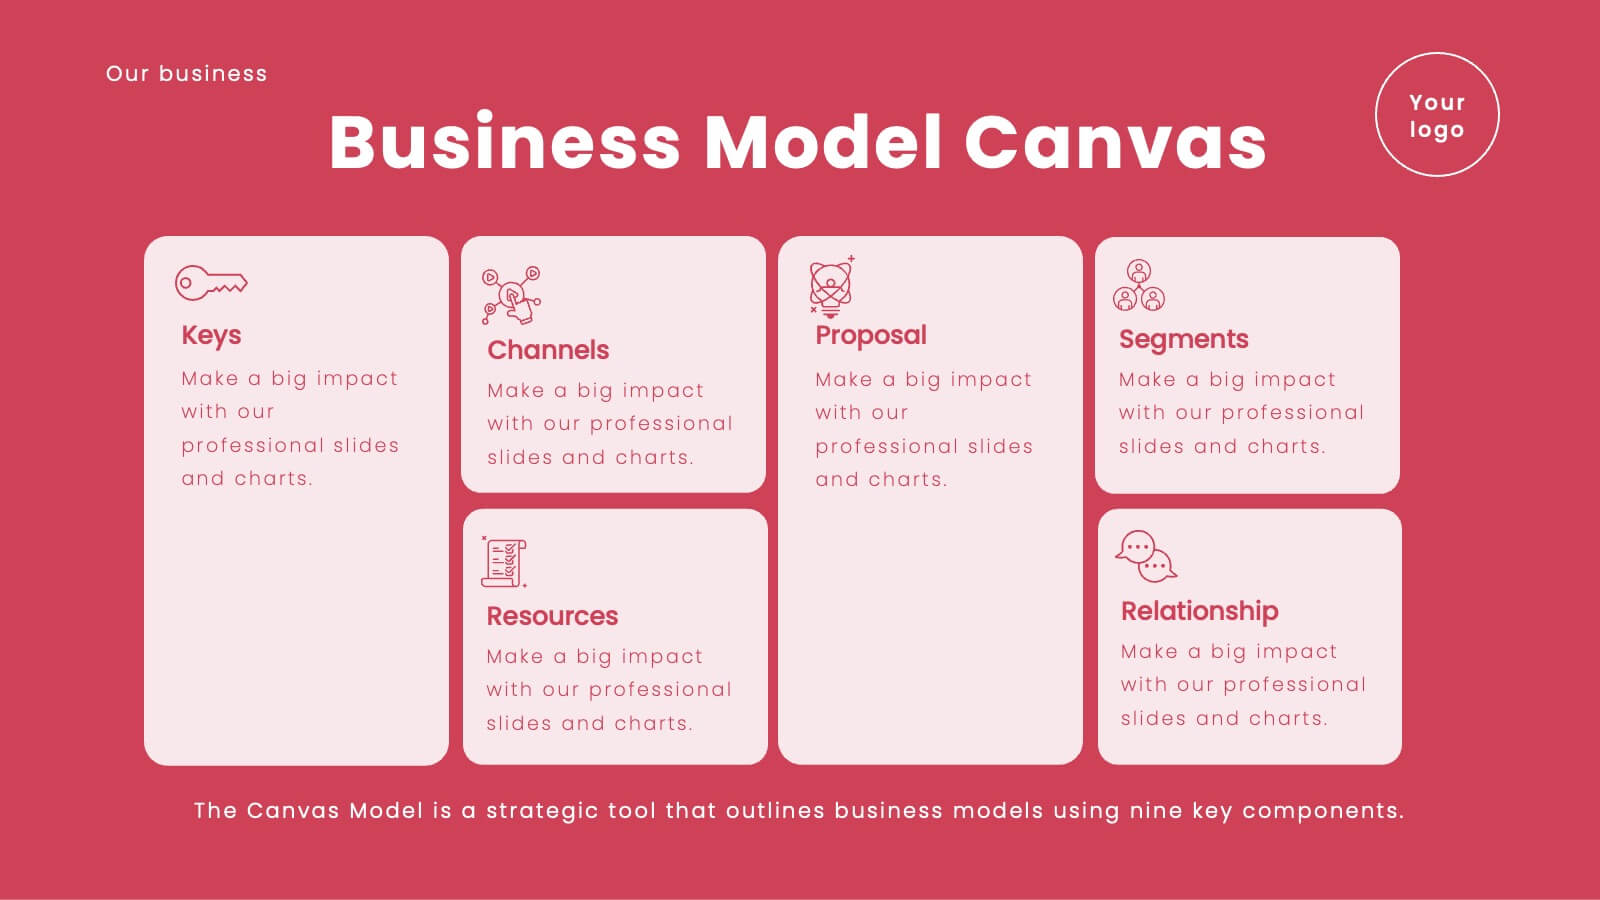
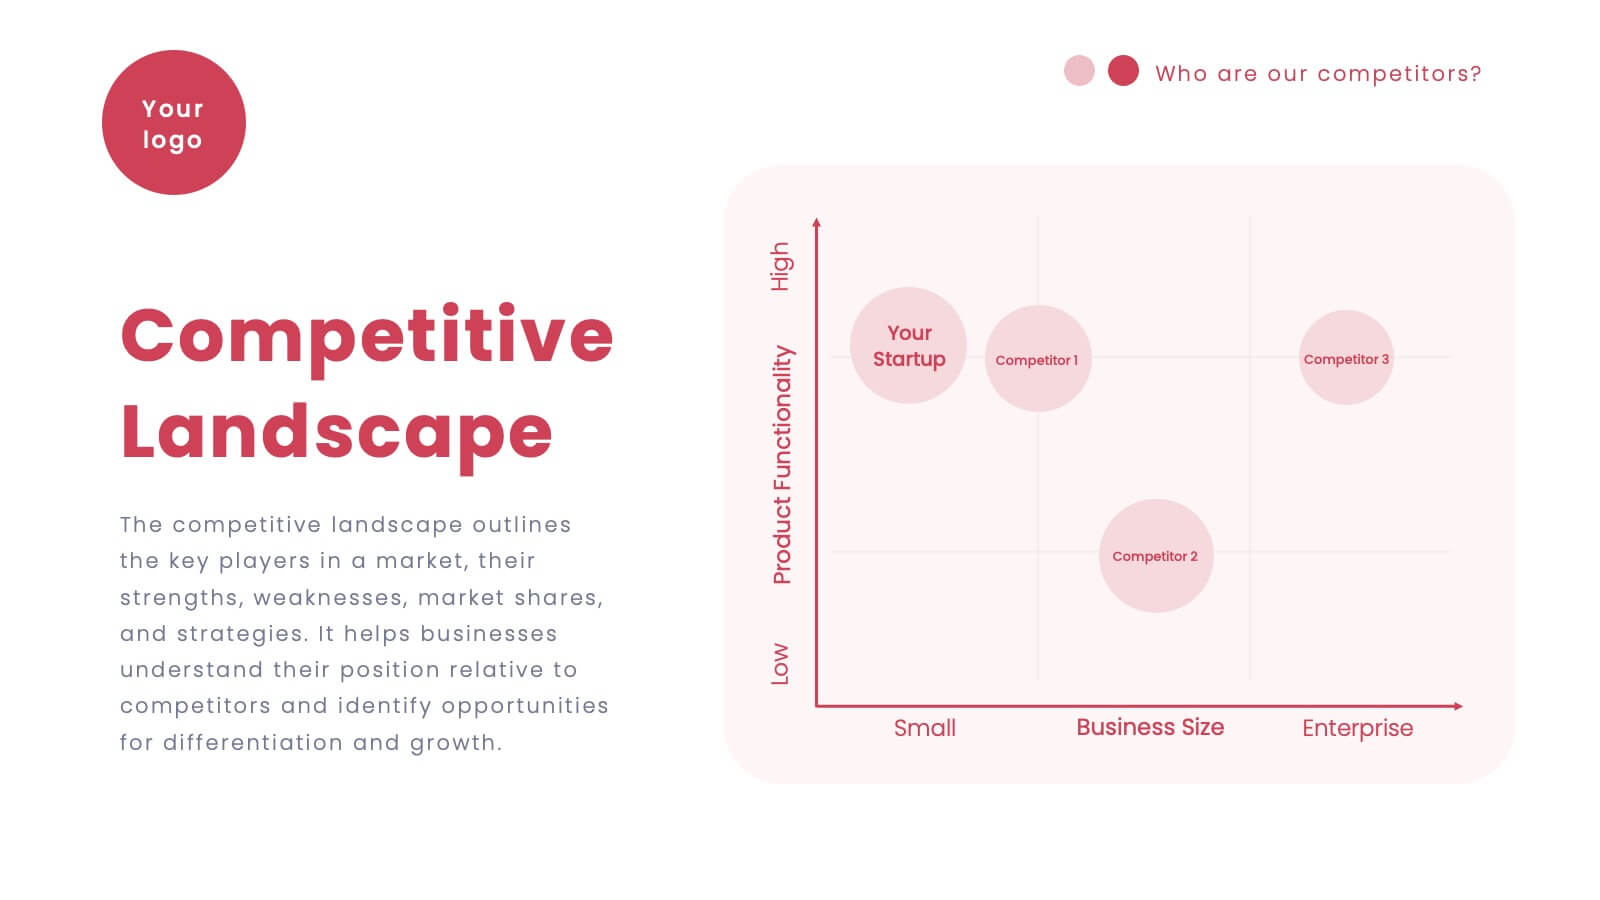
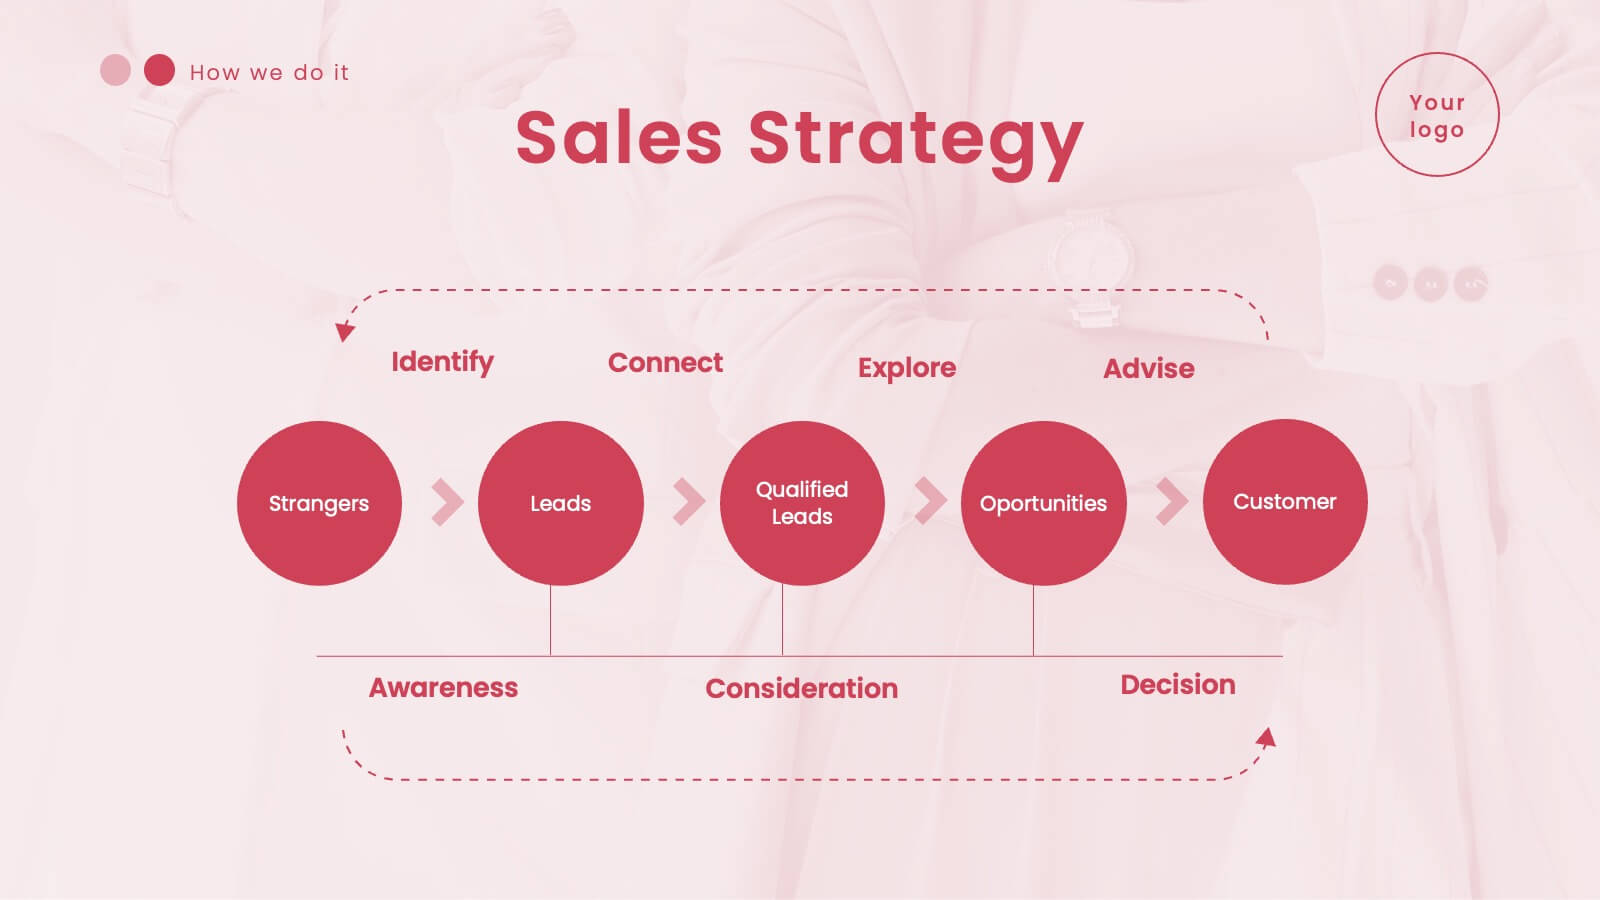
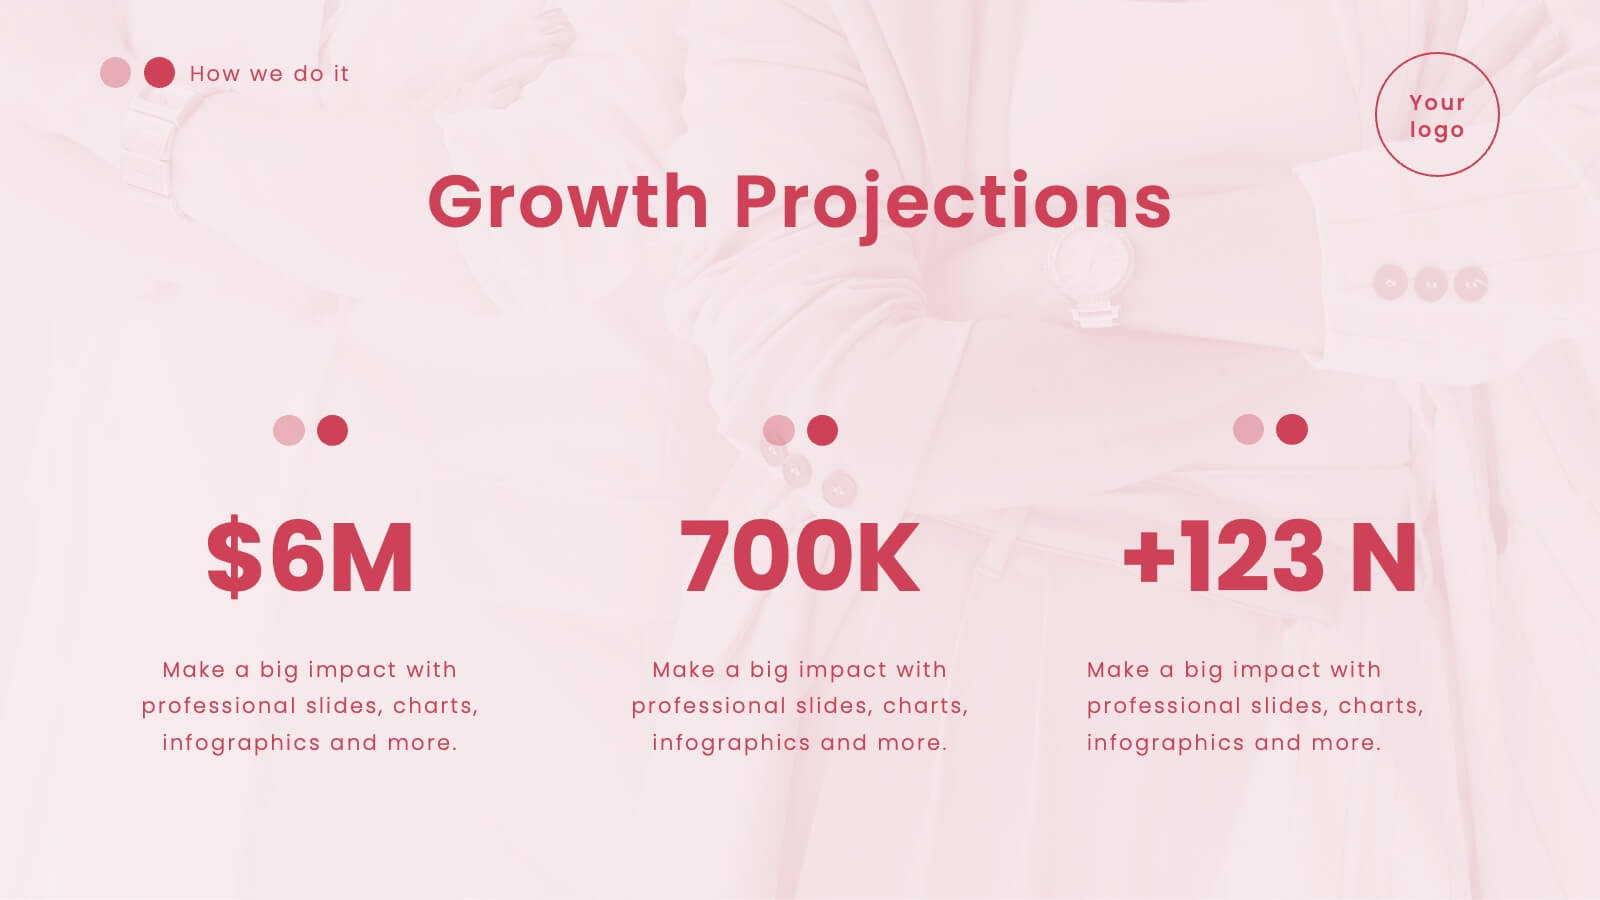
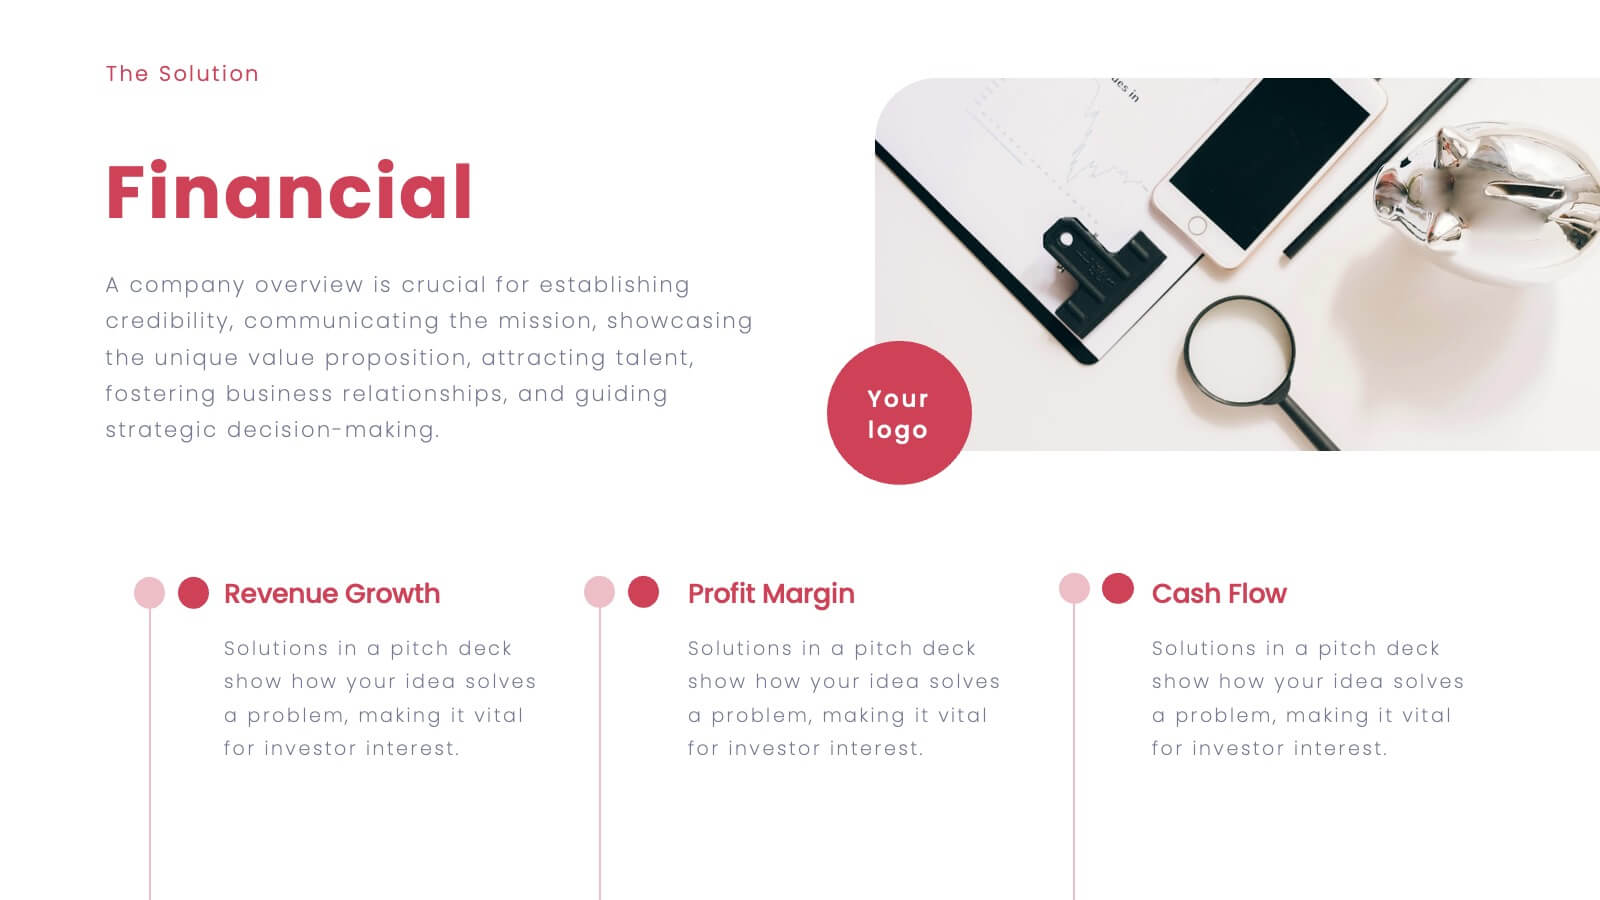
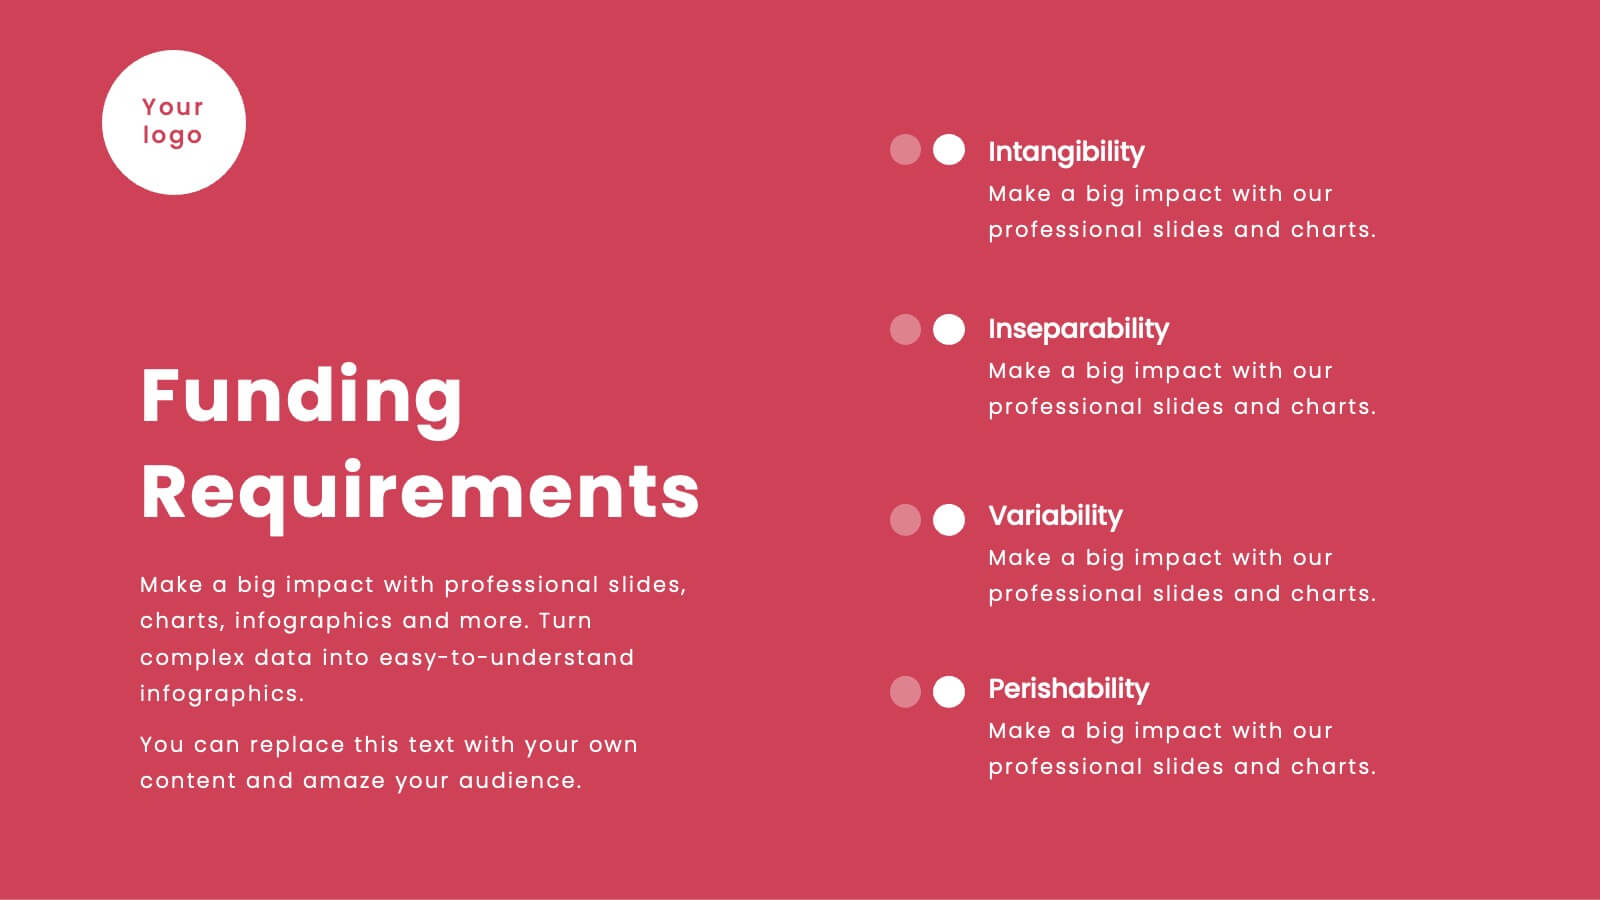
Vortex Startup Pitch Deck Presentation
Launch your ideas into action with this vibrant red pitch deck template, designed to captivate and inform potential investors. It covers everything from company overview to financials and market strategy, ensuring your vision is communicated effectively. Compatible with PowerPoint, Google Slides, and Keynote, this template is perfect for startups seeking to impress and engage.


4 slides
Product List Table for Quick Overview
Showcase product highlights at a glance with the Product List Table for Quick Overview Presentation. This sleek, column-based layout allows you to compare up to three product categories or service features side by side. Each section includes an icon, title, and space for three concise text rows—ideal for summarizing specifications, benefits, or pricing tiers. Fully editable in PowerPoint, Keynote, and Google Slides.


4 slides
Property Investment Pitch Deck Presentation
Impress investors with a sleek and confident presentation designed to highlight property opportunities and market growth. This professional layout helps you showcase financial insights, projections, and investment strategies with clarity and style. Fully customizable and compatible with PowerPoint, Keynote, and Google Slides for effortless editing and impactful delivery.


5 slides
Construction Equipment Infographics
Dive into the industrial world with our construction equipment infographics template. This collection, rich with vivid reds, greens, and purples, breaks down intricate machinery details into digestible visual content, perfect for professionals in the construction industry, equipment manufacturers, and trade school educators. Compatible with Powerpoint, Keynote, and Google Slides. The creative, vertical style packed with high-quality graphics and icons, facilitates the easy assembly of data and processes, enhancing presentations, or educational content. Equip yourself to convey the dynamism of construction equipment through this visually compelling tool.