


Features
- 6 Unique slides
- Fully editable and easy to edit in Microsoft Powerpoint, Keynote and Google Slides
- 16:9 widescreen layout
- Clean and professional designs
- Export to JPG, PDF or send by email


Do you have any questions?
Recommend


6 slides
Matrix Diagram
A matrix diagram, also known as a matrix chart, is a visual tool used to analyze and organize complex information by displaying it in a matrix format. This infographic template provides a visual framework for analyzing complex information, and improving understanding of relationships between different elements or factors. This template allows users to effectively communicate complex relationships and categorize information using a matrix format. This is perfect to use in a wide range of contexts, including project management, problem-solving, decision-making, strategic planning, and data analysis.


6 slides
3D Diagram Slide Presentation
Bring your ideas to life with this modern 3D visual layout that adds depth and clarity to any concept. Ideal for breaking down complex information into four connected sections, it enhances understanding through visual hierarchy. Fully customizable and compatible with PowerPoint, Keynote, and Google Slides for effortless use.


4 slides
Medical Research and Healthcare Trends Presentation
Stay ahead in the healthcare industry with the Medical Research and Healthcare Trends Presentation template. This structured layout highlights key statistics, research insights, and emerging trends in the medical field. Ideal for healthcare professionals, analysts, and policymakers, this fully customizable template is compatible with PowerPoint, Keynote, and Google Slides.


6 slides
SEO Strategy and Keyword Mapping Presentation
Streamline your digital strategy with this SEO mapping layout that blends structure and simplicity. Designed to help visualize keyword clusters, content priorities, and search intent stages, this infographic makes complex strategies feel approachable. It’s easy to edit and perfect for presentations in PowerPoint, Keynote, or Google Slides.


21 slides
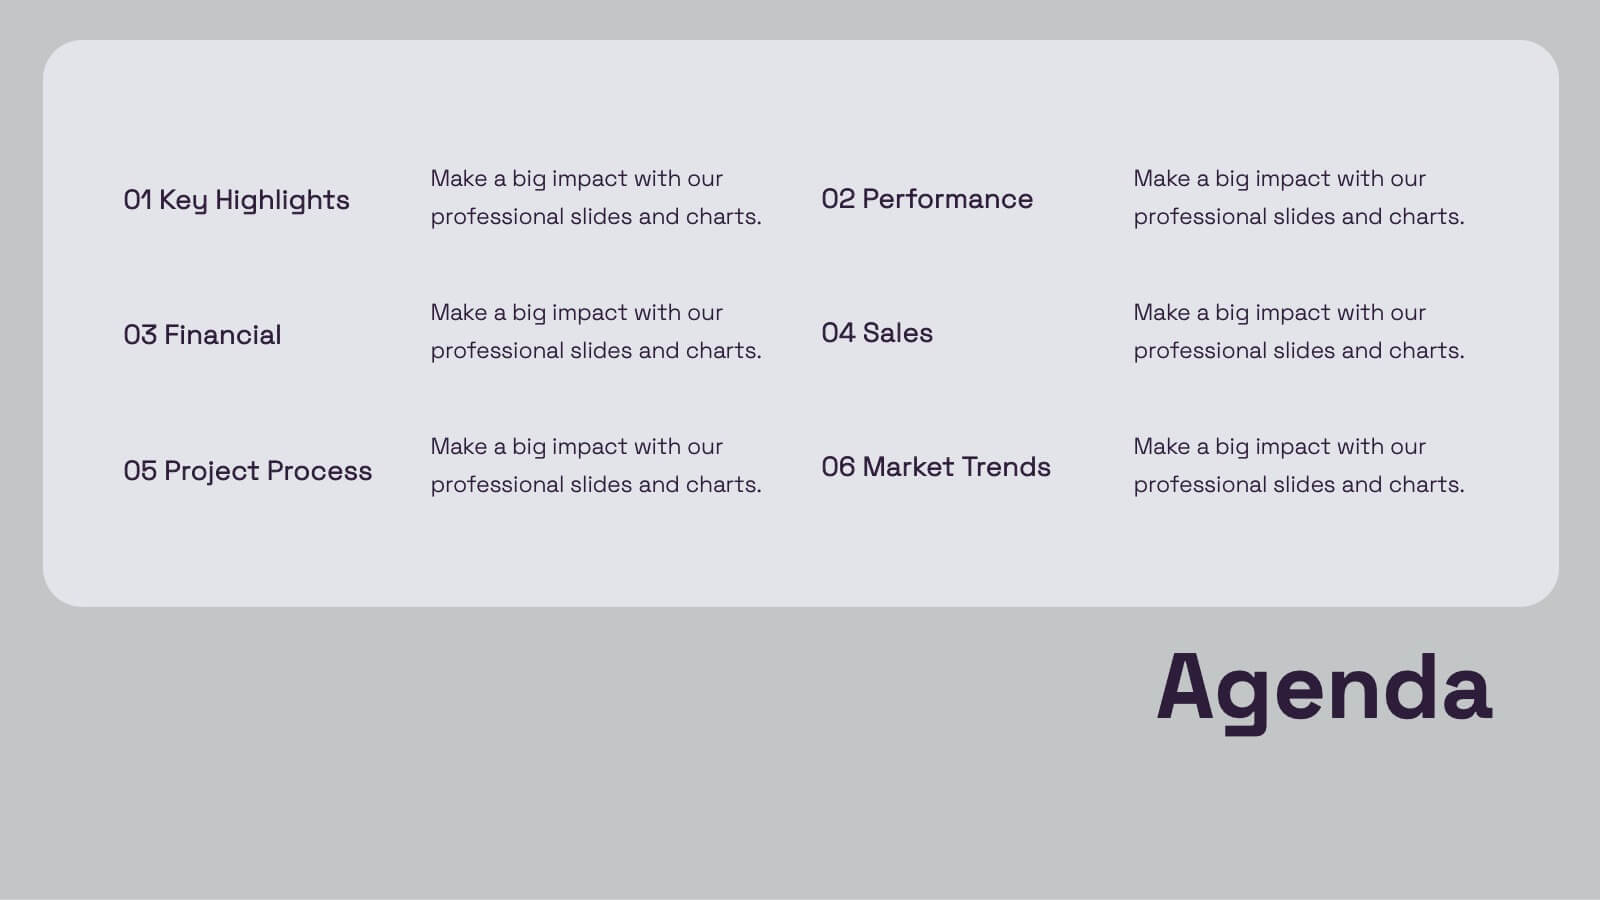
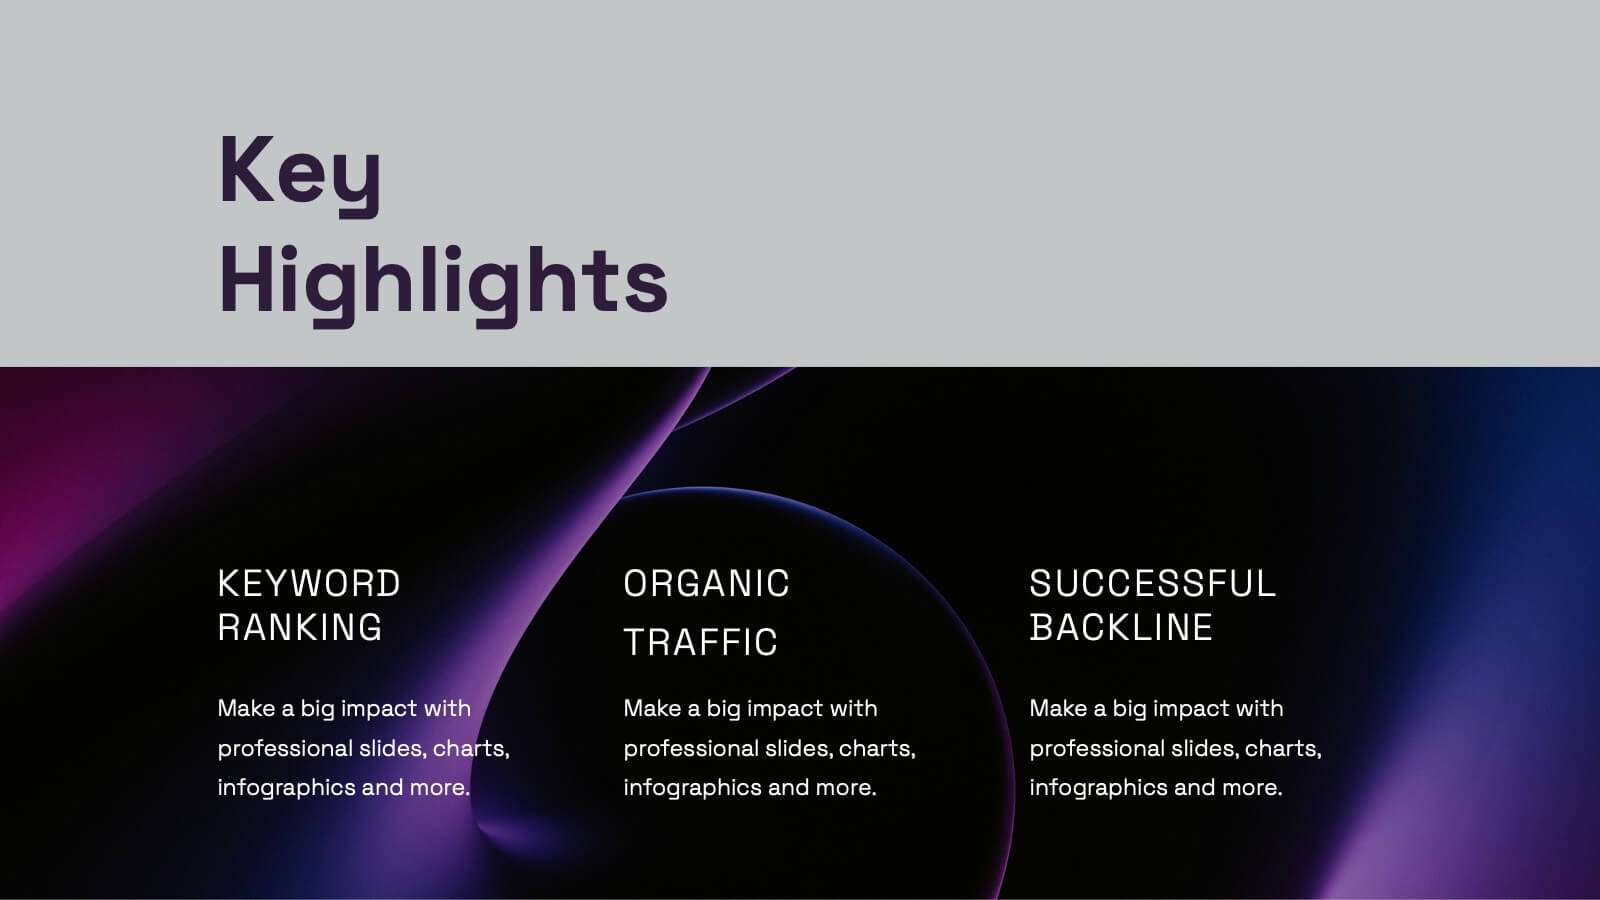
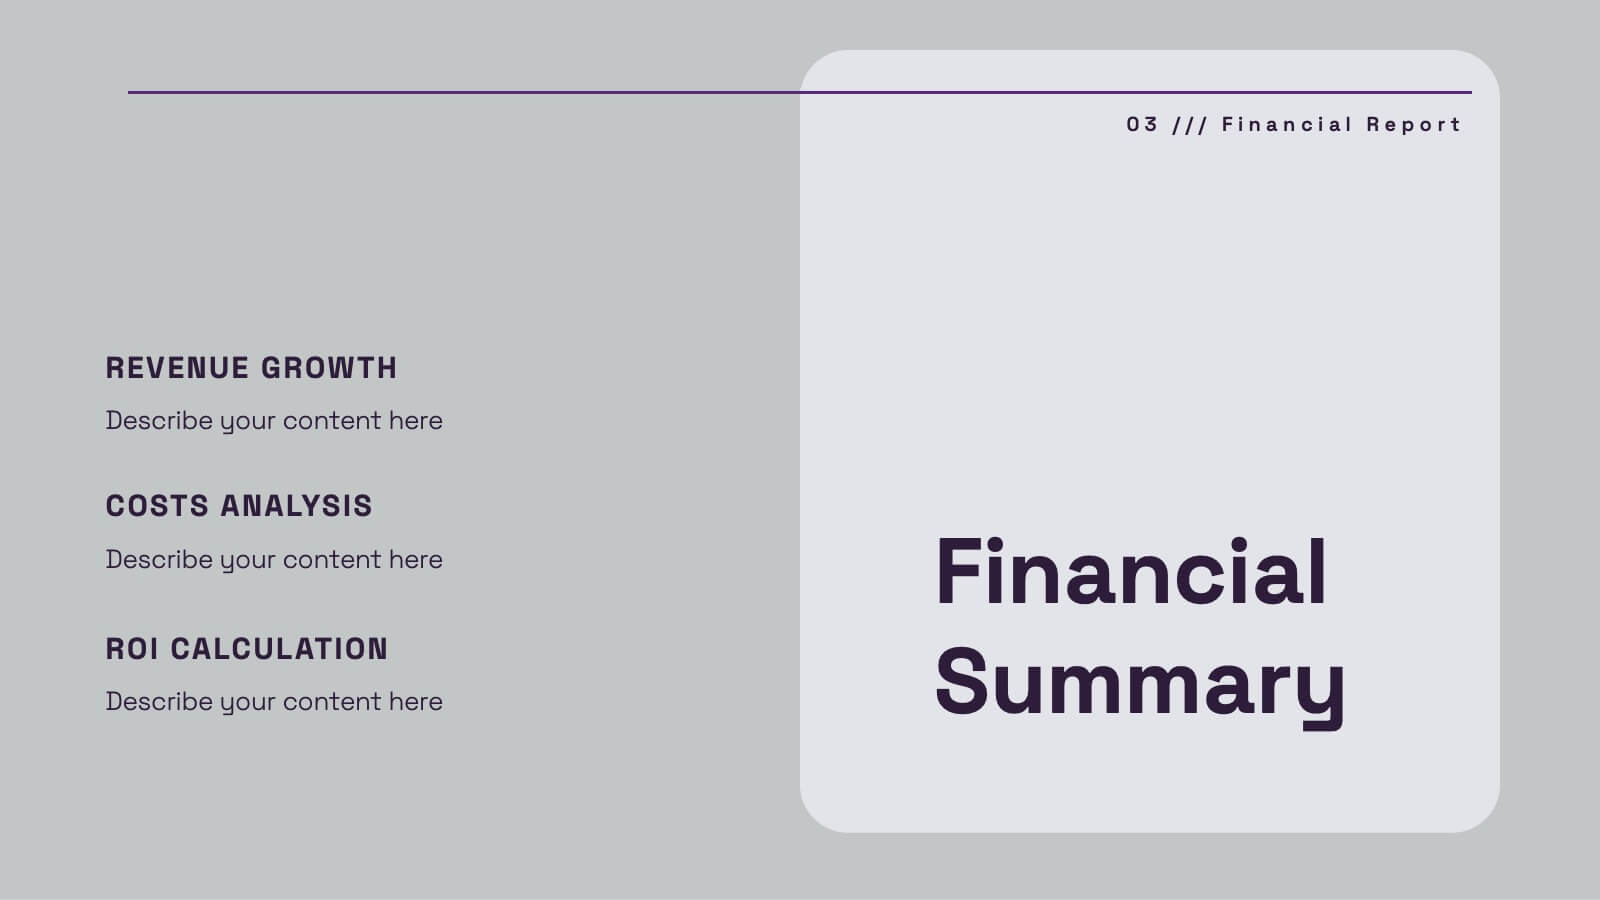
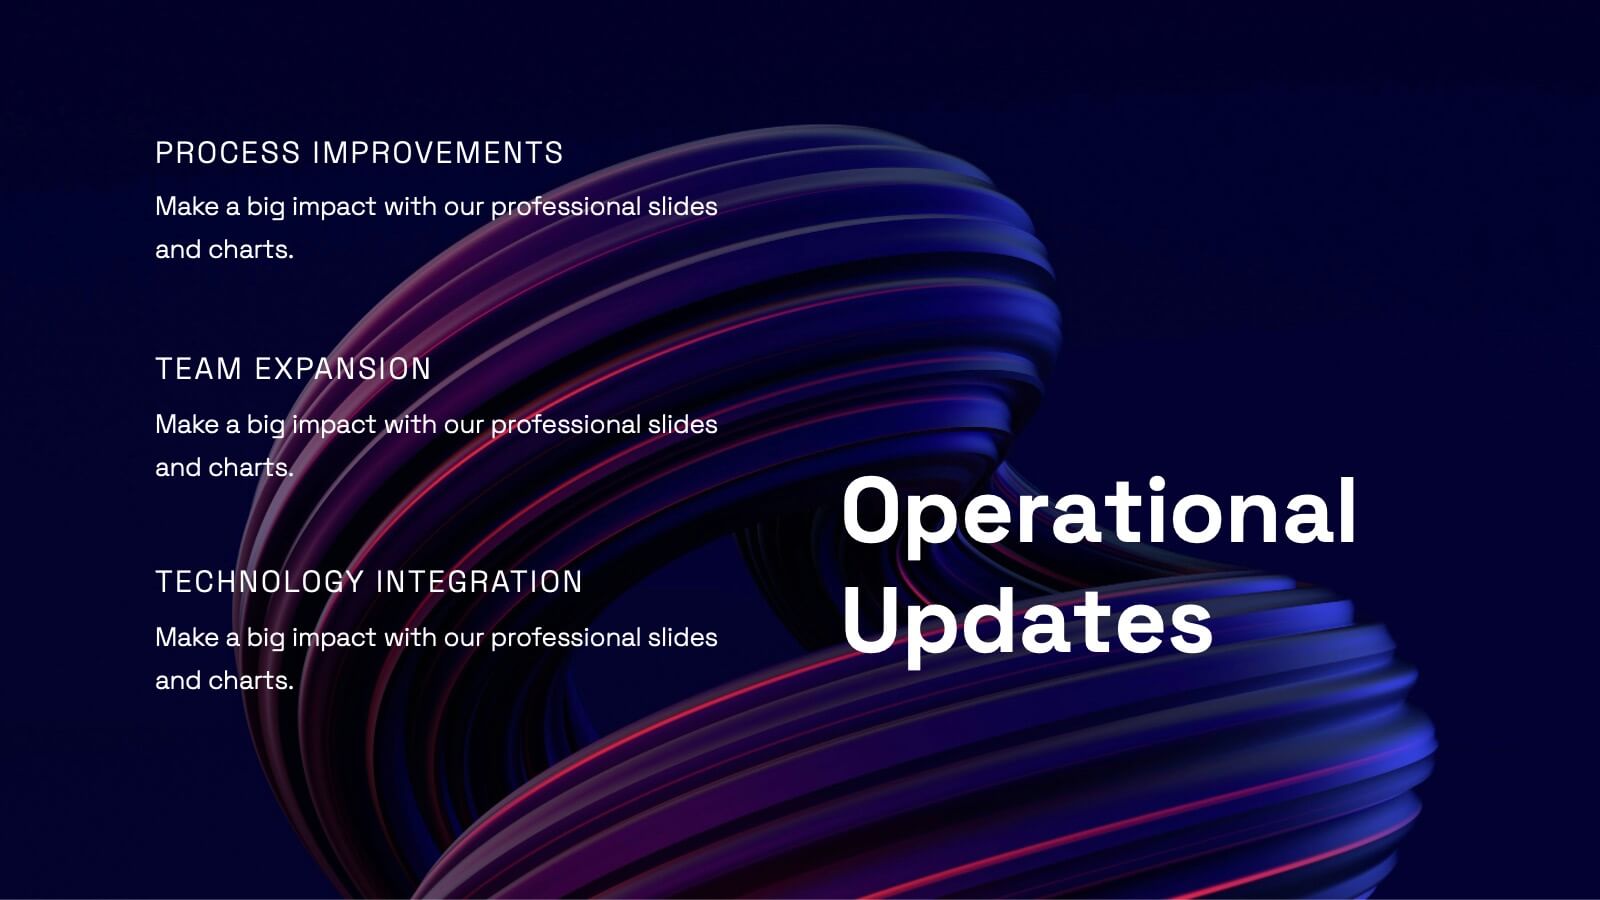
Uplift Financial Report Presentation
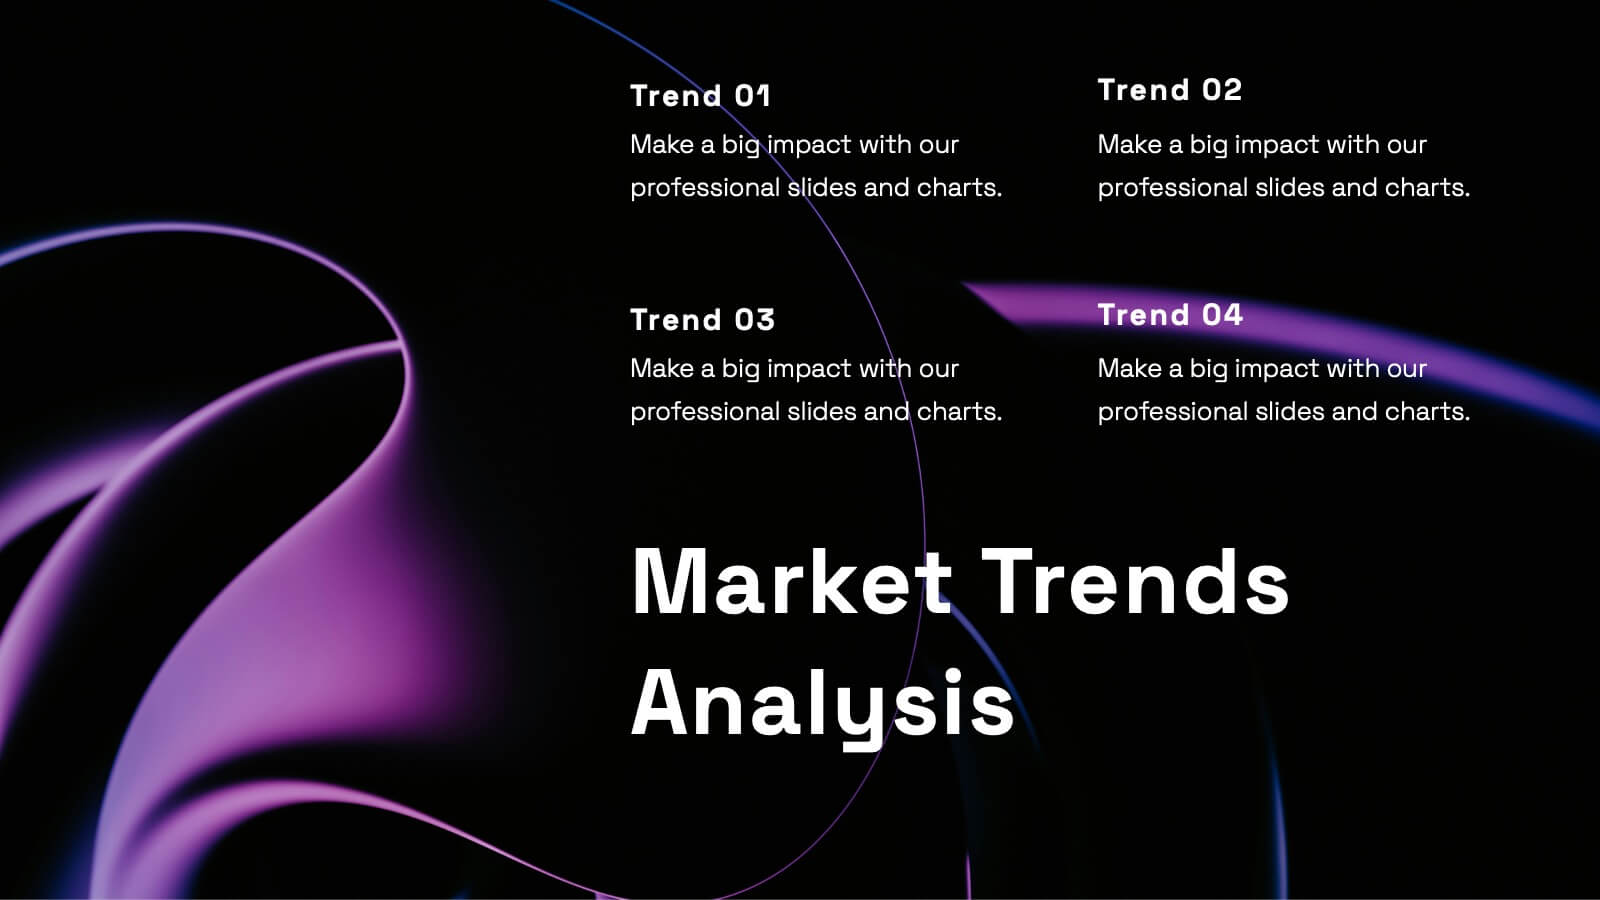
Present your financial or business report with this sleek and modern presentation template! It includes essential sections such as performance metrics, financial summaries, project progress, and market trends analysis, ensuring a comprehensive overview. Whether you're discussing key achievements or competitor insights, this template is perfect for delivering a professional and polished report. Compatible with PowerPoint, Keynote, and Google Slides for easy use and customization.


5 slides
Employee Training Needs Presentation
Spark growth and strengthen team performance with a clear visual guide that highlights skill gaps, development priorities, and learning pathways. This presentation helps HR and managers map essential competencies and plan impactful training programs. Perfect for performance reviews and workforce planning. Fully compatible with PowerPoint, Keynote, and Google Slides.


5 slides
Compliance and Legal Affairs Presentation
Enforce clarity with the Compliance and Legal Affairs Presentation. Featuring a segmented gavel icon, this layout is ideal for outlining legal processes, compliance stages, and regulatory strategies. Each section is clearly labeled for structured storytelling. Fully editable in PowerPoint, Keynote, and Google Slides.


6 slides
Business Security Compliance Presentation
Visualize your security framework with this clear and modern infographic layout. This slide is ideal for presenting compliance steps, risk assessments, or regulatory requirements, featuring a shield-centered hub with 5 editable sections. Customize easily in PowerPoint, Keynote, or Google Slides.


26 slides
Construction Engineering Dark Presentation
Elevate your project narratives with our construction engineering dark presentation template, tailored specifically for industry professionals who desire clarity and precision. This template, steeped in dark shades complemented by stark orange and green accents, offers a sophisticated canvas for your plans. It's an essential asset for construction engineers and contractors seeking to outline project scopes, or innovative engineering solutions. Compatible with Powerpoint, Keynote, and Google Slides. Included are purposeful graphics and technical icons, all arranged to underscore your presentation's professionalism and comprehensive nature.


4 slides
Onboarding 30-60-90 Roadmap Presentation
Simplify your onboarding strategy with the Onboarding 30–60–90 Roadmap Presentation. This clean, visual layout breaks down employee integration into three distinct timeframes—30, 60, and 90 days—each with space for goals, tasks, or milestones. Perfect for HR teams, managers, and trainers. Fully editable in Canva, PowerPoint, Keynote, and Google Slides.


10 slides
Strategic Idea Clustering Bubble Map
Visualize and organize your concepts with the Strategic Idea Clustering Bubble Map Presentation. This dynamic bubble diagram is ideal for brainstorming sessions, strategic planning, and idea grouping. Each node highlights key points around a central concept. Fully customizable in PowerPoint, Keynote, and Google Slides—perfect for teams, consultants, and innovators.


5 slides
Real Estate Requirements Infographics
Real Estate Infographics can be an effective way to convey information about the real estate industry in a visually appealing and simple manner. This infographic template is perfect to showcase market trends, statistics, and data in a clear and concise way, making it easier for your audience to interpret the information. As well as educating and informing your clients, investors, and other stakeholders about various aspects of the real estate market. Overall, these infographic will help you communicate information about the real estate industry and help your clients make informed decisions about buying, selling, or investing in property.


4 slides
Organizational Hierarchy Diagram Presentation
Clearly map out your company’s structure with this modern organizational hierarchy slide. Designed for clarity, it displays multiple team roles and reporting lines using intuitive icons and connector lines. Ideal for onboarding, strategy, or HR decks. Fully customizable in Canva, PowerPoint, or Google Slides for seamless integration into any presentation.


7 slides
Title Infographic
These presentation slides showcase a variety of title designs, each uniquely styled to suit different thematic contexts, using vibrant colors and dynamic typography to captivate and engage audiences. The designs are exceptionally versatile, making them suitable for a wide range of professional settings, including marketing, design, business strategy, and corporate overviews. Each slide is thoughtfully crafted to introduce sections, highlight key concepts, or set the stage for in-depth discussions, ensuring that every part of the presentation connects with the audience effectively. The strategic use of elements such as color blocks, minimalist layouts, and bold text helps in emphasizing the core message, making these slides an ideal choice for presenters looking to make an impactful introduction or to clearly delineate sections within their presentations.


7 slides
SCRUM Master Infographic Presentation
A Scrum infographic provides an overview of all the key components of the Scrum framework and helps teams and individuals understand this powerful agile methodology. This Infographic template is fully editable and can be easily customized to reflect your business, company or organization. It’s a great way to present your ideas in a clear and efficient manner. Full of charts and diagrams, this template creates an impactful visual effect. The blue color scheme will help create a fresh look in your presentations. This template is designed for use in Powerpoint, Google Sheets or Keynote.


6 slides
Business Success Case Study
Showcase your brand's impact with this clean, image-forward case study slide. Designed for storytelling, it outlines the Problem, Solution, and Approach alongside a product image—perfect for client wins, pitch decks, and brand storytelling. Fully customizable in PowerPoint, Keynote, and Google Slides.


4 slides
Sales Funnel Journey Mapping Presentation
Visualize your customer conversion process with the Sales Funnel Journey Mapping Presentation. This slide helps you break down key touchpoints from awareness to decision, ideal for marketing strategies, lead analysis, or CRM reporting. Fully editable in PowerPoint, Canva, and Google Slides for easy customization.