


Features
- 6 Unique slides
- Fully editable and easy to edit in Microsoft Powerpoint, Keynote and Google Slides
- 16:9 widescreen layout
- Clean and professional designs
- Export to JPG, PDF or send by email


Do you have any questions?
Recommend


26 slides
Remote Work Strategies Presentation
Enhance your team's flexibility with our Remote Work Strategies presentation template, designed for use with PowerPoint, Keynote, and Google Slides. This template is an invaluable asset for team leaders, HR professionals, and business consultants dedicated to cultivating a productive remote work culture. Our template is tailored to provide an in-depth analysis of remote work best practices, offering slides that cover essential strategies for communication, collaboration, and project management in a virtual environment. It also includes insights on setting up a successful home office, maintaining work-life balance, and leveraging technology for seamless remote operations. With customizable elements, you can illustrate the advantages of remote work, share success stories, and provide actionable tips to maximize team efficiency from afar. This template is SEO-optimized to ensure your presentation reaches those seeking to optimize their remote work operations and foster a thriving digital workplace.


4 slides
30 60 90 Day Plan Goals Presentation
Set your roadmap in motion with a clean, visual timeline that makes each milestone easy to follow and present with confidence. This presentation helps you outline priorities, track progress, and communicate clear goals for the first three months. Fully editable and compatible with PowerPoint, Keynote, and Google Slides.


21 slides
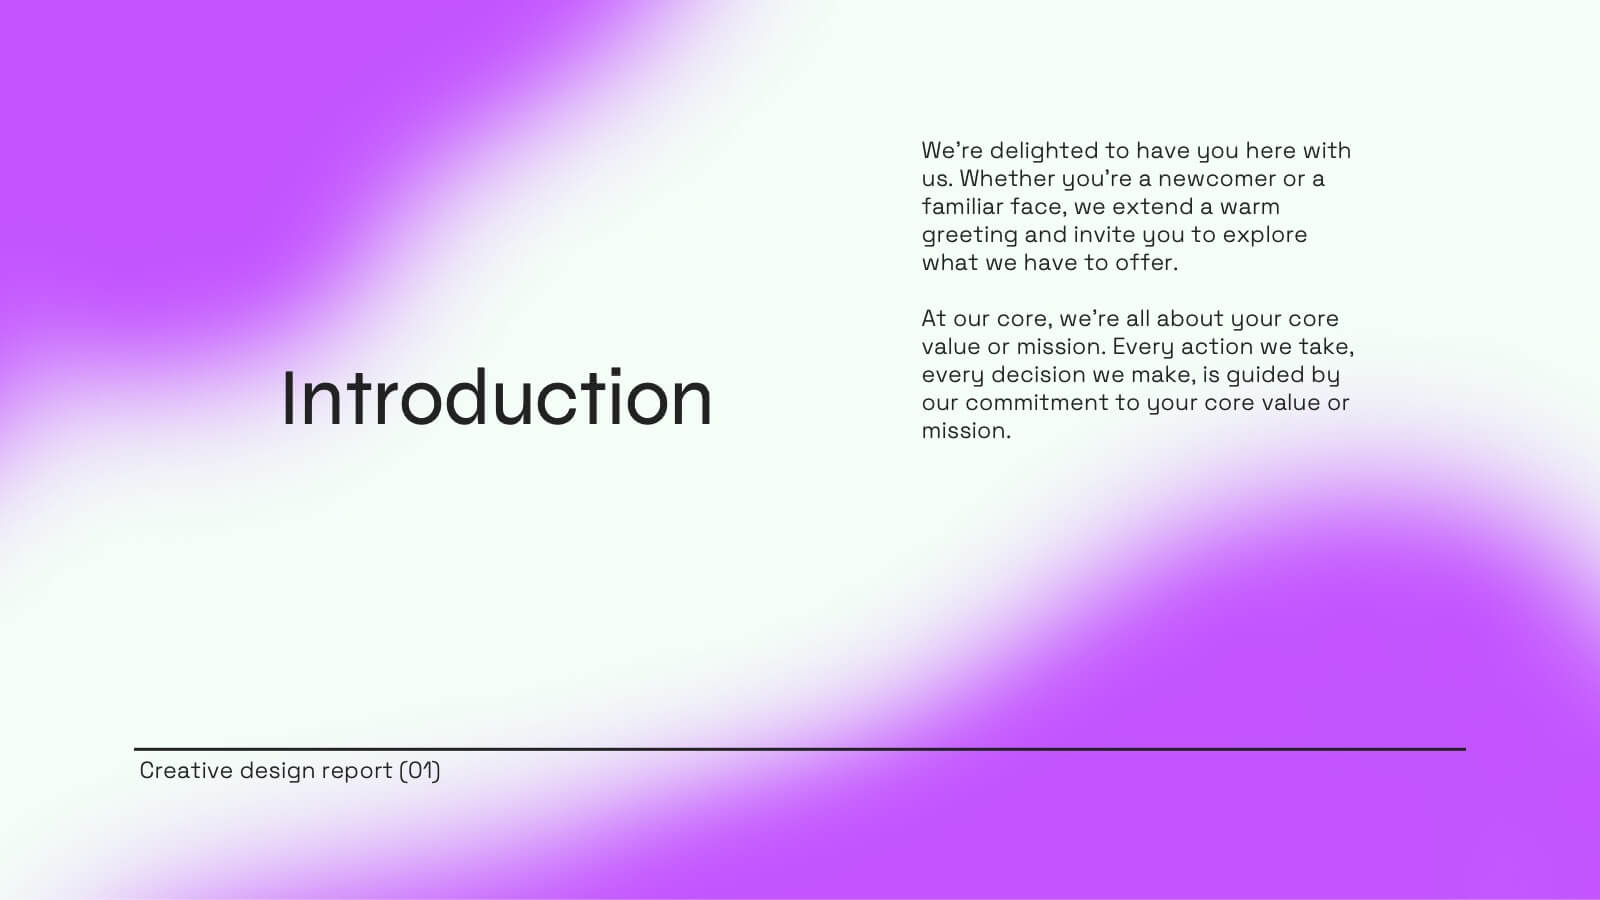
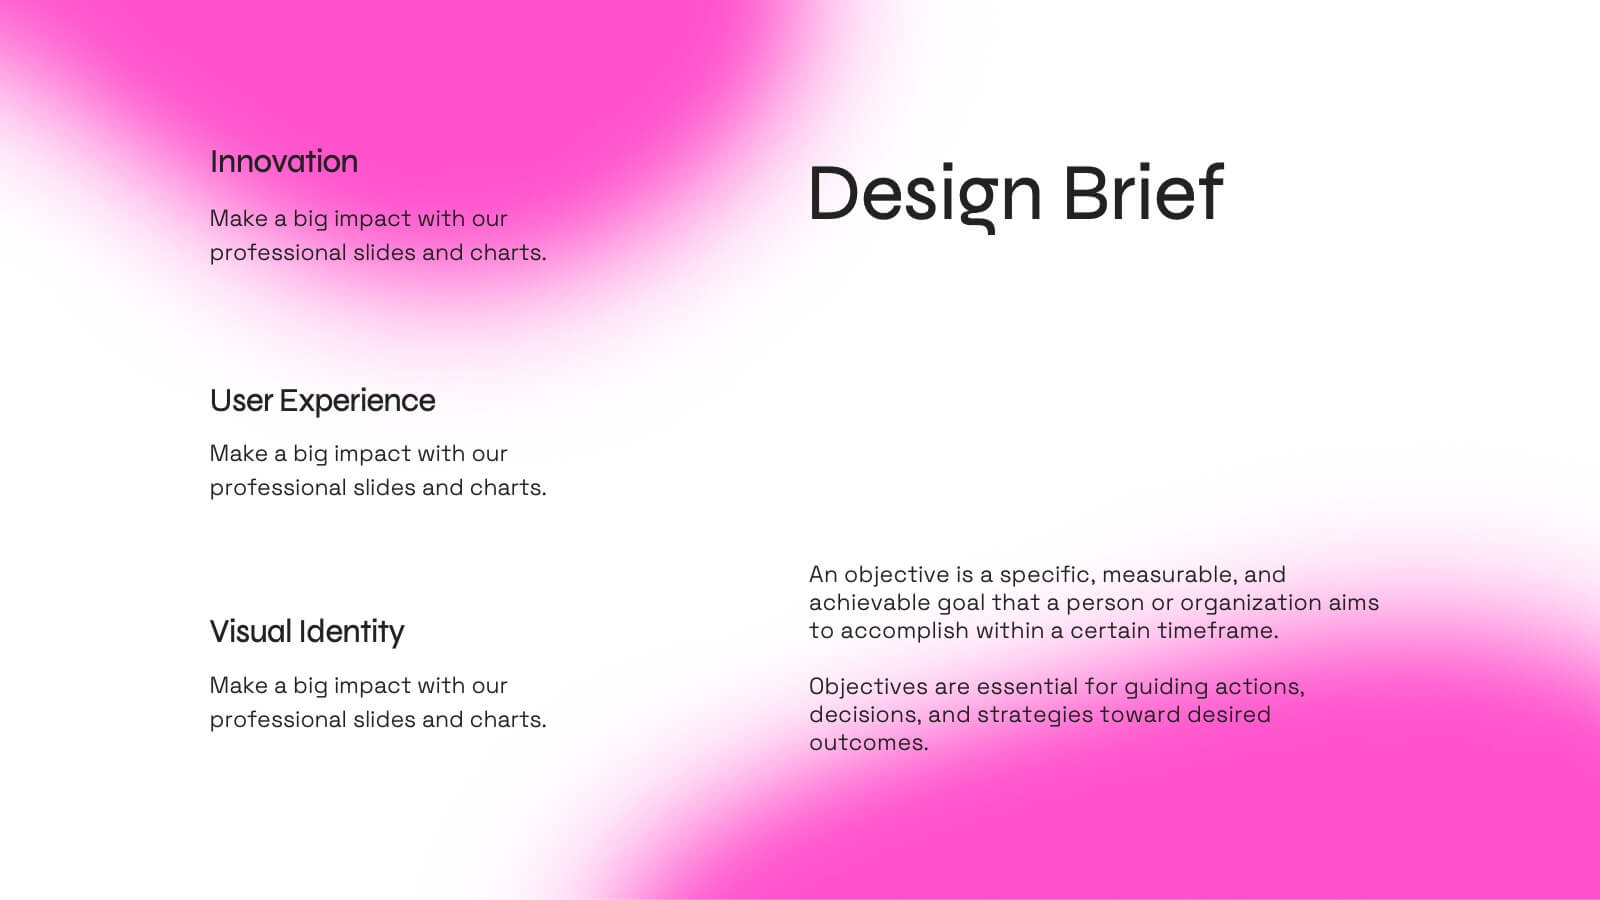
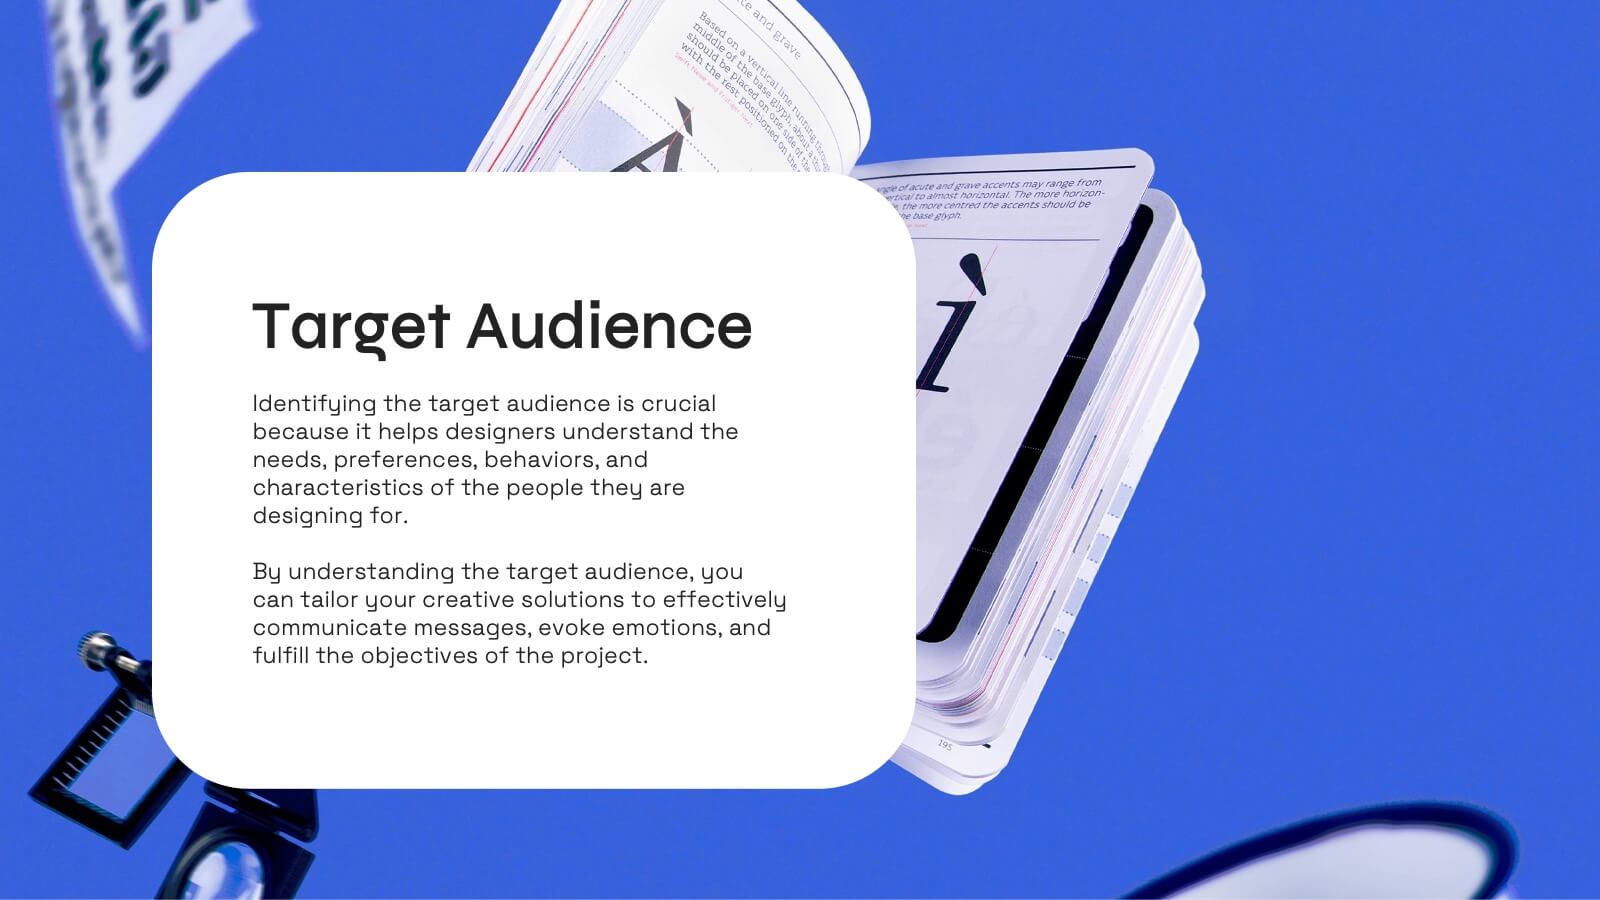
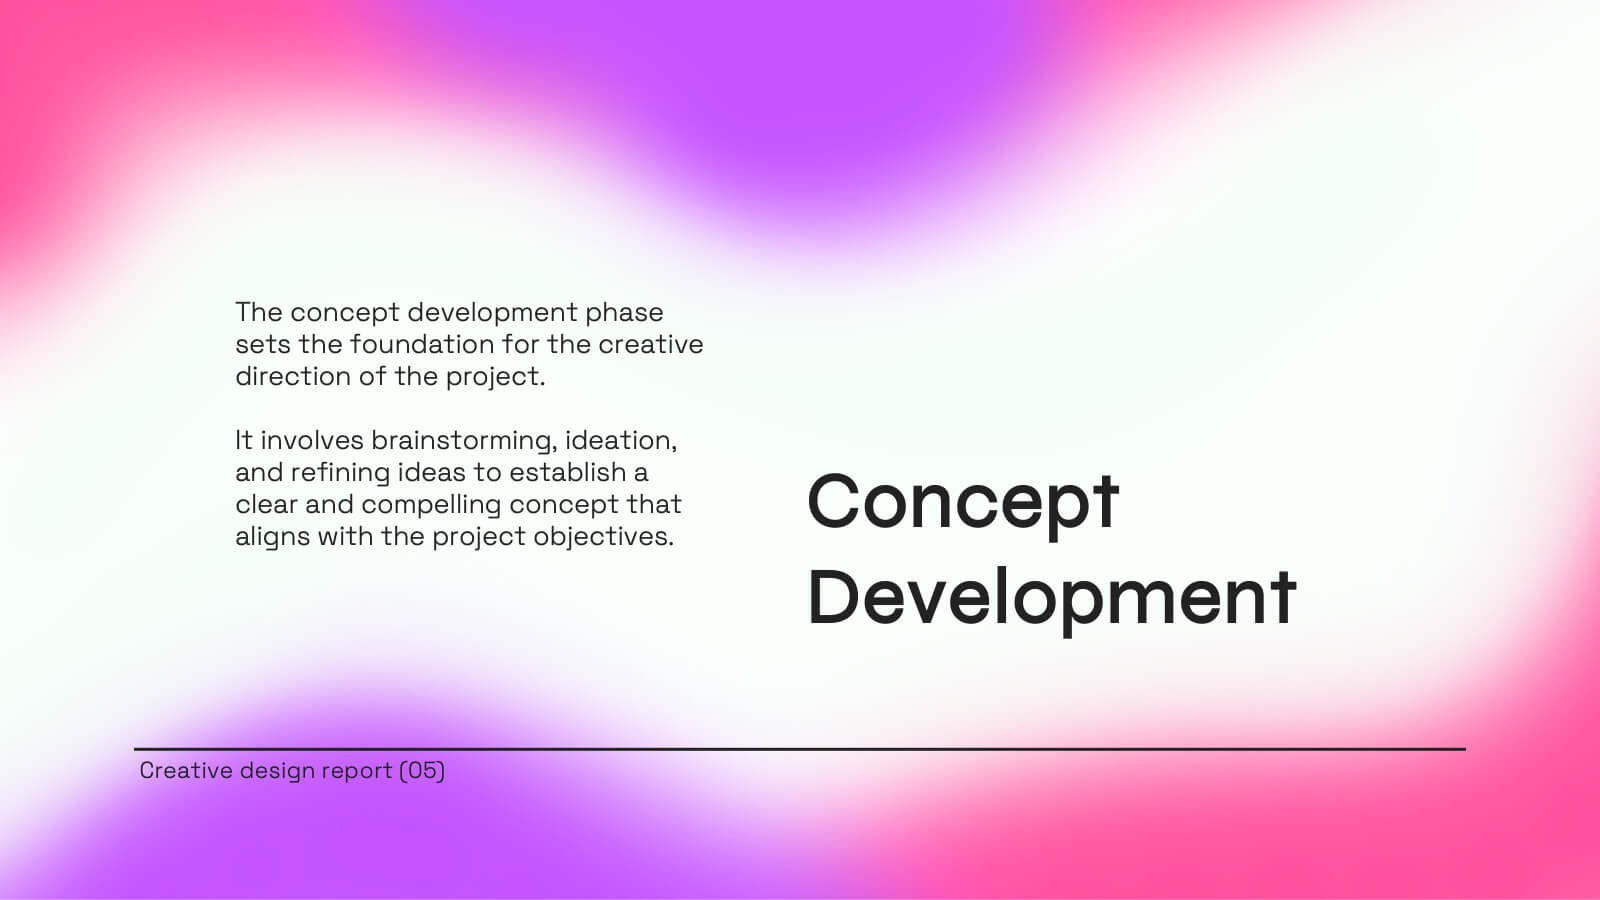
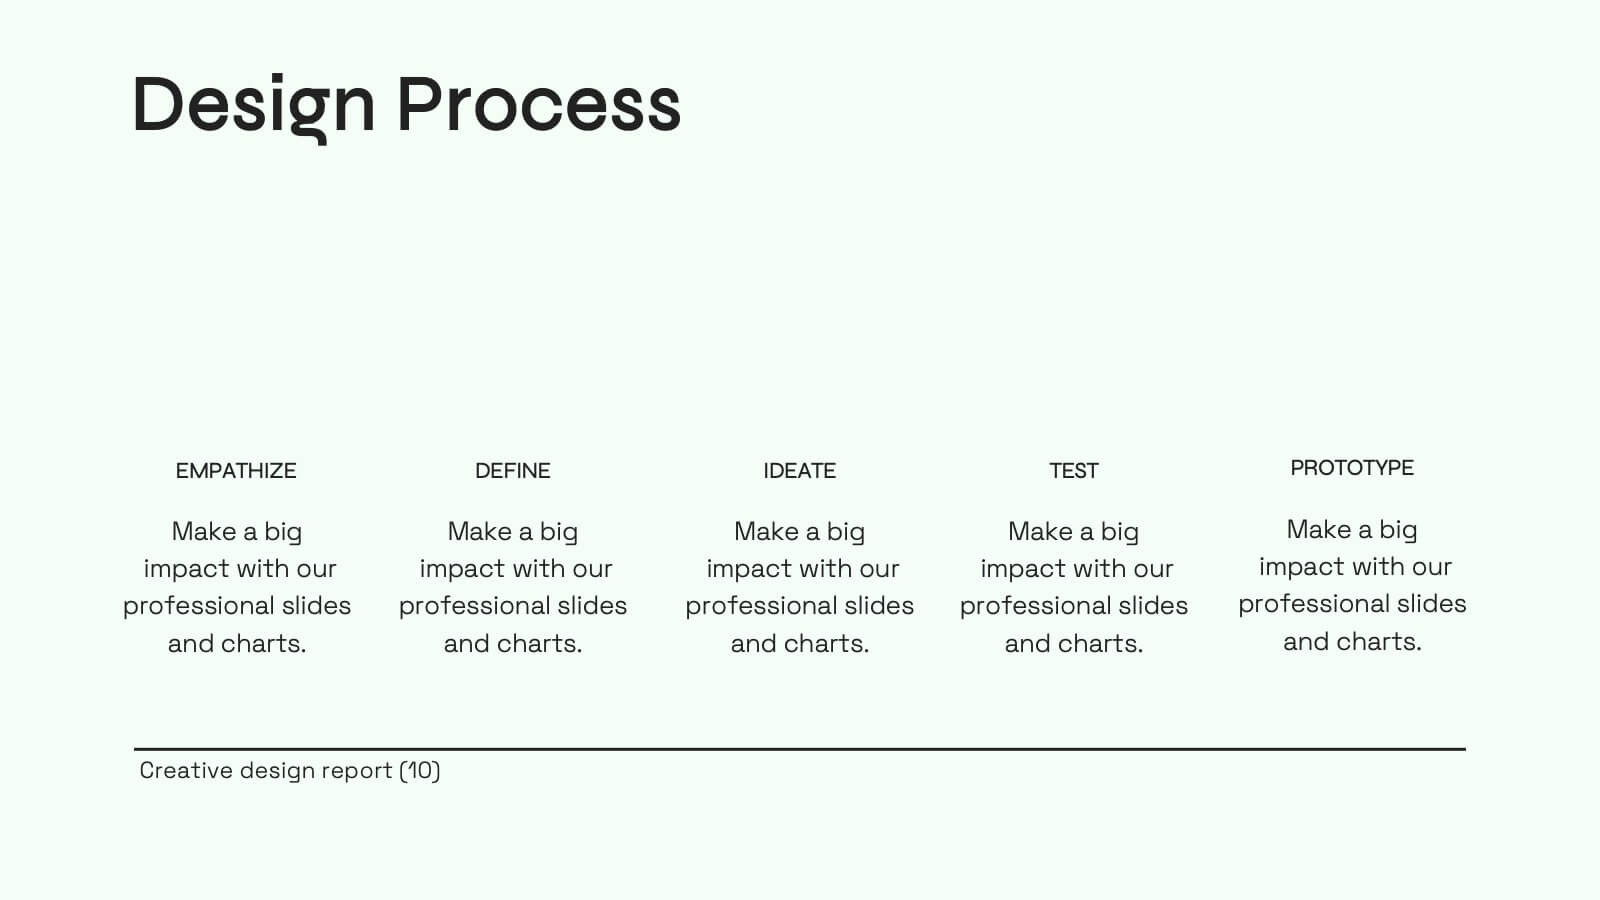
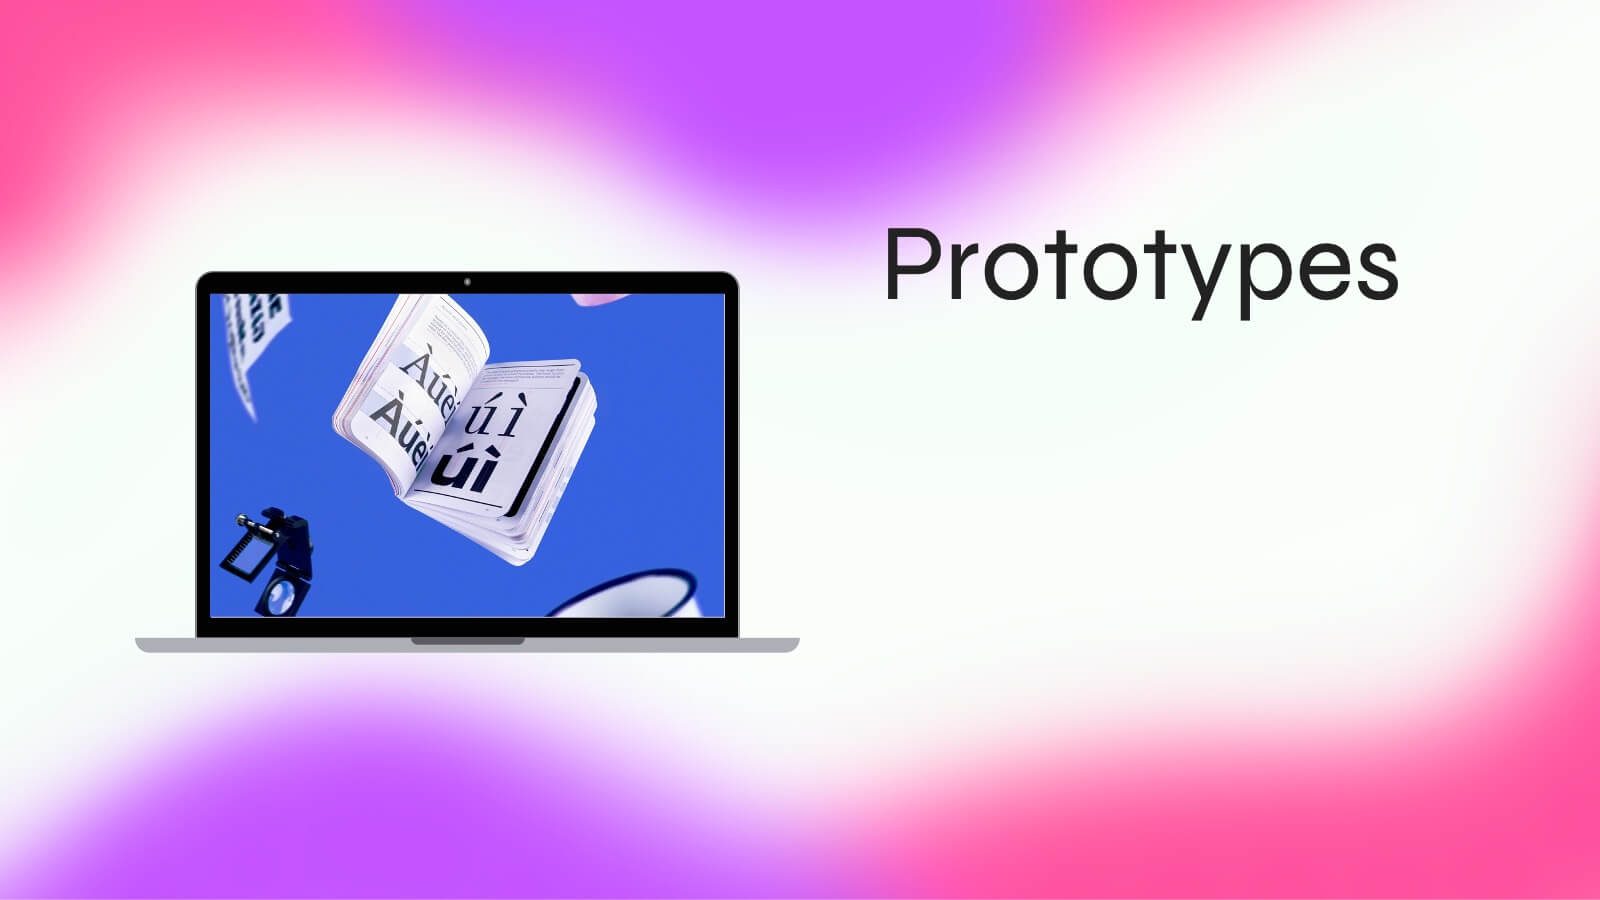
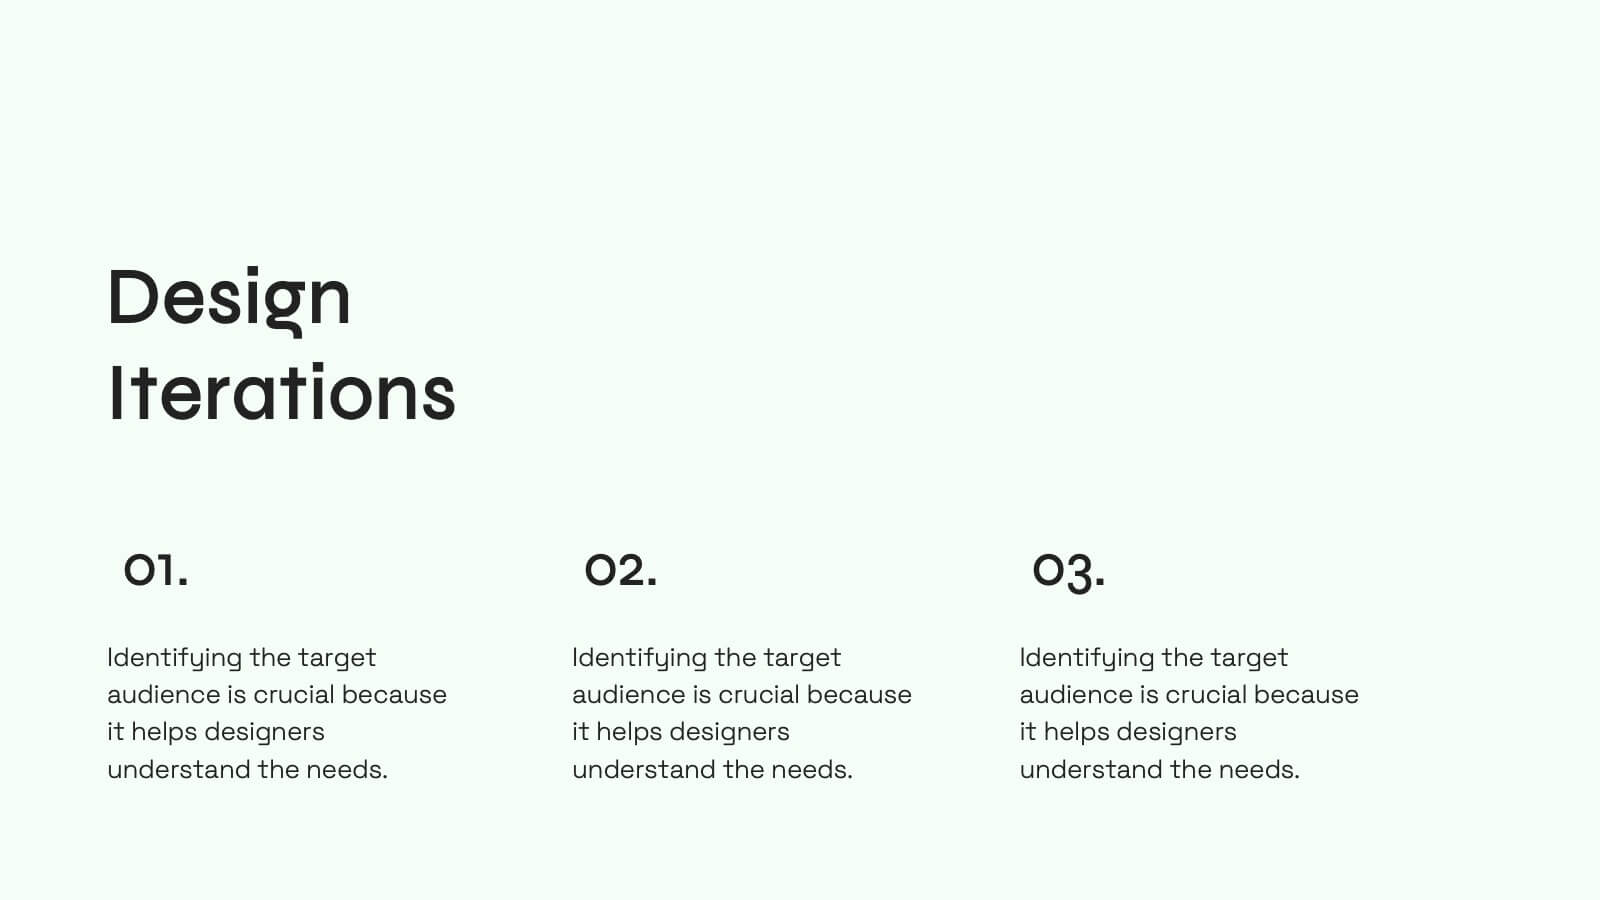
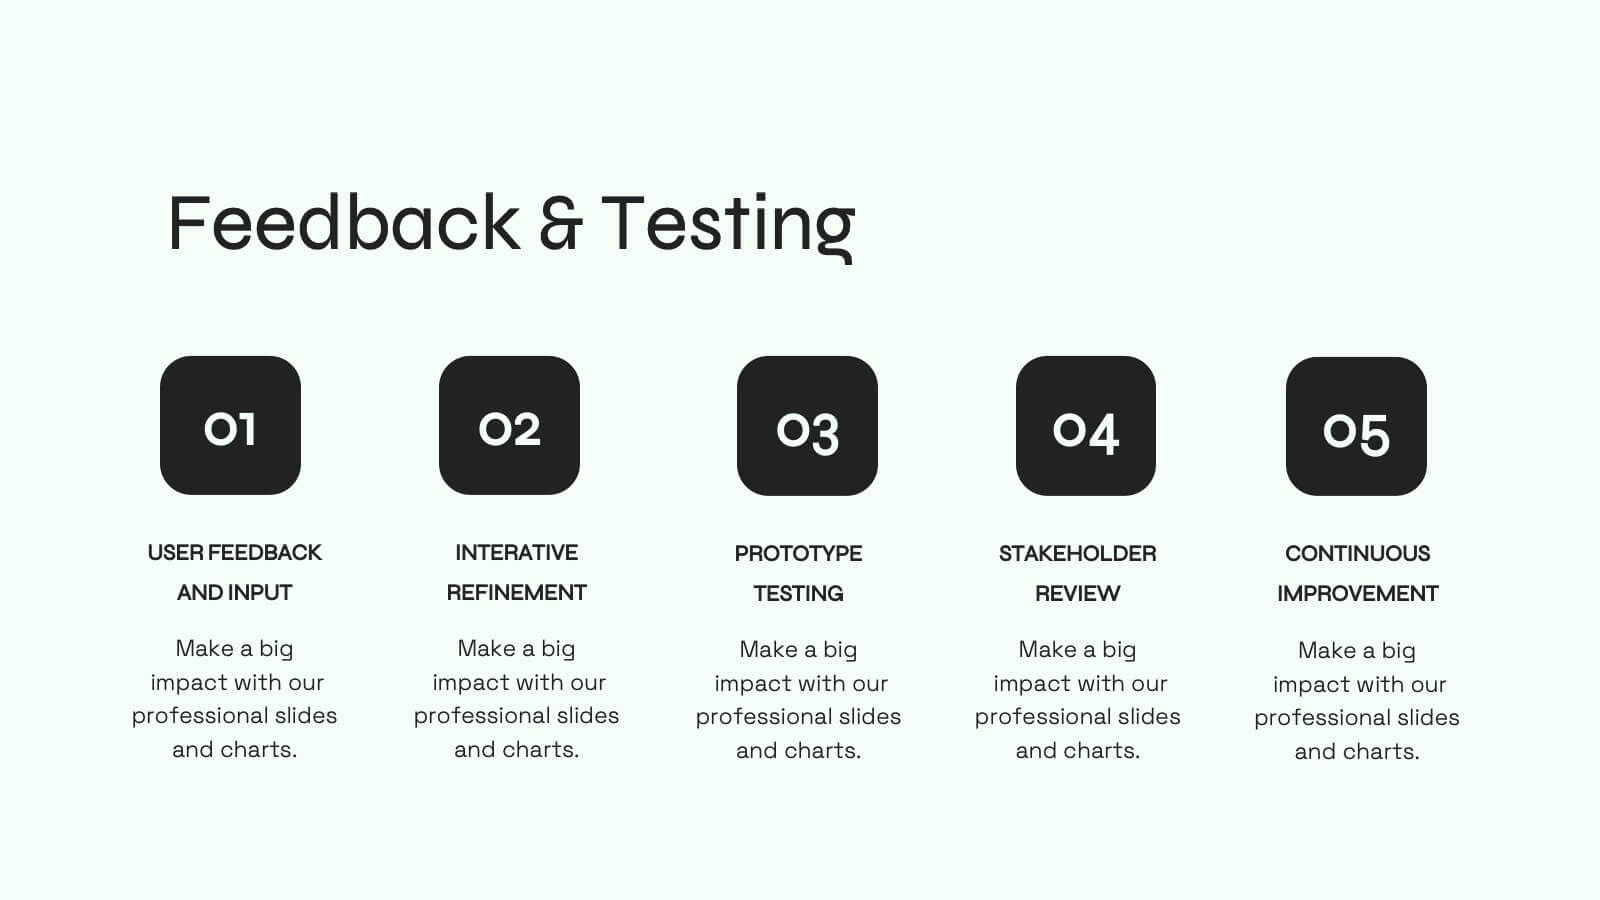
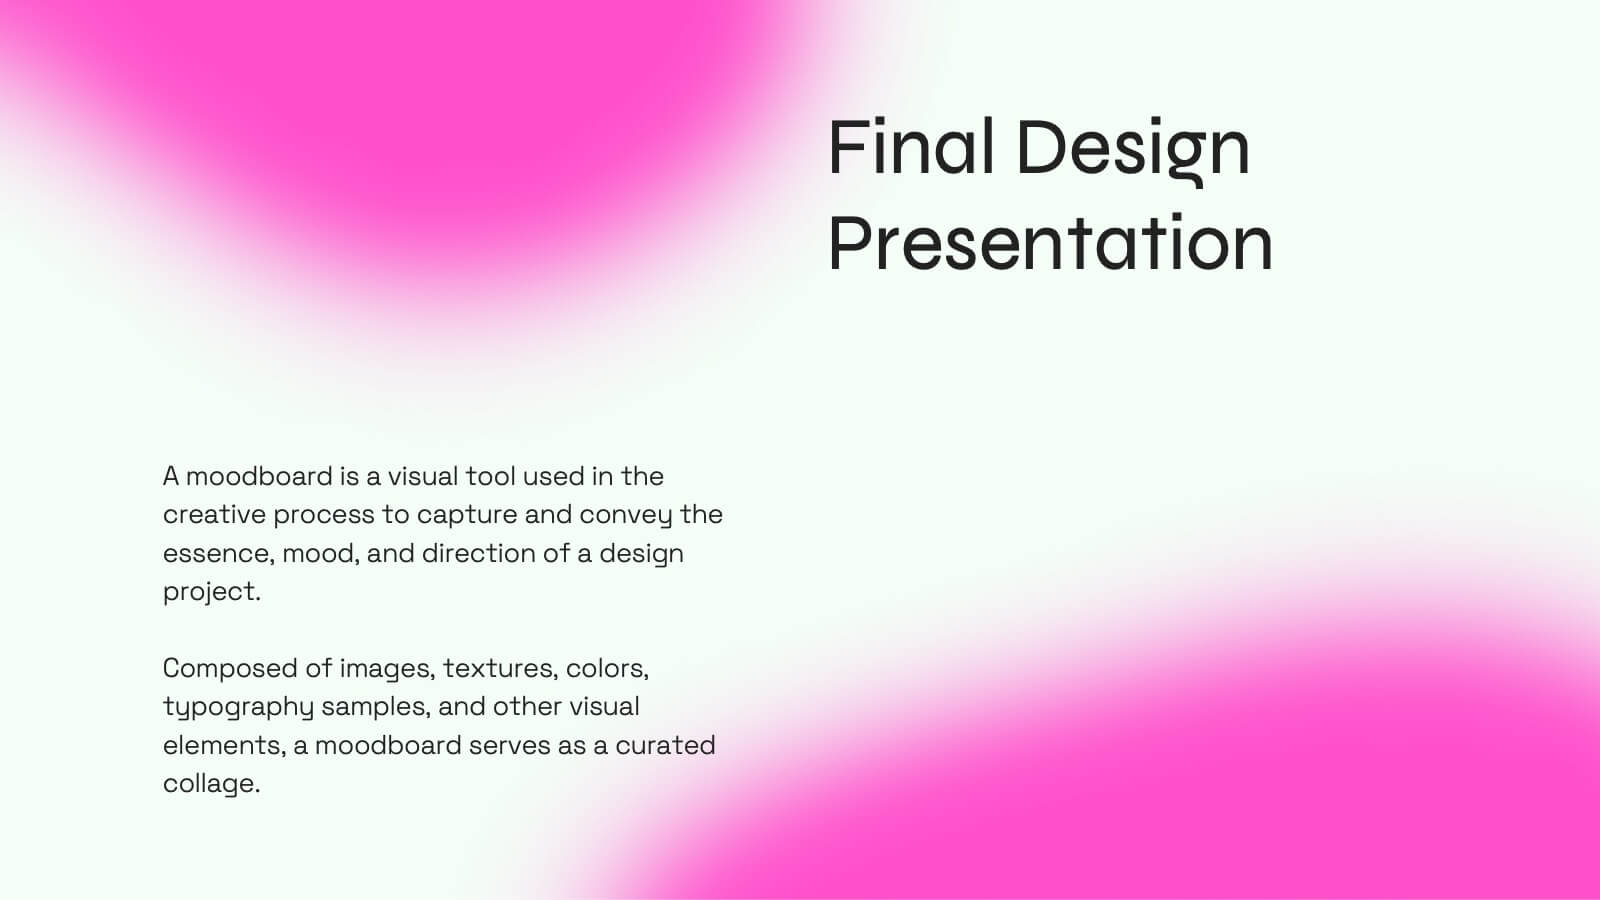
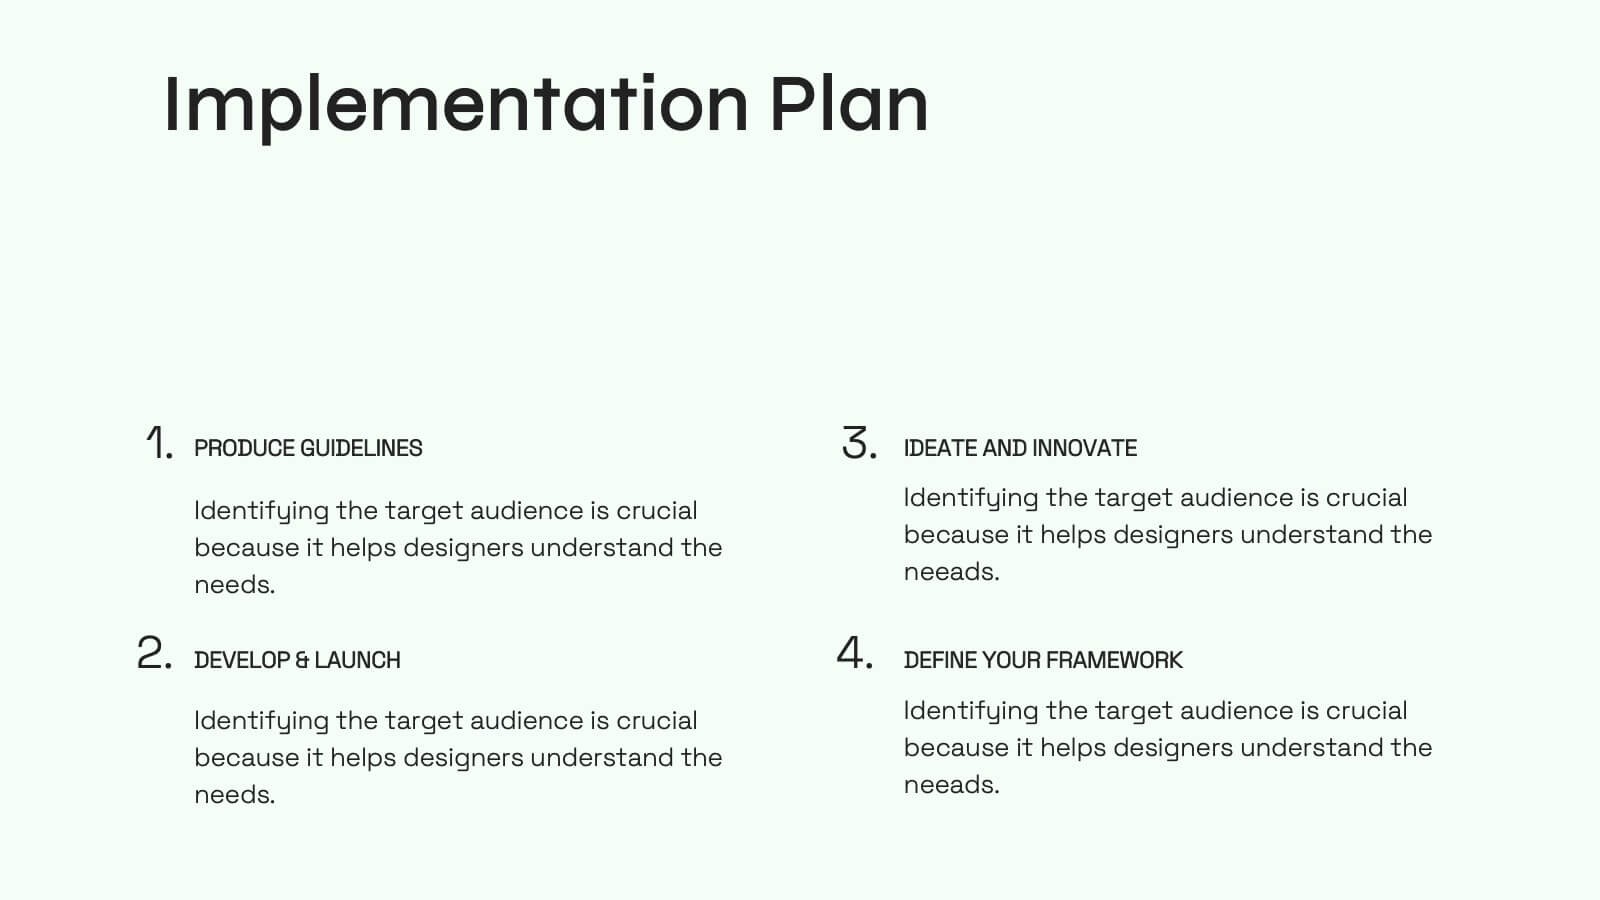
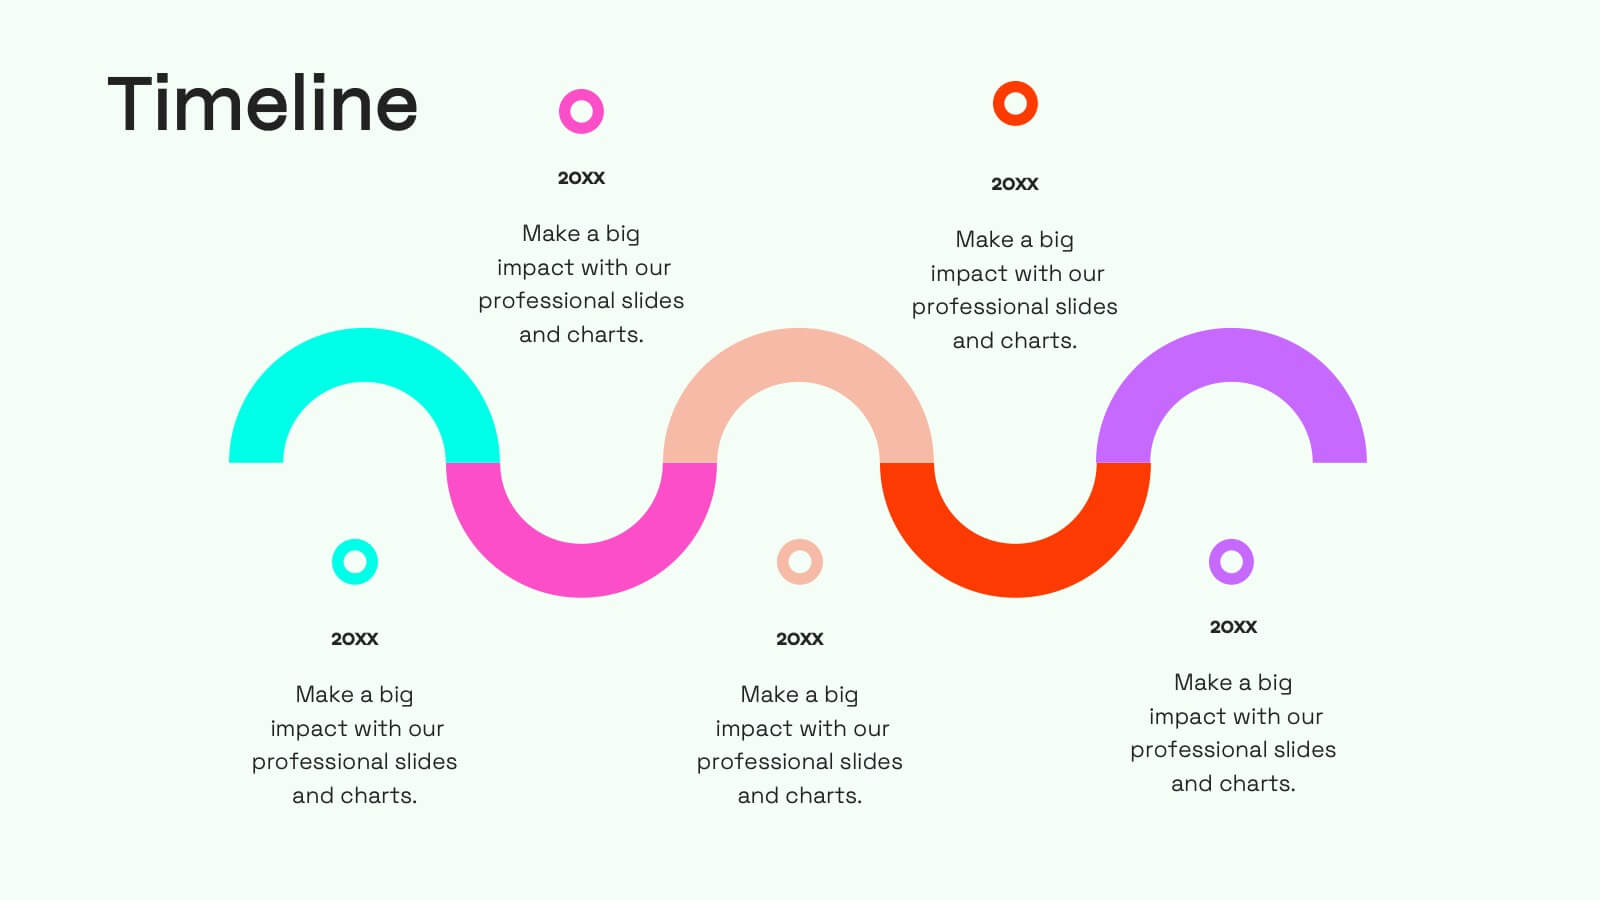
Jade Creative Design Report Presentation
Transform your design report into a captivating visual experience with this elegant jade-themed presentation template! Ideal for showcasing your creative projects, it effectively highlights key concepts, methodologies, and outcomes in a polished format. With its striking design, your work will impress clients and stakeholders alike. Compatible with PowerPoint, Keynote, and Google Slides.


20 slides
Vitrumin Photography Portfolio Presentation
Showcase your creative work with this elegant and modern photography portfolio presentation template. Featuring essential slides such as an introduction, project highlights, creative process, awards, and client testimonials, this template is perfect for presenting your work professionally. Fully customizable and easy to edit, it's compatible with PowerPoint, Keynote, and Google Slides.


6 slides
Presentation Roadmap Agenda Outline
Plan your sessions with clarity using the Presentation Roadmap Agenda Outline Presentation. This sleek visual tracks five key points along a timeline, using numbered markers and matching text areas—perfect for agendas, project stages, or presentation flows. Fully customizable in PowerPoint, Keynote, and Google Slides.


23 slides
Cosmira Digital Strategy Presentation
This Digital Strategy Presentation provides a comprehensive framework for outlining business objectives, competitive analysis, and growth opportunities. It includes key sections such as SWOT analysis, performance metrics, and implementation plans. Ideal for businesses and marketers, the slides are fully editable and compatible with PowerPoint, Keynote, and Google Slides.


20 slides
Unity New Product Proposal Presentation
Unveil your product strategy with this modern, comprehensive template! Highlight your company overview, product features, and unique selling proposition. Perfect for presenting market analysis, pricing strategy, and technical specifications. Ideal for product managers and developers. Compatible with PowerPoint, Keynote, and Google Slides.


5 slides
Product Development to Decline Model Presentation
Showcase the full journey of a product from its inception to phase-out with the Product Development to Decline Model presentation. This circular diagram clearly outlines the four core stages, ideal for product managers, business analysts, and strategic planners. Each section features clean icons and editable text zones to highlight key insights and milestones. Fully customizable in PowerPoint, Keynote, and Google Slides.


5 slides
Scrum Methodology for Project Management Presentation
Visualize your team’s process with this Scrum Methodology for Project Management Template. Featuring dynamic arrow and gear illustrations, this slide helps convey product development cycles, sprint planning, reviews, and retrospectives in a clean, engaging format. Fully editable and ready for PowerPoint, Keynote, and Google Slides.


4 slides
Turning Ideas into Impact Presentation
Showcase your transformation journey from concept to achievement with this bold visual layout. The three-step diagram—idea, action, success—makes it ideal for project planning, product development, or strategic execution. Easily editable in PowerPoint, Keynote, and Google Slides for pitch decks, business roadmaps, or innovation workflows. Clean, modern, and impactful.


26 slides
Efficient Time Management Presentation
Optimize your time management skills with a presentation designed to streamline your productivity. The template offers a professional and calming color palette, encouraging focus and clarity. It's structured to address the key principles of time management, from prioritizing tasks to strategic planning. Within the slides, you’ll find tools to introduce time management concepts, team profiles to assign roles efficiently, and charts to monitor progress. Engaging graphics and infographics are used to outline processes and time allocation, making it easier to visualize effective time management strategies. This template is a perfect match for workshops, personal organization sessions, or corporate training programs, compatible with popular platforms like PowerPoint, Keynote, and Google Slides. It’s designed to aid professionals and teams in harnessing their time effectively, ensuring every second counts towards achieving their goals.


5 slides
The Problem of Food Waste Infographics
Food Waste refers to any food that is discarded or lost along the food supply chain, from production to consumption. These vertical infographics are designed to cover the problem of food waste and can be designed to highlight statistics and facts about the issue. This infographic can be used to show how much food is wasted annually and the negative impact that this waste has on the environment. In the text boxes provide tips for reducing food waste, such as buying only what you need, storing food properly, and using leftovers creatively. Included are engaging visuals, such as icons and illustrations, and a clear layout.


7 slides
Watercolor Plan Infographic
A watercolor plan infographic refers to an infographic design or style that incorporates elements of watercolor painting. Dive into the world of dreams and aspirations with our watercolor plan infographic template. This artistic and visually captivating infographic guides you through your plans and goals with the fluidity and creativity of watercolors. This infographic is a visually stunning and inspiring template that transforms the process of goal setting into an artistic masterpiece, encouraging individuals to paint their dreams with vivid hues of determination and creativity.


5 slides
Organizational Change Management Plan Presentation
Lead transformation with confidence using this layered pyramid visual designed for change management plans. Each tier clearly outlines steps, roles, or phases within your organizational shift—perfect for guiding teams through the process. Ideal for strategic presentations, leadership briefings, and operational planning. Fully compatible with PowerPoint, Keynote, and Google Slides.


10 slides
Lean Six Sigma Business Strategy Presentation
Enhance your operational efficiency with our Lean Six Sigma Business Strategy template! This user-friendly guide helps you navigate through the core stages—Define, Measure, Analyze, Improve, and Control—optimizing processes and reducing waste. Compatible with PowerPoint, Keynote, and Google Slides, this template is perfect for professionals aiming to drive business excellence through structured problem-solving.


4 slides
Digital Marketing Strategy Presentation
Present your marketing insights with impact using this engaging digital marketing strategy slide. Featuring a modern bar chart with layered 3D blocks and icon-labeled highlights, this slide is perfect for showcasing strategy breakdowns, campaign priorities, or market performance data. Customize each section with concise titles and professional content. Ideal for marketers, agencies, and analysts. Fully editable in PowerPoint, Keynote, and Google Slides.


5 slides
Global Market Trends World Map Presentation
Visualize your market insights with this sleek and professional Global Market Trends World Map slide. Designed to highlight key regional data with pinpoint accuracy, it’s ideal for presenting statistics, regional performance, or global expansion strategies. The sidebar gradient layout offers space for five categories, each linked to map locations. Fully customizable and compatible with PowerPoint, Keynote, and Google Slides.