


Features
- 6 Unique slides
- Fully editable and easy to edit in Microsoft Powerpoint, Keynote and Google Slides
- 16:9 widescreen layout
- Clean and professional designs
- Export to JPG, PDF or send by email


Do you have any questions?
Recommend


7 slides
United States Map Infographic Presentation Template
The United States is a country in North America, consisting of 50 states. Besides the 48 conterminous states that occupy the middle latitudes of the continent, the United States includes the state of Alaska, at the northwestern extreme of North America, and the island state of Hawaii, in the mid-Pacific Ocean. This map template is a great way to kickstart your project, add a clean and professional look with it. This template can be used to display any type of data or information you need in your presentations. Use this map template to show where the states are and what they're known for.


6 slides
Community Network Infographic
A community network is a localized, often root-driven, communication infrastructure that connects individuals, organizations, and institutions within a specific geographical area or community. This Infographic template visually represents the connections, relationships, and interactions within a community, often focusing on its members, resources, and activities. This template is a powerful way to showcase the dynamics and vitality of a community. This highlights the central theme or purpose of the community at the center of the infographic. This is fully customizable and compatible with Powerpoint, Keynote, and Google Slides.


7 slides
Company Profile History Infographic
This collection of templates is meticulously designed to detail a company's historical growth and significant milestones, ensuring that stakeholders can grasp the evolution and achievements of the business effectively. Each template varies in design, from sleek, minimalistic layouts to more robust, data-intensive presentations, making it versatile for different corporate needs and preferences. Included features range from detailed timelines and milestone markers to percentage breakdowns, which not only aid in visualizing the company's journey but also emphasize important events such as key product launches, expansion milestones, and significant shifts in company strategy. Additionally, these templates allow for customization, including the ability to incorporate company-specific branding elements like logos, color schemes, and typography. Ideal for shareholder meetings, investor pitches, and internal strategy discussions, these templates serve as a powerful tool for companies to showcase their historical context, financial growth, market expansion, and customer engagement over the years, aligning past achievements with future goals in a clear and structured format.


13 slides
Key Performance Indicators (KPI) Presentation
Track success with the Key Performance Indicators (KPI) Presentation template. This data-driven layout showcases essential metrics, from social media engagement to financial performance, helping you visualize progress and optimize strategies. Perfect for business reports, marketing analysis, and executive dashboards. Fully customizable in PowerPoint, Keynote, and Google Slides for seamless integration into your workflow.


4 slides
Data Table Infographic Presentation
Organize complex information clearly with the Data Table Infographic Presentation. This slide design features a structured table layout paired with icon-labeled column headers for visual clarity. Ideal for presenting statistics, performance metrics, survey data, or structured comparisons. Highlighted headers draw attention to key sections, making your data easy to digest. Fully editable in PowerPoint, Keynote, and Google Slides.


6 slides
Supply Chain Management Infographics
Elevate your presentation with our Supply Chain Management template, designed for clarity and impact. The slides are a blend of professional and engaging visuals, perfect for showcasing the intricacies of supply chain operations. Ideal for professionals and educators, they simplify complex logistics concepts into understandable visuals. The design is clean, making it perfect for business presentations that need to convey detailed processes and strategies effectively. With these slides, you're equipped to deliver a powerful message about the importance of streamlined supply chain management.


26 slides
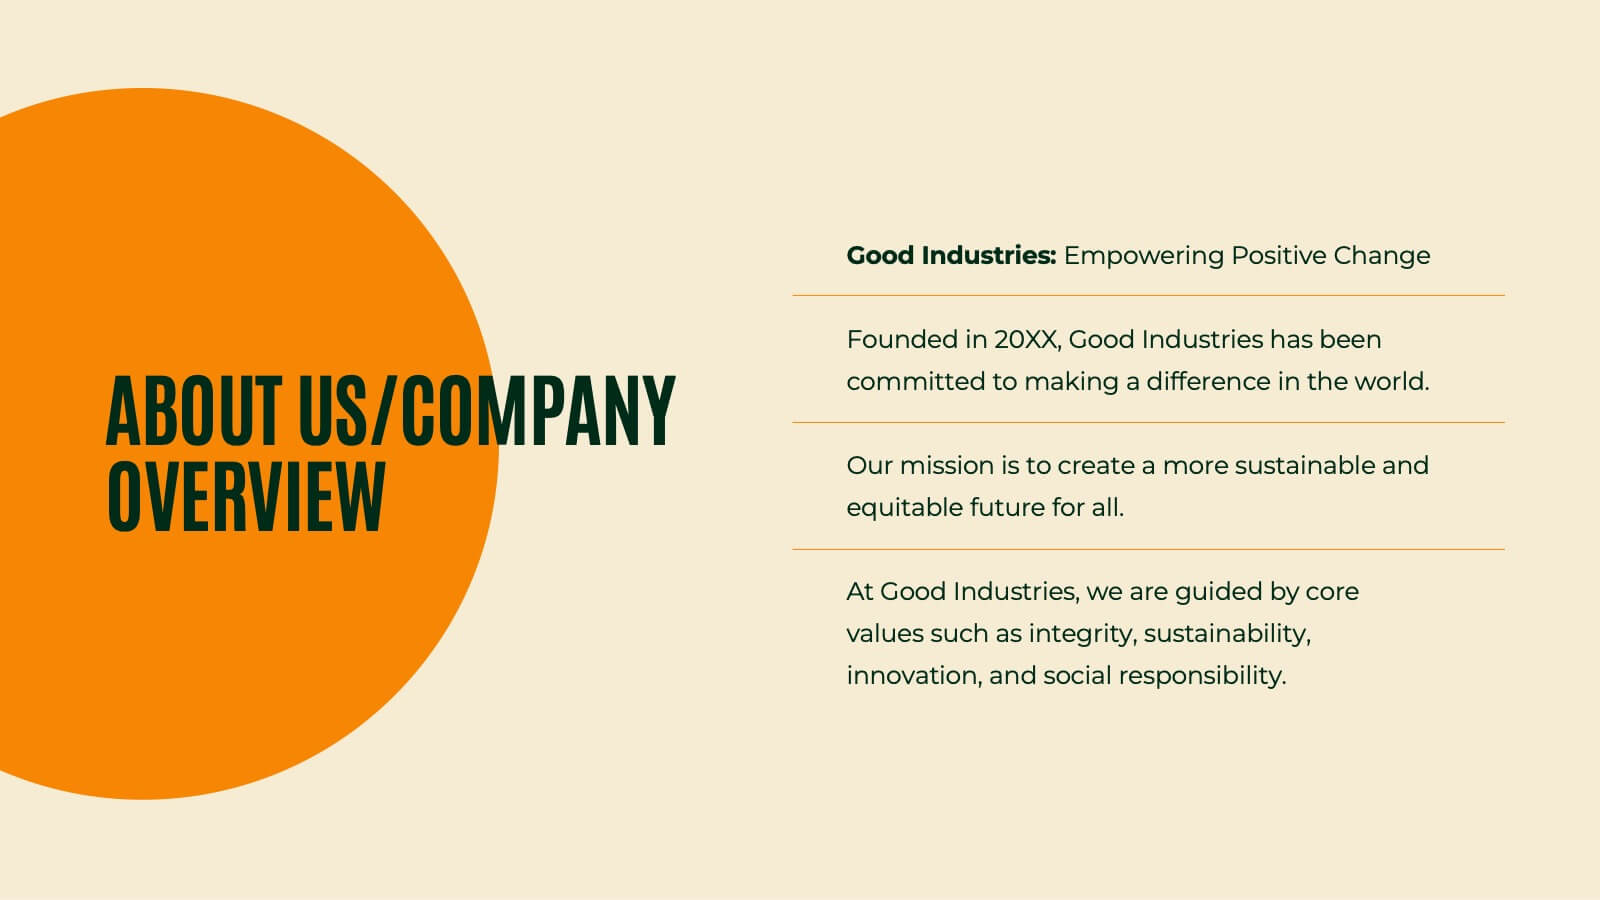
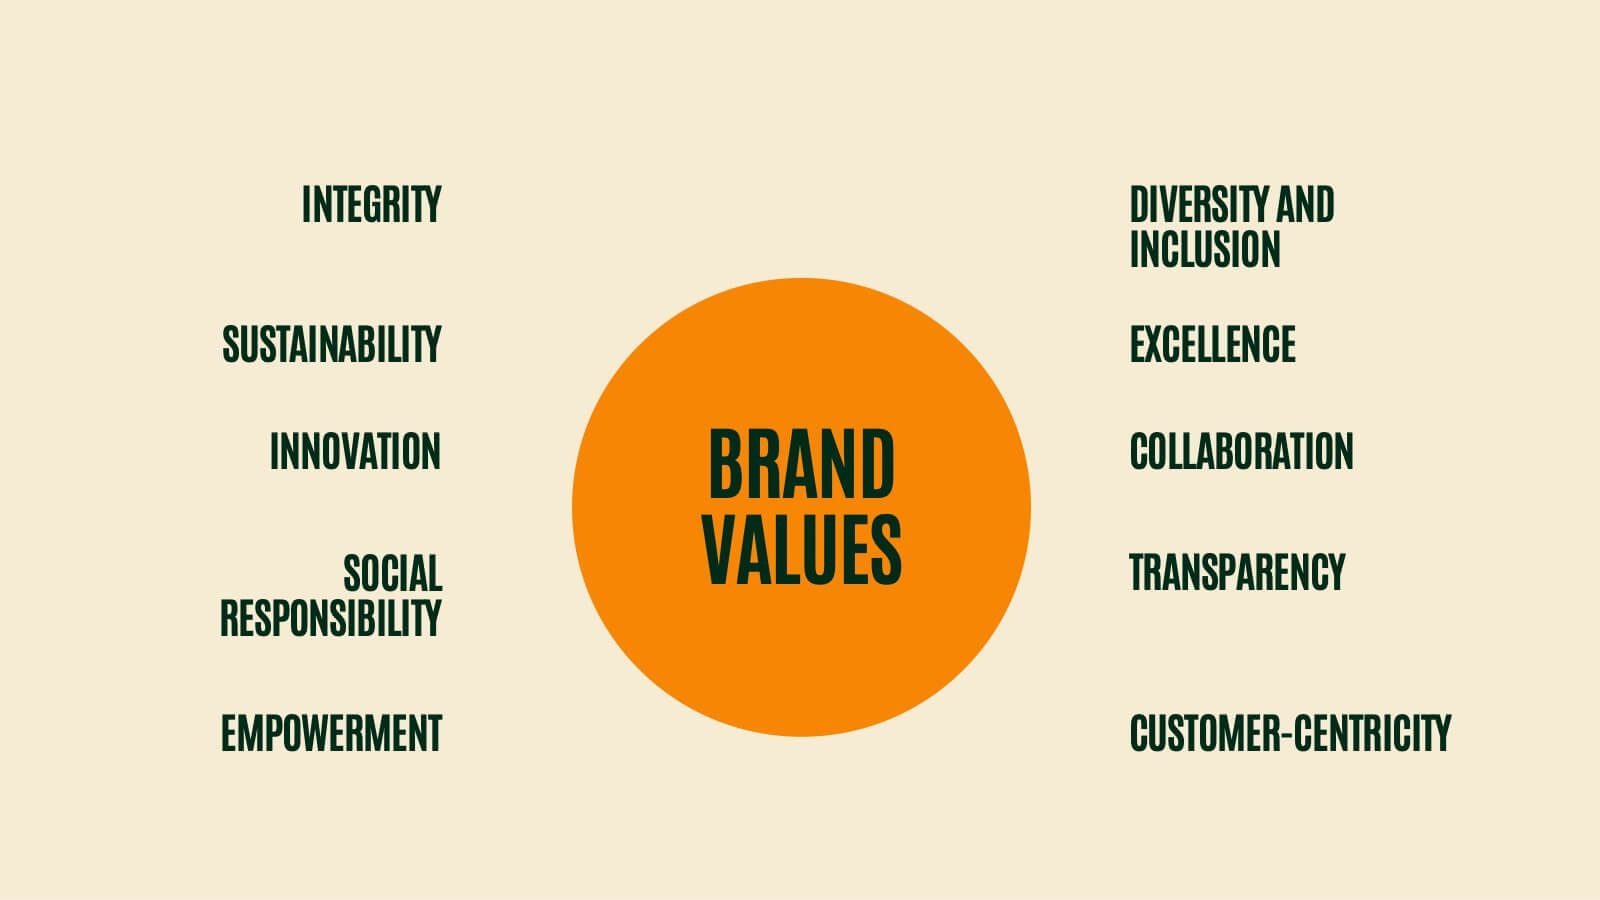
Griffin Rebranding Project Plan Presentation
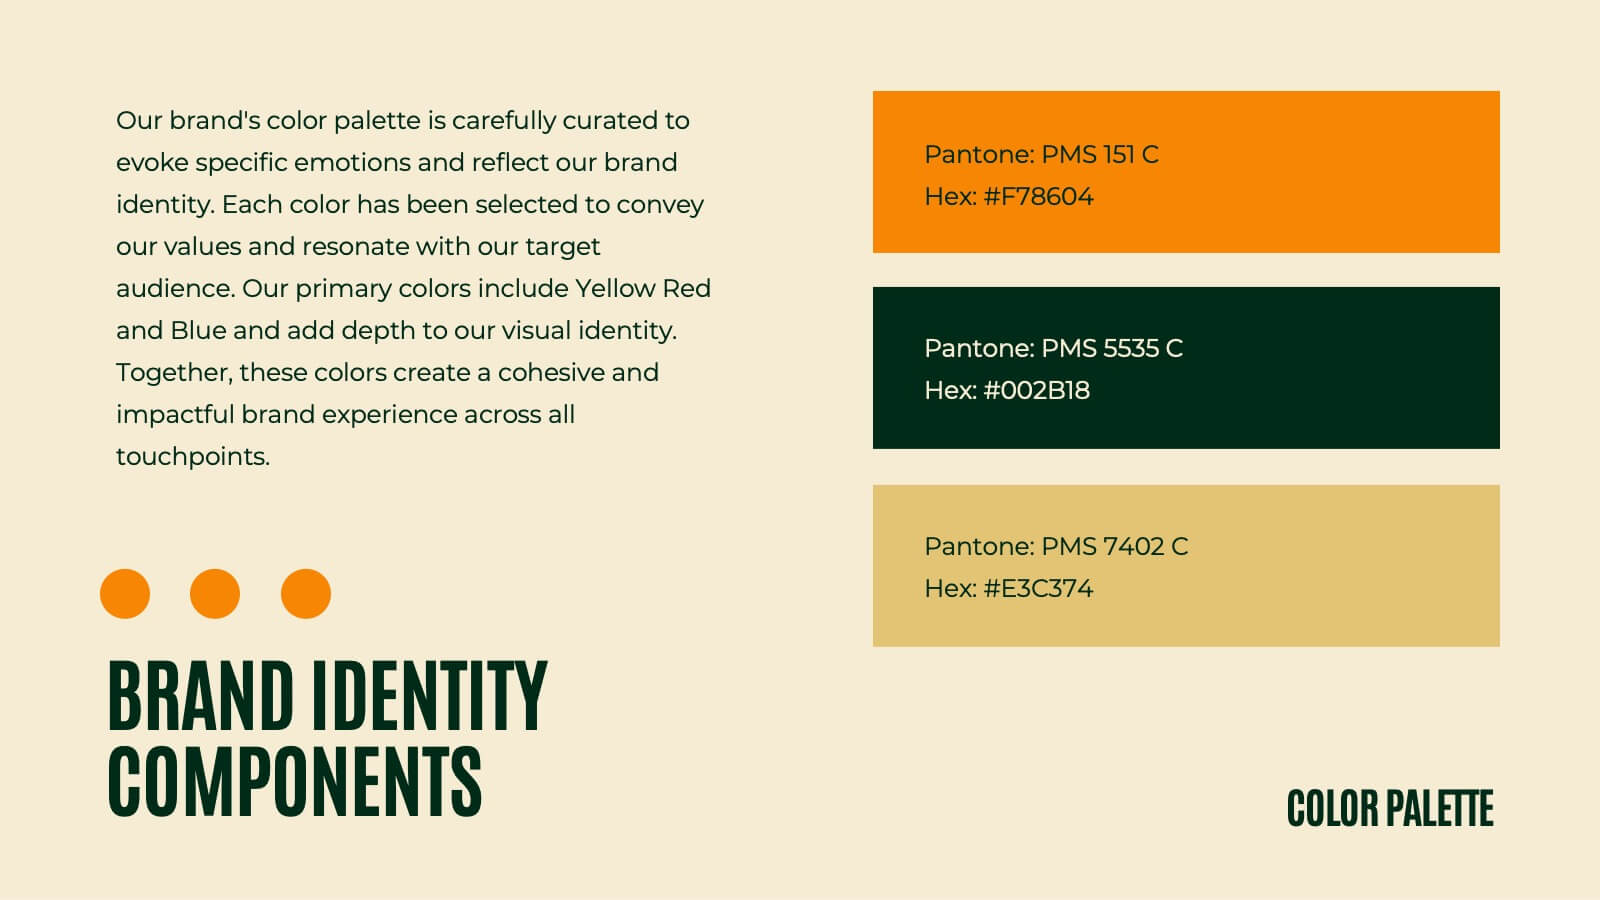
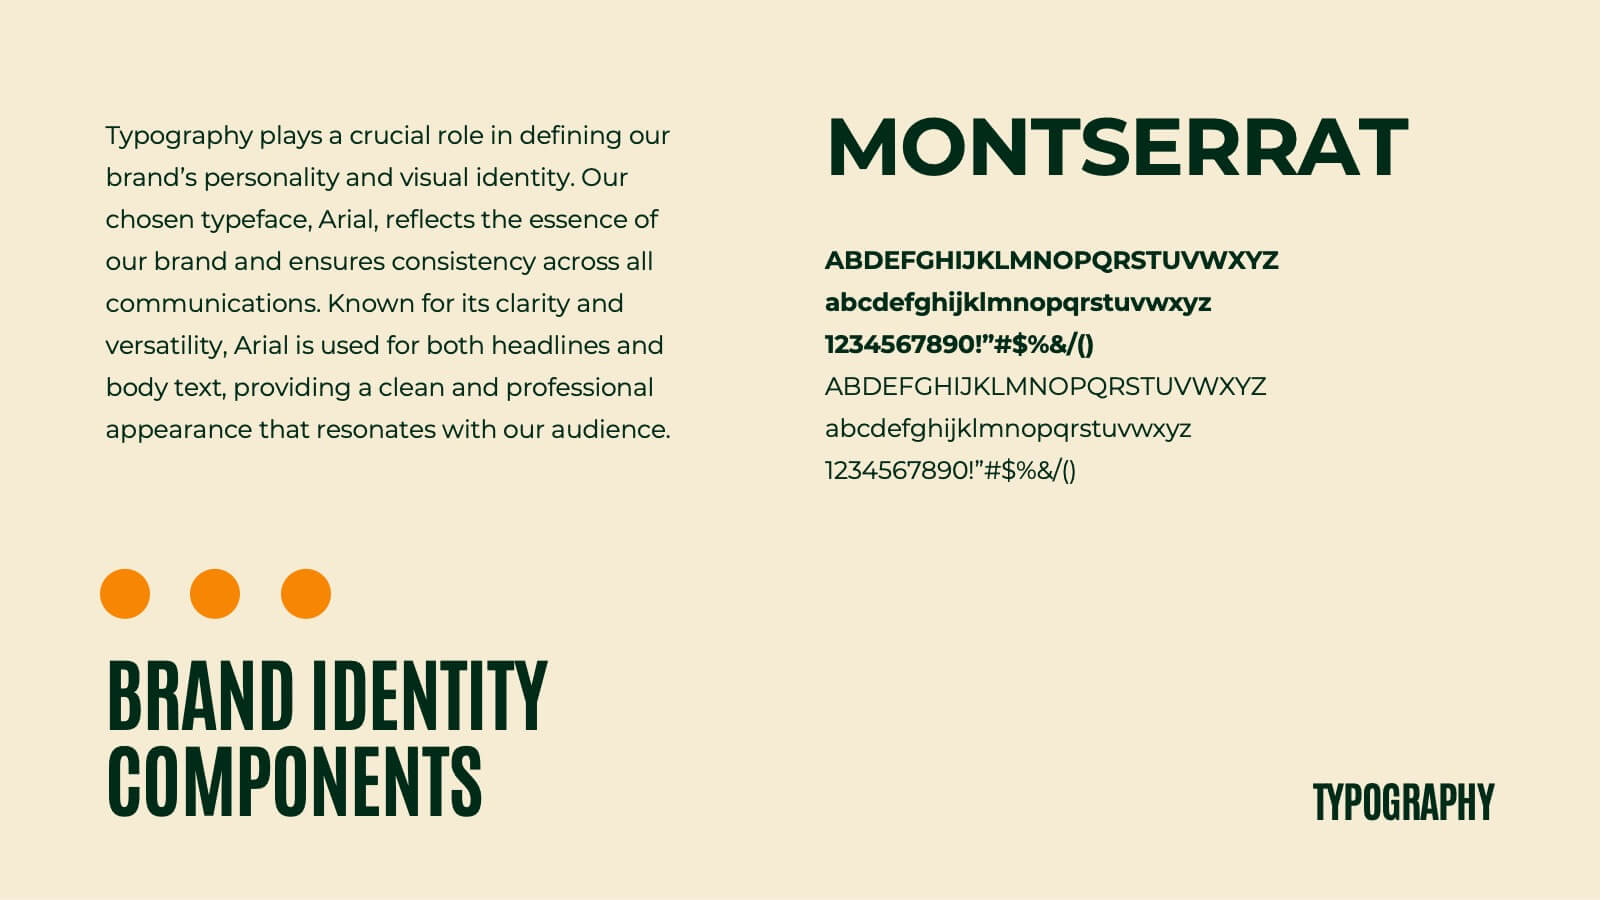
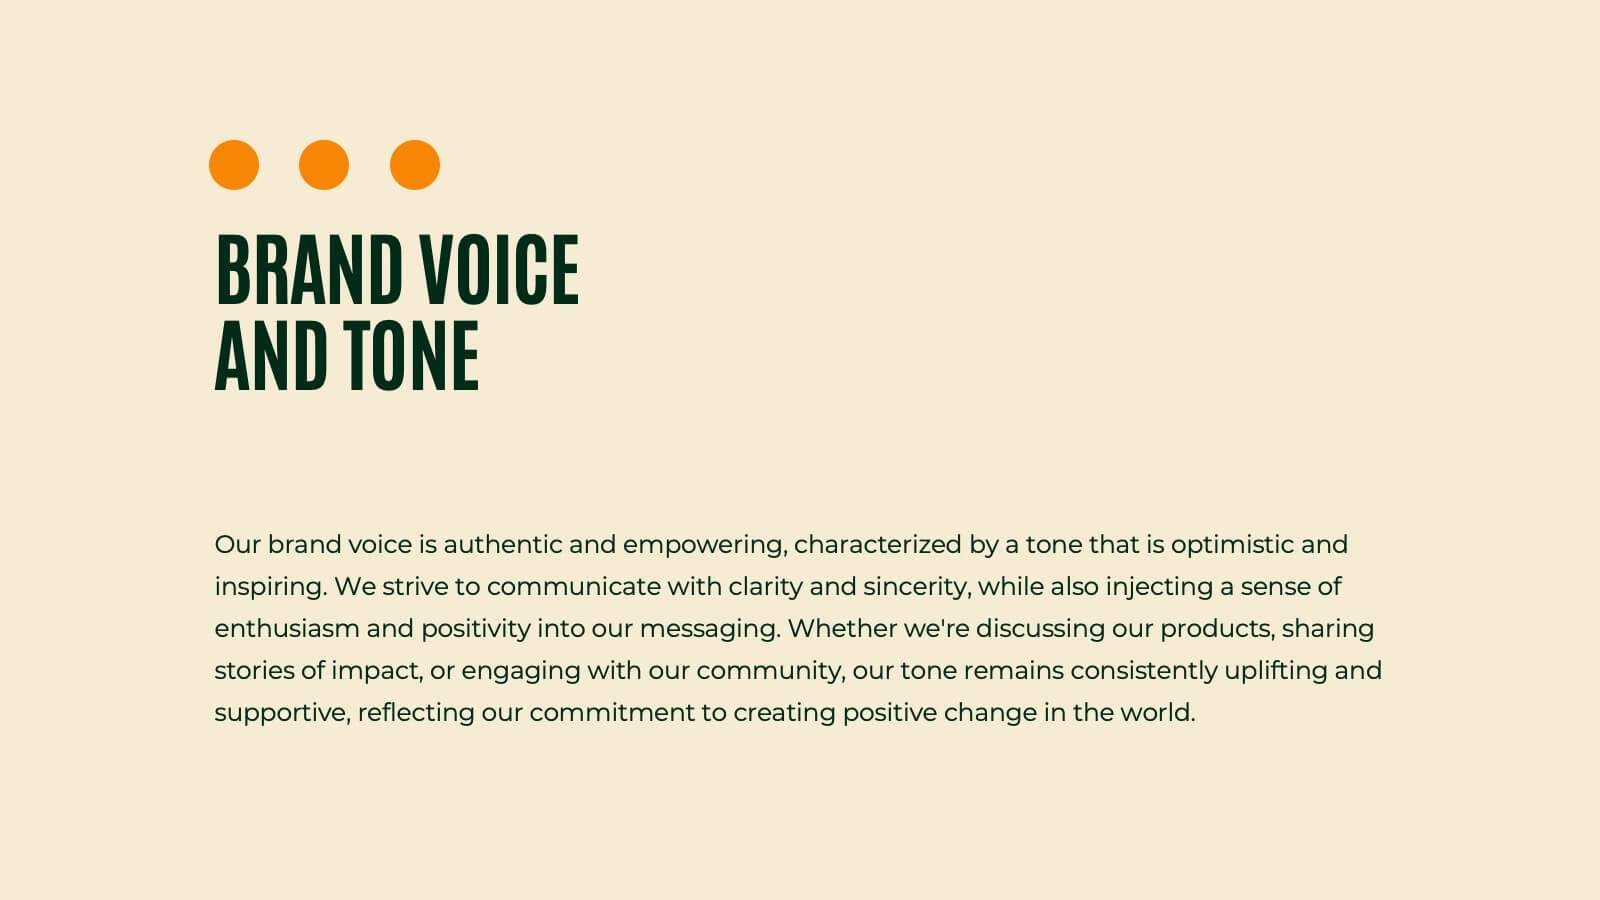
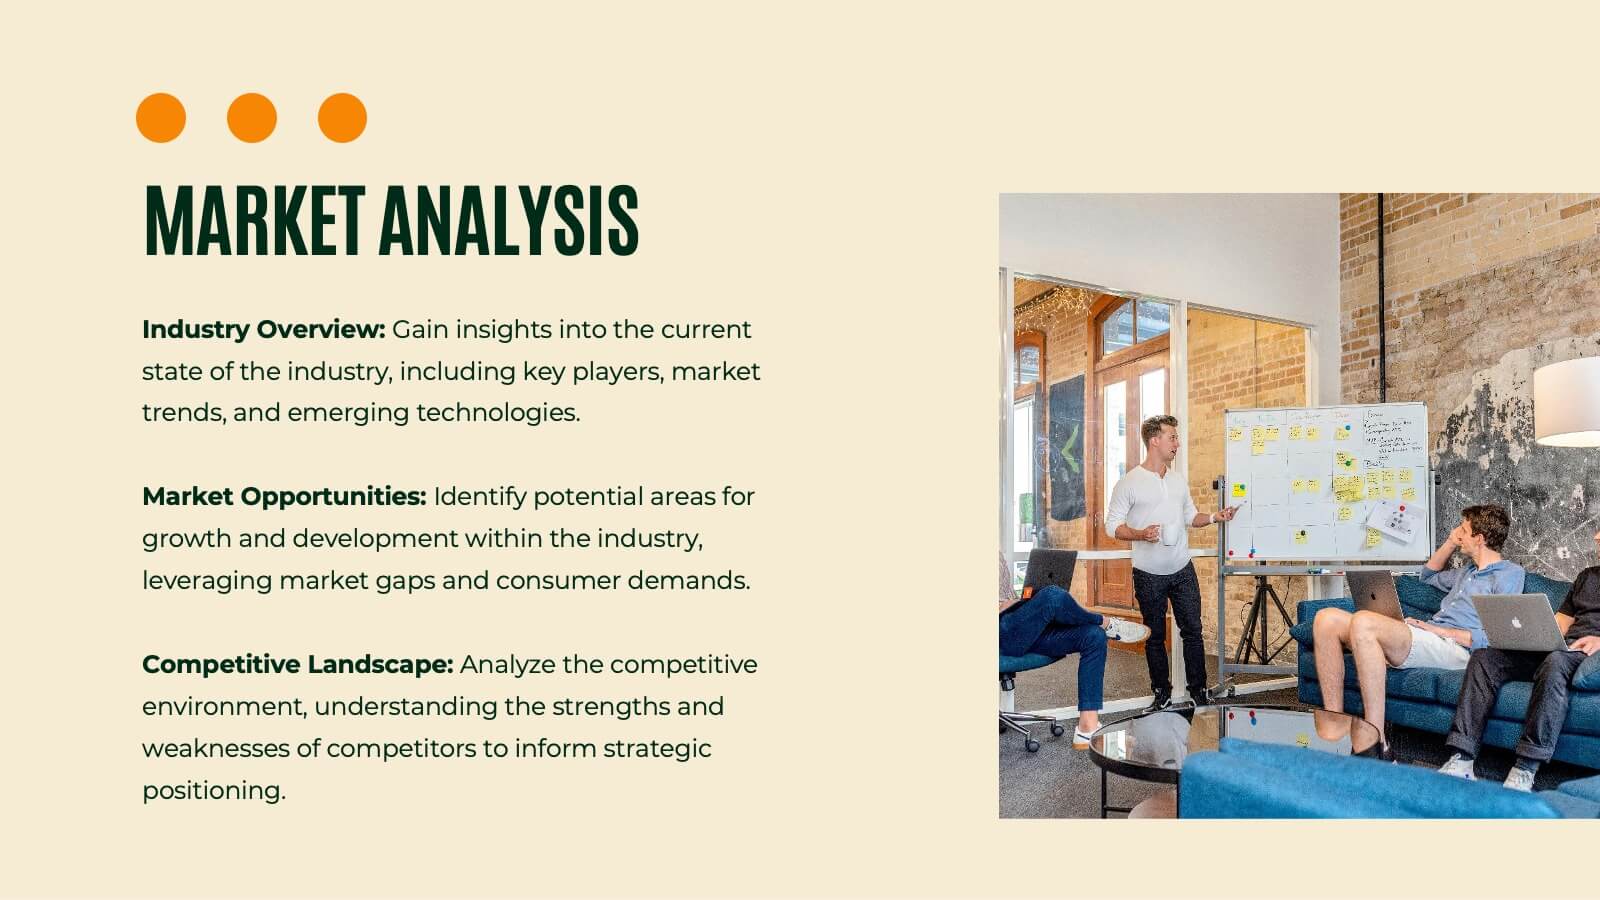
Unleash the power of branding with this vibrant presentation template! This tool guides you through essential brand elements like identity, voice, and strategy. Perfect for marketers and brand managers aiming to make a memorable impact. Compatible with PowerPoint, Keynote, and Google Slides, it's a must-have for any branding project.


10 slides
Modern Healthcare Technology Trends Presentation
Highlight innovations in healthcare with the Modern Healthcare Technology Trends Presentation. This slide features a central device graphic connected to four key icons, perfect for showcasing digital tools, emerging trends, or medical tech strategies. Fully customizable in Canva, PowerPoint, Keynote, and Google Slides—ideal for medical tech briefings and strategic presentations.


6 slides
Customers Market Segmentation Strategy Presentation
Unlock the power of understanding your audience with a visually structured layout that turns complex data into clear, actionable insights. This presentation helps businesses define, target, and engage customer groups effectively. Fully editable and compatible with PowerPoint, Keynote, and Google Slides for seamless customization and professional presentation delivery.


7 slides
Company Profile Structure Infographic
This series of templates is meticulously crafted to represent a company’s structure in a detailed and organized manner. Each template varies in design and layout, ensuring that there is a style to suit different business needs and preferences. From straightforward, clean layouts to more dynamic, visually engaging designs, these templates provide an excellent basis for companies to present their organizational structure, core team members, departmental divisions, and key business areas effectively. Key information such as company values, mission statements, and strategic objectives can be clearly highlighted, allowing companies to communicate their business essence and operational ethos to stakeholders. Each template also accommodates data visualization through charts, graphs, and infographics, which are instrumental in depicting growth trajectories, performance metrics, or demographic breakdowns. With customization options, these templates can be tailored to reflect a company's unique brand identity, including color schemes, typography, and corporate logos, making each presentation not only informative but also reflective of the company's image. This collection is ideal for corporate introductions, stakeholder meetings, and internal presentations aimed at fostering a clear understanding of the company’s operational framework and strategic direction.


6 slides
Six Sigma DMAIC Method Presentation
Bring clarity and momentum to your improvement plan with this dynamic presentation, designed to visually guide teams through each stage of a structured problem-solving process. It helps you present goals, insights, and actions with confidence while keeping the workflow clear and engaging. Fully compatible with PowerPoint, Keynote, and Google Slides.


5 slides
Veterinary Medicine Advances Presentation
Discover the latest in Veterinary Medicine Advances with our engaging presentation template. Designed to highlight key innovations and treatment methods, this template offers a clear visual format for presenting complex information effectively to colleagues and stakeholders in the veterinary field.


28 slides
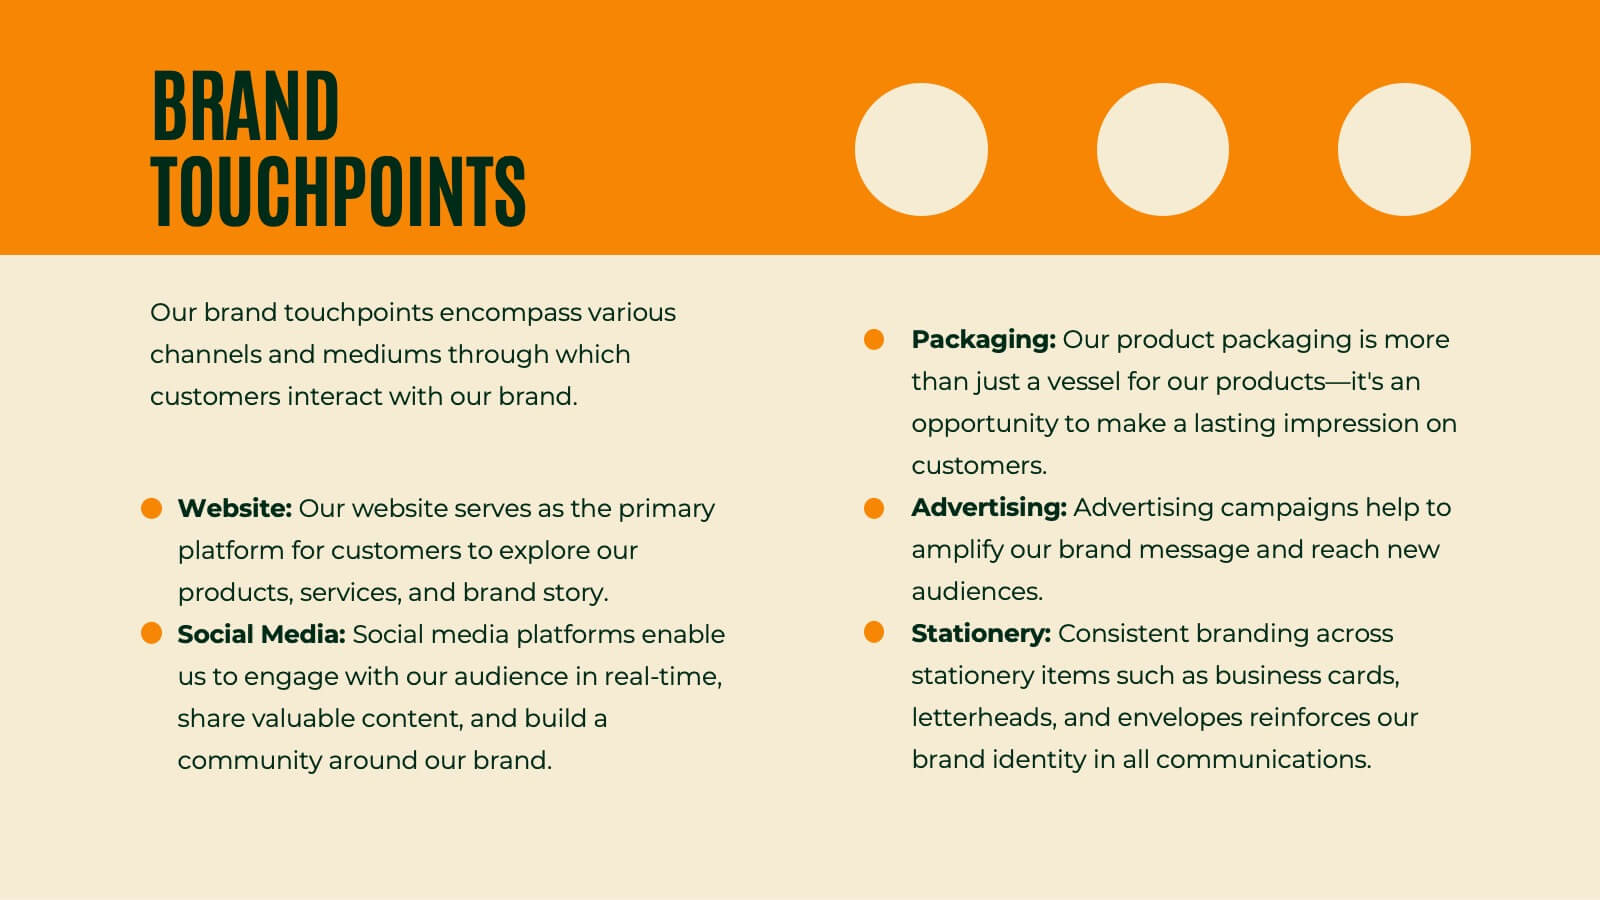
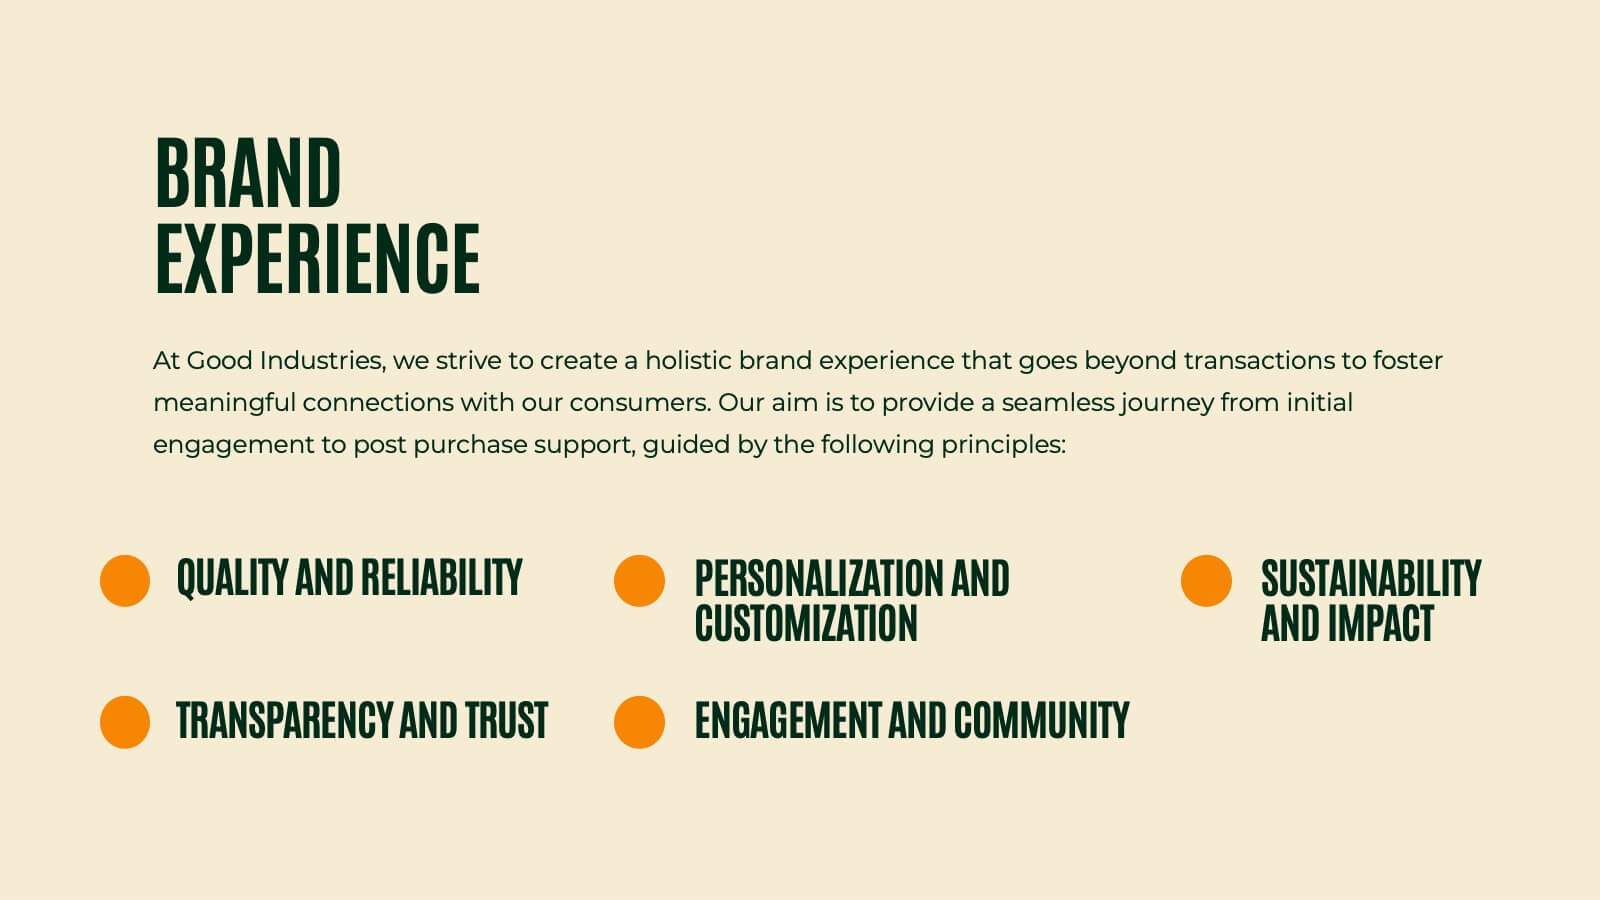
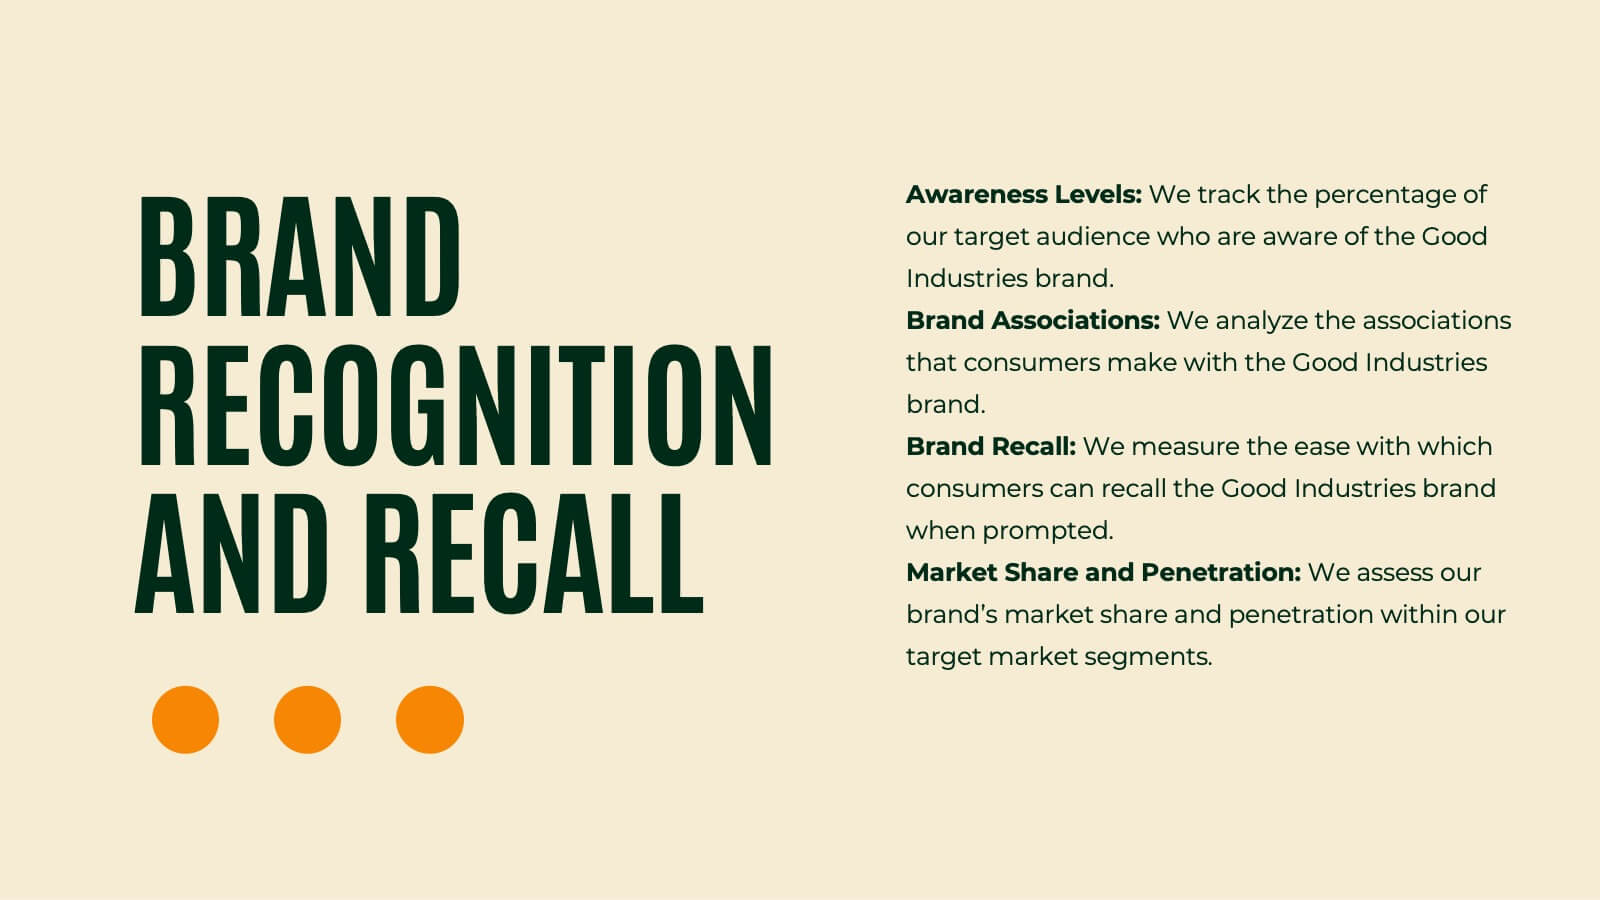
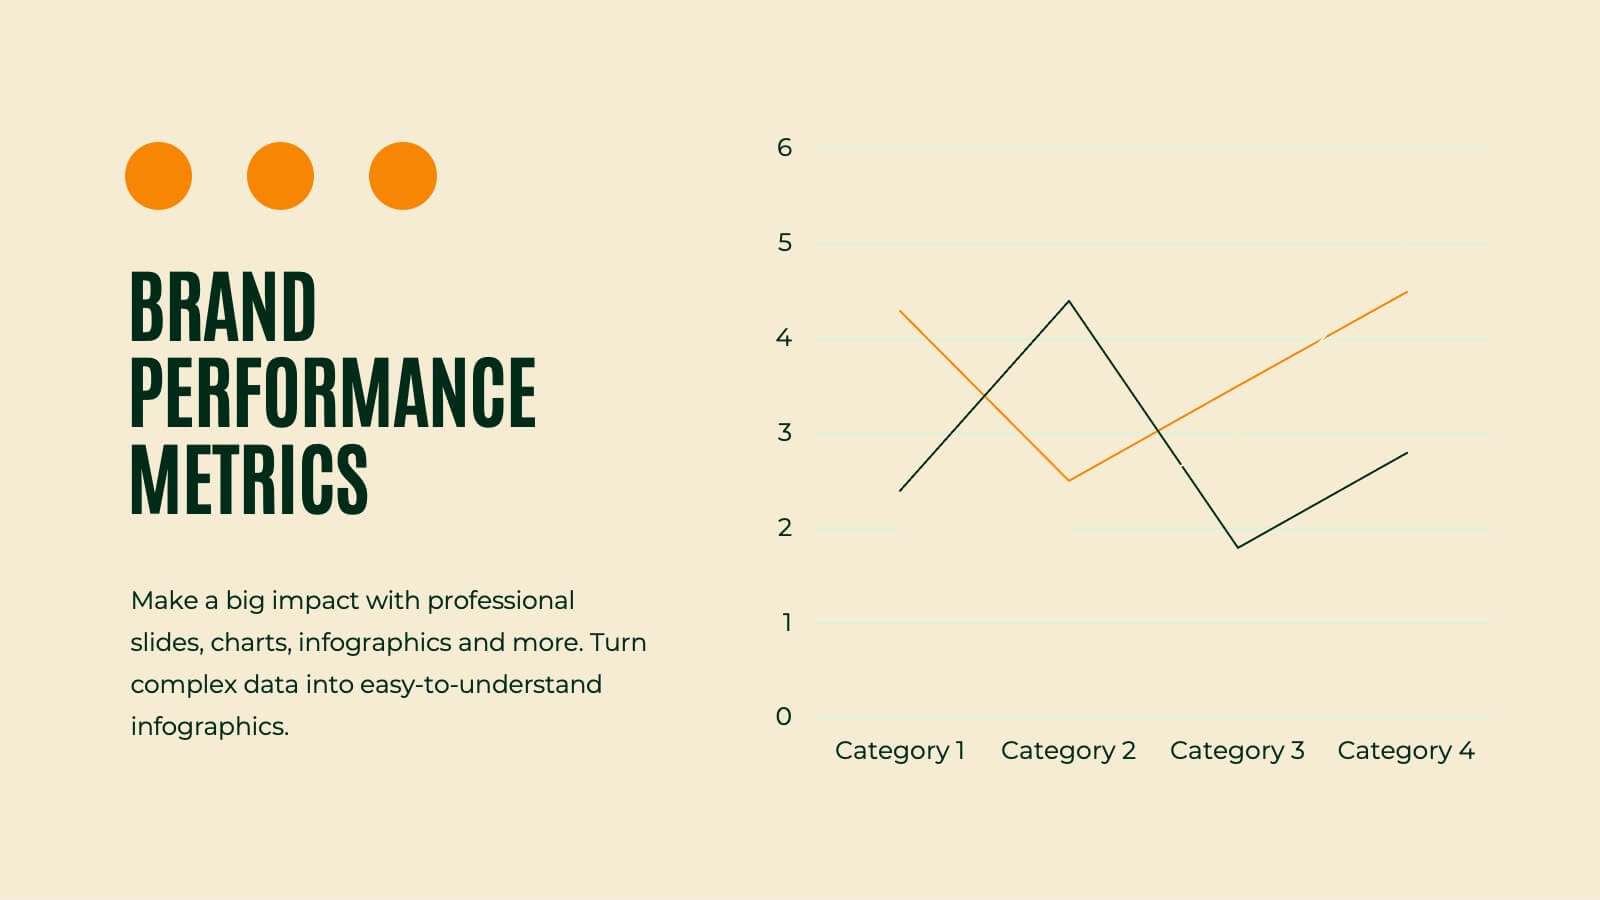
Hawking Brand Strategy Report Presentation
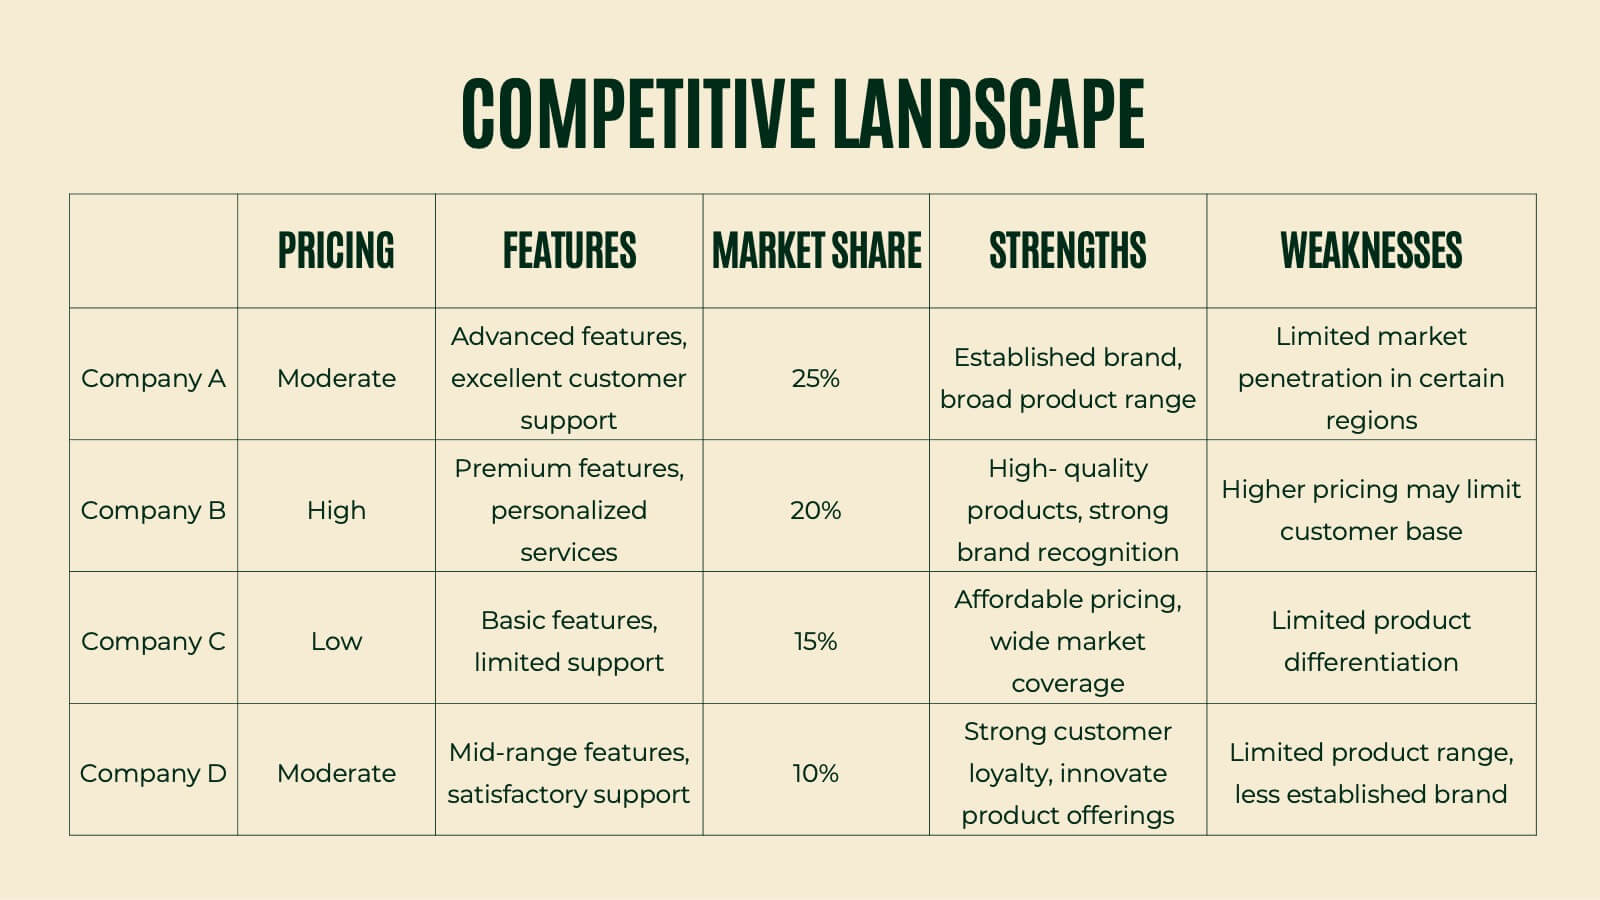
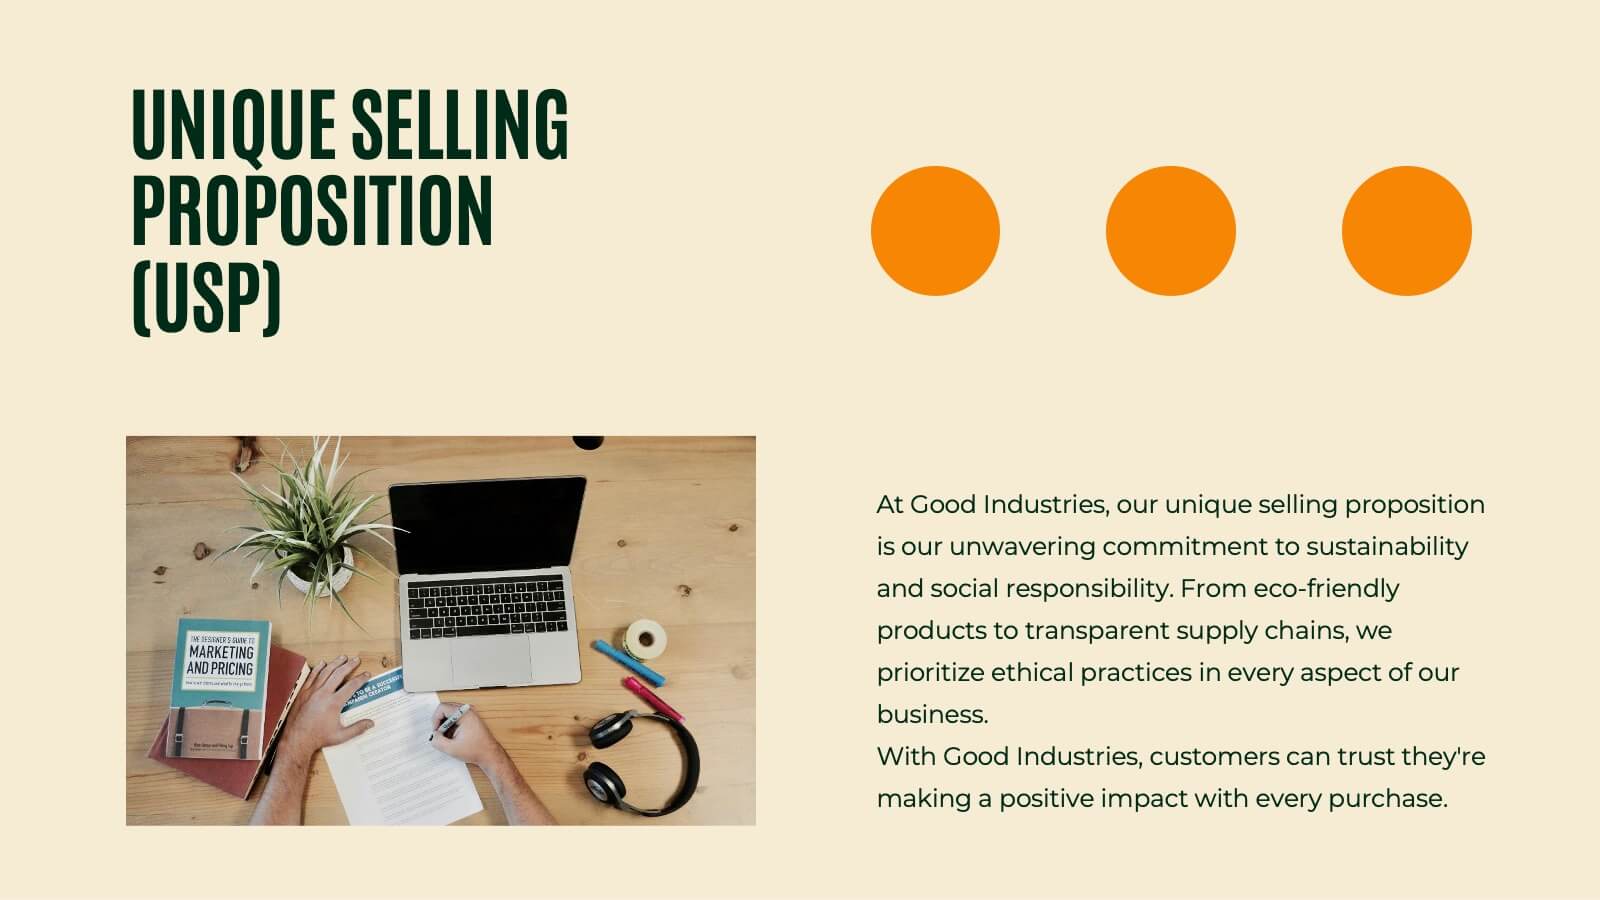
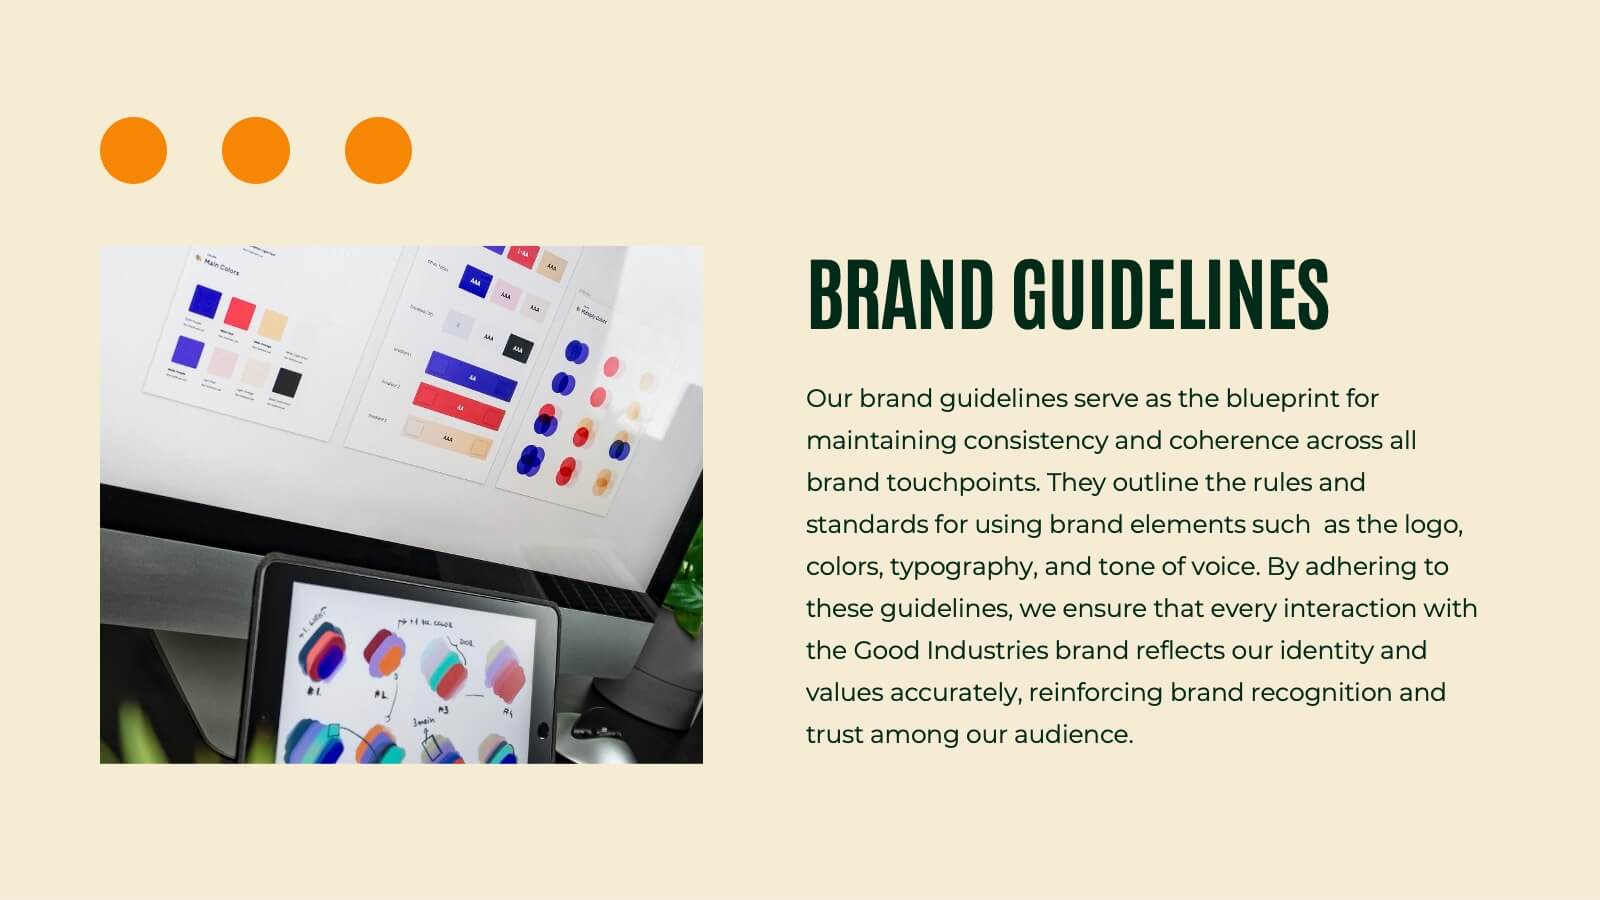
Introduce your brand's vision with this polished and professional strategy report presentation template. Designed for businesses, marketers, and branding agencies, it features comprehensive sections for communicating your brand identity, goals, and market positioning. This template highlights areas such as brand philosophy, target audience insights, competitive analysis, and visual identity systems. Showcase your brand’s unique selling proposition with engaging slides dedicated to colors, typography, logos, and packaging. With layouts tailored for presenting data, strategies, and case studies, you’ll ensure every aspect of your brand resonates clearly. Compatible with PowerPoint, Google Slides, and Keynote, this template is fully customizable to match your style and branding needs. Its clean, modern design and easy-to-edit structure make it a versatile choice for strategy reports, pitches, or team presentations. Elevate your branding efforts and communicate your story with confidence and clarity.


20 slides
Axisflare Artist Portfolio Presentation
Showcase your creative journey with this vibrant artist portfolio template, featuring sections for project highlights, philosophy, style, and client testimonials. Ideal for presenting your work and artistic approach, this template is compatible with PowerPoint, Keynote, and Google Slides for seamless presentation across various platforms.


6 slides
Agenda Network Infographic
Elevate your networking events with our sophisticated collection of agenda slide templates. These slides are crafted to structure and present the flow of activities at networking events, making them essential for coordinators who aim to foster professional connections among attendees. Each template is designed with clarity and style, featuring clean lines and modern graphics to outline key segments of your event, such as welcome remarks, networking sessions, panel discussions, and closing statements. The thoughtful layout includes designated spaces for time slots, session titles, and speaker details, ensuring that participants can easily follow the event's progression and plan their participation accordingly. These slides are fully customizable, allowing you to match the visual design with your event’s theme or corporate branding. The adaptable format makes it simple to insert or remove sections based on the specific needs of your event. Ideal for business conferences, industry meet-ups, or any professional gathering, these agenda slides help you manage and execute a seamless networking experience.


6 slides
Problem Statement Infographic
Unleash the potential of your strategic presentations with our Infographic Templates, specifically designed to clarify and emphasize core challenges within any project or discussion. This collection features a versatile array of templates, from minimalistic single-point layouts to more detailed multi-section designs. Each template is crafted to help you articulate critical issues effectively, ensuring your audience grasps the essence of the discussion quickly. Customization is a breeze with options to adjust colors, fonts, and text, allowing you to align each slide with your corporate identity seamlessly. Ideal for use in PowerPoint, Google Slides, and Keynote, these templates are perfect for consultants, project managers, and business strategists looking to present problem statements in a clear, impactful manner. Equip yourself with these tools to drive understanding and foster problem-solving discussions in any professional setting.


12 slides
Attention Interest Desire Actions Presentation
Spark curiosity from the very first slide with a bold, layered visual that turns complex ideas into a clear, memorable journey. This presentation walks viewers through each stage of your message, helping you build momentum and guide decisions with ease. Fully editable and compatible with PowerPoint, Keynote, and Google Slides.