


Features
- 7 Unique slides
- Fully editable and easy to edit in Microsoft Powerpoint, Keynote and Google Slides
- 16:9 widescreen layout
- Clean and professional designs
- Export to JPG, PDF or send by email


Do you have any questions?
Recommend


6 slides
5-Stage Sales Funnel Presentation
Visualize your sales process effortlessly with this 5-Stage Sales Funnel template. Ideal for showcasing lead conversion, customer journey, and sales strategies, this design is fully customizable. Adjust colors, text, and icons to fit your needs. Compatible with PowerPoint, Keynote, and Google Slides for seamless integration into your presentations.


12 slides
Leadership Development and Growth
Highlight leadership skills with this dynamic radar chart template, ideal for tracking individual or team competencies across six core areas. Use this layout to visualize progress in communication, strategy, vision, influence, adaptability, and accountability. Great for HR reviews, training evaluations, or performance dashboards. Fully editable in PowerPoint, Keynote, and Google Slides.


6 slides
Project Status Analysis Infographics
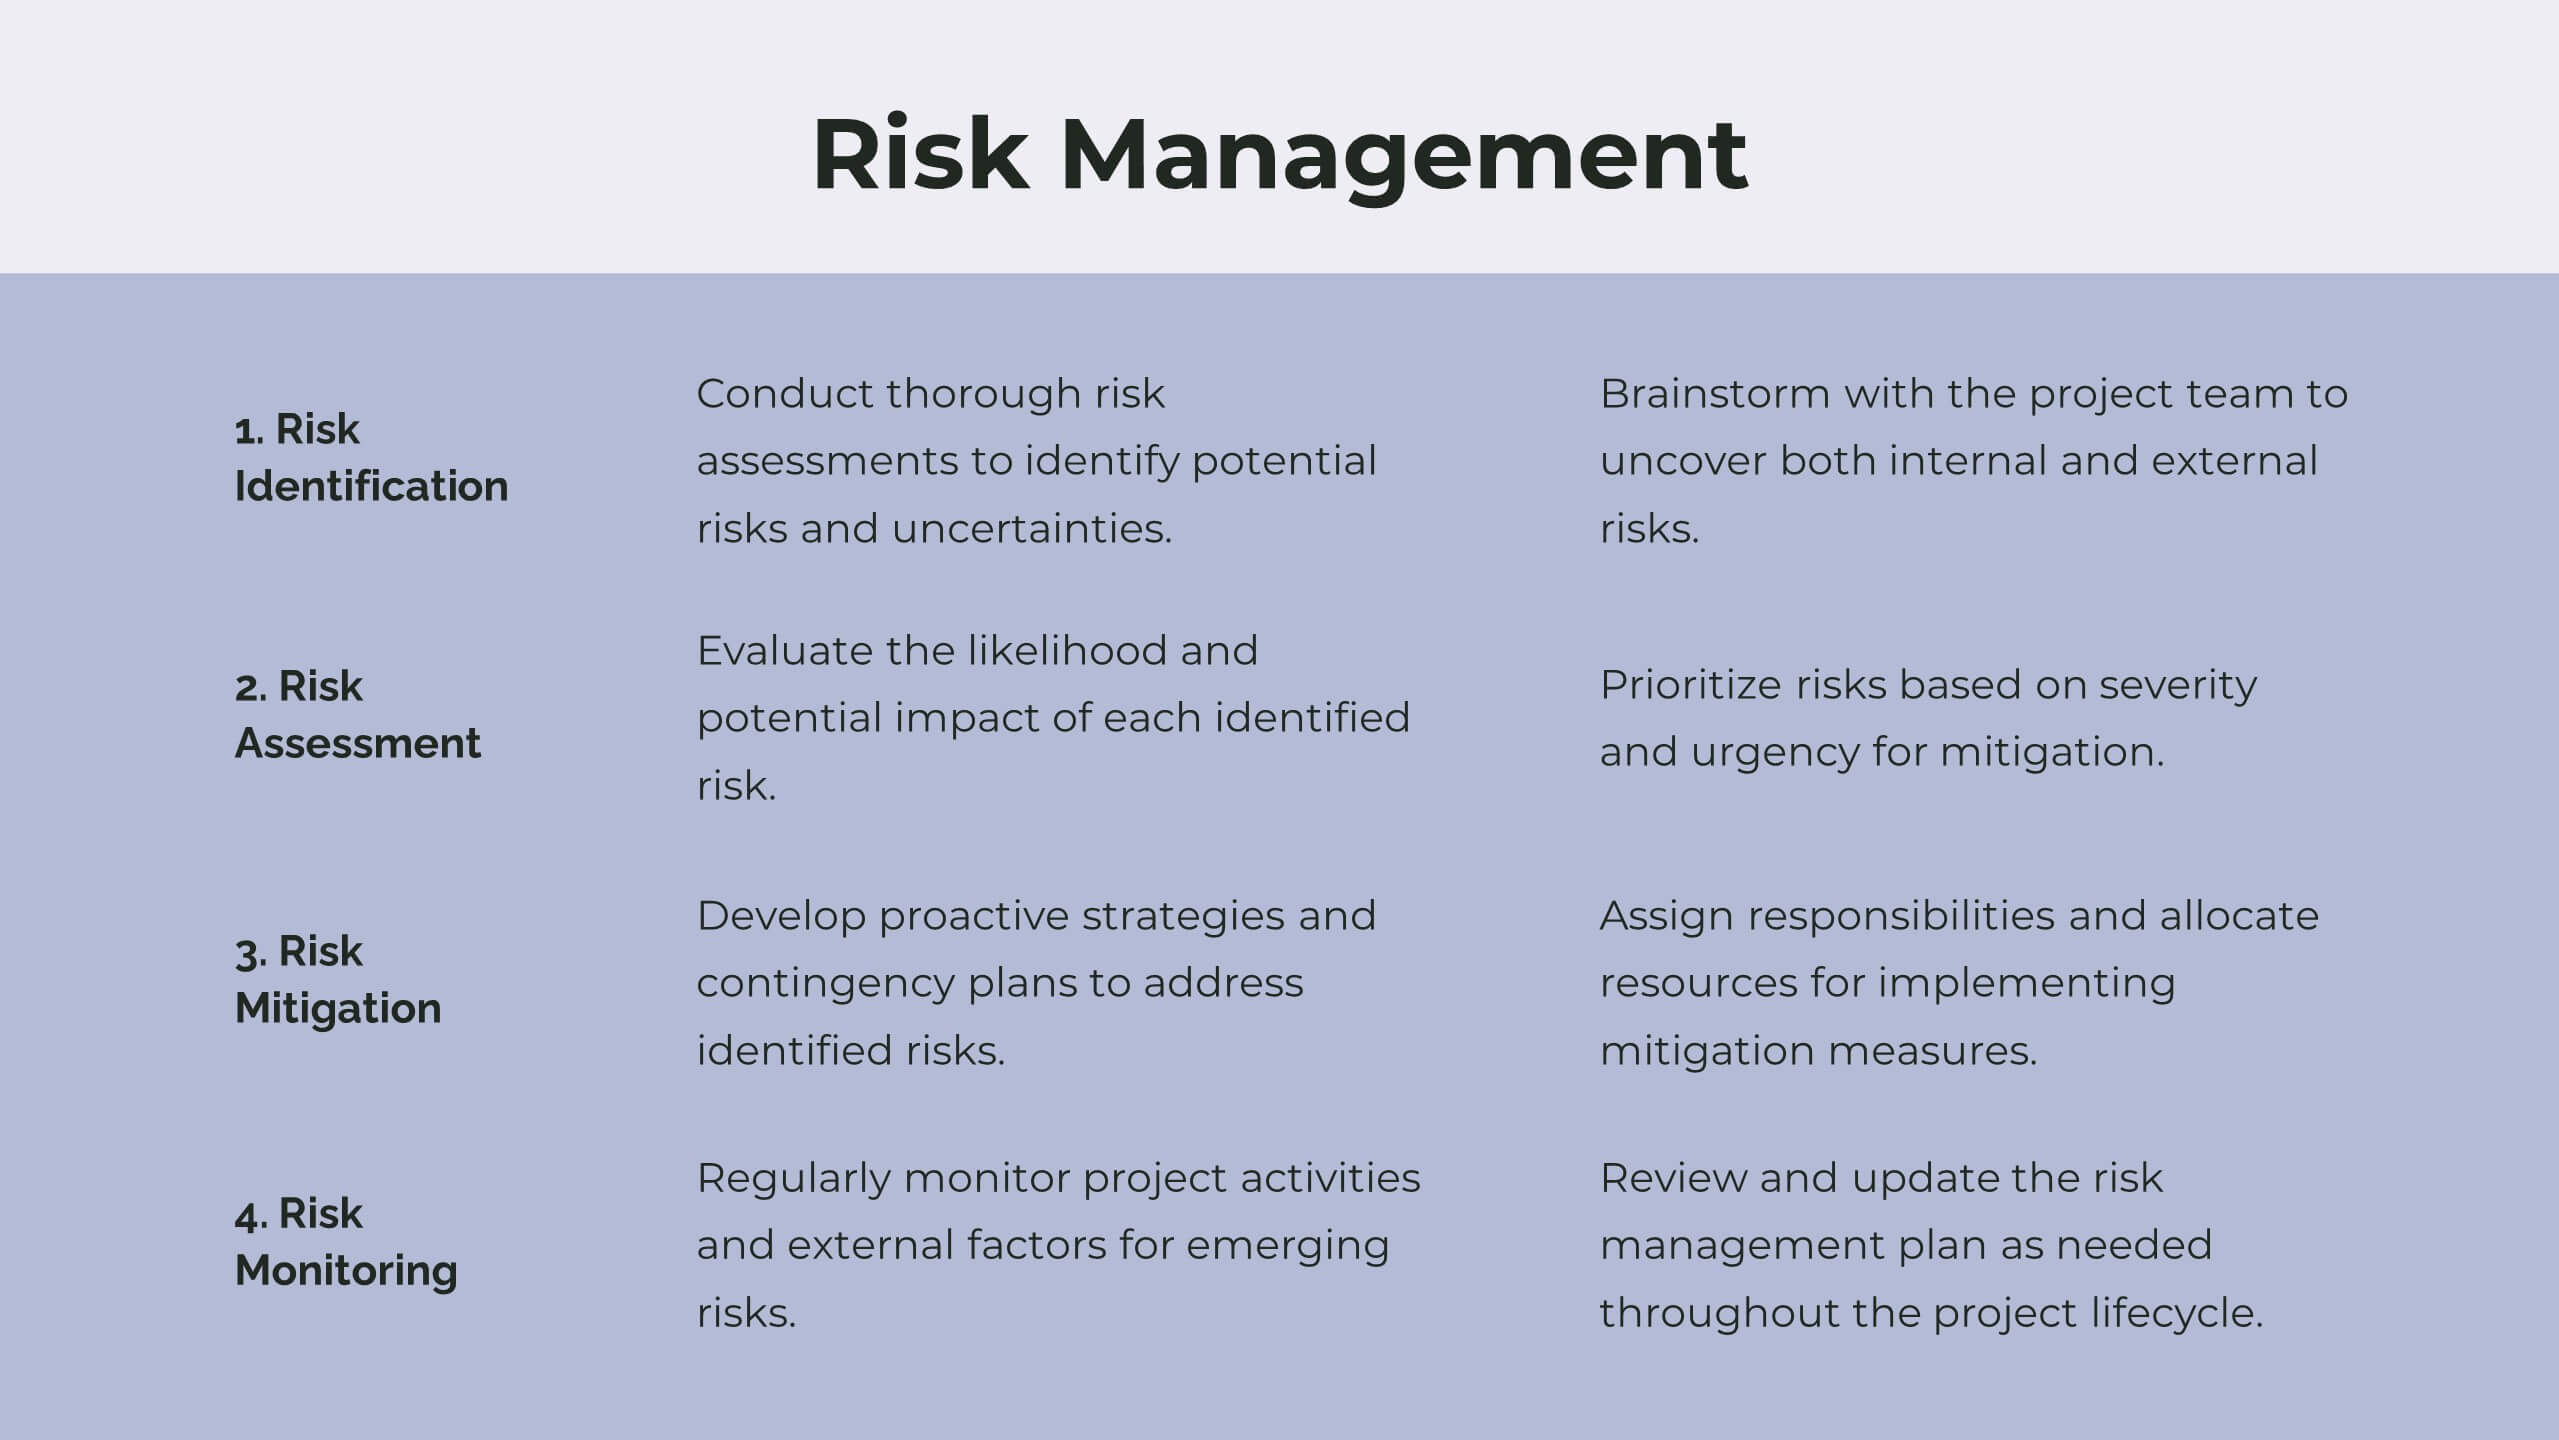
Analyze your project's status effectively with our Project Status Analysis infographic template. This template is fully compatible with popular presentation software like PowerPoint, Keynote, and Google Slides, allowing you to easily customize it to illustrate and communicate the key elements of project status analysis. The Project Status Analysis infographic template offers a visually engaging platform to depict project progress, milestones, risks, and key performance indicators. Whether you're a project manager, team leader, or business professional, this template provides a user-friendly canvas to create informative presentations and reports on your project's status. Optimize your project management and reporting with this SEO-optimized Project Status Analysis infographic template, thoughtfully designed for clarity and ease of use. Customize it to showcase project timelines, status updates, issue tracking, and strategies for project success, ensuring that your audience gains a comprehensive understanding of the project's current situation. Start crafting your personalized infographic today to excel in project status analysis.


4 slides
Regional Analytics for North America Map Presentation
Visualize key performance metrics by region with the Regional Analytics for North America Map Presentation. This slide layout combines stacked bar visuals with a detailed map, allowing you to compare data points across multiple regions. Ideal for reporting trends, KPIs, or market analysis. Fully editable in Canva, PowerPoint, and Google Slides.


7 slides
Development Team Infographic
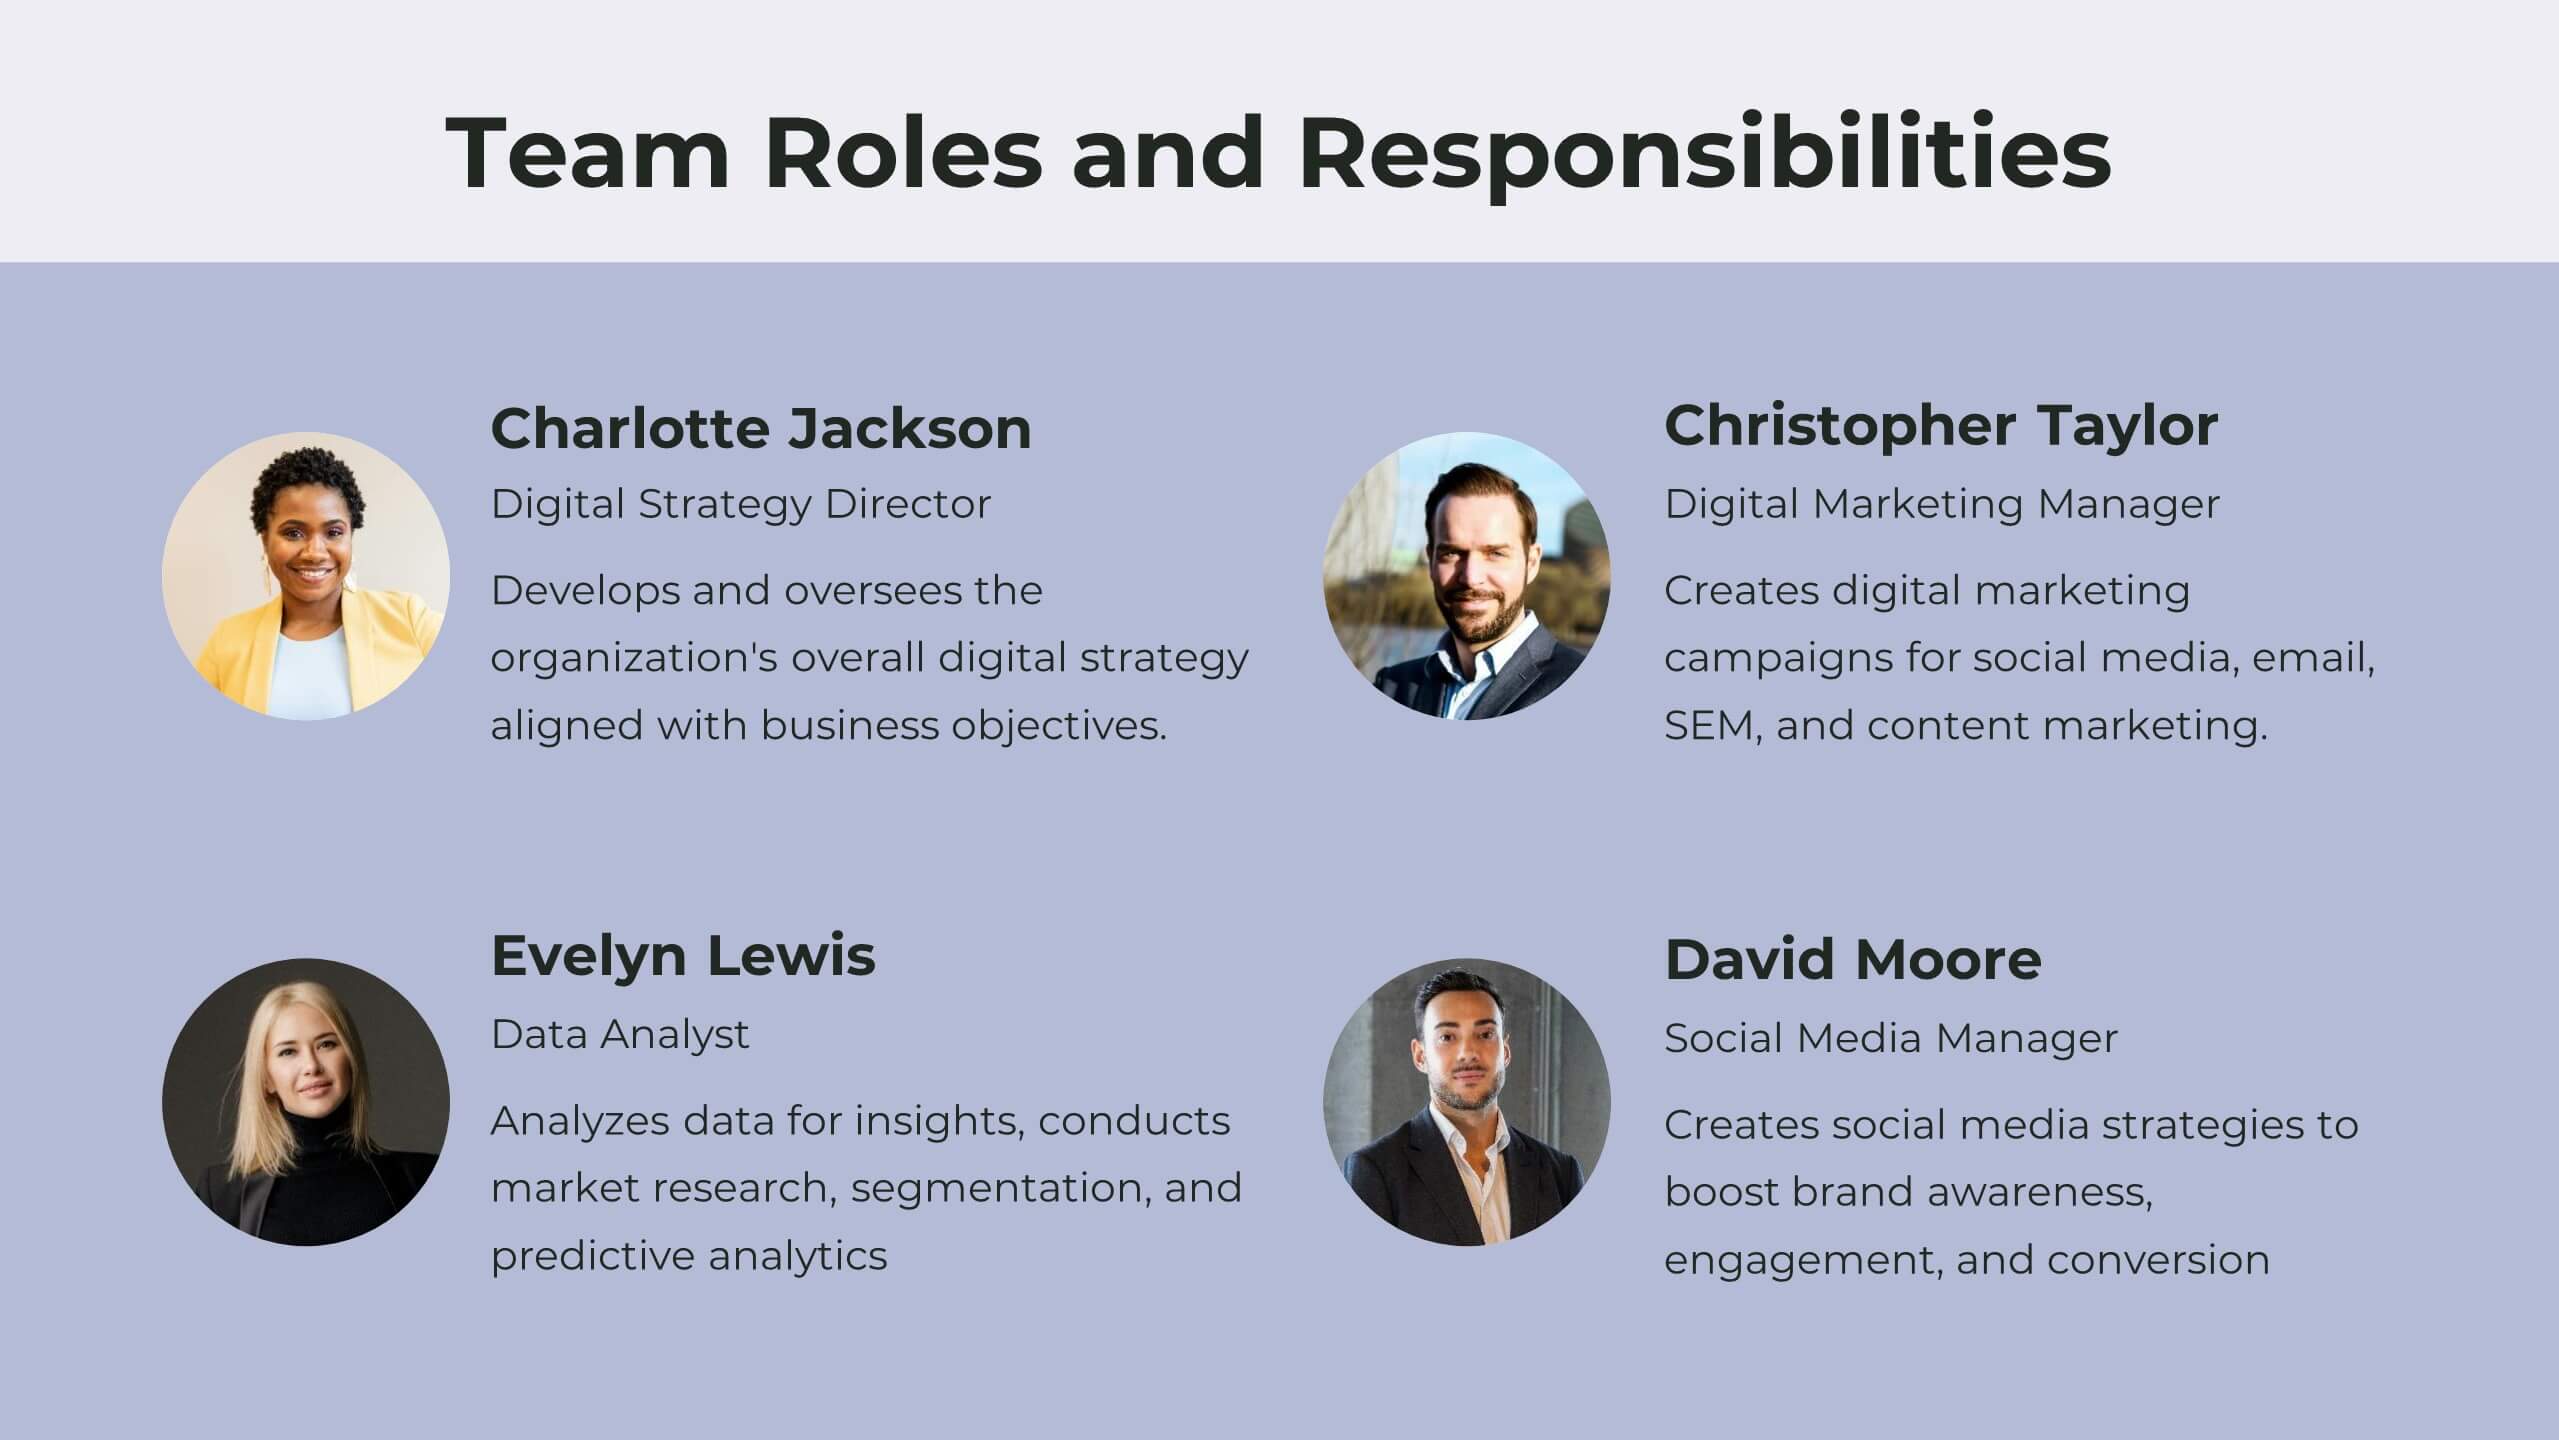
The showcased slides are meticulously designed for development teams, aiming to present key project details, timelines, and development processes effectively. The templates utilize a mixture of sleek designs and intuitive layouts that help visualize the complexities of software development and project management. The selection includes various infographic styles that cater to different informational needs such as workflow diagrams, progress timelines, and team structures.These templates are essential for development teams to communicate their strategies, milestones, and team roles clearly. They allow for the integration of technical data in a user-friendly manner, which can be crucial during stakeholder presentations or team meetings. With options ranging from minimalistic to data-rich layouts, these slides support detailed reporting and strategic planning, ensuring that every member of the team and stakeholders are on the same page regarding the project’s progression and objectives. The use of modern graphics and customizable elements also ensures that these presentations can be adapted to match the branding and aesthetic of different companies.


4 slides
Elegant Watercolor Background Presentation
Add a touch of sophistication to your presentation with soft watercolor textures that create a calming, professional atmosphere. Perfect for creative projects, proposals, or portfolios, this elegant design blends artistry with clarity. Fully compatible with PowerPoint, Keynote, and Google Slides for seamless customization and a refined visual finish.


5 slides
Business Process Cycle Presentation
Energize your message with a clean, visual journey that turns complex workflows into an easy-to-follow cycle. This presentation helps you explain stages, roles, and transitions with clarity while keeping your audience focused on what matters. Designed for business process overviews and strategy talks, it works seamlessly in PowerPoint, Keynote, and Google Slides.


27 slides
Creative Business Overview Presentation
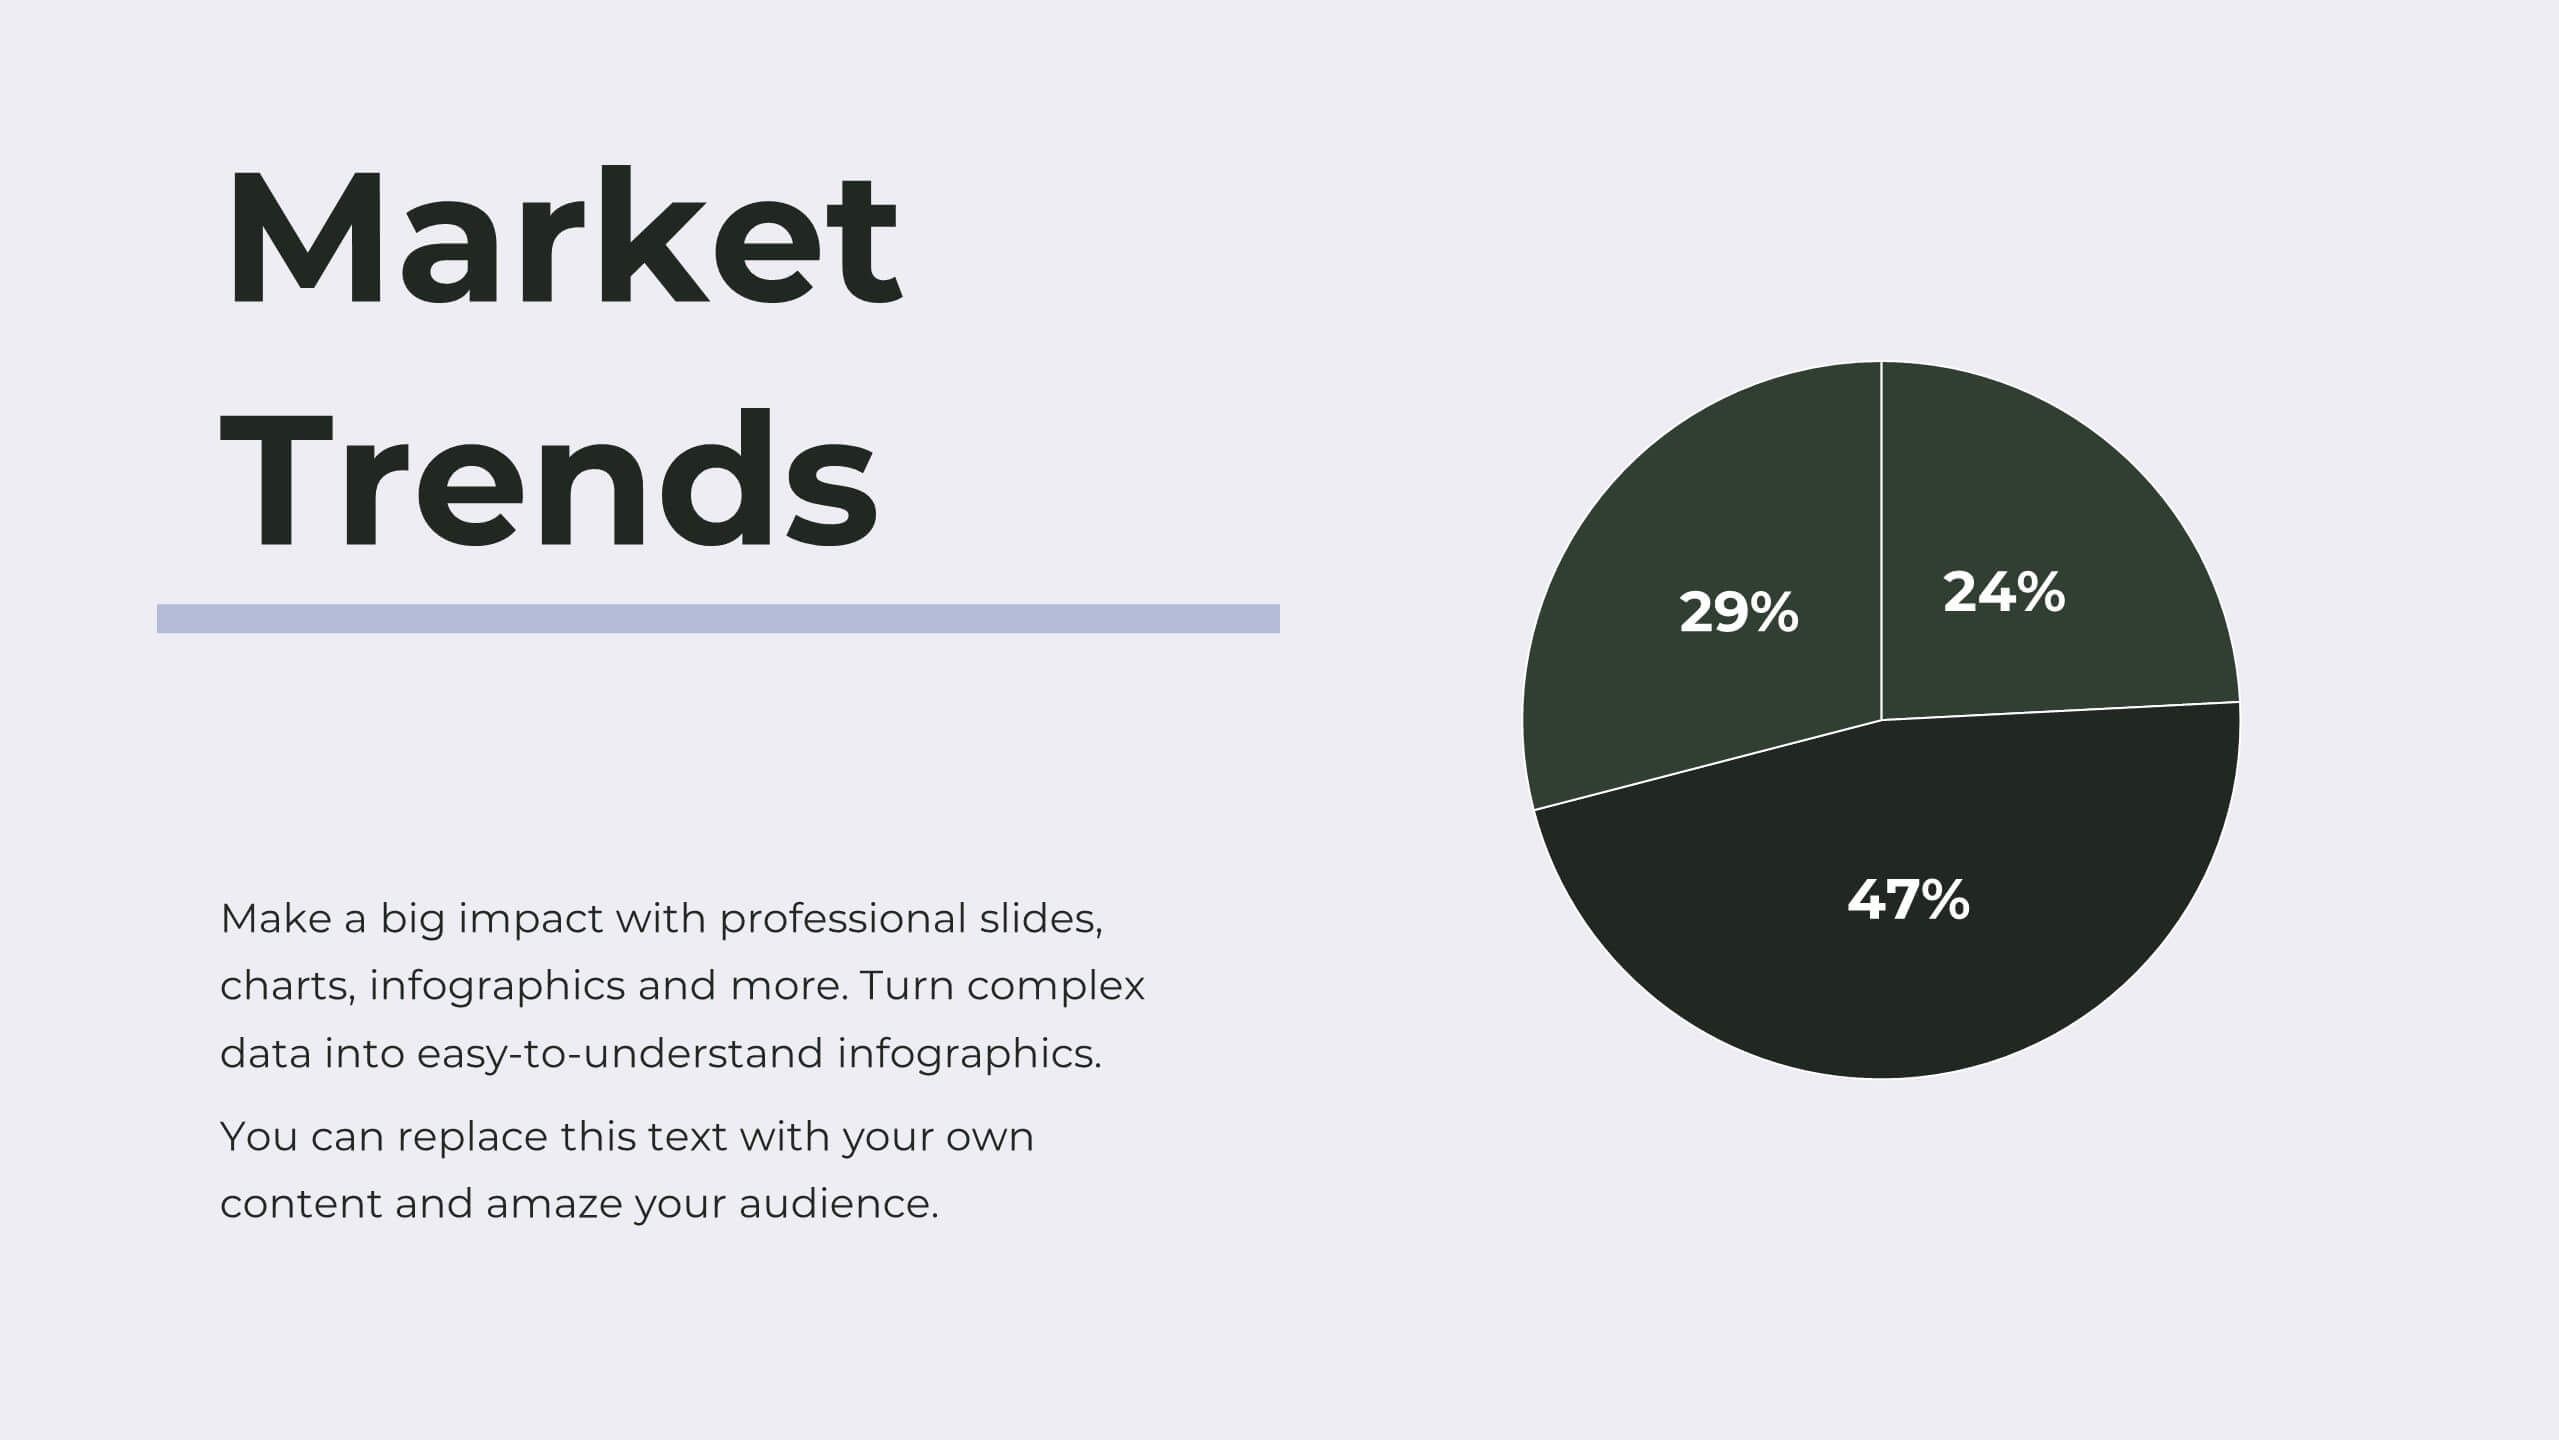
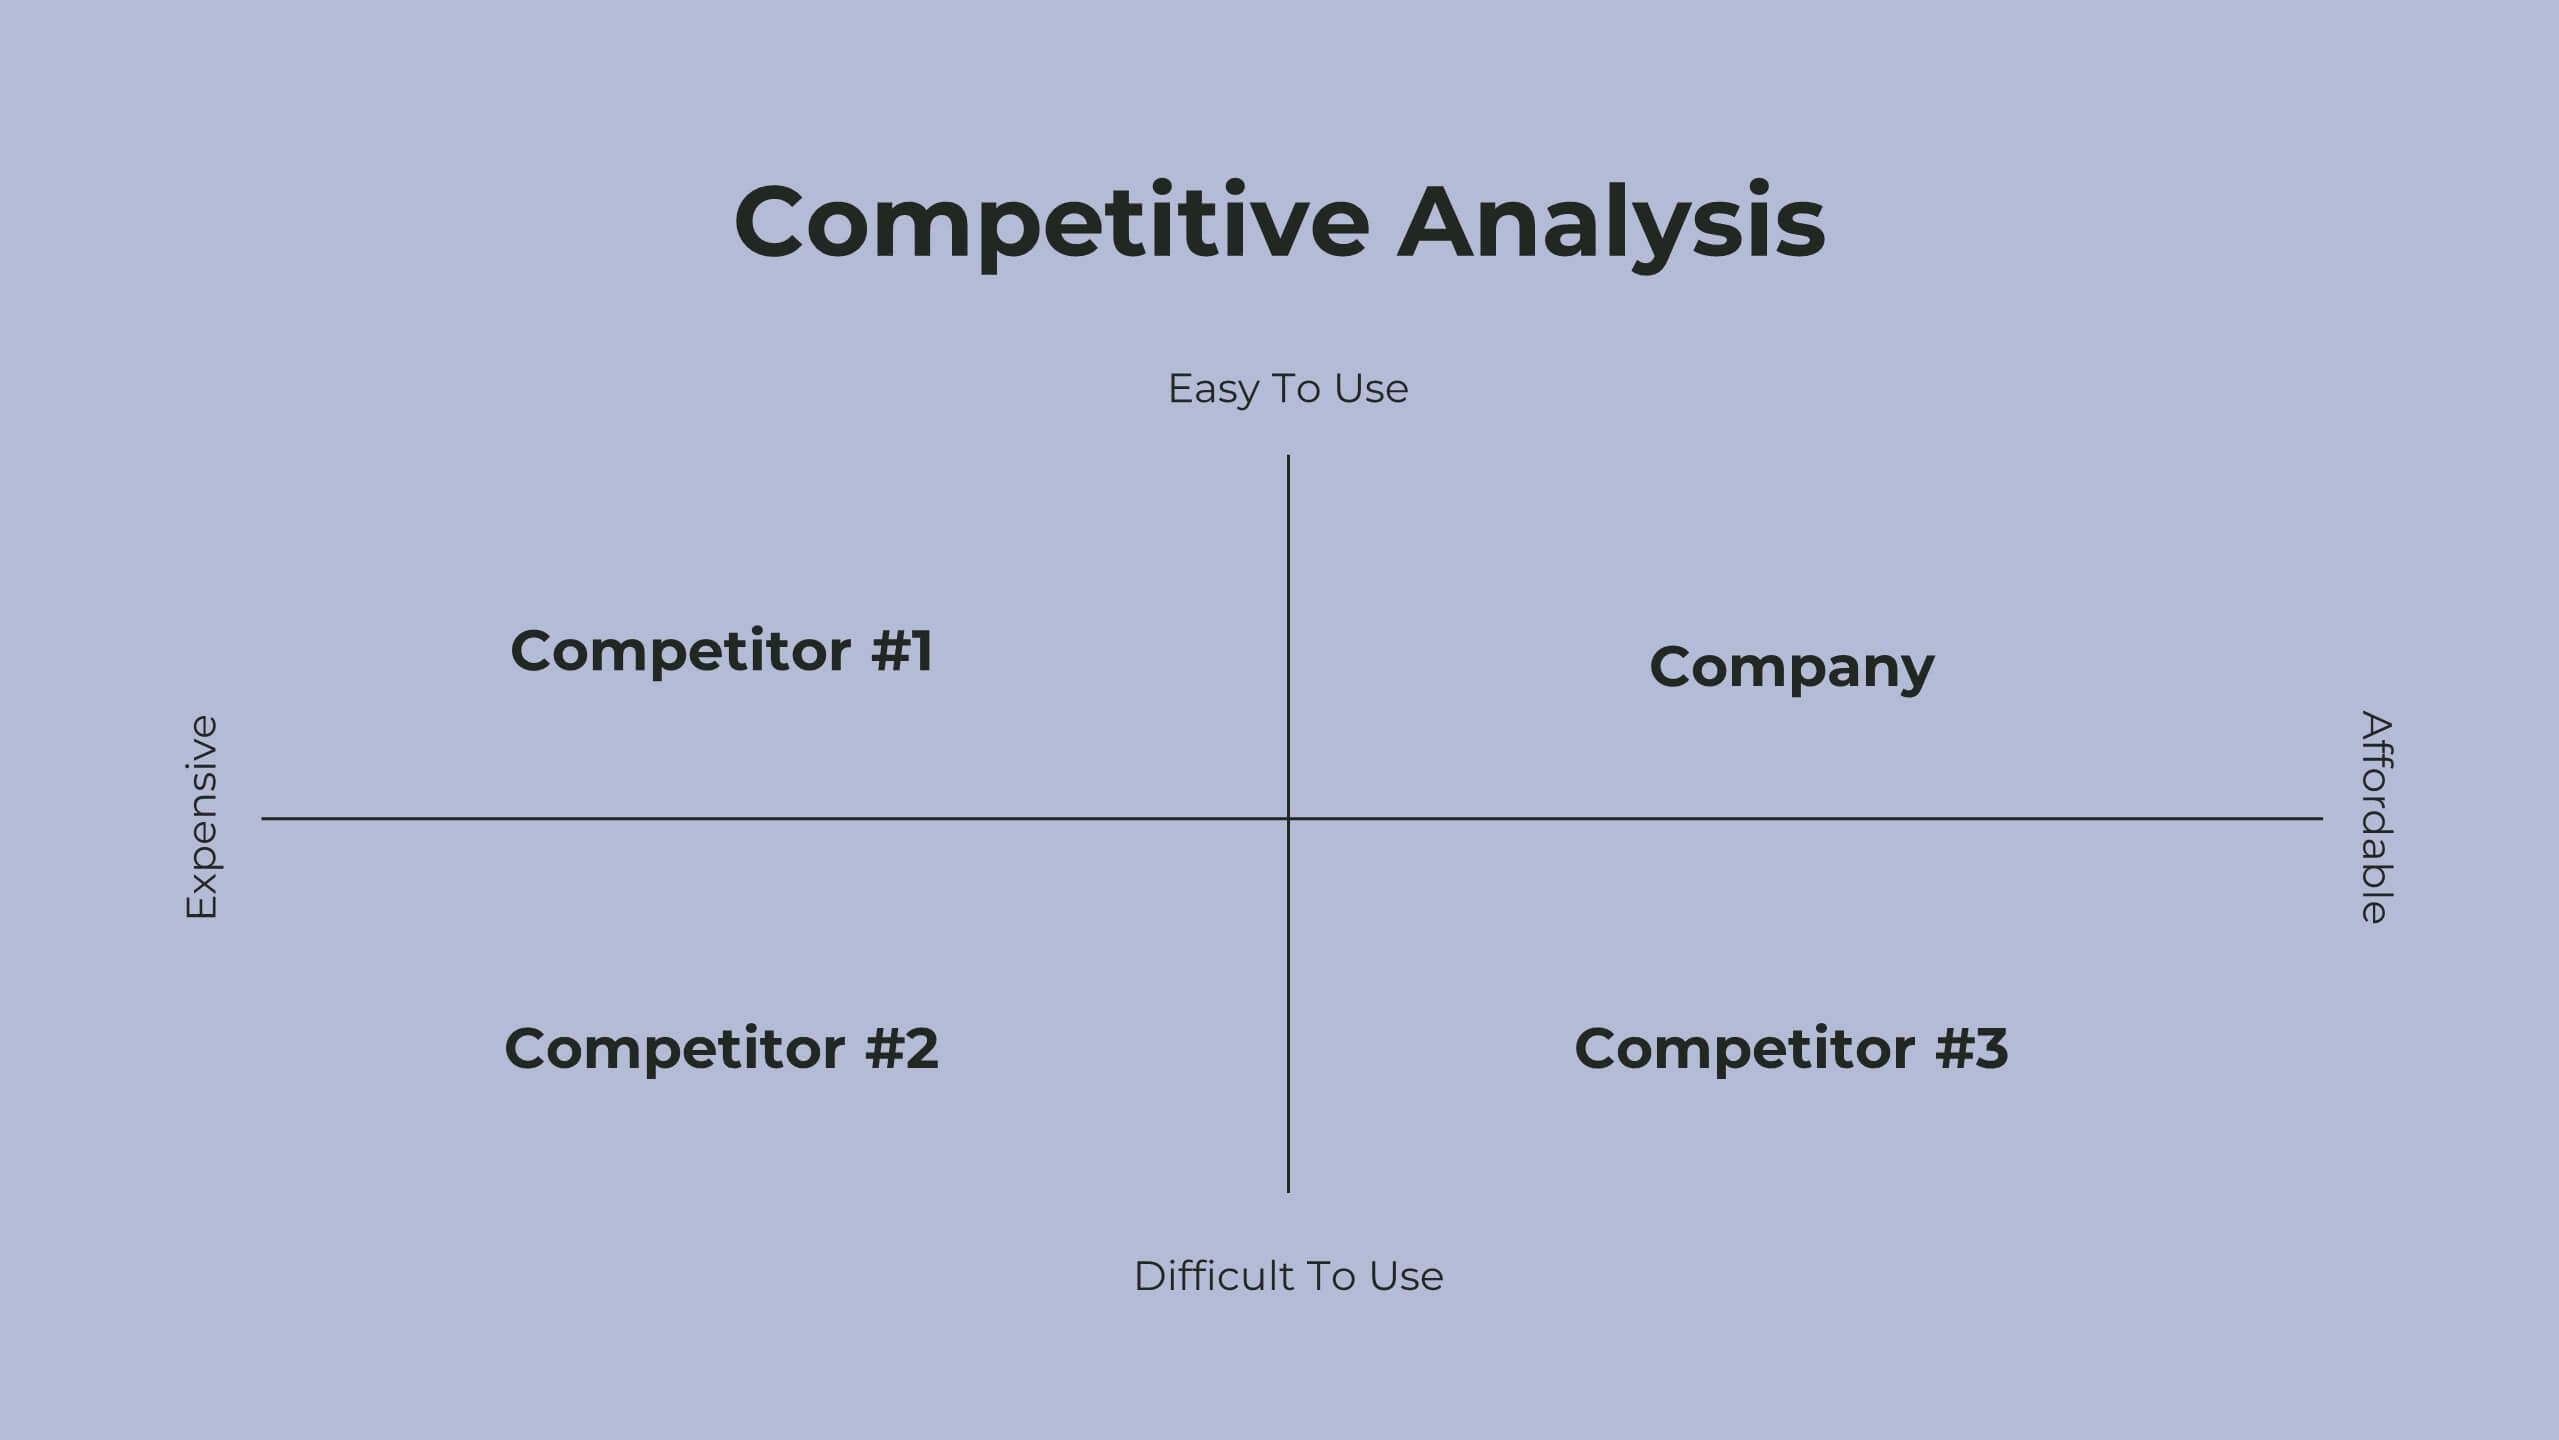
Enhance your corporate presentations with our comprehensive Business template. This resource includes detailed slides on SWOT analysis, market opportunities, strategic goals, and product details. Perfect for delivering a complete business overview, it's compatible with PowerPoint, Keynote, and Google Slides for seamless use in various professional settings.


5 slides
Online Video Games Infographics
Dive into the digital realm with our online video games infographics template, tailored in striking shades of purple, blue, pink, and black that echo the electric ambiance of the gaming world. This dynamic ensemble, perfect for game developers, and gaming communities, brings to life the universe of online gaming. Compatible with Powerpoint, Keynote, and Google Slides. It features creative graphics and gaming icons, capturing everything from player statistics to game mechanics. Whether you're spotlighting trends or unveiling a revolutionary game, this template levels up your presentation, engaging your audience right from the start screen.


22 slides
Jade Graphic Design Project Plan Presentation
Unleash creativity with this vibrant Graphic Design Project template! Perfect for showcasing your design process, prototypes, and assets, it keeps the audience captivated with clean visuals and a fresh, modern look. Whether you're outlining color palettes or final designs, every slide exudes style. Ideal for PowerPoint, Keynote, and Google Slides!


6 slides
Customer Loyalty Rewards Structure Presentation
Illustrate your brand’s customer retention strategy with the Customer Loyalty Rewards Structure presentation. This visually engaging template highlights reward tiers, perks, and loyalty card systems—perfect for showcasing how customers earn incentives over time. Ideal for marketing teams, retail businesses, and loyalty program proposals. Fully editable in PowerPoint, Keynote, and Google Slides.


2 slides
Visual Resume and Project Gallery Presentation
Showcase your personality and creative work with the Visual Resume and Project Gallery Presentation. This vibrant layout blends a professional “About Me” section with a clean, image-focused gallery—ideal for designers, freelancers, or artists. Fully editable in Canva, PowerPoint, Keynote, and Google Slides for easy customization and seamless presentation.


4 slides
Frequently Asked Questions (FAQ) Presentation
Enhance your FAQ section with this modern and visually structured presentation slide. Featuring a bold question mark icon, this template allows you to clearly organize and present key questions and answers in a professional and engaging format. Perfect for customer service, business proposals, and informational presentations, this slide is fully customizable with editable text, colors, and layouts. Compatible with PowerPoint, Keynote, and Google Slides for easy integration.


7 slides
McKinsey Business Infographic
The McKinsey 7S Model is a management model developed by consulting company McKinsey & Company. This infographic template offers a framework to analyze and align various internal aspects of an organization to ensure its success and effectiveness. Compatible with Powerpoint, Keynote, and Google Slides. Customize the content, design, and visuals to craft an engaging and informative infographic that showcases McKinsey & Company's global impact and expertise in transforming businesses. This business infographic should serve as a snapshot of McKinsey's core strengths and values.


5 slides
Pricing Structure and Cost Allocation Presentation
Show stakeholders how every dollar works with this colorful arc-style financial slide. Explain product tiers, service fees, or project budgets in clear segments that highlight what matters most. Ideal for finance updates, sales decks, or board reviews, and fully compatible with PowerPoint, Keynote, and Google Slides for seamless team collaboration.


5 slides
Monthly Report Statistics Infographics
A Monthly Report is a document that provides an overview of activities, progress, achievements, and challenges within a specific month. These infographic templates are designed to present monthly data and statistics in a clear and engaging manner. These infographics will help you showcase key information effectively. This is perfect for preparing reports for management, stakeholders, clients, or colleagues, this template will help you communicate your findings clearly and impressively. Compatible with Powerpoint, Keynote, and Google Slides, its customizable design and visual appeal will ensures that your monthly reports are engaging and informative.

23 slides
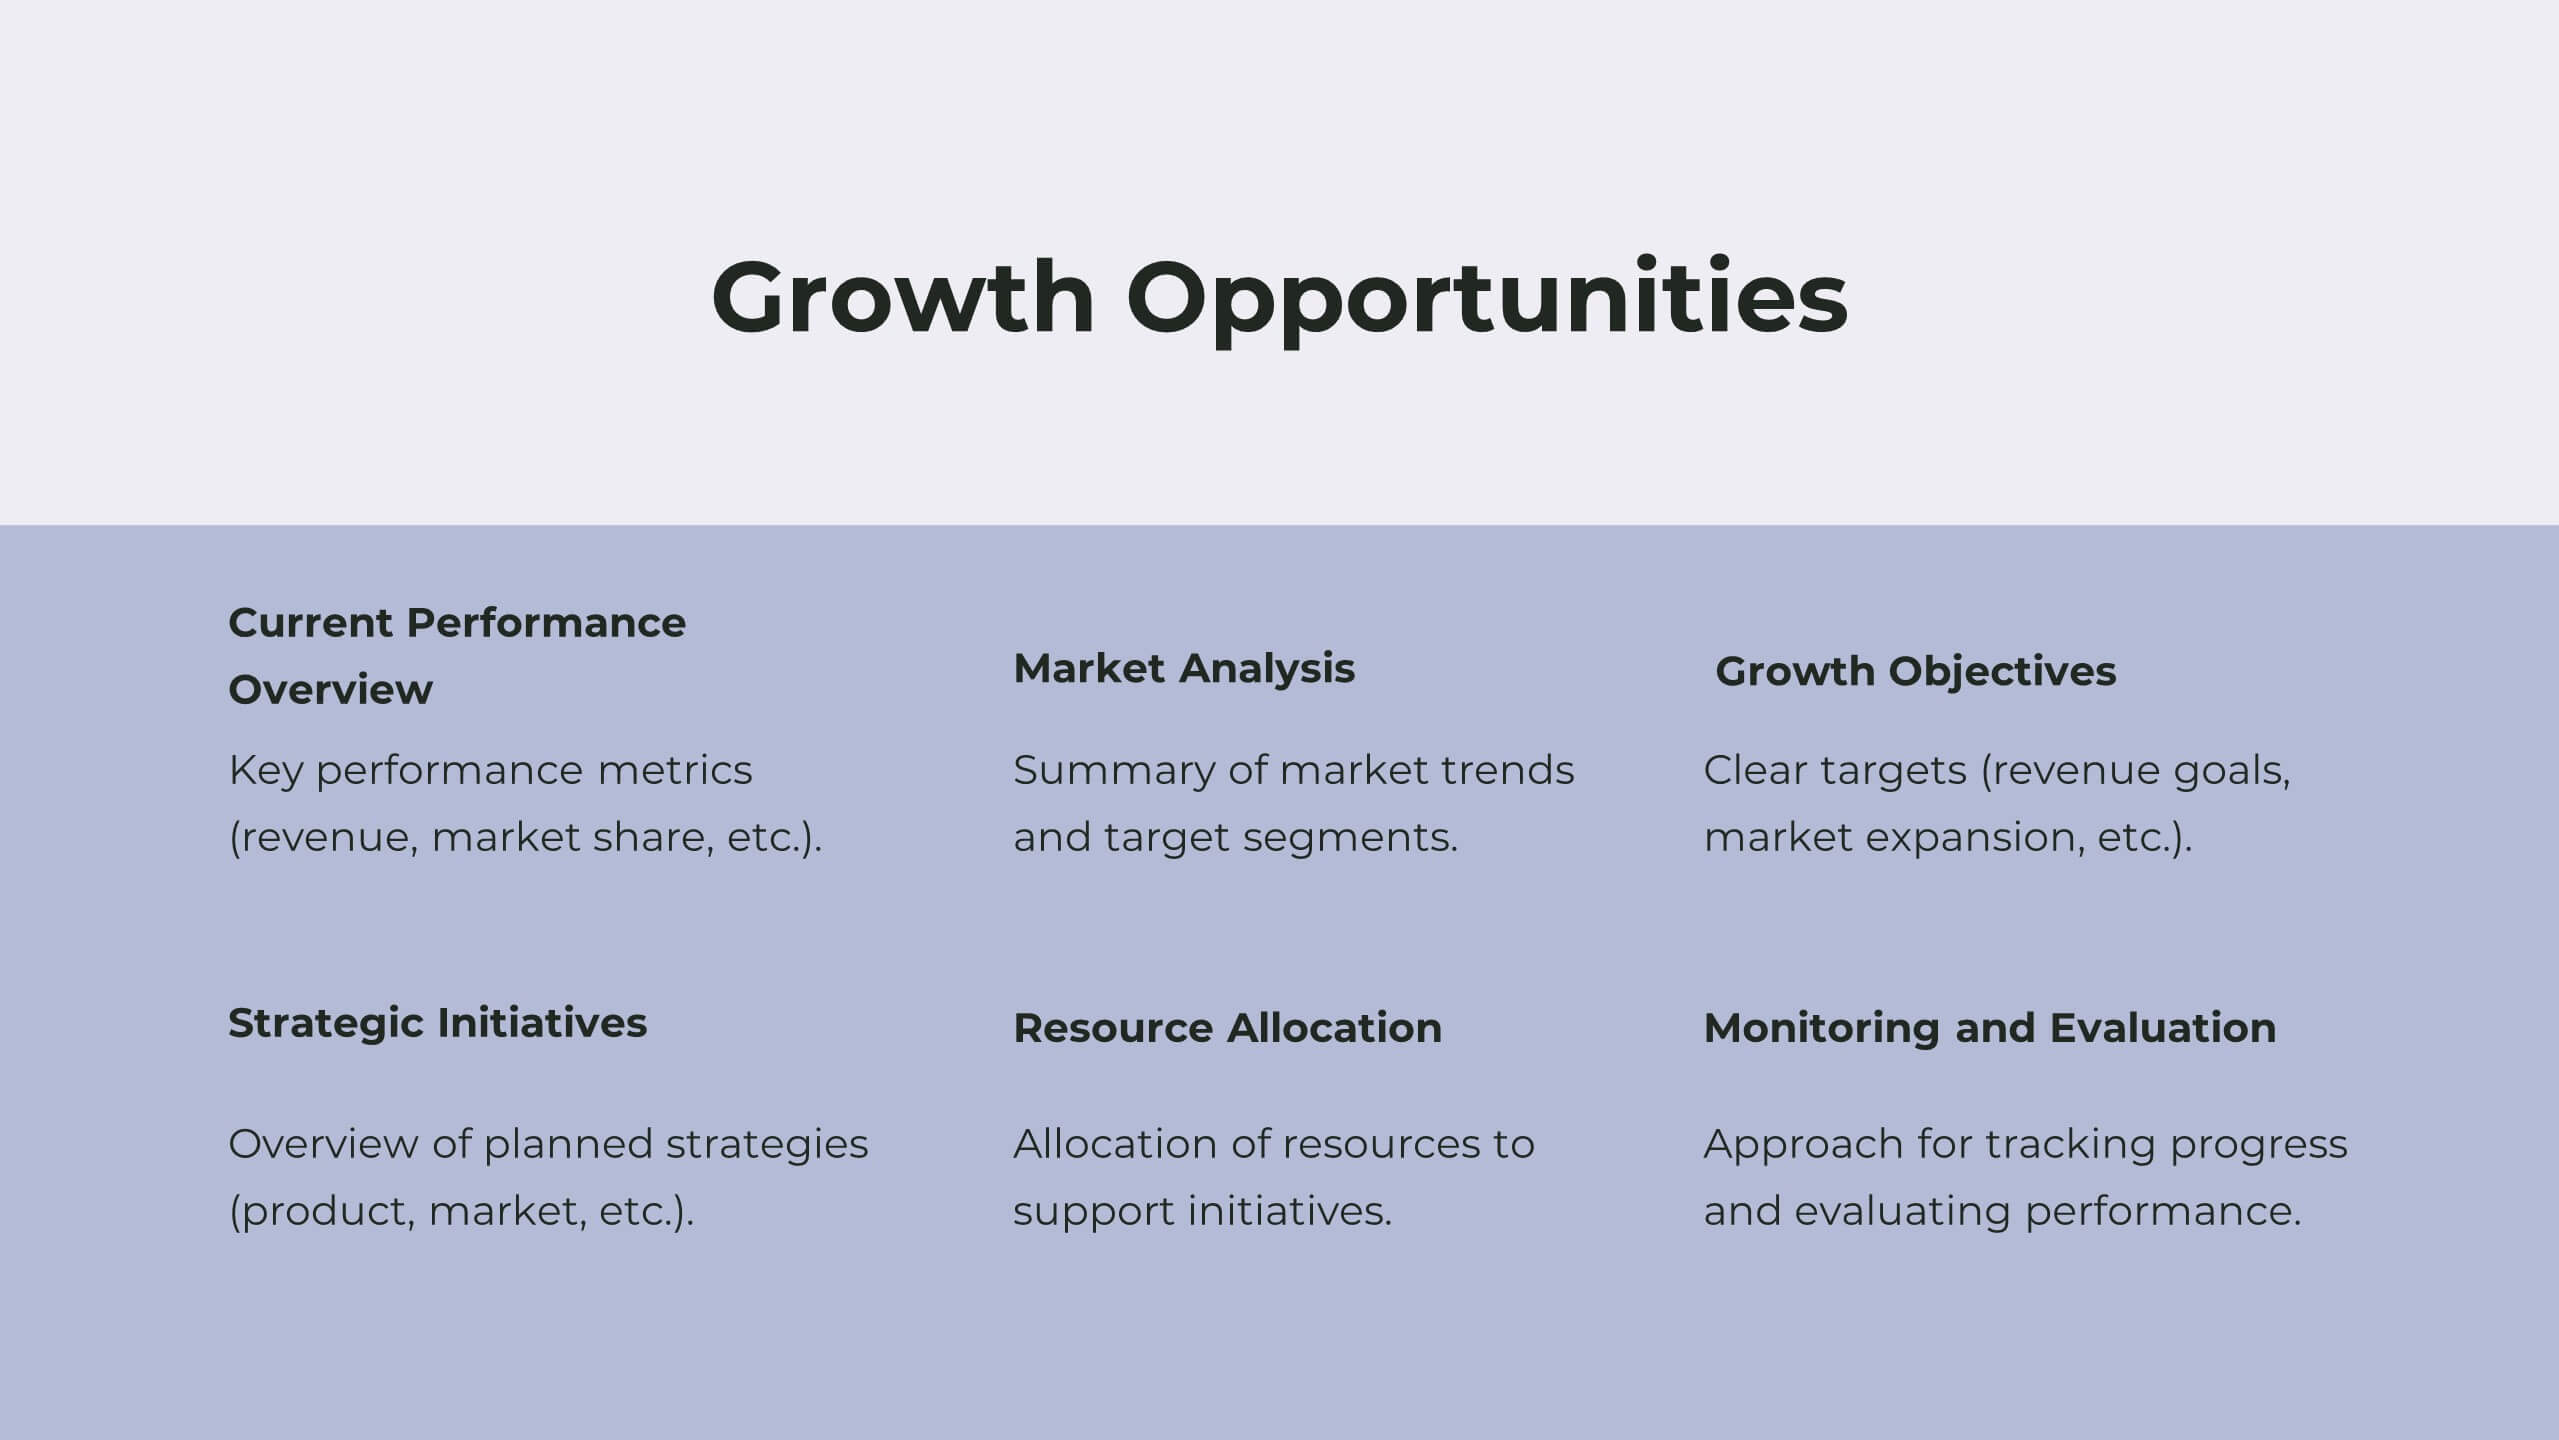
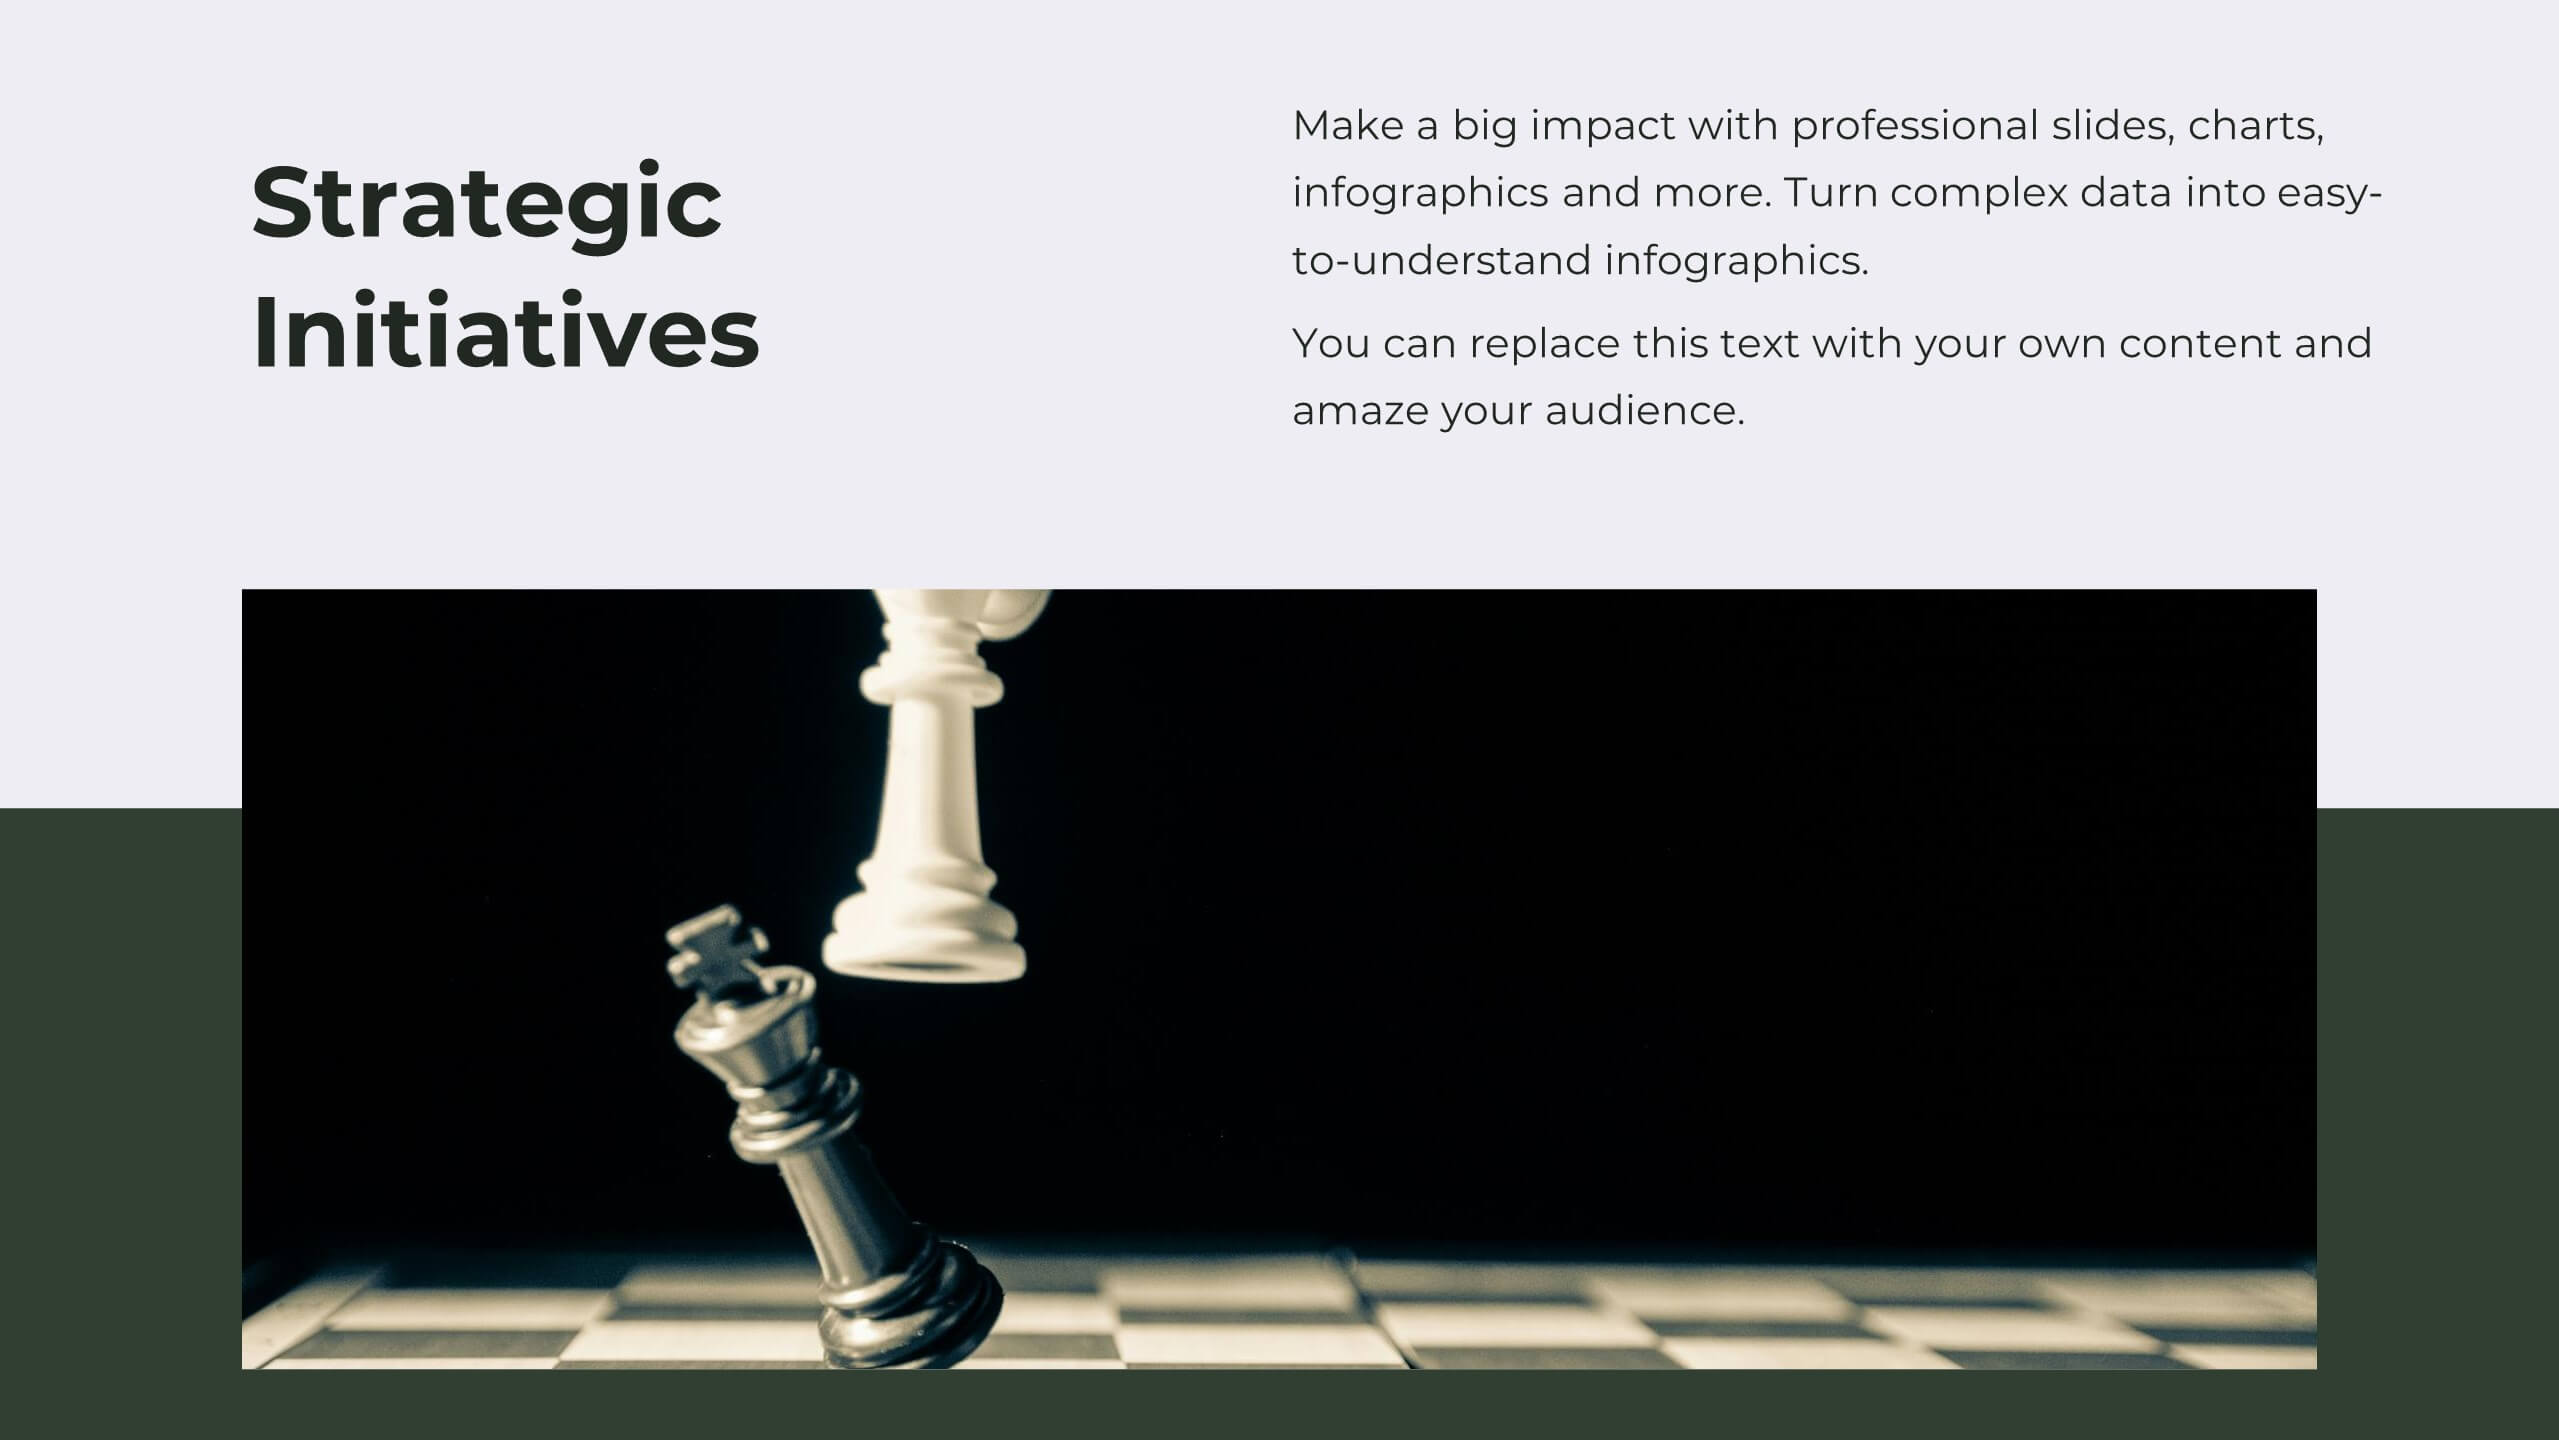
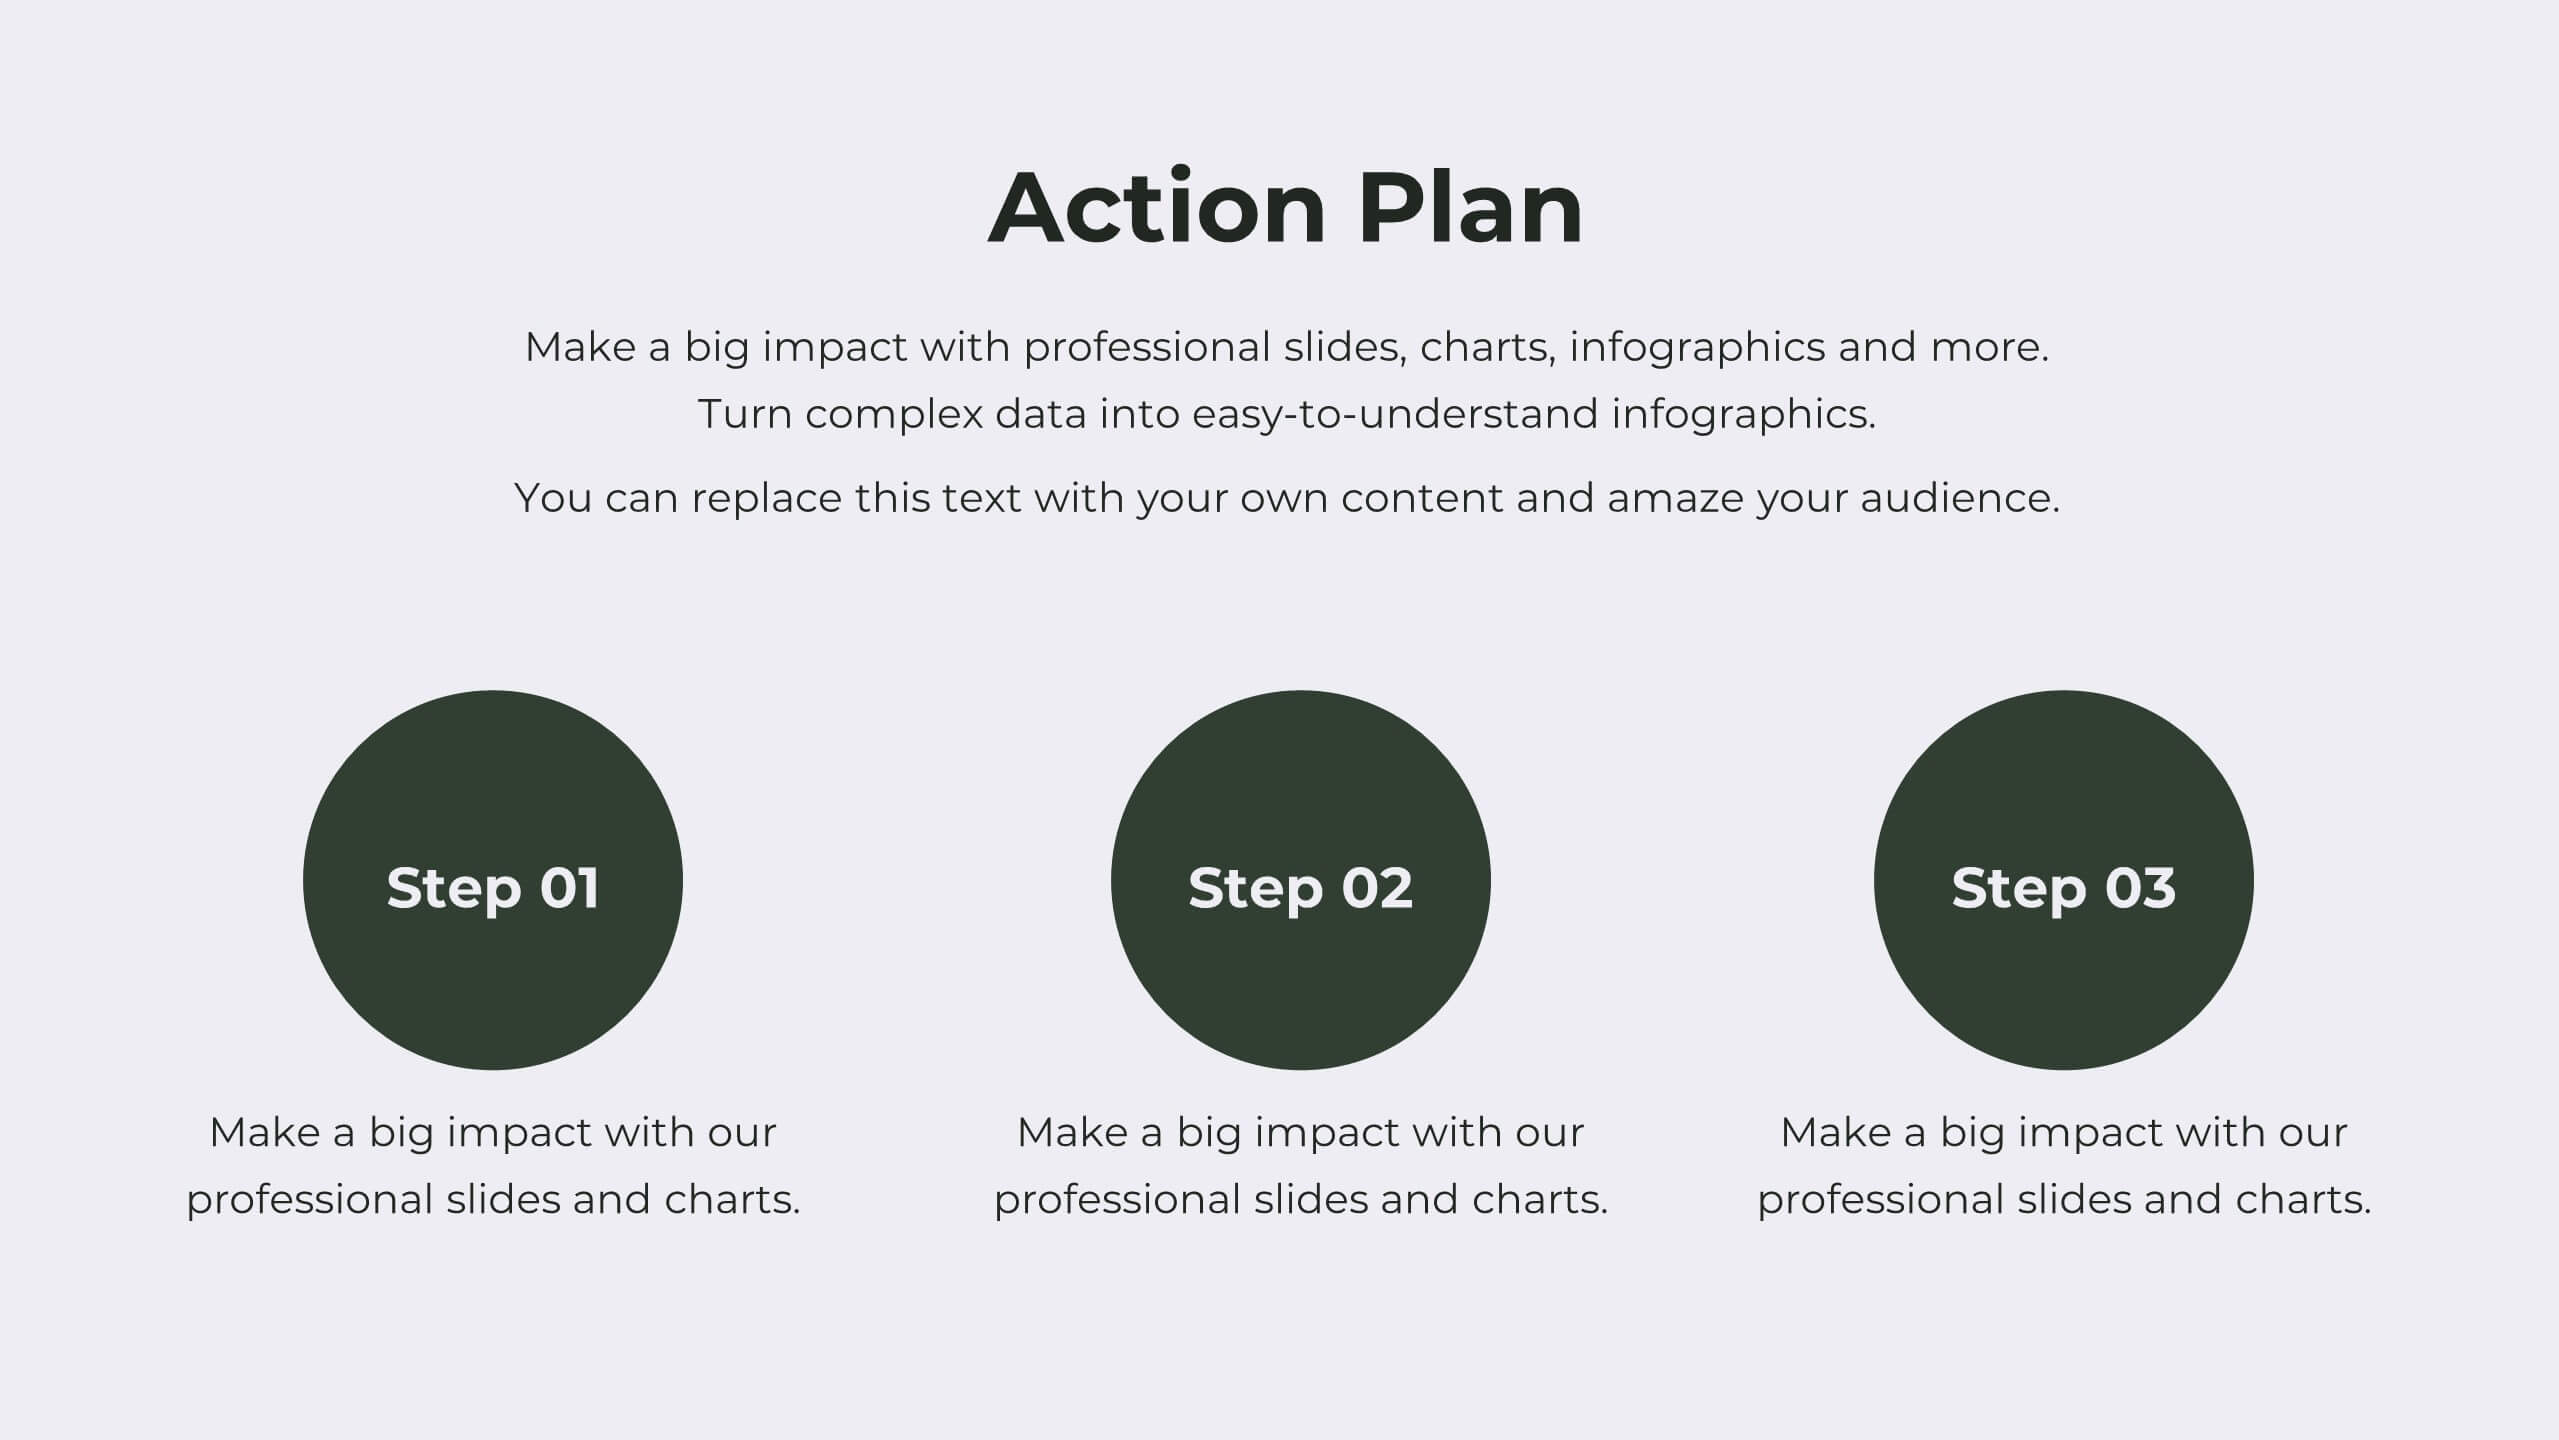
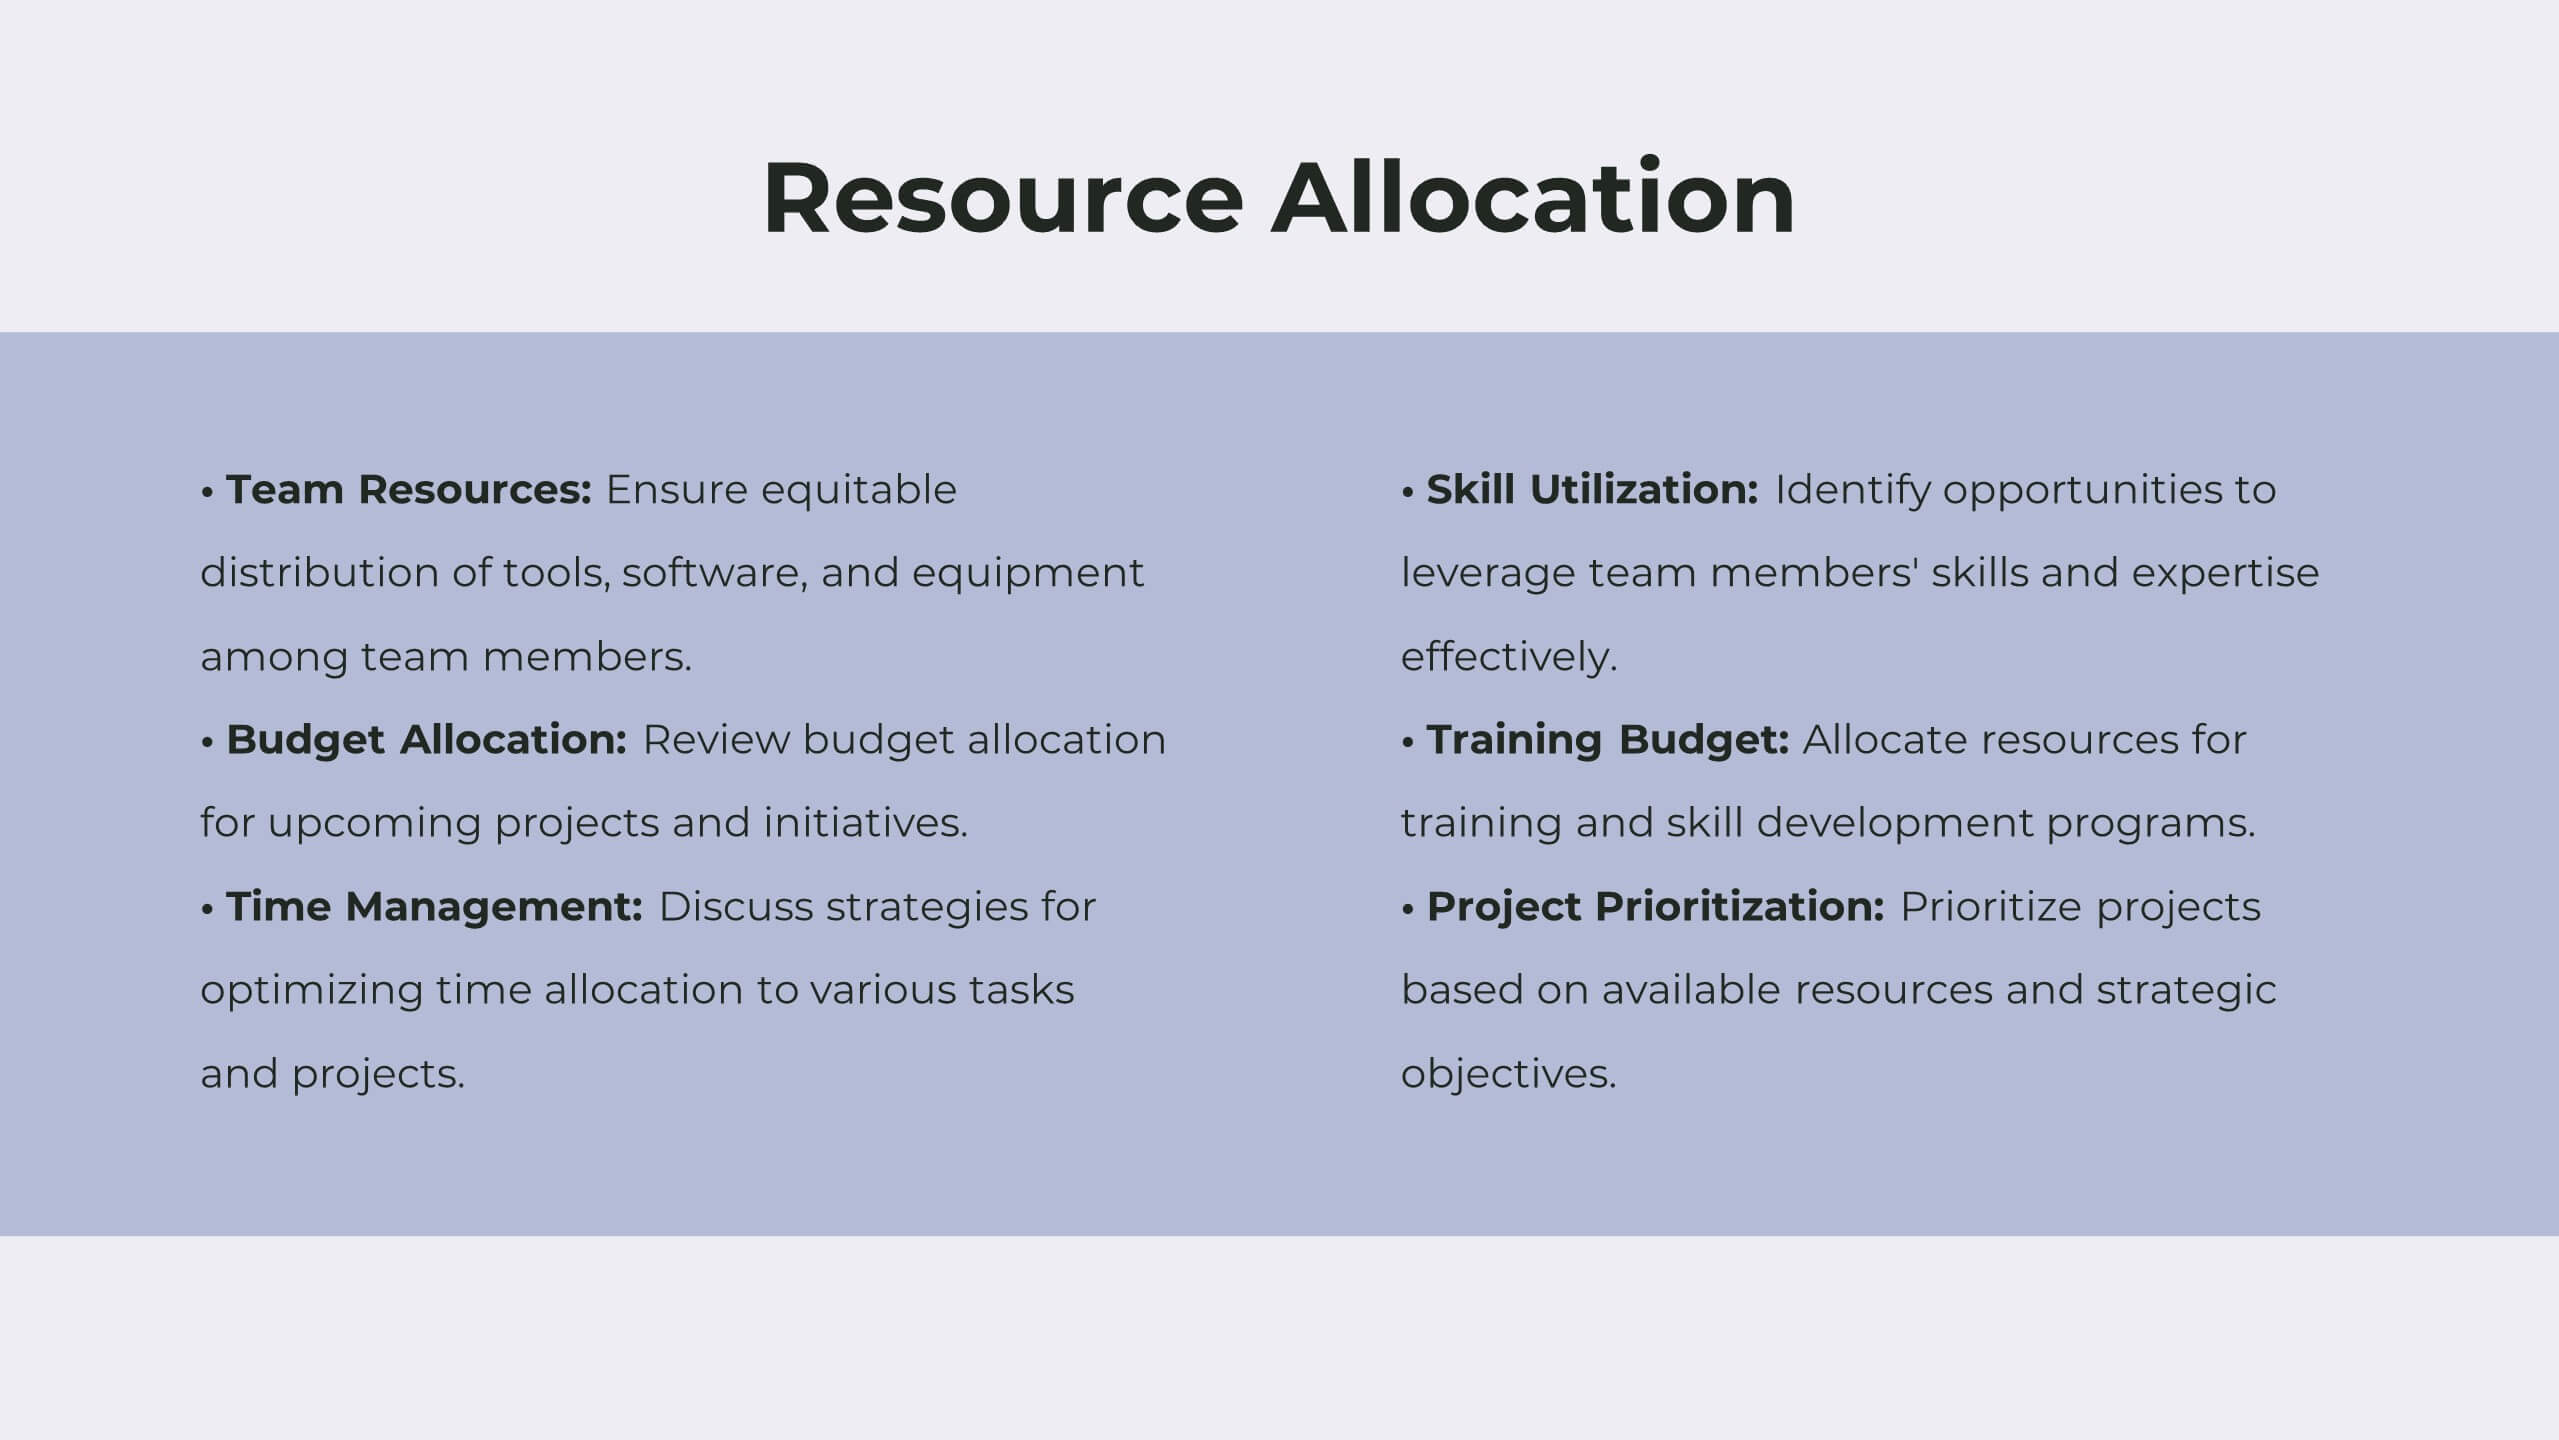
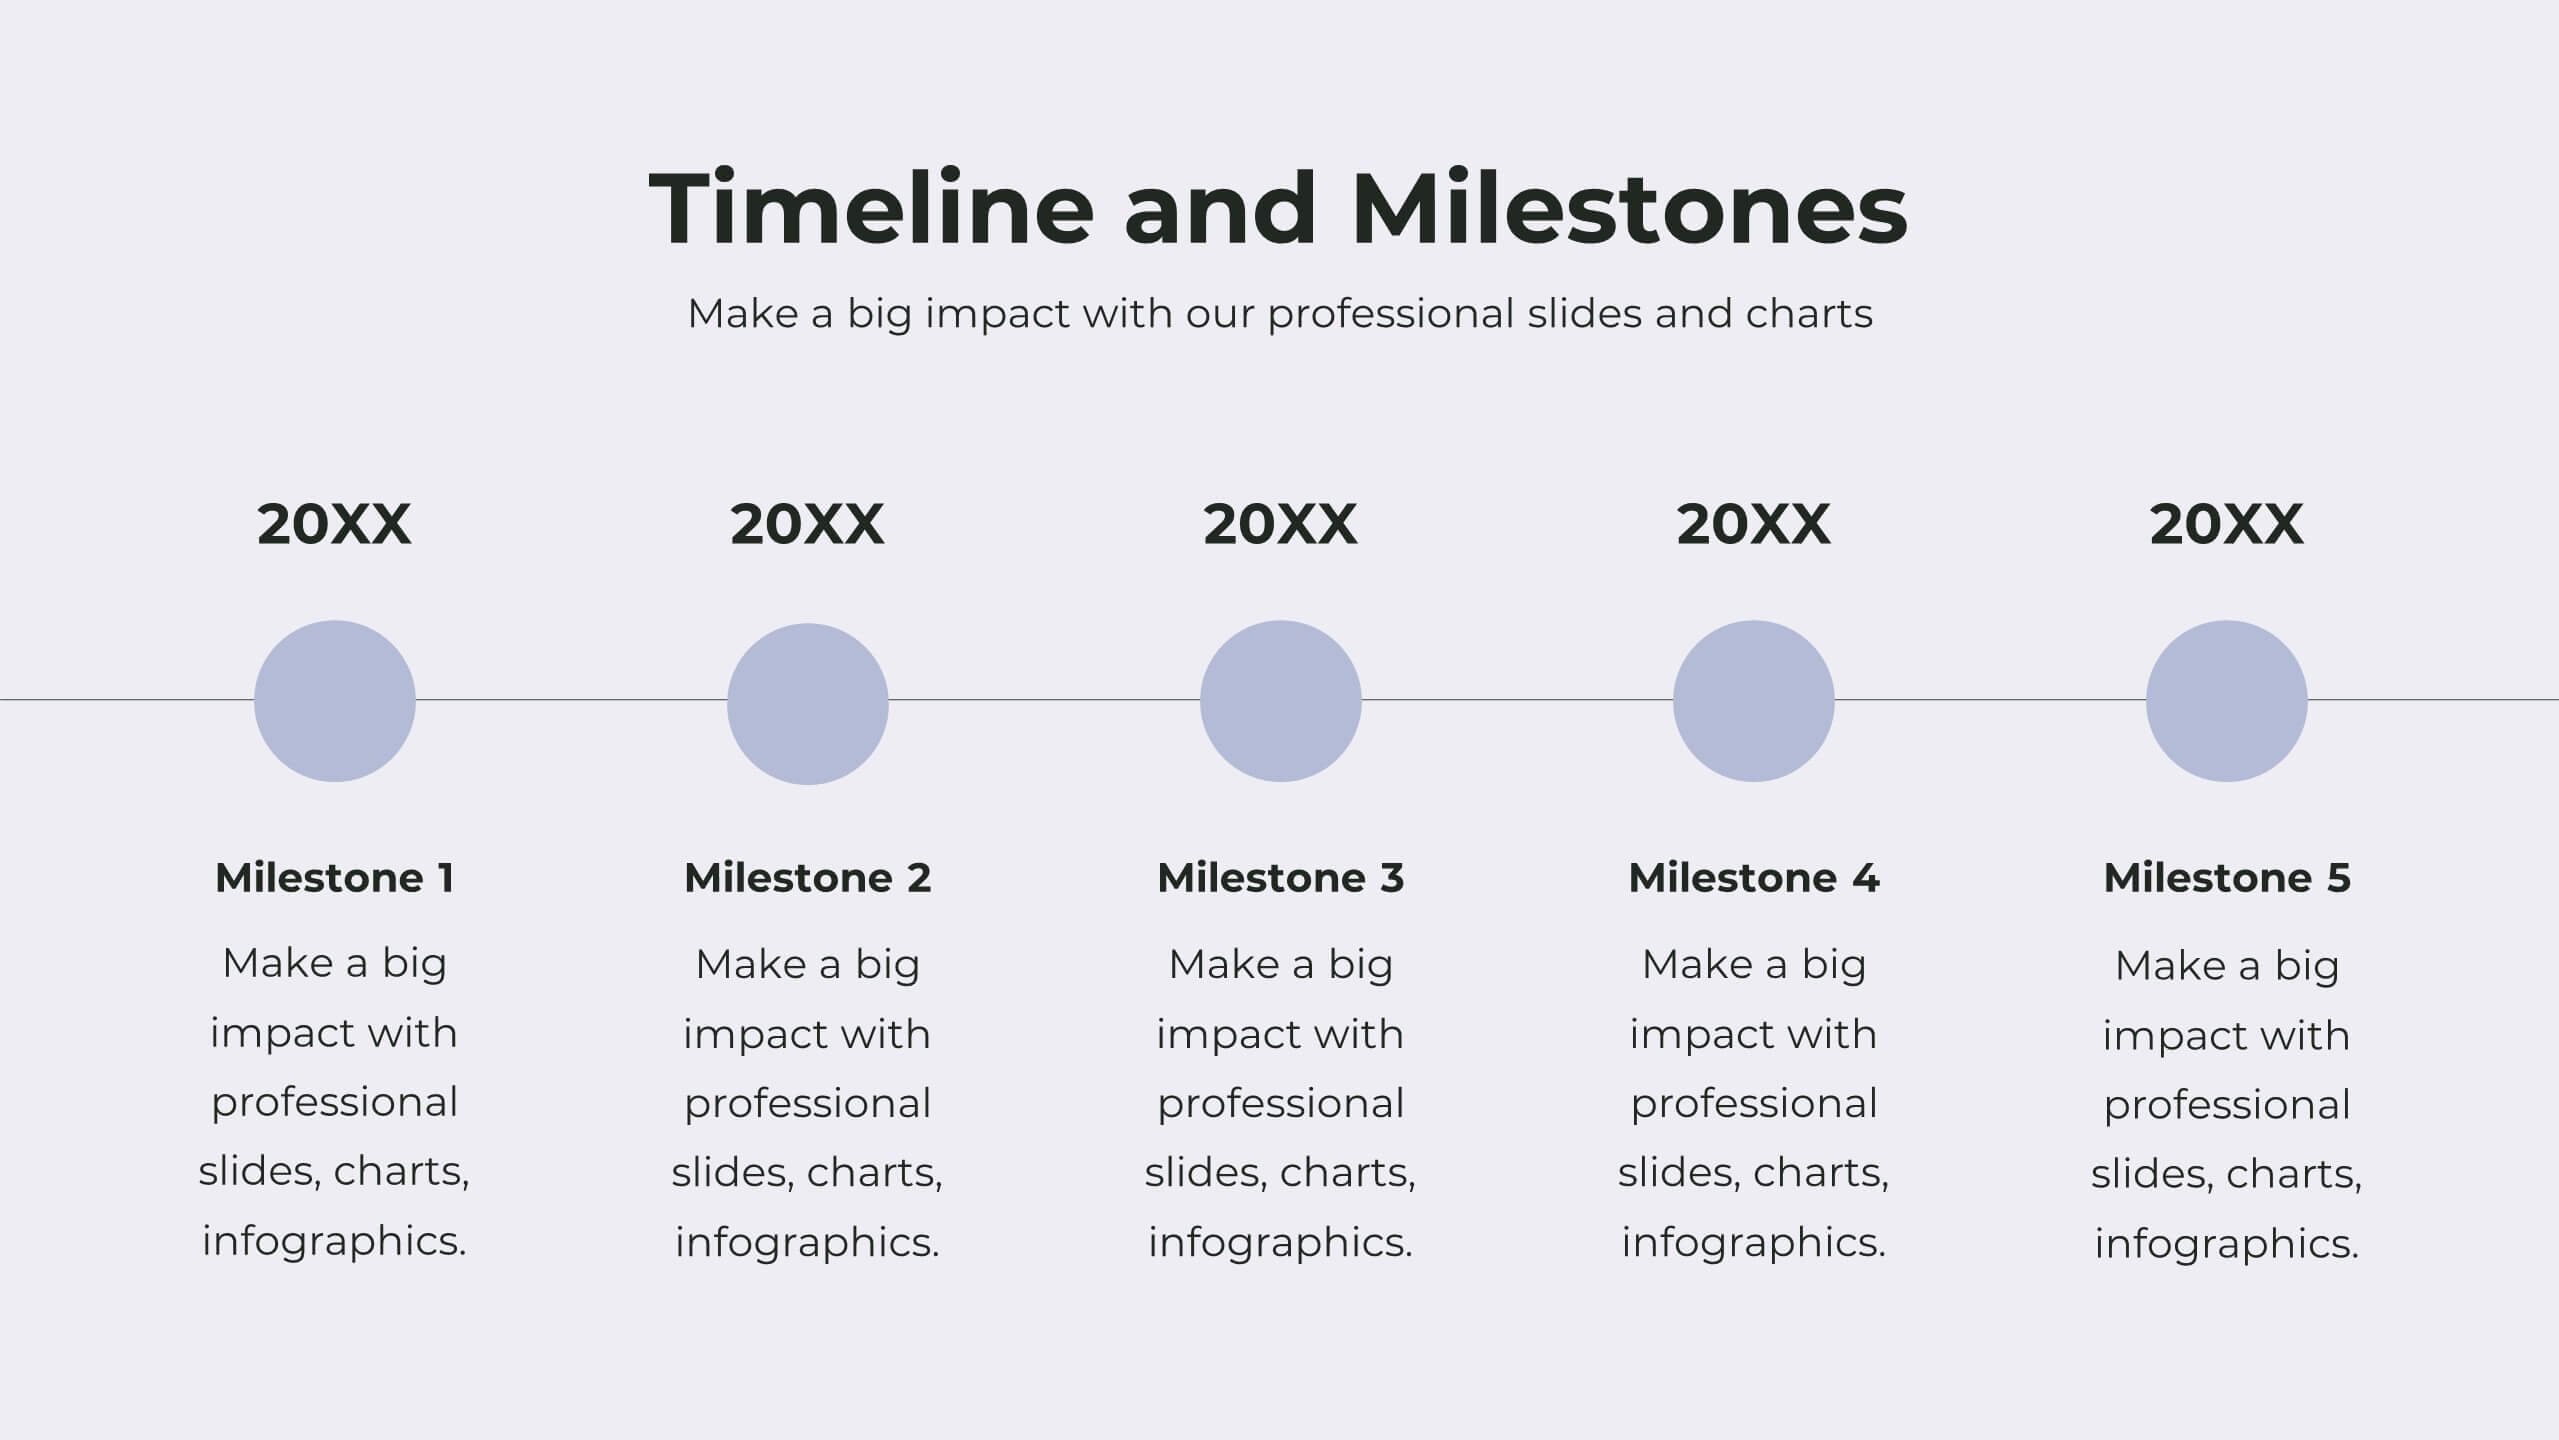
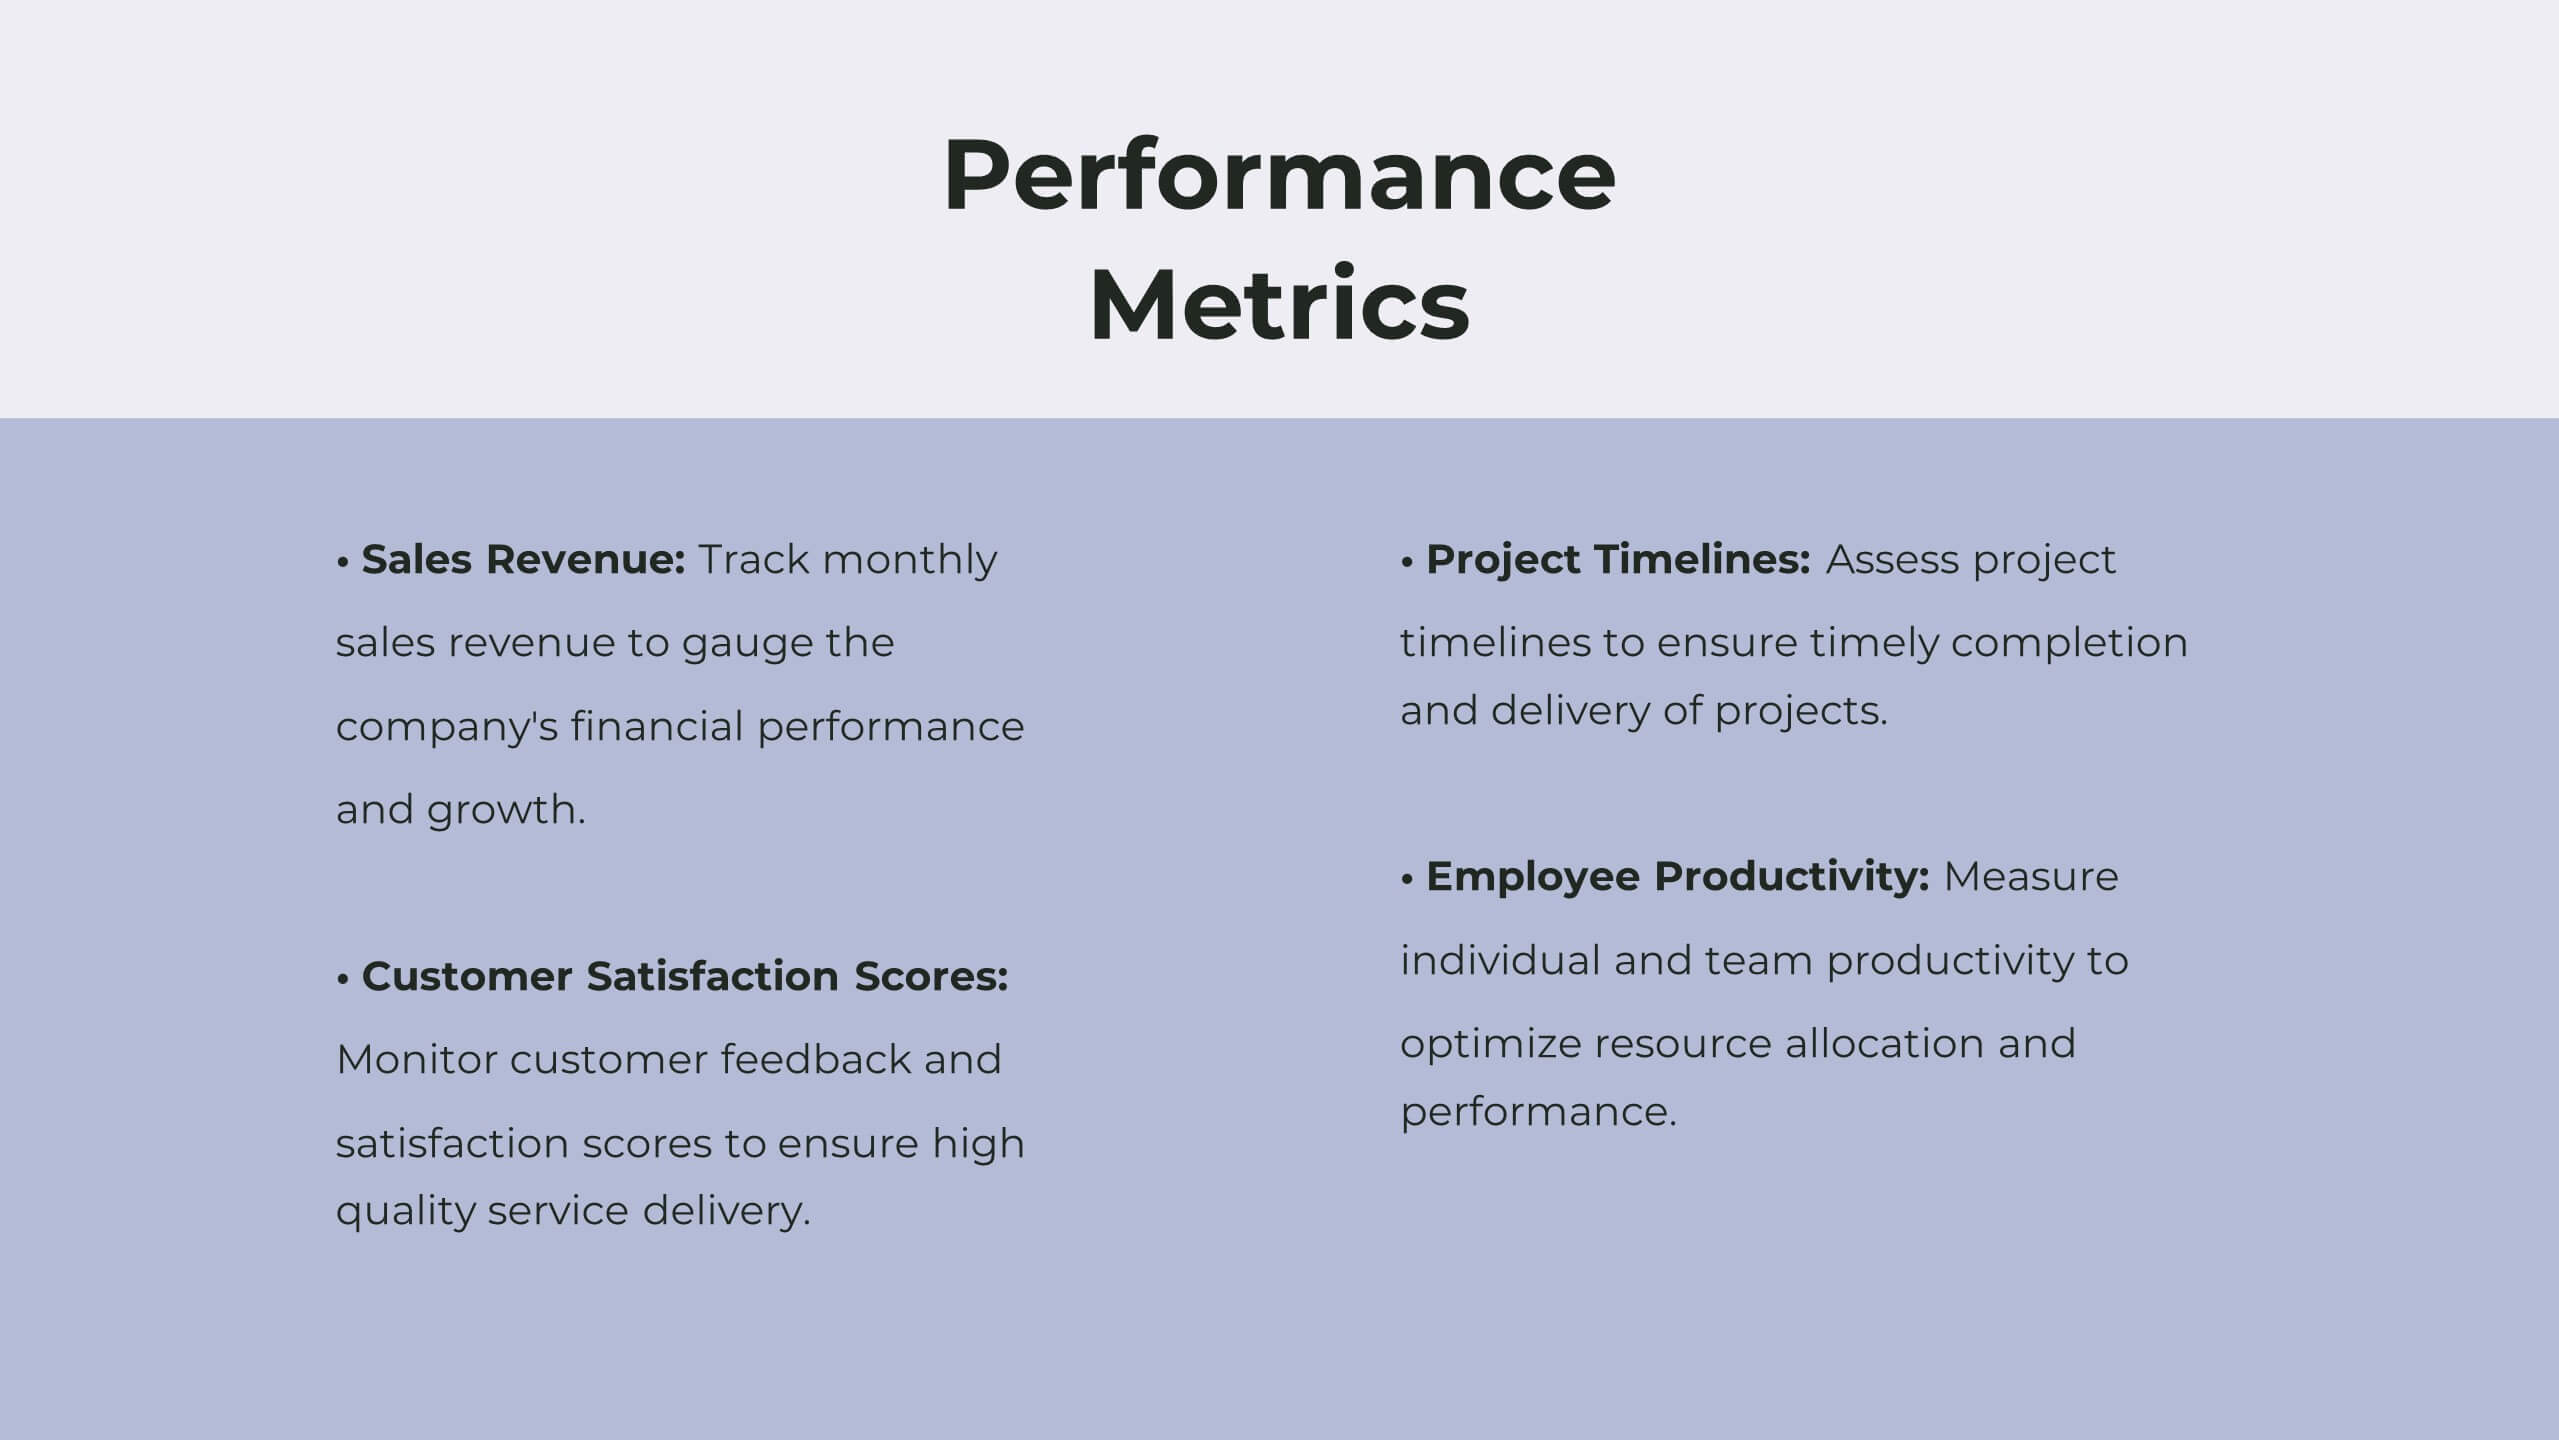
Tranquil Corporate Strategy Proposal Presentation
Drive your business forward with this elegant corporate strategy proposal template! Ideal for outlining strategic objectives, competitive analysis, and growth opportunities, it includes slides for SWOT analysis, resource allocation, and performance metrics. Impress stakeholders with clear visuals and structured content. Compatible with PowerPoint, Keynote, and Google Slides for seamless presentations on any platform.