


Features
- 28 Unique Slides
- Fully editable and easy to edit in Microsoft Powerpoint, Keynote and Google Slides
- 16:9 widescreen layout
- Clean and professional designs
- Export to JPG, PDF or send by email


Do you have any questions?
Recommend


4 slides
Effective Team Management Presentation
Present your management insights with clarity using this puzzle-style Effective Team Management template. Ideal for breaking down leadership functions, collaboration elements, or role responsibilities across four segments. The modular puzzle format adds a creative visual touch while staying professional. Fully editable in PowerPoint, Keynote, and Google Slides.


26 slides
Saam Presentation Template
Are you looking for a way to make your food presentation more fun and yummy-looking? Well, look no further! Our Saam food presentation template is just what you need. It's packed full of fun graphics and pictures of your food that will make your presentation look super tasty. And the best part? You can customize the photo layouts and charts to make your presentation look exactly how you want it with all the important information. So whether you're presenting your new restaurant to your investor, or showing your friends what you cooked for dinner this week, this template has got you covered.


20 slides
Vortex Artist Portfolio Template Presentation
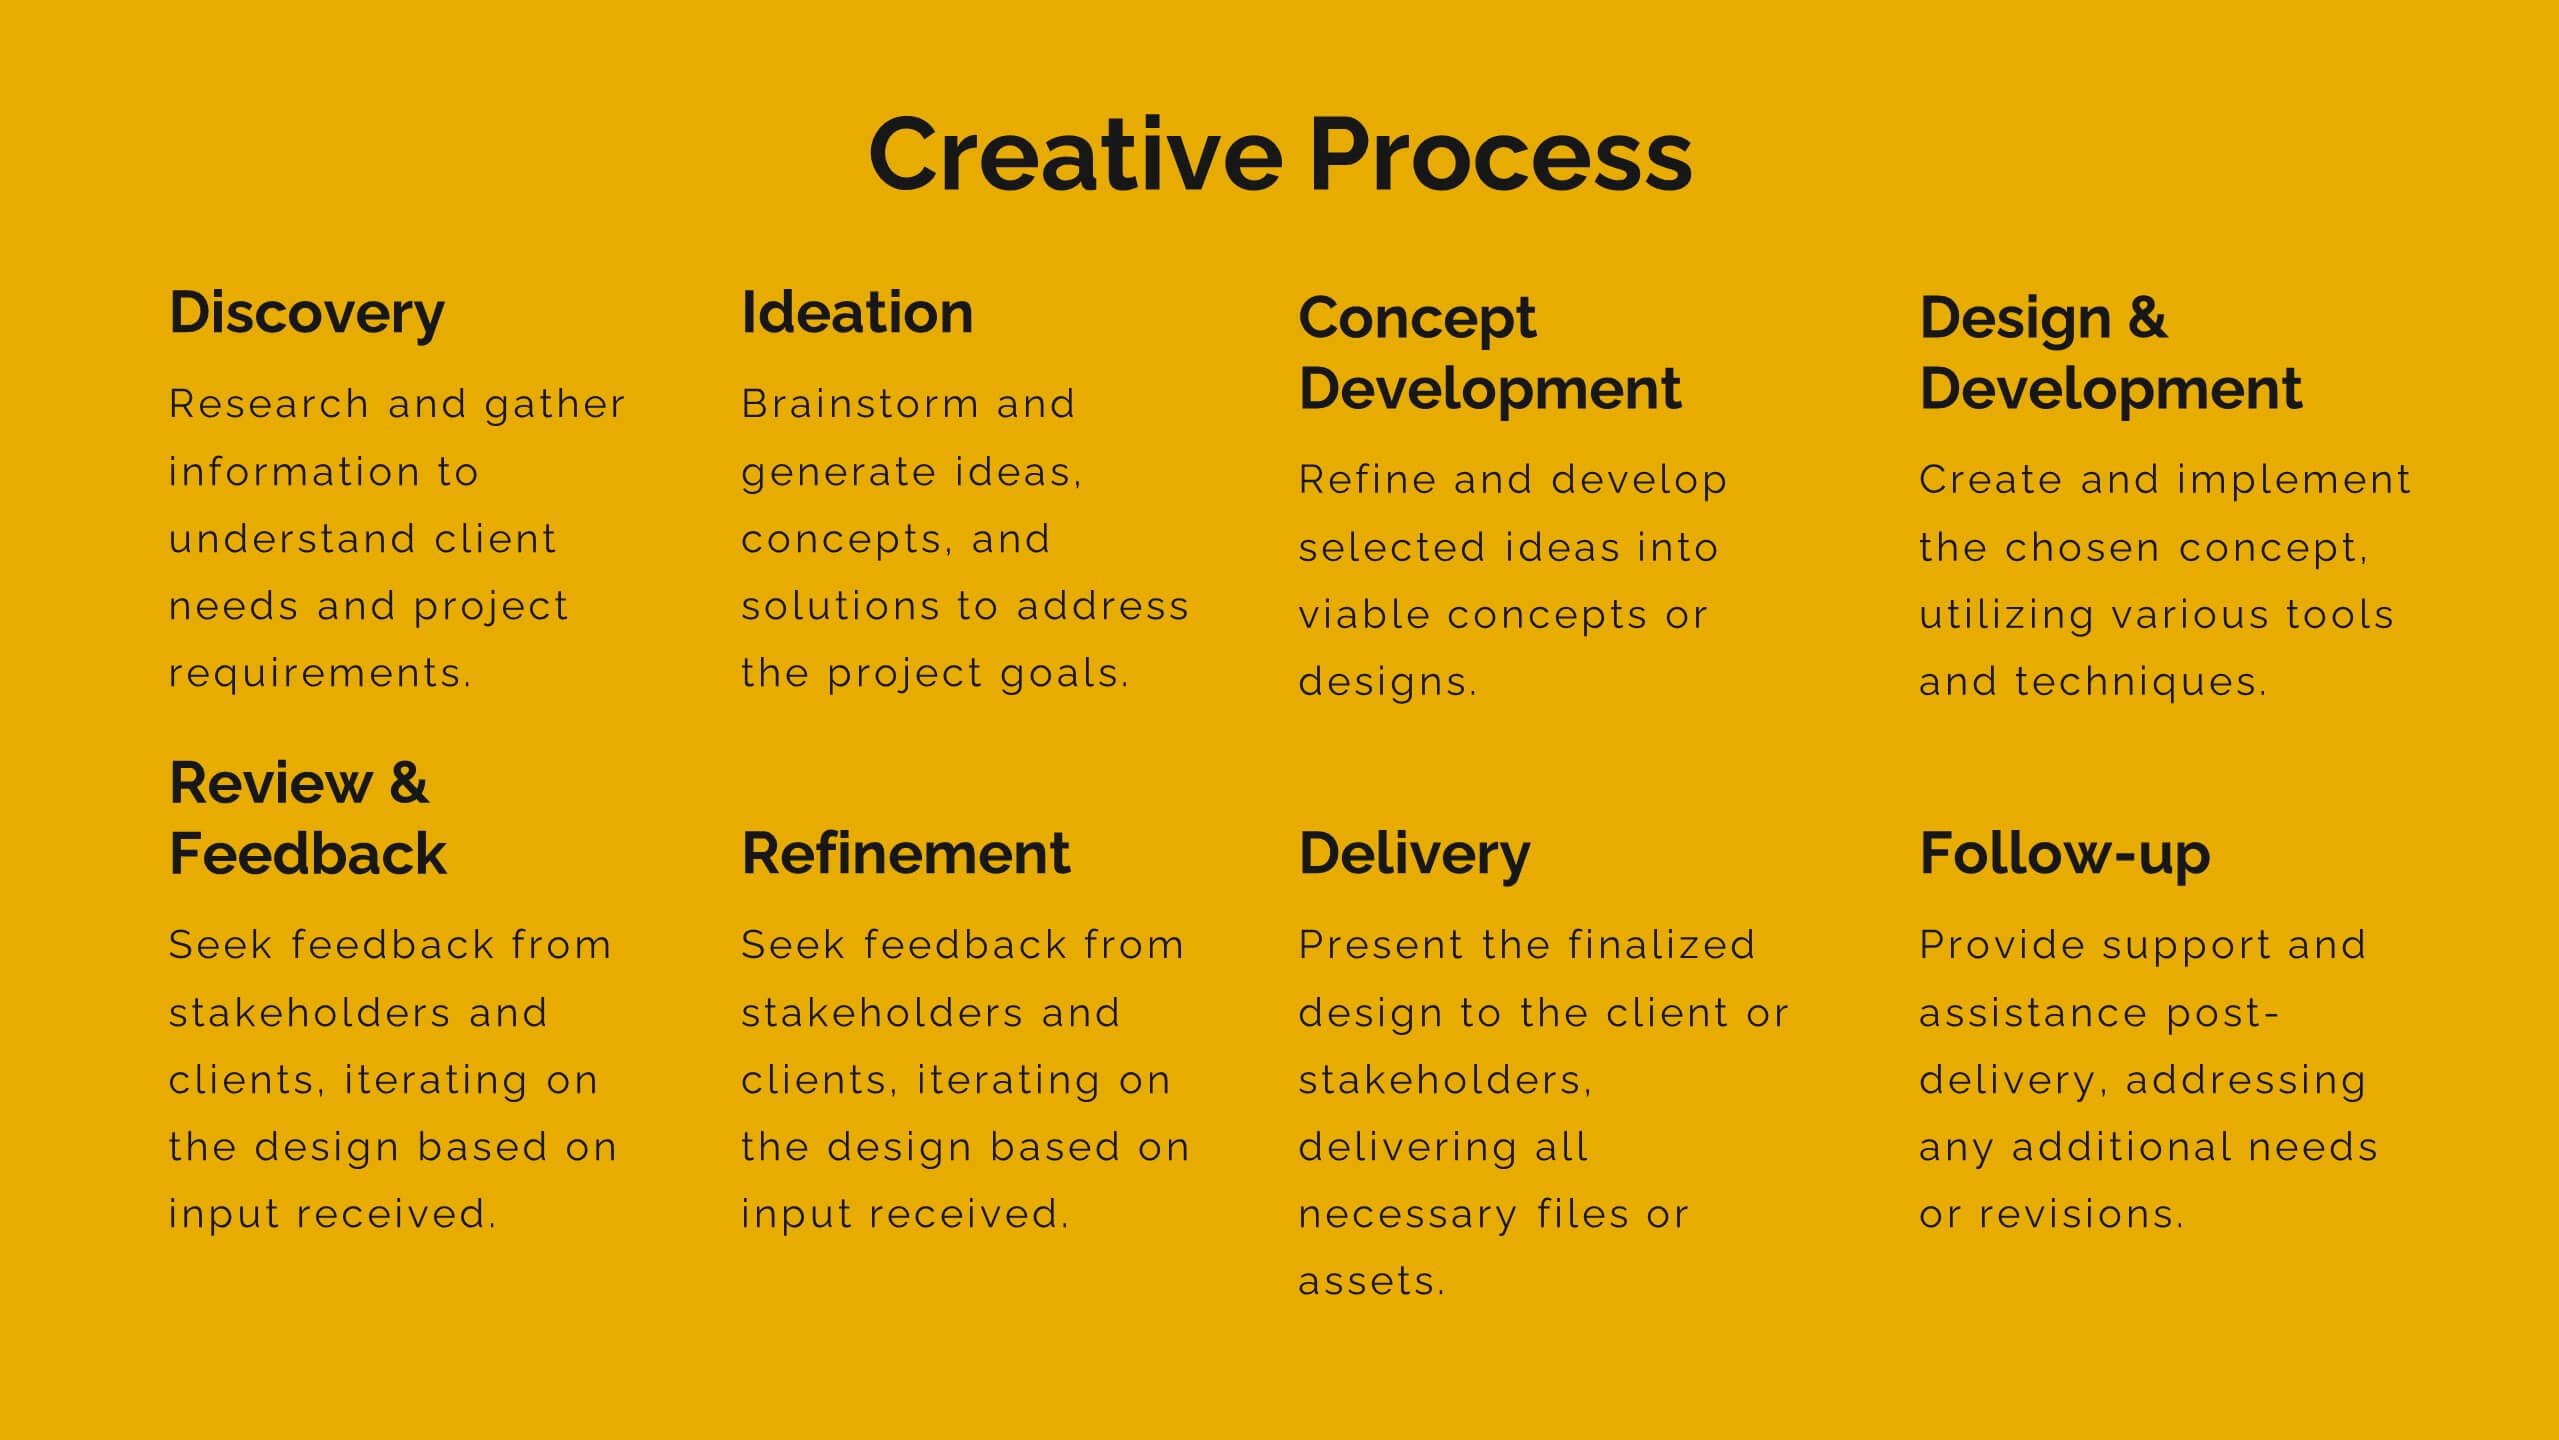
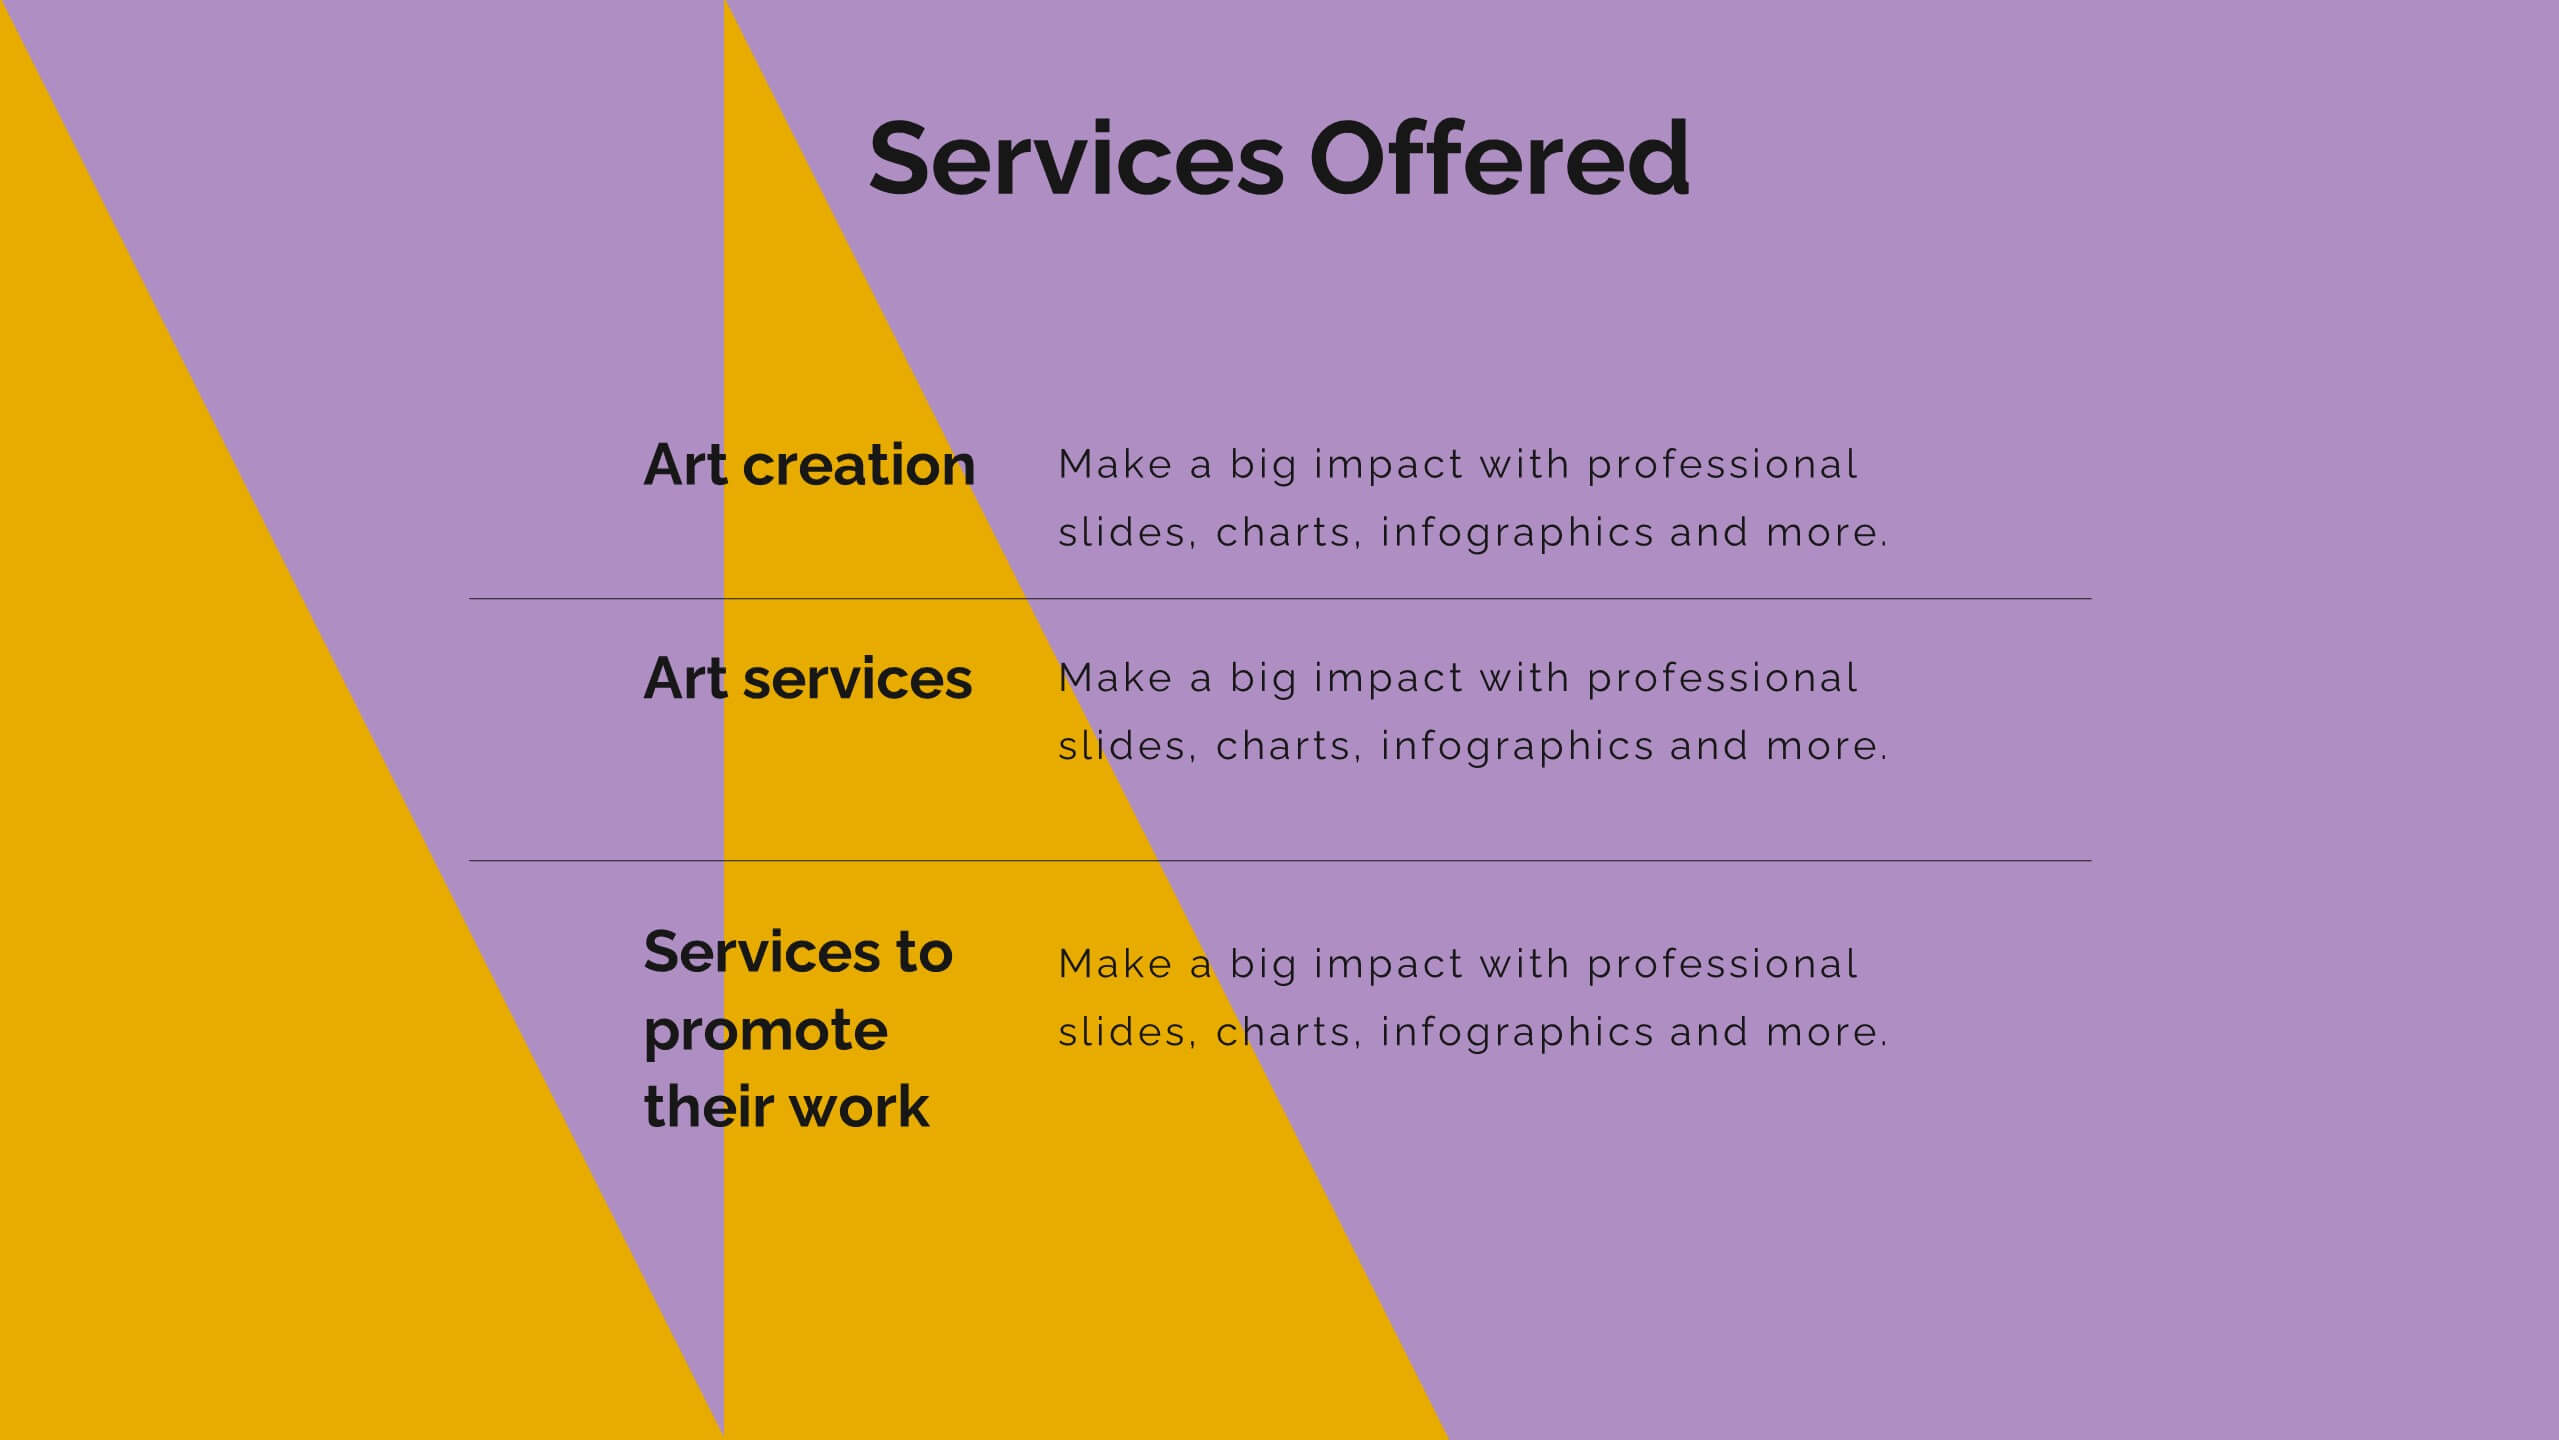
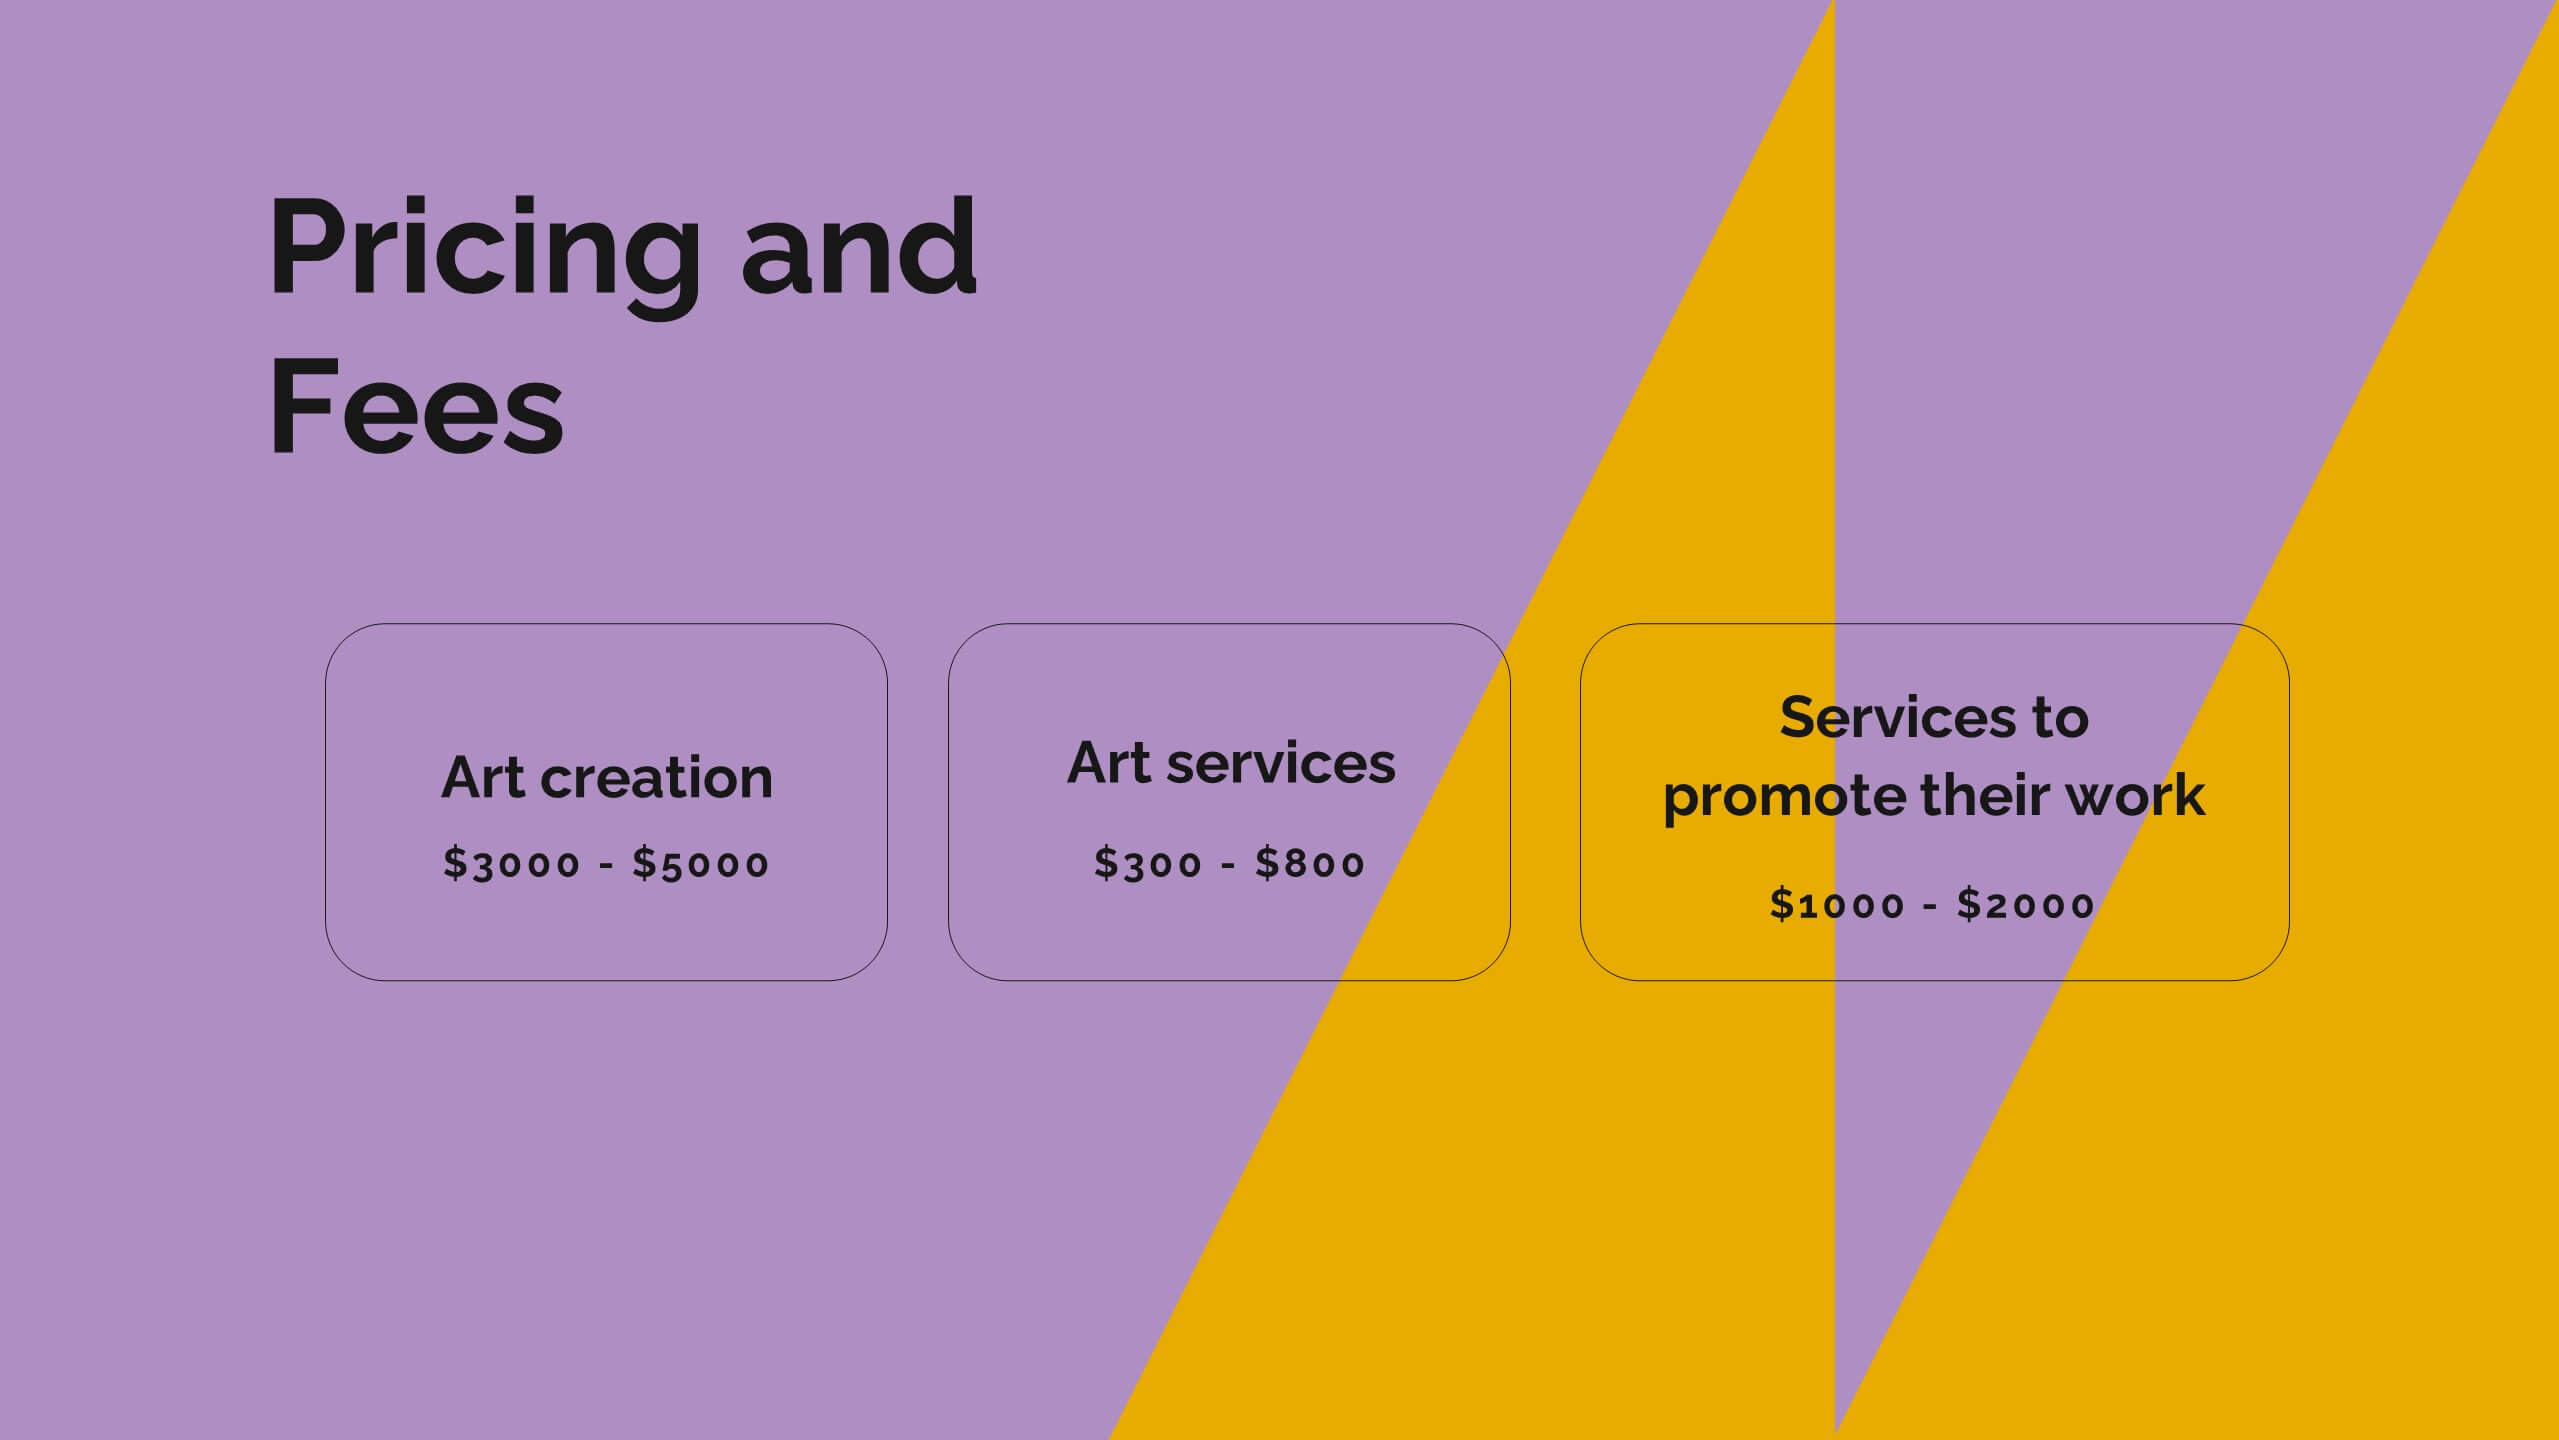
Showcase your artistic brilliance with this eye-catching portfolio presentation template! Perfect for highlighting your projects, creative process, and awards, it features vibrant slides for your philosophy, collaborations, and client testimonials. Impress potential clients and collaborators with a stunning, well-organized portfolio. Compatible with PowerPoint, Keynote, and Google Slides for seamless presentations on any platform.


6 slides
Project Rollout Milestone Timeline Presentation
Visually map out your project phases with the Project Rollout Milestone Timeline Presentation. Featuring a modern cylinder path layout, this slide is perfect for showcasing five key milestones in sequential or strategic order. Ideal for project managers and teams, and fully editable in Canva, PowerPoint, Keynote, and Google Slides.


5 slides
Topic Expansion Using Spider Mapping Presentation
Expand and organize your ideas visually with the Topic Expansion Using Spider Mapping Presentation. Designed to simplify complex information, this layout helps you break down main themes into connected subpoints. Ideal for brainstorming, concept mapping, and strategy sessions. Fully editable in Canva, PowerPoint, Keynote, and Google Slides.


4 slides
Corporate Growth and Strategy Map Presentation
Visualize your business development path with this layered strategy map. Ideal for showcasing organizational goals, strategic initiatives, and cascading growth stages. Each level is clearly structured for easy customization, making it perfect for leadership planning, corporate roadmaps, or strategic reviews in PowerPoint, Keynote, or Google Slides.


5 slides
Business Model Canvas Overview Presentation
Streamline your business strategy with the Business Model Canvas Overview Presentation. Designed for entrepreneurs, startups, and strategists, this template visualizes key partners, activities, value propositions, customer segments, revenue streams, and more. Fully editable for PowerPoint, Keynote, and Google Slides, ensuring a structured and professional business plan presentation.


5 slides
Concept Overlap with Venn Diagram Presentation
Visually map overlapping concepts and relationships with this four-circle Venn diagram slide. Perfect for presenting interdependencies, cross-functional insights, or product comparisons. Each section includes editable labels and icons to personalize your content. Compatible with PowerPoint, Keynote, and Google Slides—ideal for business strategies, brainstorming sessions, and collaborative team presentations.


10 slides
Creative Thinking and Innovation
Inspire fresh perspectives and spark ideas with this Creative Thinking and Innovation presentation. Designed around a dynamic lightbulb concept, it features five clearly numbered stages for visualizing brainstorming, concept development, and strategic creativity. Perfect for workshops, ideation sessions, or innovation planning. Fully editable in PowerPoint, Keynote, and Google Slides.


6 slides
Business Concepts Using Geometric Layouts Presentation
Present your key business ideas with this structured, modern layout featuring six colorful geometric segments. Ideal for showcasing strategies, goals, or processes with visual clarity. Each section allows for brief insights with clean iconography. Fully editable in PowerPoint, Google Slides, Keynote, and Canva—perfect for professional, client-facing presentations.


4 slides
IT Security Infrastructure Overview Presentation
Lock in your audience's attention with a clean, modern visual that breaks down tech barriers. This presentation template offers a snapshot of critical IT security components—think firewalls, cloud infrastructure, and data safeguards—making it easier to explain complex systems. Fully editable and compatible with PowerPoint, Keynote, and Google Slides for effortless customization.


5 slides
Value Chain Business Model Presentation
Spark fresh insight into how your organization creates value with this clean, arrow-based layout that makes every step feel intuitive and action-ready. This presentation breaks down key activities, support processes, and improvement opportunities in a clear visual flow perfect for strategy discussions. Fully compatible with PowerPoint, Keynote, and Google Slides.


26 slides
Venture Capital Dark Presentation
Present your investment vision with confidence using our Venture Capital presentation template, ideal for PowerPoint, Keynote, and Google Slides. This template is expertly crafted for venture capitalists, startup founders, and financial advisors looking to create persuasive and engaging presentations that attract investment. Our Venture Capital template is designed to showcase the potential of innovative startups to savvy investors. It includes a range of slides that detail market analysis, growth potential, business strategies, and investment opportunities, all laid out in an easy-to-understand format. With this template, you can effectively communicate complex financial data and investment propositions through clear visuals and concise text. Featuring customizable charts, graphs, and diagrams, the template allows for a personalized touch, making it easier to highlight the unique selling points of investment opportunities. Whether you're presenting to angel investors, venture capital firms, or at a funding pitch, this template will help you to articulate your message with clarity and impact. Increase the visibility of your venture capital presentations with our SEO-optimized template and position yourself as a thought leader in the field of investment and startup growth.


21 slides
Fahrenheit Scientific Research Presentation
Present your findings with clarity using this scientific research presentation template. Designed for researchers, it includes sections for objectives, methodology, data analysis, results, and recommendations. Perfect for academic and professional use, this template ensures a polished, organized presentation and is fully compatible with PowerPoint, Keynote, and Google Slides.


26 slides
Financial Planning Essentials Presentation
Take control of your financial destiny with our Financial Planning Essentials presentation template, suitable for PowerPoint, Keynote, and Google Slides. This template is meticulously designed for financial advisors, planners, and anyone seeking to educate on the principles of sound financial management. Our Financial Planning Essentials template is a rich resource that provides an extensive range of slides to explain the basics of financial planning, investment strategies, and wealth management. It allows you to break down financial concepts into easy-to-understand elements, making it perfect for client presentations, financial workshops, and educational seminars. Featuring customizable diagrams, charts, and financial models, the template enables a personalized approach to presenting financial data and strategies. Whether you're outlining budgeting techniques, investment plans, or retirement strategies, this template helps you communicate complex information in a clear and professional manner. Optimize your financial planning presentations with our SEO-friendly template to become a trusted resource in financial education and planning. Lead your audience toward financial freedom with a comprehensive and engaging presentation that simplifies the path to financial success.


4 slides
KPI and Business Performance Dashboard
Drive strategic insights with this sleek KPI and business dashboard template. Highlight key metrics, trends, and performance results using easy-to-read graphs and organized data sections. Perfect for management reports, executive summaries, and project tracking. Fully editable in PowerPoint, Keynote, and Google Slides.


24 slides
Business Strategy Presentation
Streamline your strategic planning with our Business Strategy presentation template. It covers SWOT analysis, market trends, competitive landscape, and strategic initiatives. Ideal for business planners and strategists, this template is compatible with PowerPoint, Keynote, and Google Slides, ensuring comprehensive support for your strategic presentations.