


Features
- 6 Unique slides
- Fully editable and easy to edit in Microsoft Powerpoint, Keynote and Google Slides
- 16:9 widescreen layout
- Clean and professional designs
- Export to JPG, PDF or send by email


Do you have any questions?
Recommend


27 slides
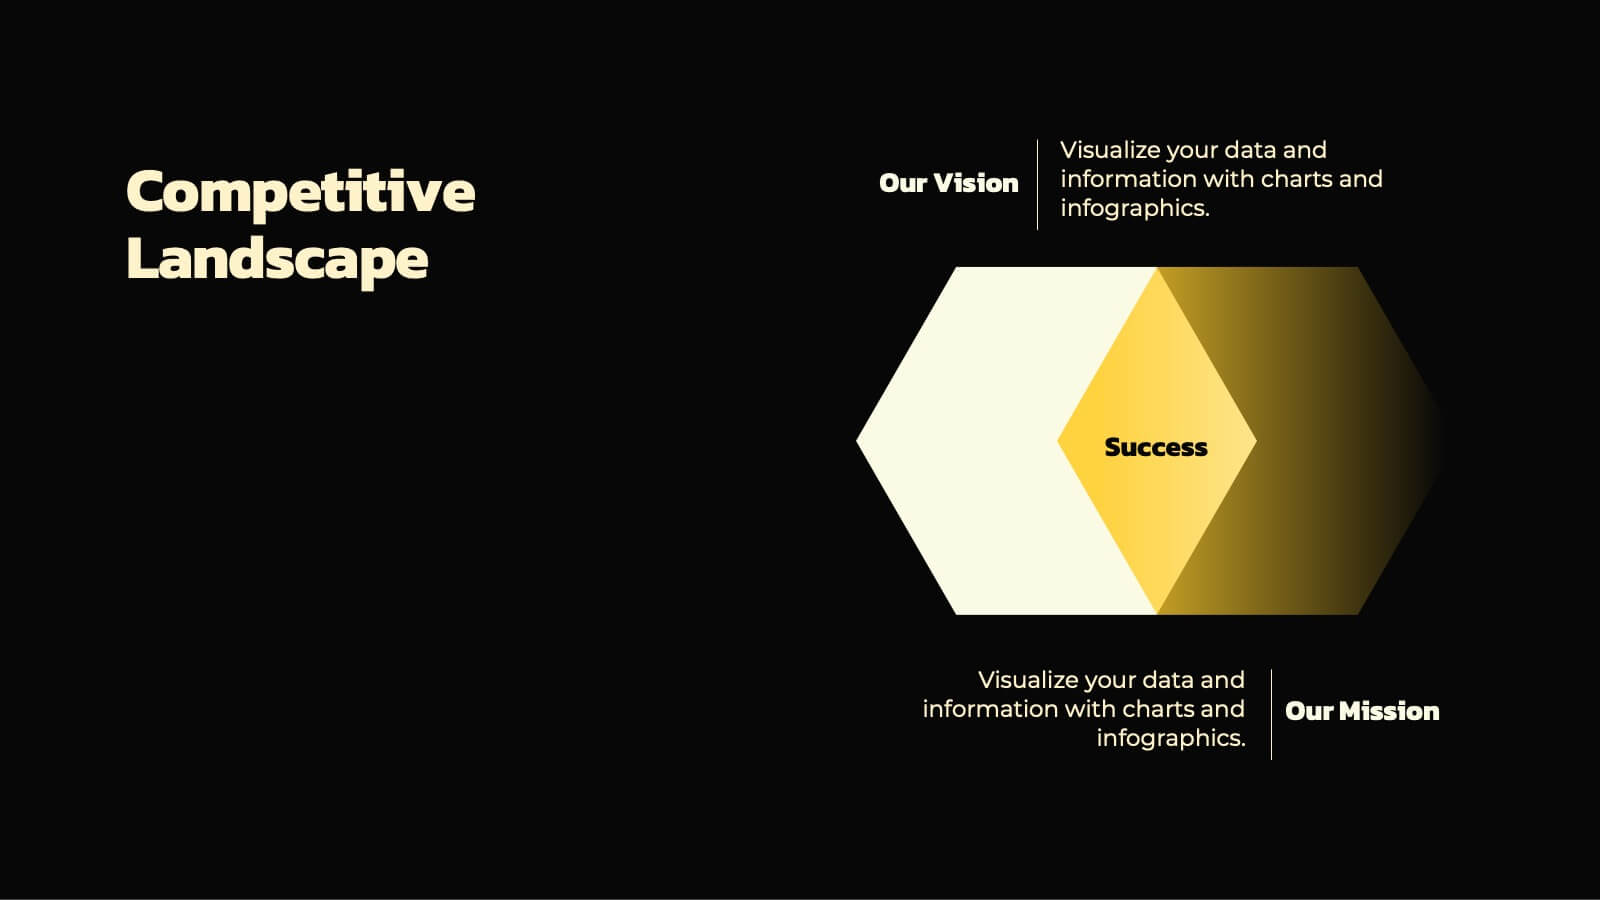
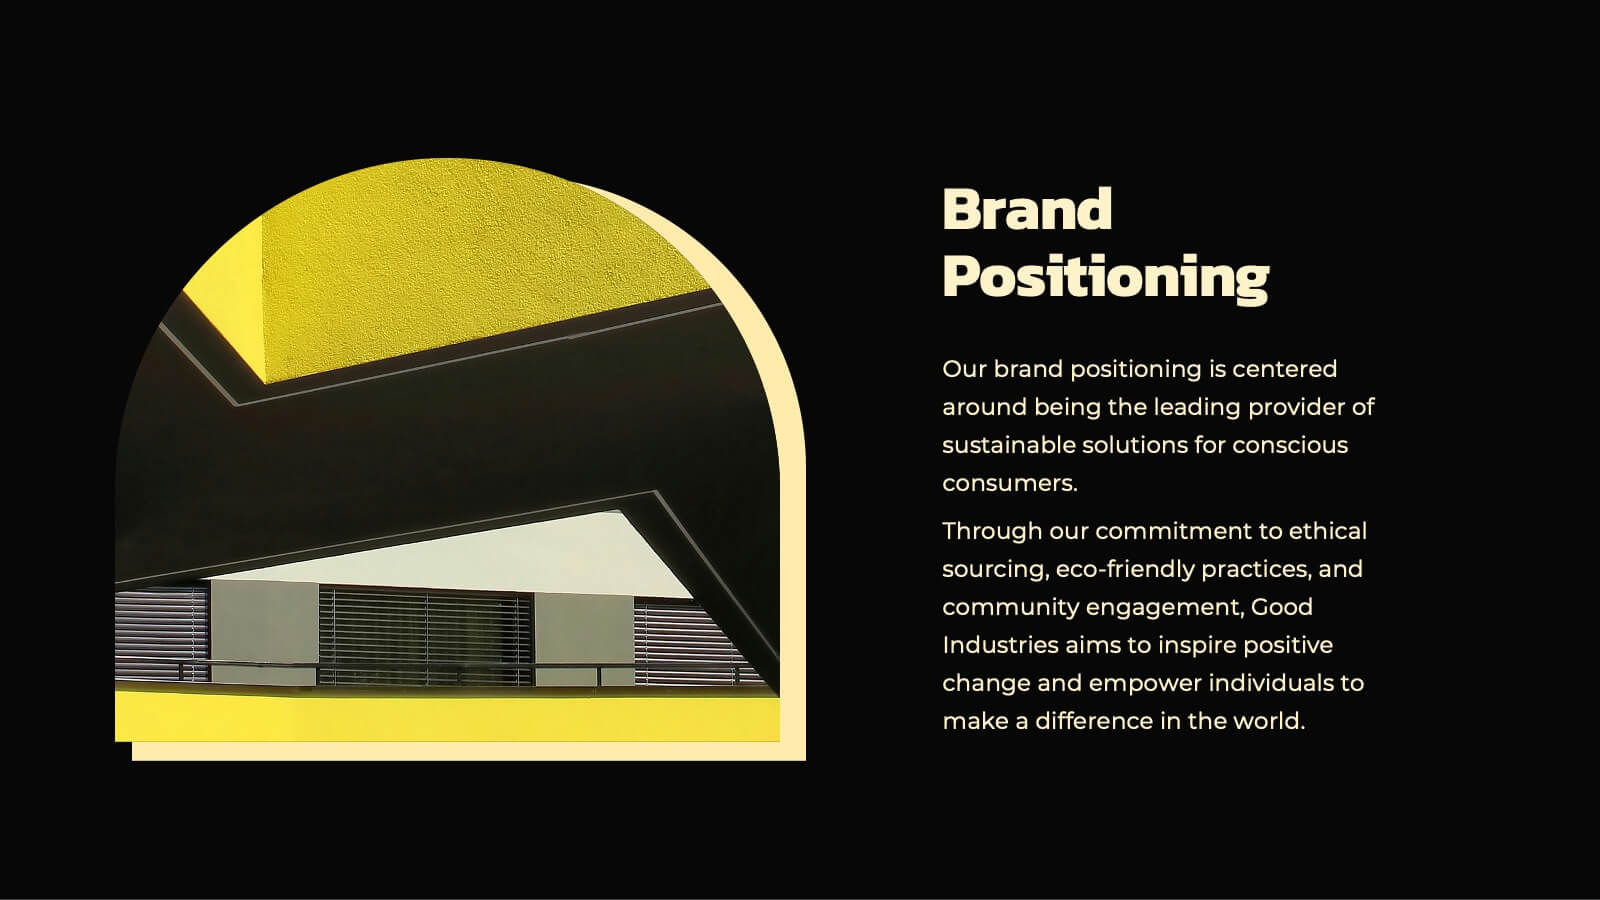
Aqua Brand Strategy Report Presentation
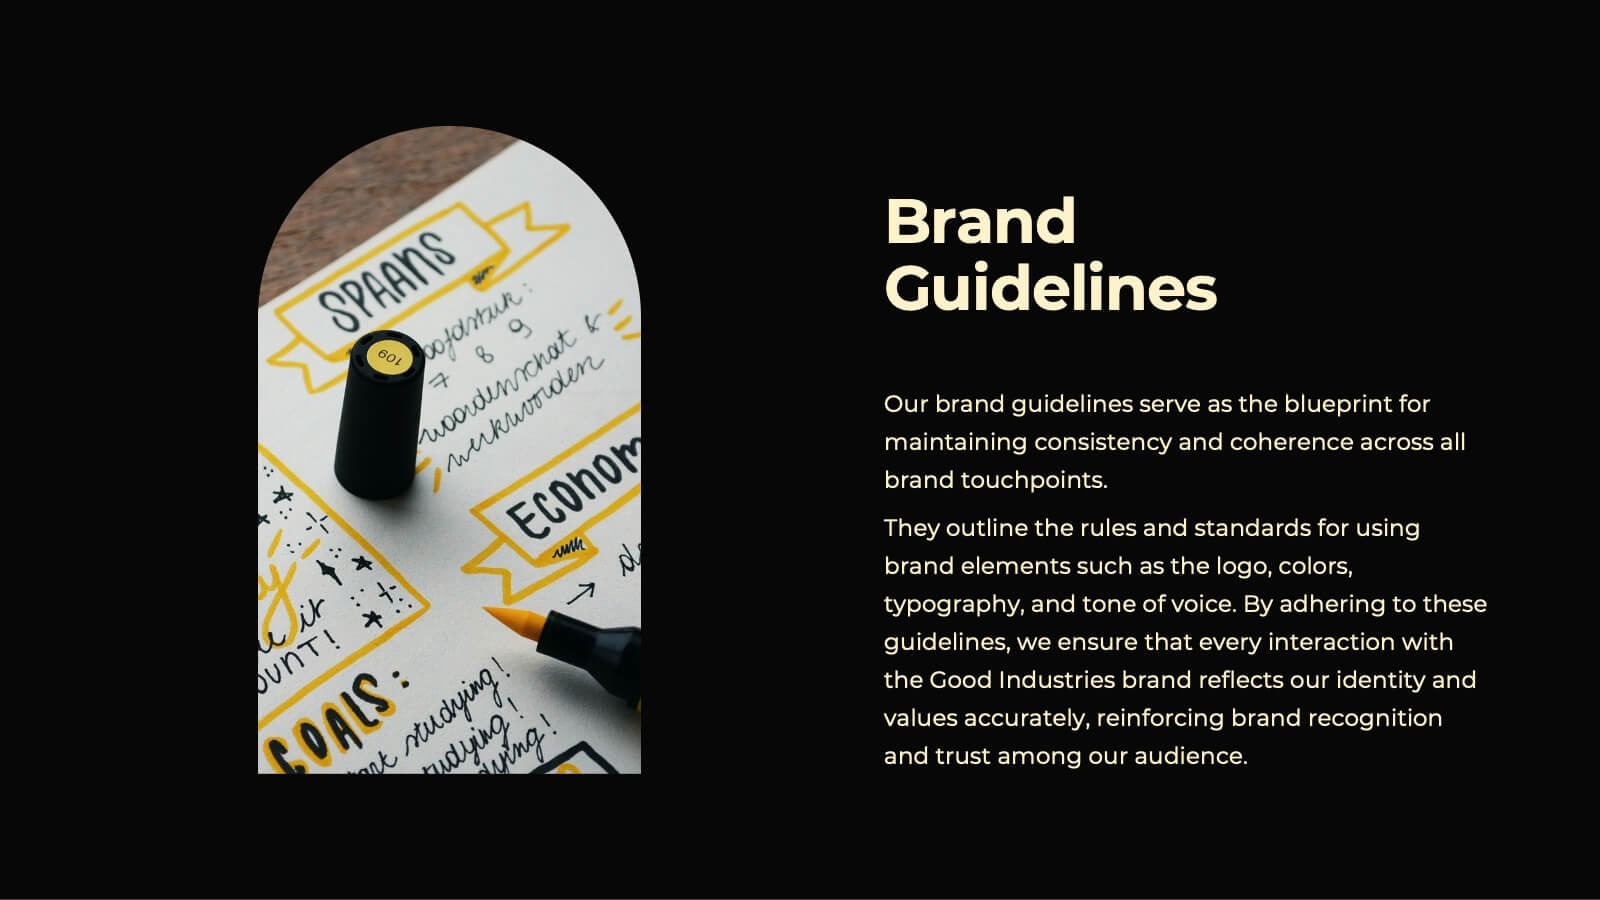
Make waves with this fresh, aqua-inspired presentation template, perfect for delivering a standout brand strategy report! Designed to help you showcase your brand's vision, market positioning, and strategic goals, it features a clean, modern layout that grabs attention. Compatible with PowerPoint, Keynote, and Google Slides for effortless customization.


6 slides
Internal and External Communication Plan
Visualize your communication strategy with this dual-channel megaphone infographic, perfect for showcasing internal and external messaging flows. Ideal for corporate updates, PR plans, or stakeholder communications. Fully editable in PowerPoint, Keynote, and Google Slides.


4 slides
Digital Course Creation Flow Presentation
Guide your audience through the steps of building a digital course with this clear and modern flowchart layout. Designed to simplify complex processes, this visual template is ideal for educators, instructional designers, or online coaches. Fully compatible with PowerPoint, Keynote, and Google Slides for easy customization and seamless use.


6 slides
Project Rollout Milestone Timeline Presentation
Visually map out your project phases with the Project Rollout Milestone Timeline Presentation. Featuring a modern cylinder path layout, this slide is perfect for showcasing five key milestones in sequential or strategic order. Ideal for project managers and teams, and fully editable in Canva, PowerPoint, Keynote, and Google Slides.


6 slides
6-Step Training Program Slide Presentation
Make your training process feel like a journey worth taking. This vibrant 6-step infographic template helps you break down each stage of your program with clear icons, color-coded steps, and a clean visual path. Ideal for onboarding, workshops, or employee development. Fully compatible with PowerPoint, Keynote, and Google Slides.


10 slides
Business KPI Metrics Dashboard
Maximize your business analysis with our "Business KPI Metrics Dashboard" template. This detailed infographic is designed to clearly present key performance indicators (KPIs) using a variety of charts, including bar graphs, line charts, and histograms. Each chart is color-coded to distinguish different metrics such as sales volume, revenue growth, and customer engagement, facilitating quick understanding and comparison. This layout is ideal for executives, analysts, and managers, supporting data-driven decisions in strategic reviews and planning sessions. Fully compatible with PowerPoint, Keynote, and Google Slides, this template is essential for any business looking to effectively communicate performance trends and insights.


4 slides
Business Information Security Compliance Presentation
Ensure your systems meet security standards with the Business Information Security Compliance presentation slide. Designed with a central cloud and laptop graphic surrounded by icons representing data, user access, encryption, and compliance checks, this layout is perfect for illustrating IT governance, risk management, and data protection protocols. Fully customizable in PowerPoint, Keynote, and Google Slides.


4 slides
Stakeholder Analysis and Engagement Presentation
Enhance your strategic planning with our Stakeholder Analysis and Engagement Presentation template. Designed to map influence and interest effectively, this tool aids in identifying key stakeholders and tailoring engagement strategies. It’s compatible with PowerPoint, Keynote, and Google Slides, perfect for impactful presentations and workshops.


26 slides
Philp Presentation Template
Our Philp template is perfect for presenting your furniture shop business. It has a modern design, allowing you to make your product/service stands out from the crowd, and it’s easily customizable so that it can be tweaked to your exact needs. This template contains slides with beautiful graphics and captions describing the most important aspects of your business. Our presentation template can be used to promote your products, services, benefits and much more! This template can also be used to present your company's vision and mission, business strategy, portfolio and more.


7 slides
Framework Documentation Infographic
A framework infographic presents a framework for organizing and understanding complex information, to provide an overview of the key elements and relationships between them. This template is designed to break down your large amounts of information into smaller, more manageable parts. This infographic can be used in fields such as business, marketing, and strategy, as well as in education and research. Use it to explain complex concepts, theories, and models, and to provide a visual representation of how elements fit together. This can take a variety of forms, including flowcharts and diagrams.


7 slides
Technology Consulting Infographic
Technology consulting, also known as IT consulting or tech consulting, involves providing expert advice and guidance to organizations regarding their technology strategy, utilization, and optimization. This infographic template provides a compelling way to illustrate complex concepts, strategies, and data related to technology consulting. Fully customizable and compatible with Powerpoint, Keynote, and Google Slides. The sleek, modern design reflects the cutting-edge nature of technology and consulting services. This infographic is your go-to tool for creating presentations that showcase your technology consulting expertise.


5 slides
Health Benefits Infographics
Health Benefits refer to the positive effects that certain practices, behaviors, or conditions have on a person's physical, mental, and emotional well-being. These informative infographic templates are an effective tool to educate and motivate individuals to prioritize their health and make informed lifestyle choices. Its visually appealing design, concise information, and emphasis on positive outcomes will engage and inspire readers to take action towards a healthier and happier life. This template is designed to present key information in an appealing and concise manner, making it suitable for presentations, websites, social media posts, and educational materials.


5 slides
Social Myths & Facts Infographics
A Social Myth might be a certain belief, while a Social Fact would be the correct answer with data. This engaging and informative Infographics template is designed to help you dispel common misconceptions and provide accurate information on various social topics. With this template you can cover stereotypes, challenge myths, or present facts to promote understanding and awareness. The template features a modern design with vibrant colors and captivating visuals, making it visually appealing and easy to navigate. It includes a variety of design elements such as icons, illustrations and timelines that can all be customized.


5 slides
Water Problems Infographics
Water Problems refer to the various issues that arise due to the scarcity, pollution, or mismanagement of water resources. These vertical infographics are perfect for addressing various issues related to water management and conservation. They are effective tools for raising awareness about water-related issues and promoting sustainable water management practices. This template is completely customizable and includes various icons and images related to water such as water droplets, faucets, and ocean waves. The color scheme is predominantly blue, signifying the importance of water conservation and preservation.


26 slides
Ander Presentation Template
We are proud to present Ander a unique, creative and professional template that's perfect for creating inspiring presentations, portfolios and business documents. With this business presentation template, you can easily share your ideas, company identity, and other information more closely with the public in an easy-to-understand way. With light earthy tones, peaceful aesthetic, clean and aesthetically pleasing design you’ll be sure to make your business stand out from the rest of the competition.


5 slides
Regional Development in Oceania Map Presentation
The Regional Development in Oceania Map template provides a comprehensive visualization of growth and development metrics across various regions in Oceania. This template is designed to aid in presenting demographic data, economic indicators, or development status in a clear, easily understandable format. It's suitable for reports, presentations, and educational materials. Compatible with PowerPoint, Keynote, and Google Slides.


4 slides
Corporate Role Hierarchy Structure Presentation
Visualize your company’s reporting structure with this modern corporate role hierarchy diagram. Perfect for team overviews, leadership charts, or onboarding sessions. Each role node is clearly connected for easy understanding. Fully editable in Canva, PowerPoint, or Google Slides—ideal for HR teams, managers, or organizational planning presentations.