


Features
- 12 Unique slides
- Fully editable and easy to edit in Microsoft Powerpoint, Keynote and Google Slides
- 16:9 widescreen layout
- Clean and professional designs
- Export to JPG, PDF or send by email


Do you have any questions?
Recommend


8 slides
Healthcare Data Analysis Presentation
The "Healthcare Data Analysis Presentation" template offers a streamlined visual representation ideal for communicating complex healthcare data insights effectively. Designed with clarity in mind, it features sleek graphics symbolizing medical elements and clear percentage tags that quantify data in an immediately understandable way. This template facilitates the presentation of key data such as patient outcomes, treatment efficacy, or operational efficiency within healthcare settings. Its visual simplicity makes it an excellent choice for healthcare professionals and administrators who need to convey detailed statistics and results to stakeholders, ensuring that the key points are easily digestible and actionable.


26 slides
Abstract Technology Presentation
Artificial intelligence is helping to drive the future and make it better, it has the potential to transform how we live and work. This is a detailed presentation template for artificial intelligence technology, with an abstract design and chart slides that can be used to demonstrate how this technology works. This template will help you inform your audience about what artificial intelligence is. Easy to edit and customize, this template will allow you to create your own story around the concept of artificial intelligence, while still presenting your information in an organized format.


5 slides
Restaurant Experience Infographics
The Restaurant industry plays a vital role in providing food, employment, and social spaces while contributing to economic growth and cultural exchange. These infographic templates are designed to showcase various aspects of the restaurant experience. It is an ideal tool for restaurant owners, managers, and marketers to present data, statistics, and key information about their establishment's unique features and offerings. The template includes a collection of eye-catching infographics that cover different elements of the restaurant experience. The graphics are designed in a modern and vibrant style, with attractive colors that capture attention.


6 slides
Startup Unicorn Infographic
A "startup slide" usually refers to a slide within a presentation, often a pitch deck, that introduces and provides key information about a startup company. The purpose of this Startup Slide Infographic is to deliver a concise overview of the startup's value proposition and key information. Capturing the audience's attention and conveying essential details about the startup's mission and market opportunity. This can be used in presentations or marketing materials. This infographic design is clean, visually engaging, and easy to understand at a glance. Fully customizable and compatible with Powerpoint, Keynote, and Google Slides.


6 slides
Executive Summary Research Infographics
Efficiently convey key research findings with our Executive Summary Research infographic template. This template is fully compatible with popular presentation software like PowerPoint, Keynote, and Google Slides, allowing you to effortlessly customize it to encapsulate essential research insights. The Executive Summary Research infographic template serves as a concise and visually engaging platform for summarizing research objectives, methodologies, and critical findings. Whether you're a researcher, project manager, or involved in data analysis, this template provides a user-friendly canvas to create compelling executive summaries for your research projects. Optimize your research communication with this SEO-optimized Executive Summary Research infographic template, thoughtfully designed for clarity and ease of use. Customize it to highlight key data points, conclusions, and recommendations, ensuring your audience grasps the essence of your research quickly and effectively. Start crafting your personalized infographic today to make your research stand out.


4 slides
Corporate Networking Flow Presentation
Simplify complex communication systems with this dynamic and easy-to-follow presentation design. Perfect for visualizing workflow connections, team collaboration, or IT infrastructure, it brings clarity to multi-level processes with a clean and structured layout. Fully editable and compatible with PowerPoint, Keynote, and Google Slides for professional results.


26 slides
Cutting-Edge AI Breakthroughs Presentation
Step into the future with this exciting presentation on cutting-edge AI breakthroughs. Covering advancements in machine learning, automation, ethical AI, and real-world applications, this template helps you present complex innovations with clarity and impact. Fully customizable and compatible with PowerPoint, Keynote, and Google Slides for a seamless and engaging presentation experience.


21 slides
Vibrato Startup Funding Proposal Presentation
This bold startup funding proposal sparks investor interest with a powerful story, innovative solutions, and high-growth strategies. Showcase game-changing technology, a passionate team, and an unstoppable roadmap to success. With clear metrics and dynamic visuals, this pitch invites investors to fuel the next big breakthrough.

21 slides
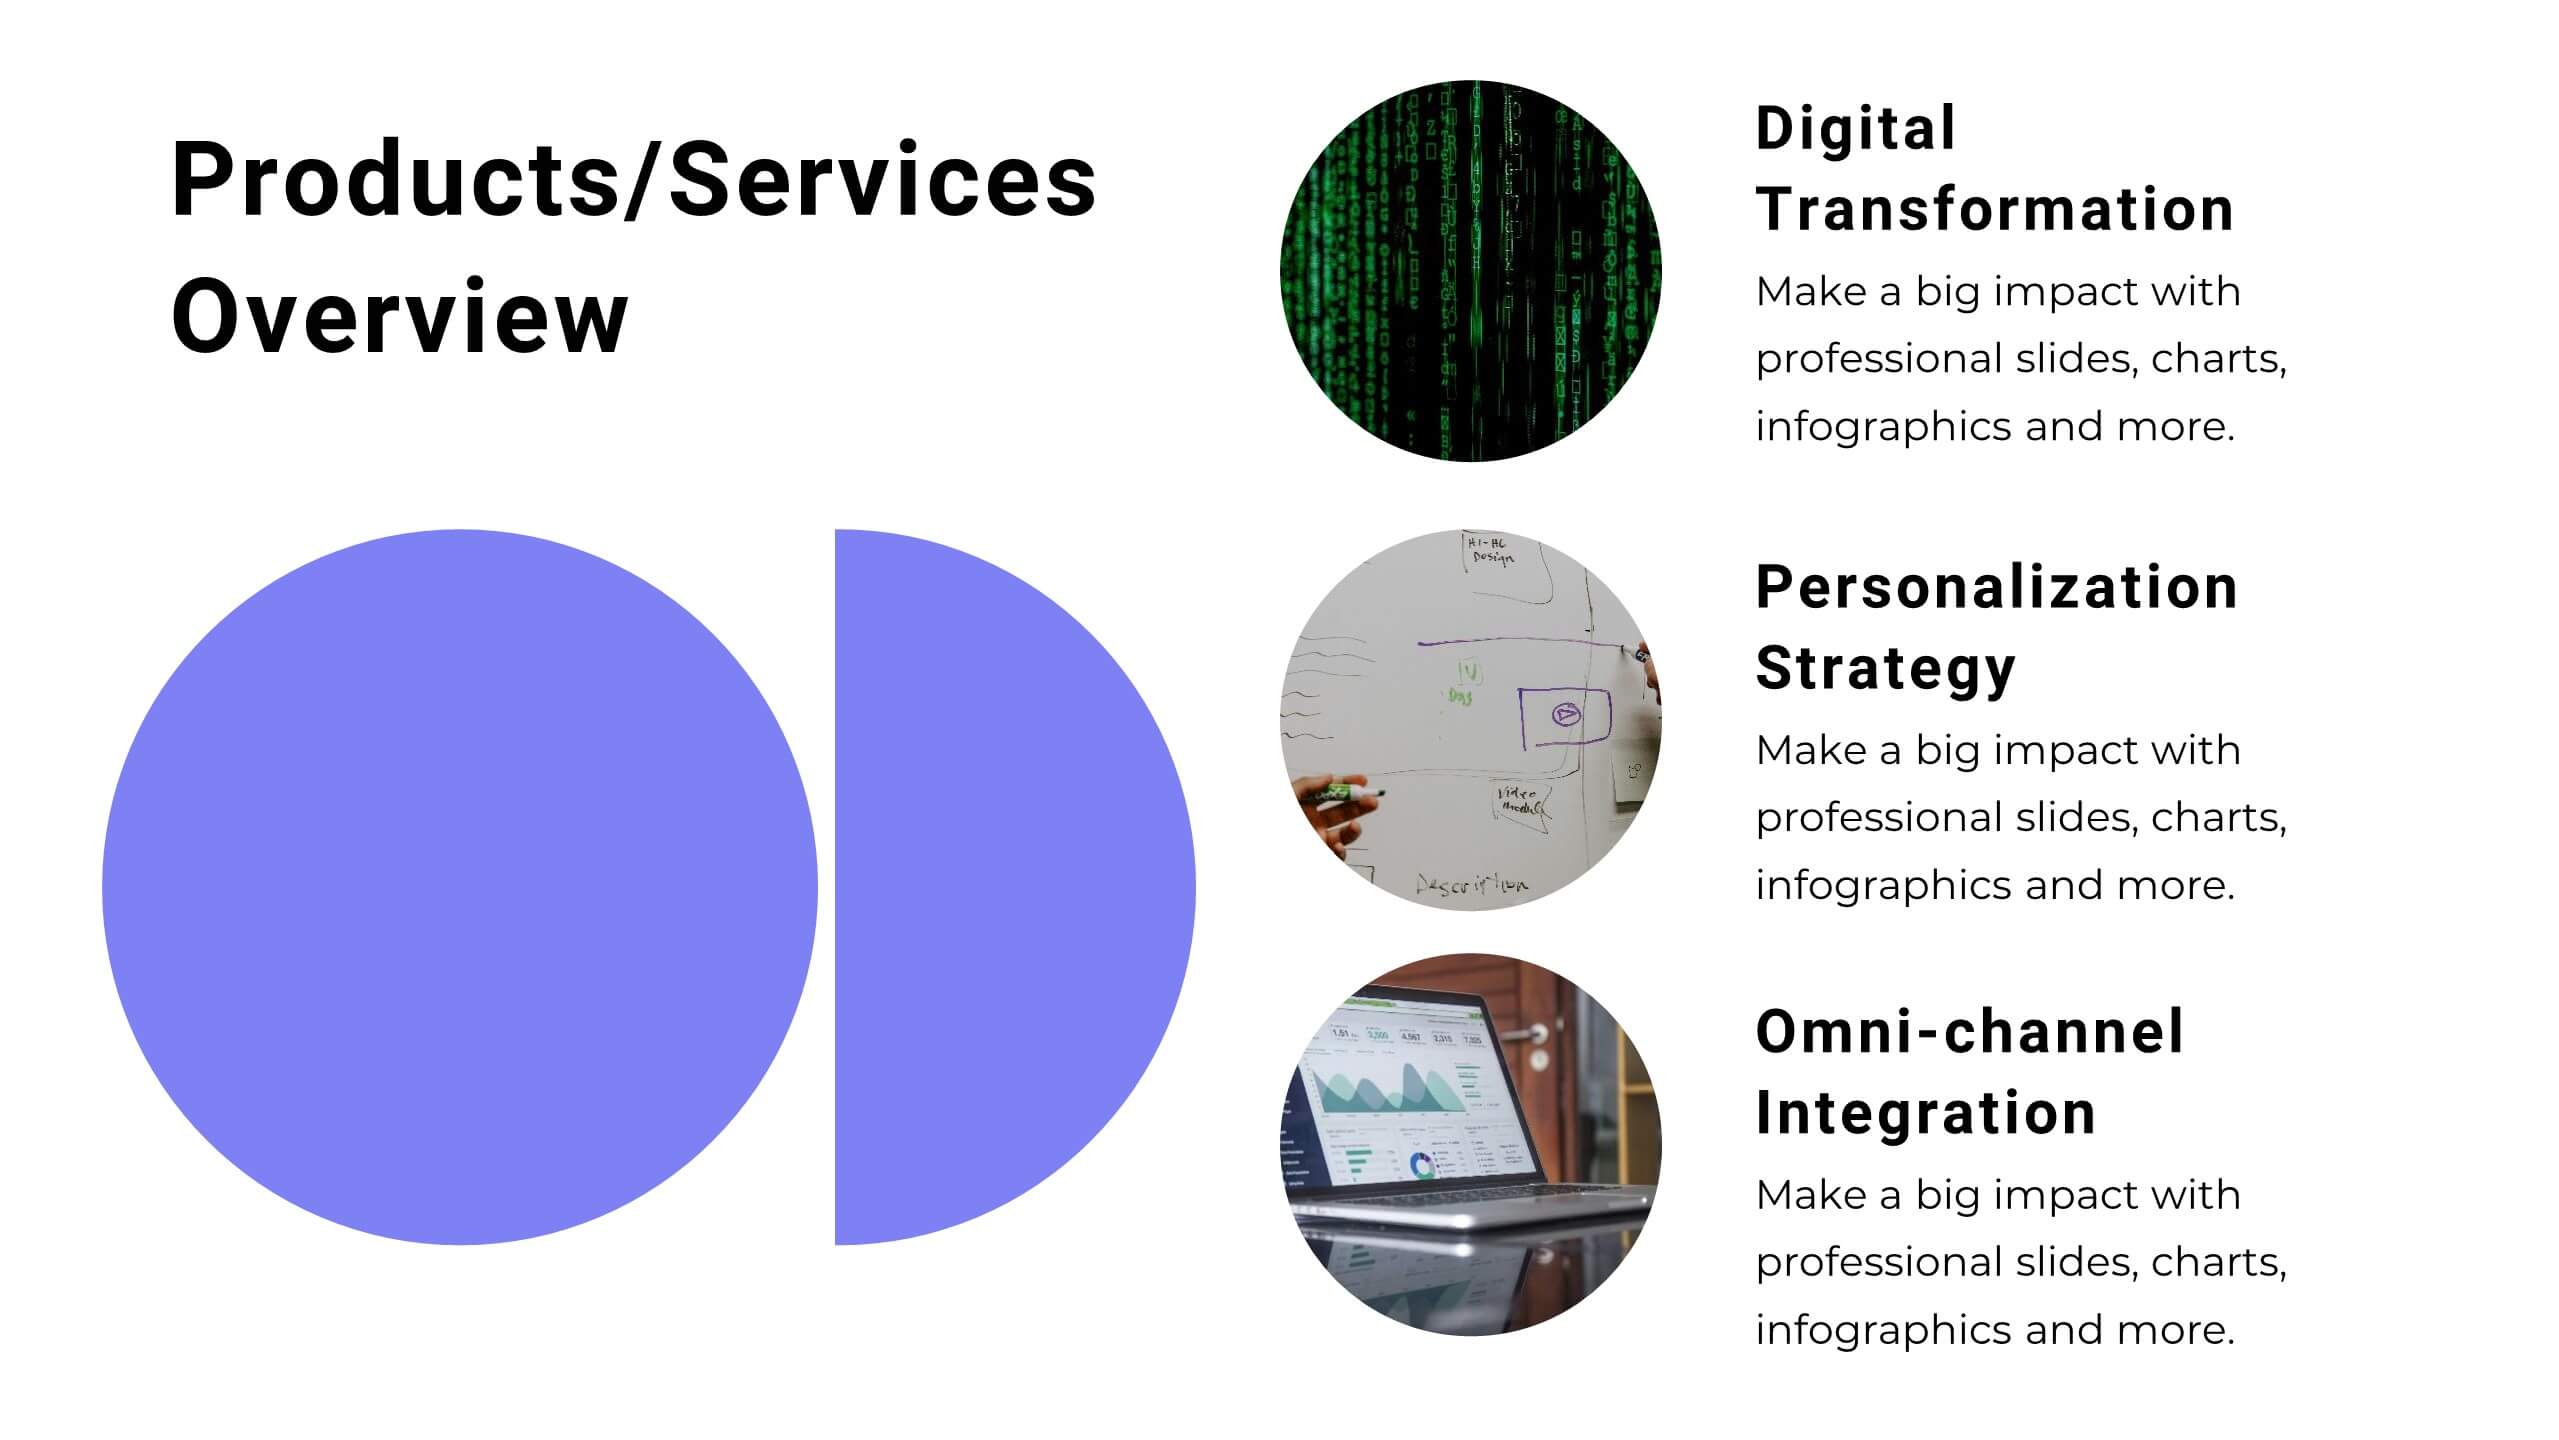
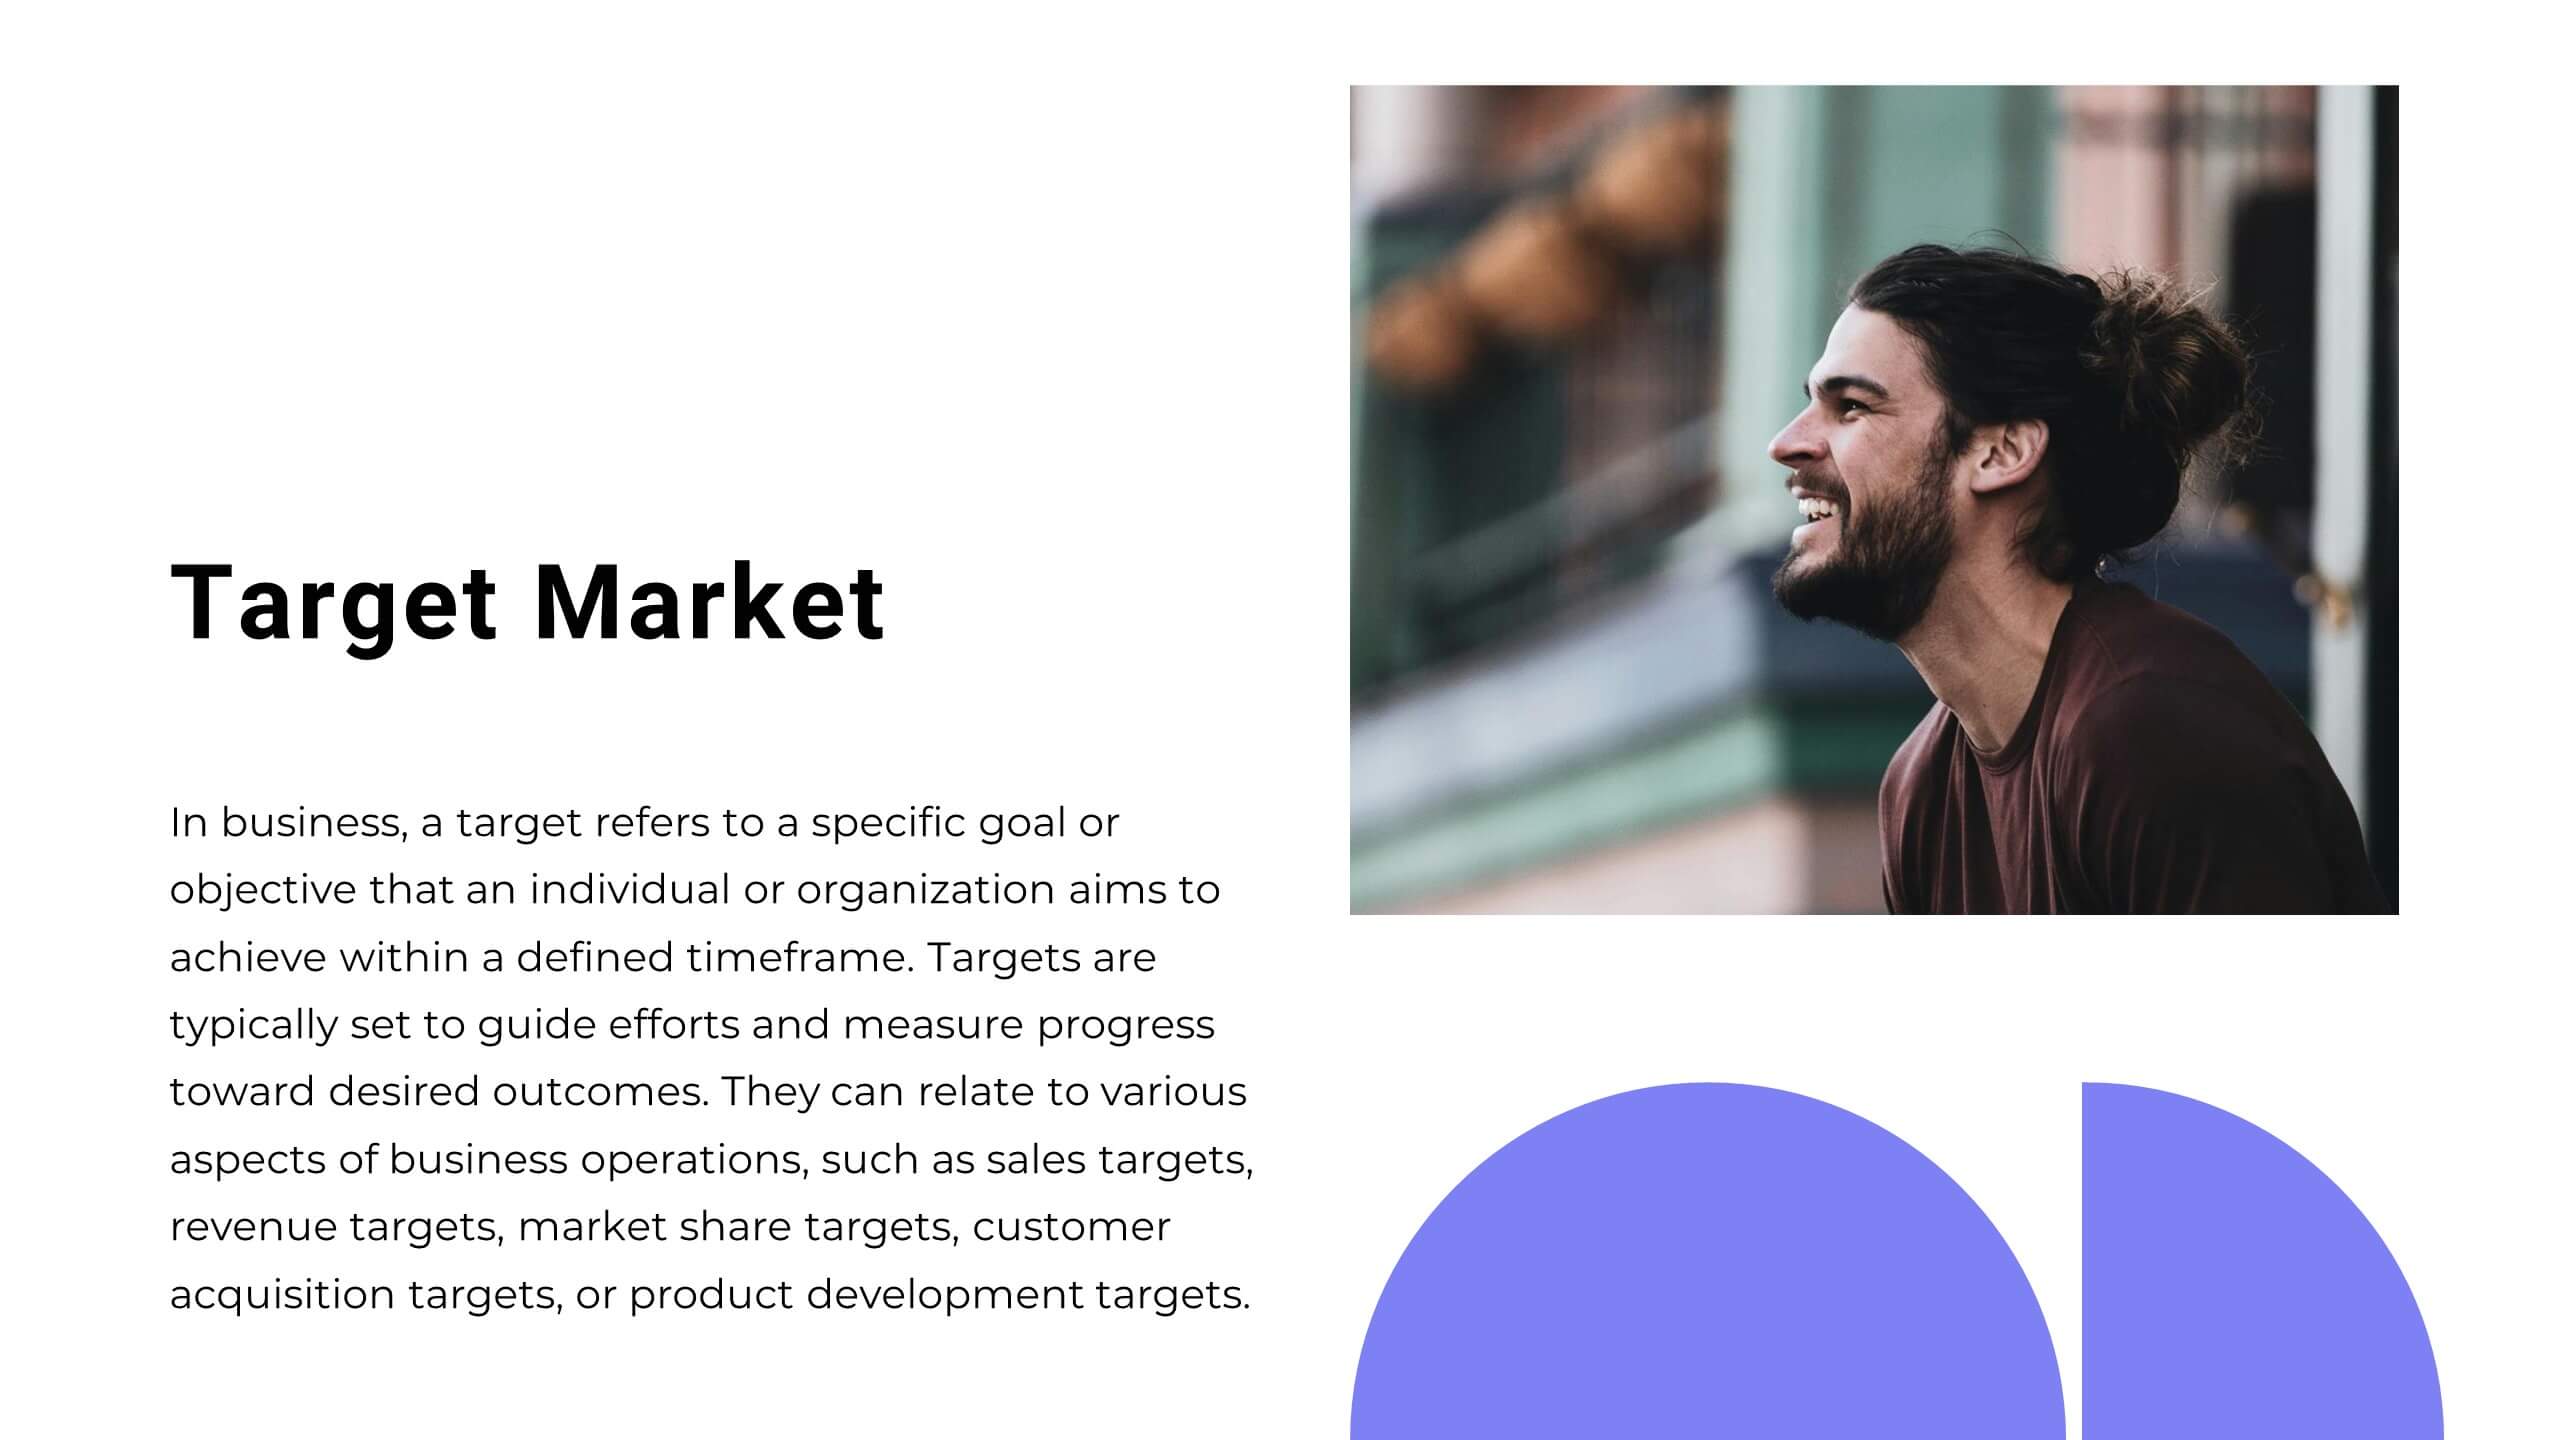
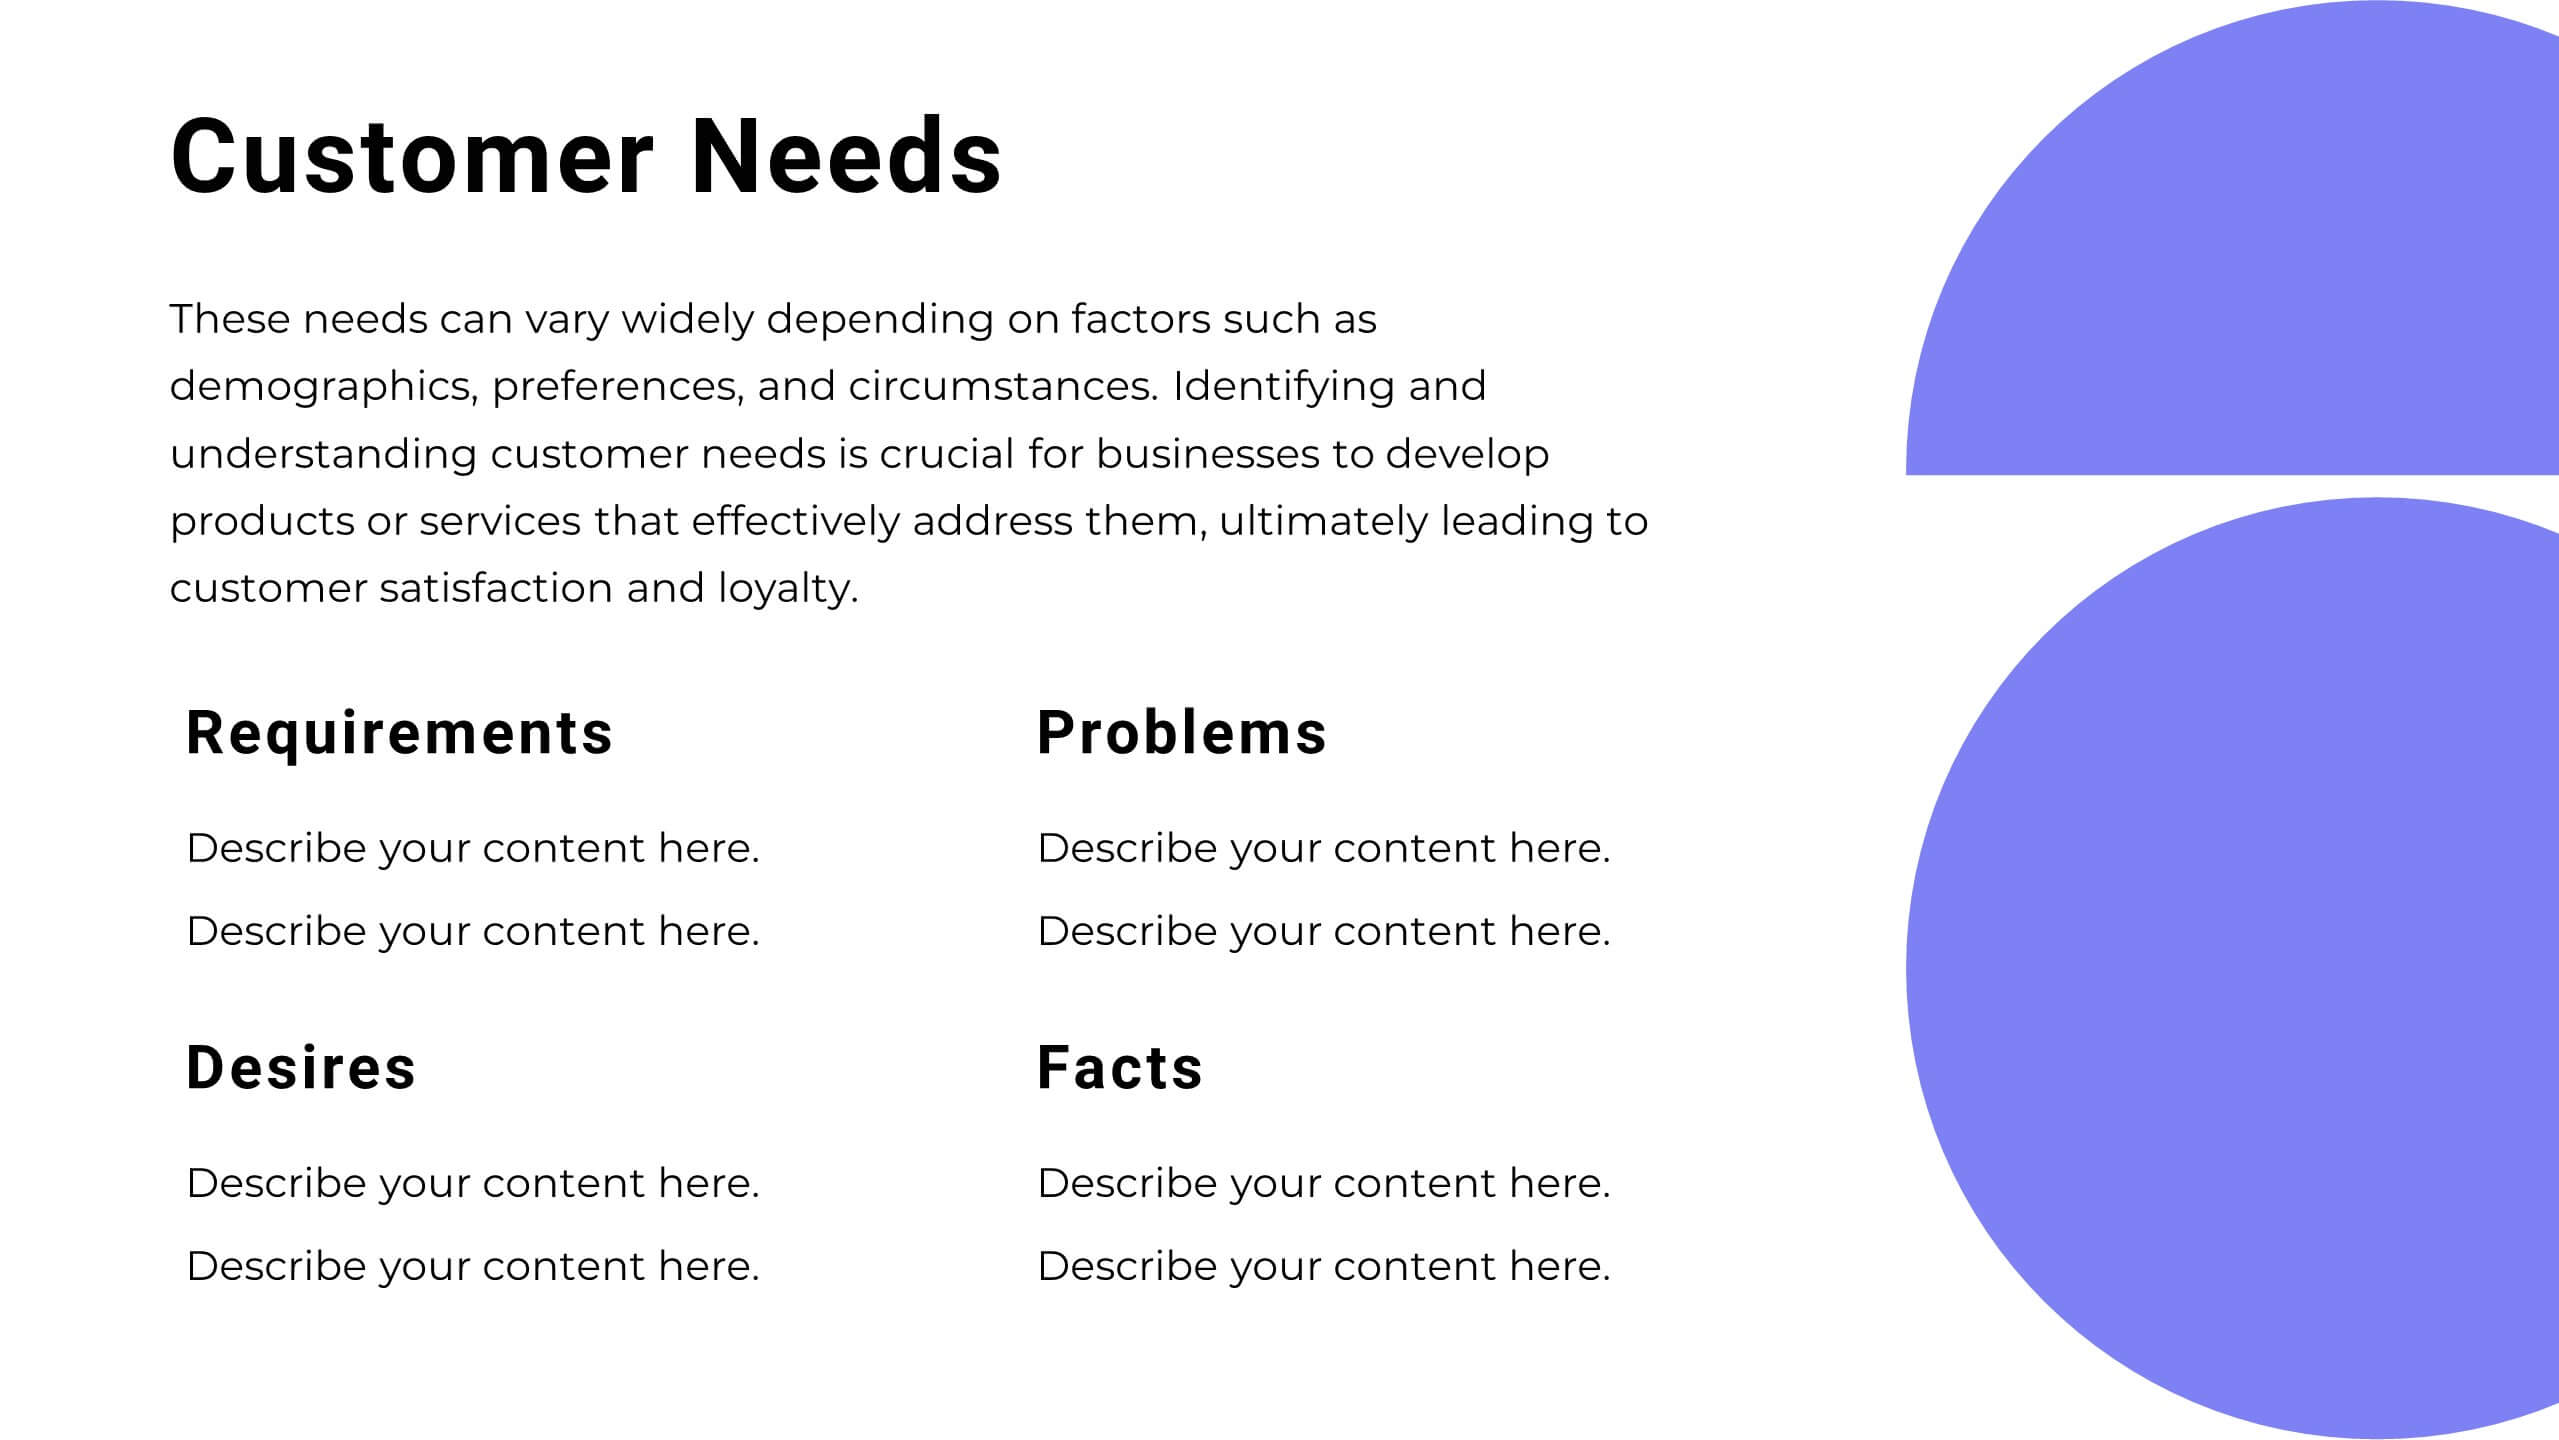
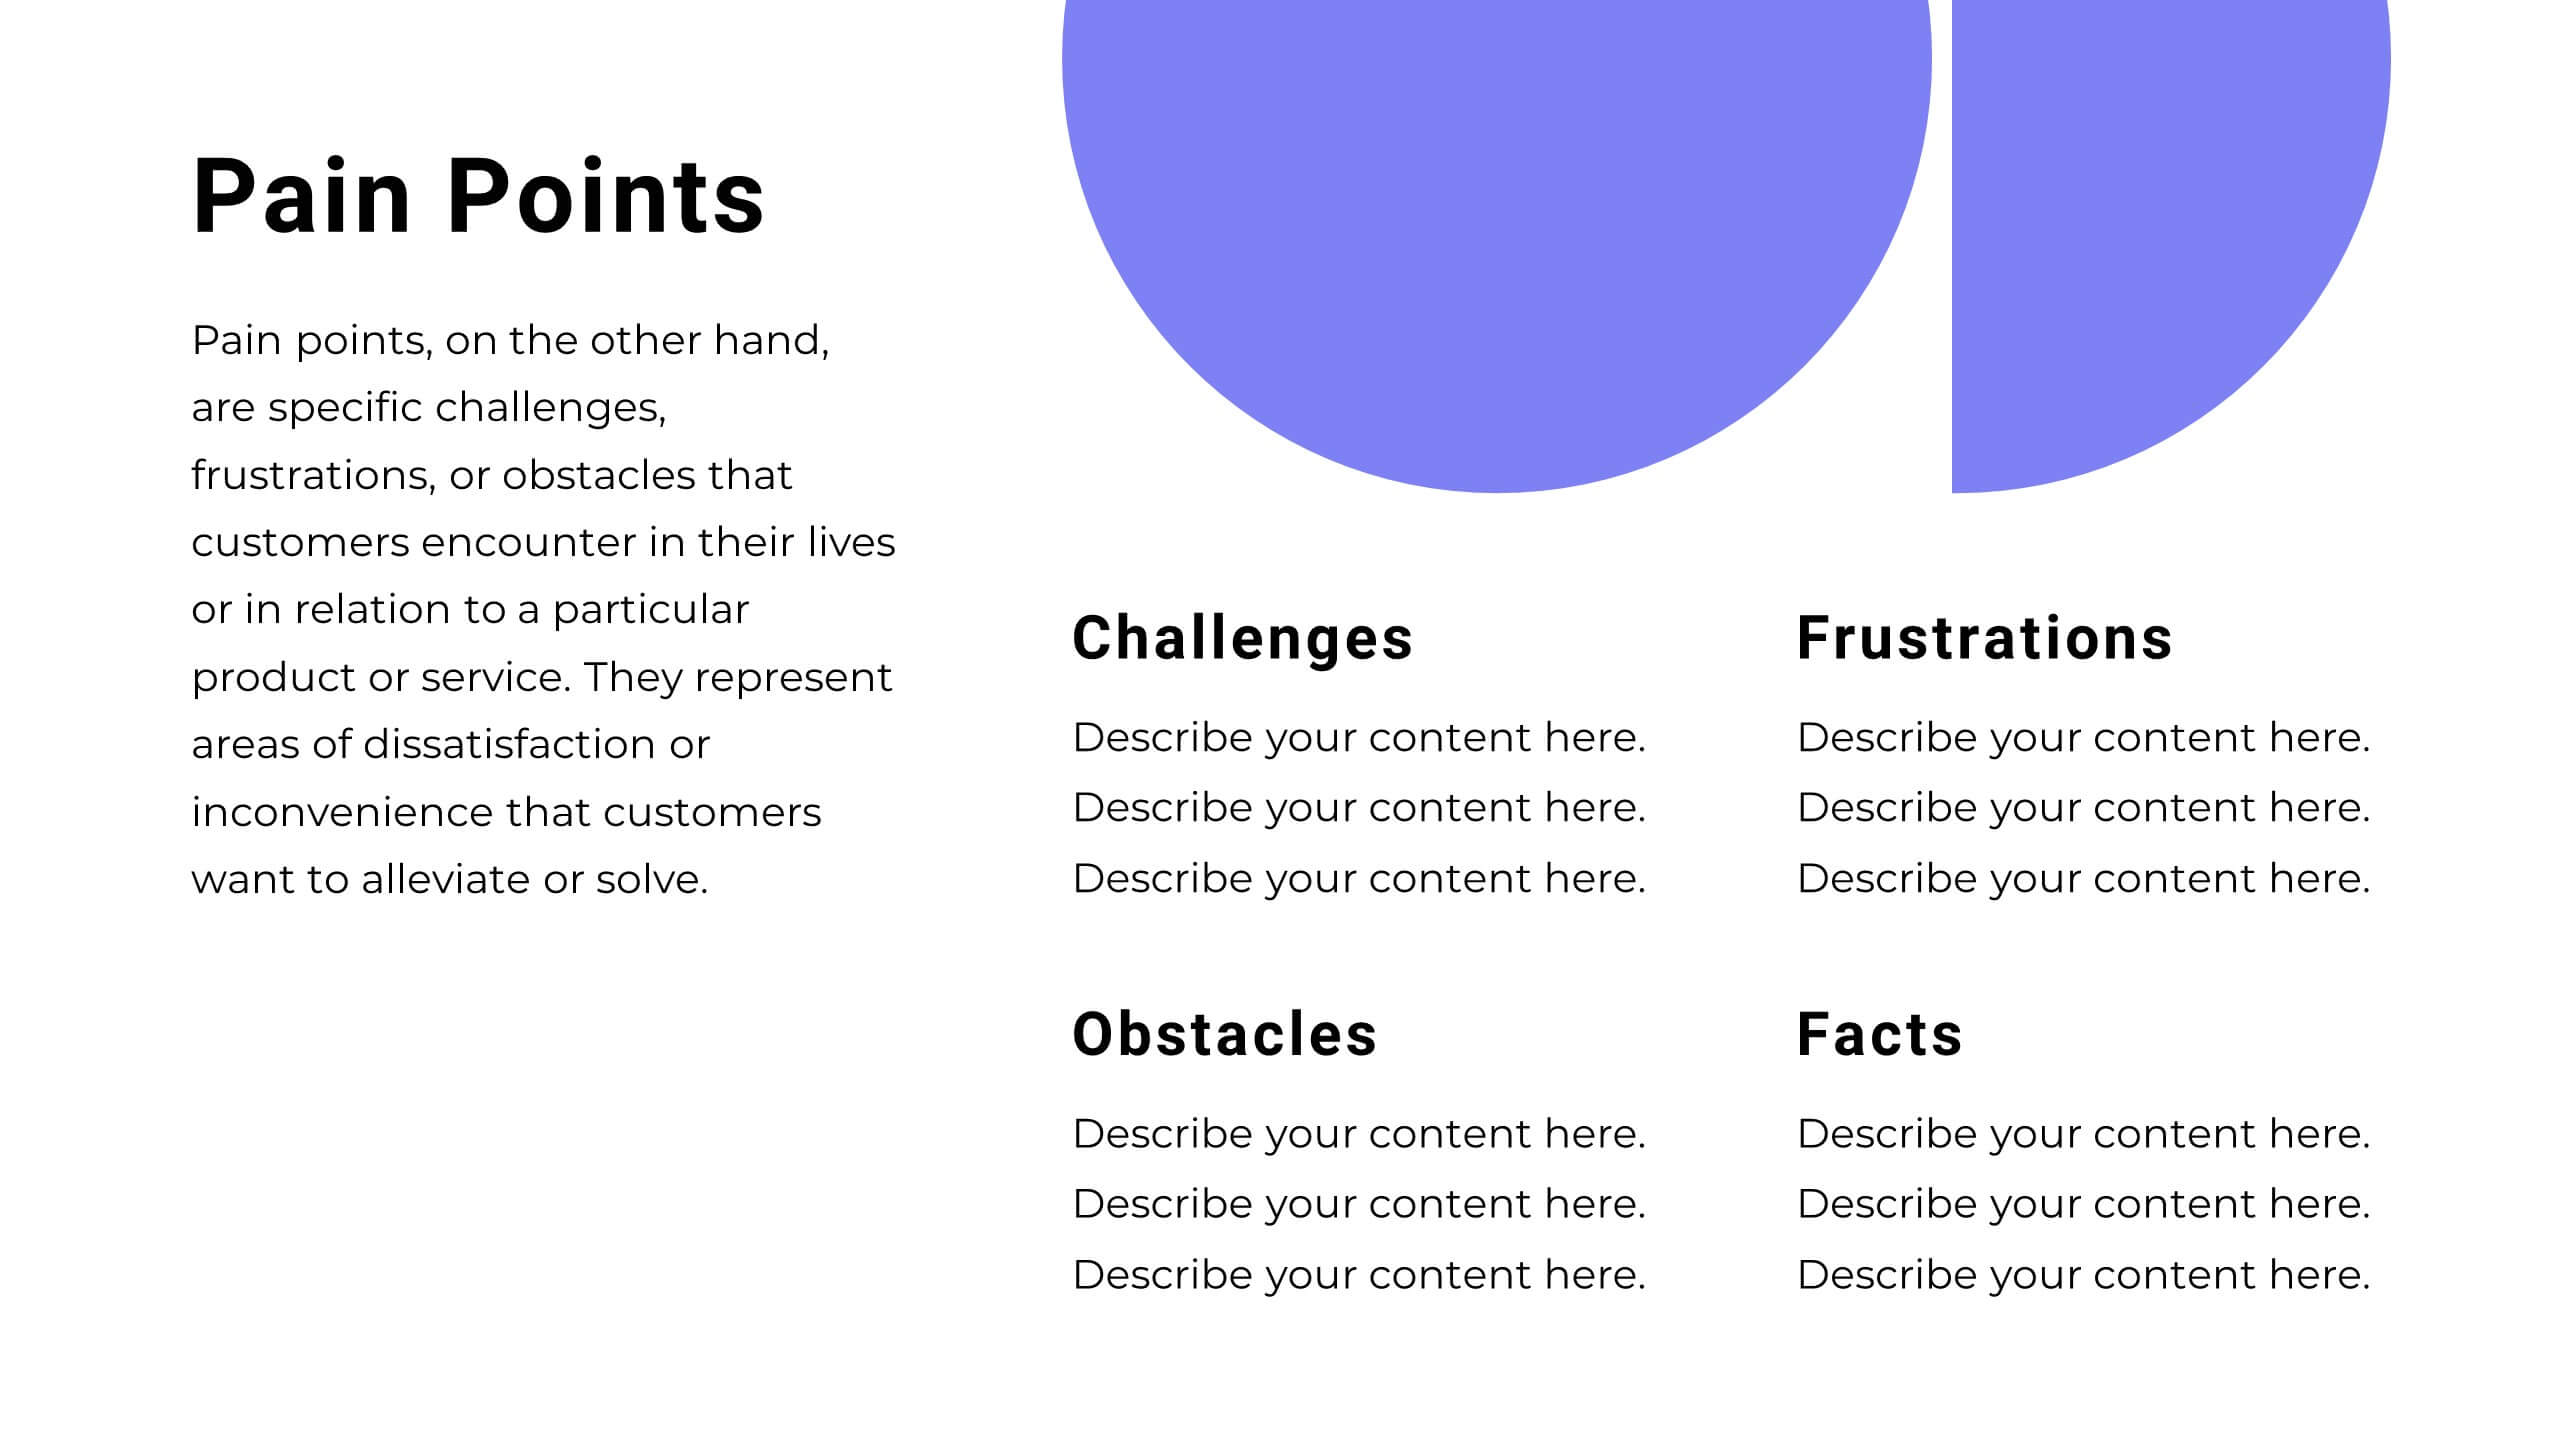
Vibrant Startup Pitch Deck Presentation
This dynamic and modern Startup Pitch Deck template is perfect for showcasing your startup's vision, strategy, and growth potential. Featuring a sleek design with bold visuals, this template guides you through key sections such as mission and vision, product/service overview, target market, and financial projections. It’s tailored to help you tell a compelling story that resonates with investors and stakeholders. The template is fully customizable in PowerPoint, Keynote, or Google Slides, ensuring you can adapt it to your specific needs and create a memorable presentation that leaves a lasting impression.


4 slides
Budget Projection with Predictive Analysis Presentation
Visualize future financial outcomes with clarity using the Budget Projection with Predictive Analysis Presentation. This modern funnel-style layout helps break down key stages of budget forecasting, making it easy to communicate progressions and data-driven insights. Perfect for financial planning, reporting, or strategic reviews. Fully editable in PowerPoint, Google Slides, Keynote, and Canva.


5 slides
Project Management Framework Presentation
Master the art of project management with our Project Management Framework template. This design is tailored to guide you through every phase of your project, ensuring a smooth and structured execution. The template is perfect for visually representing processes within PowerPoint, Keynote, and Google Slides, providing a clear pathway from project initiation to completion. Ideal for project managers looking to streamline their strategies and enhance project communication.


10 slides
Farming Technologies and Crop Management
Present cutting-edge insights with the Farming Technologies and Crop Management Presentation. This visually compelling slide uses wind turbine illustrations to symbolize innovation in agriculture. Ideal for showcasing smart farming tools, sustainable practices, and crop optimization strategies. Fully editable and compatible with PowerPoint, Keynote, and Google Slides.


5 slides
Organic Search Growth Plan Presentation
Grow your visibility the natural way with this sleek and easy-to-follow organic strategy slide. Perfect for outlining SEO goals, keyword clusters, and growth tactics, this visual layout makes your presentation clean and compelling. Fully compatible with PowerPoint, Keynote, and Google Slides for flexible editing across platforms.


4 slides
Ishikawa Diagram for Process Review Presentation
Visualize cause-and-effect relationships with the Ishikawa Diagram for Process Review Presentation. Also known as a fishbone diagram, this template is perfect for identifying potential root causes during quality control or team brainstorming sessions. Easily editable in Canva, PowerPoint, and Google Slides to match your workflow and style.


5 slides
Competitor Comparison Infographics
A Comparison Infographic is a type of visual representation that displays the similarities and differences between two or more items, concepts, or ideas. This template is perfect to help viewers easily make informed decisions based on the comparison. These infographics are visual representations of data that are used to compare two or more things. These infographics can be used to highlight the differences or similarities between different products, services, companies, or any other entities that can be compared. Included are charts, graphs, tables, and other visual elements to help present information in a clear manner.


4 slides
Real Estate Market Trends
Present housing data and property growth insights with this ascending building chart layout. Perfect for realtors, investors, and market analysts, this template helps visualize real estate performance over time. Fully editable in PowerPoint, Keynote, and Google Slides.


19 slides
Philosium Design Strategy Proposal Presentation
Bring your creative vision to life with this sleek and structured design strategy proposal presentation. Covering key elements like concept development, wireframes, typography, and user research, this template helps you communicate a compelling design approach. Fully customizable and compatible with PowerPoint, Keynote, and Google Slides for a seamless and professional presentation experience.