


Features
- 5 Unique slides
- Fully editable and easy to edit in Microsoft Powerpoint, Keynote and Google Slides
- 16:9 widescreen layout
- Clean and professional designs
- Export to JPG, PDF or send by email


Do you have any questions?
Recommend


7 slides
Leadership Skills Infographic
Leadership skills encompass a range of abilities and qualities that enable an individual to guide, motivate, and manage a team or group of people effectively. Embark on this joyful adventure through the realm of leadership skills, and let the vibrant colors and engaging design of our leadership skills infographic spark the leader within you. Compatible with Powerpoint, Keynote, and Google Slides. This template is designed to allow you to lead with a commitment to excellence. Roam through the realms of teamwork and collaboration, learning how to unite diverse individuals towards a common goal.


21 slides
Dreamwood Sales Pitch Deck Presentation
Deliver powerful sales presentations with this vibrant and engaging sales pitch deck template! It provides all essential sections, including sales objectives, customer testimonials, pricing strategy, and performance metrics, to help you leave a lasting impact. Perfect for business teams and client pitches, it’s compatible with PowerPoint, Keynote, and Google Slides for seamless customization.

20 slides
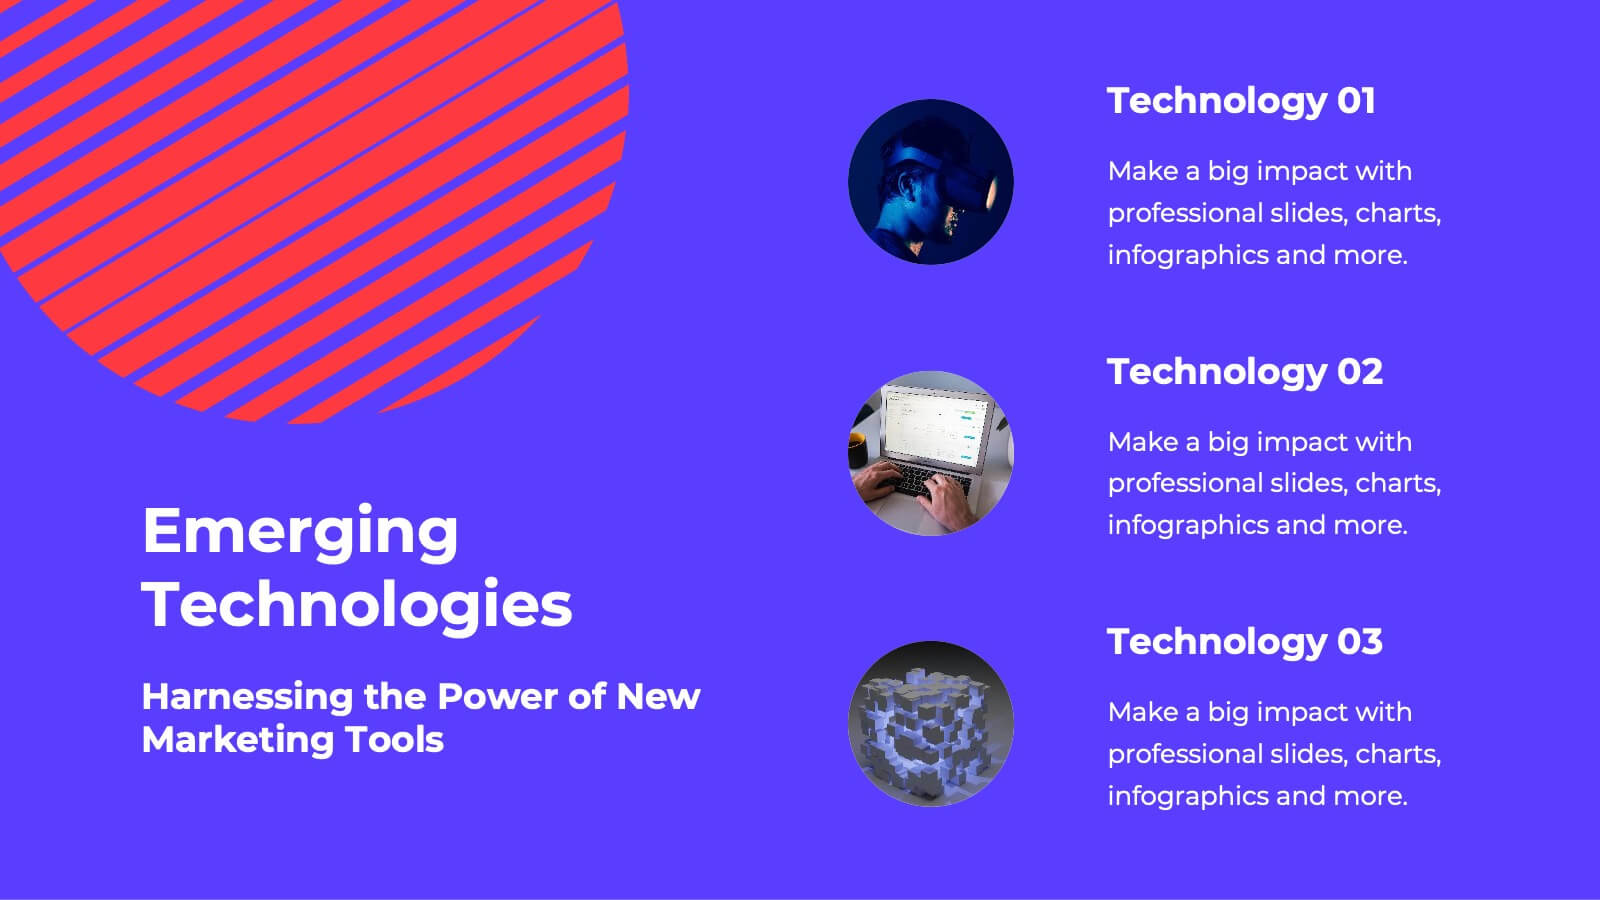
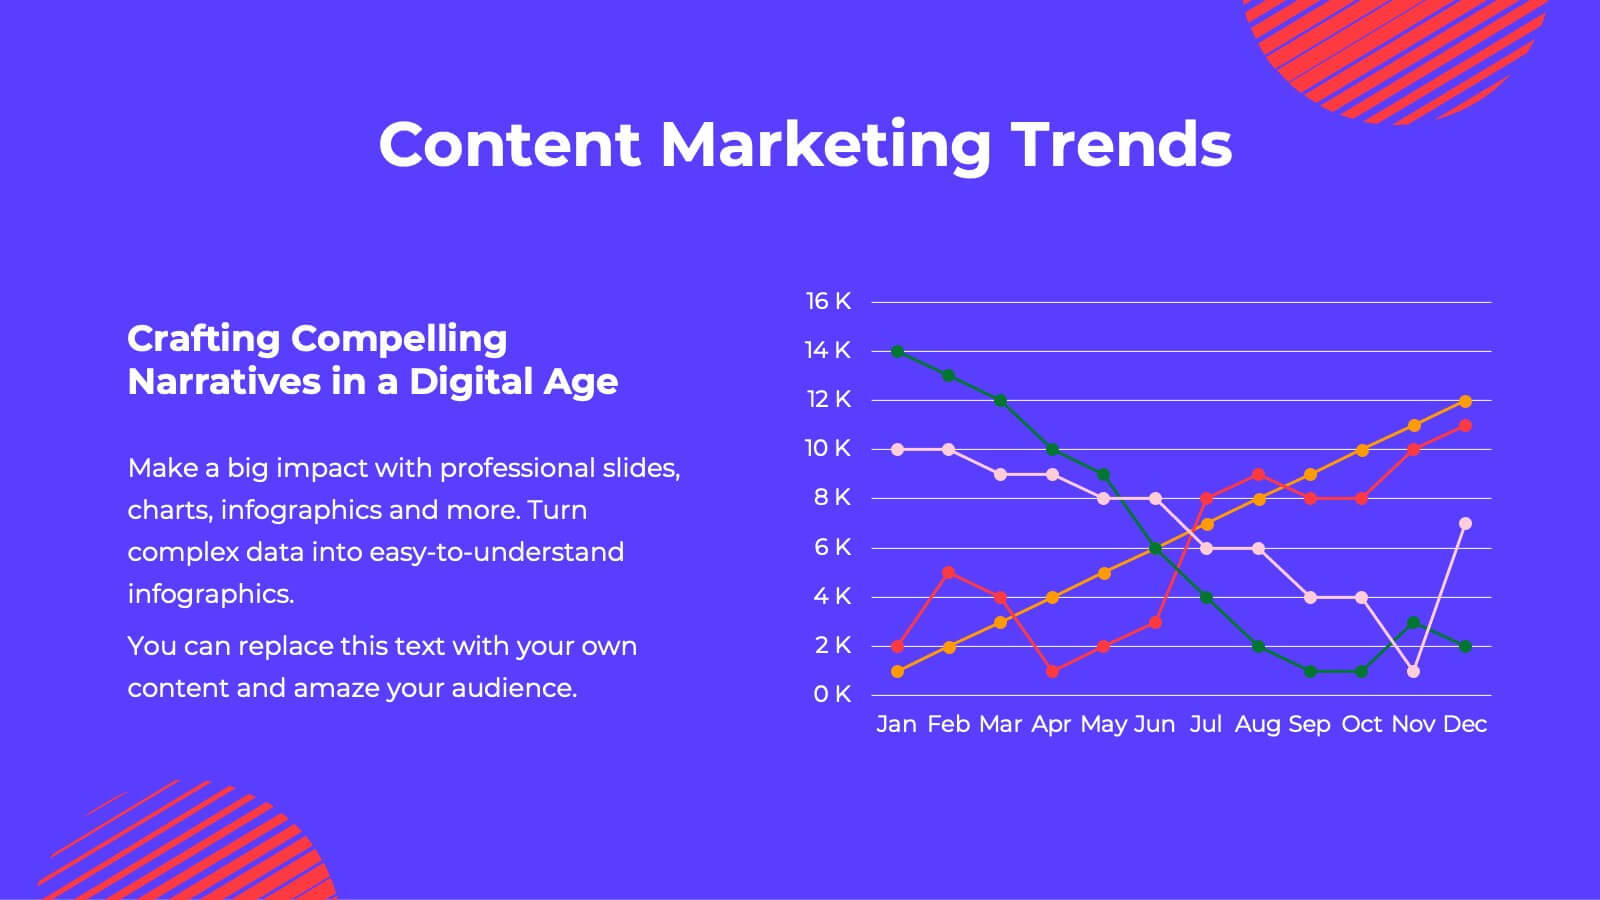
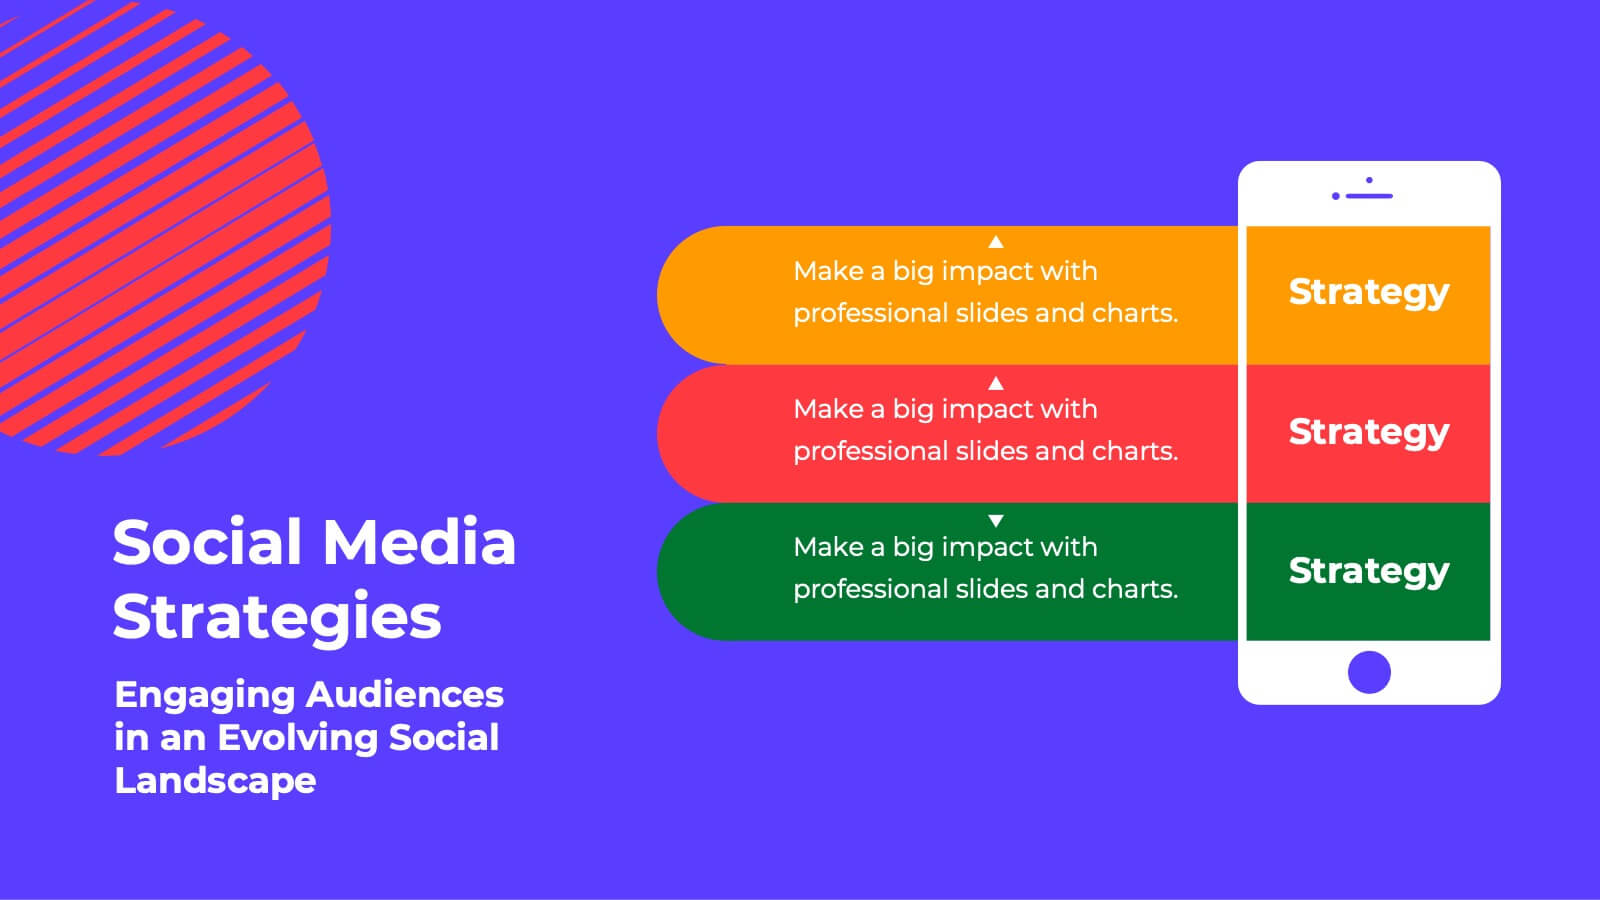
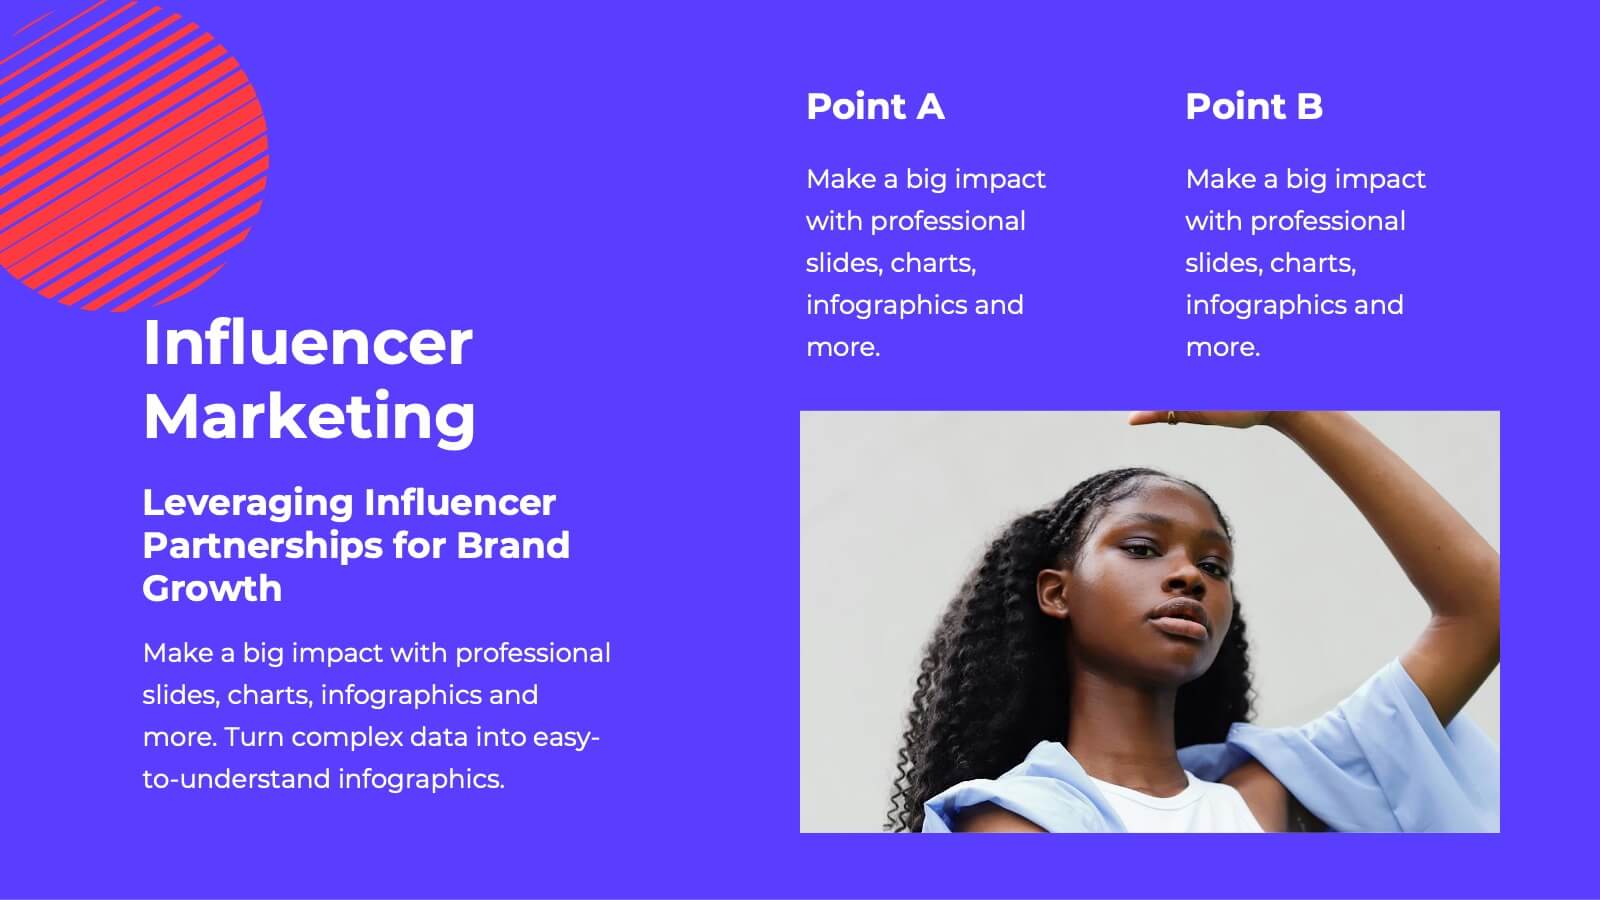
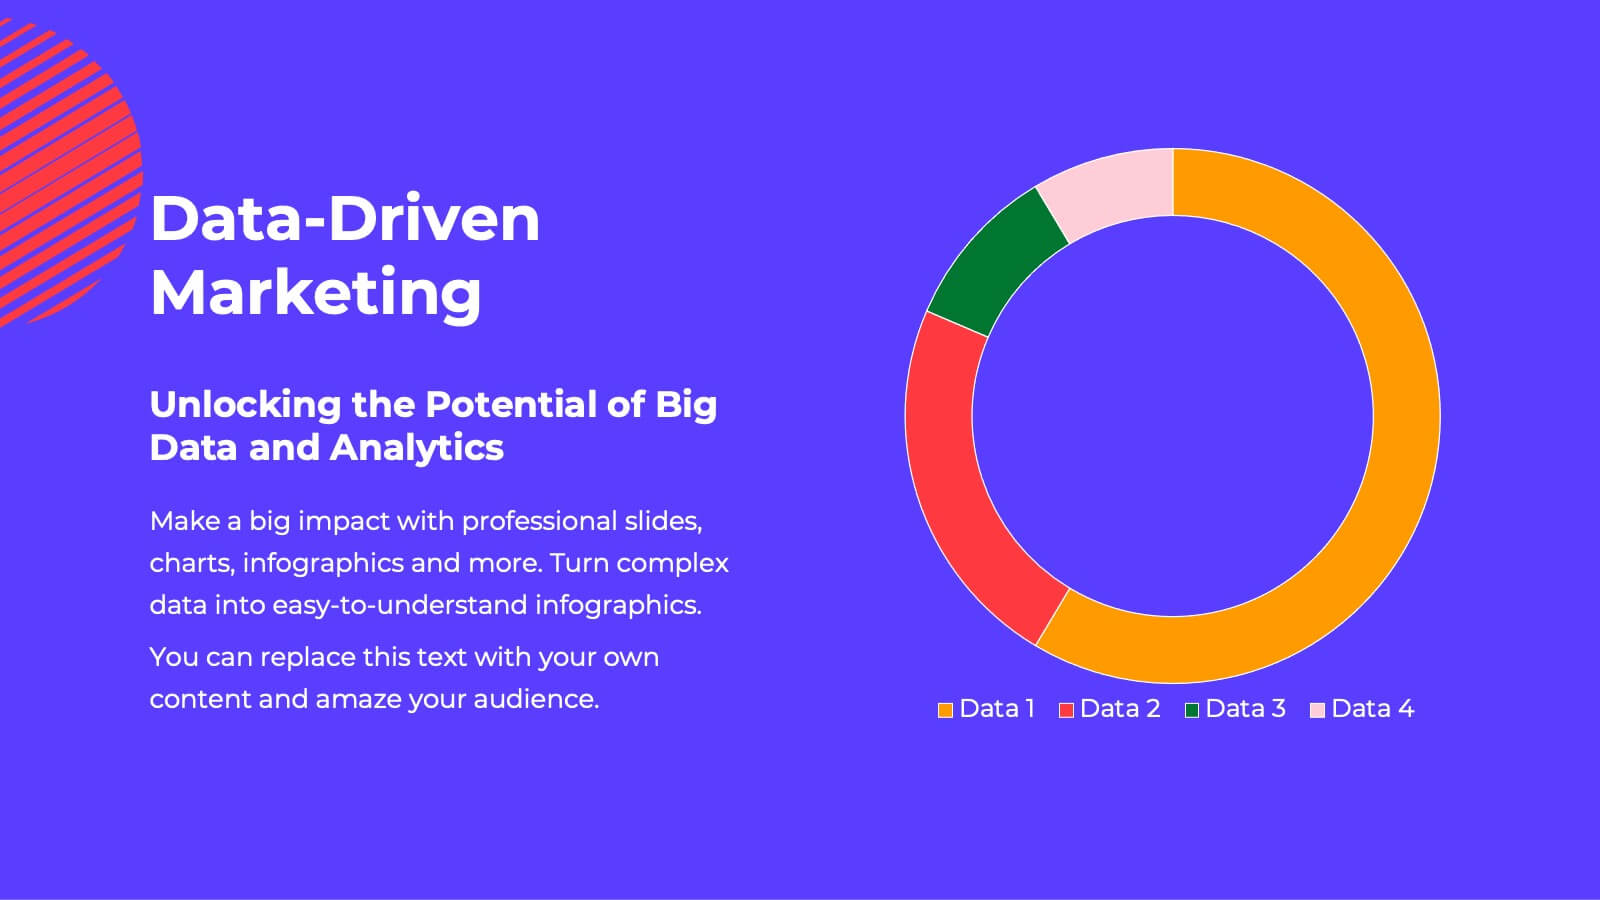
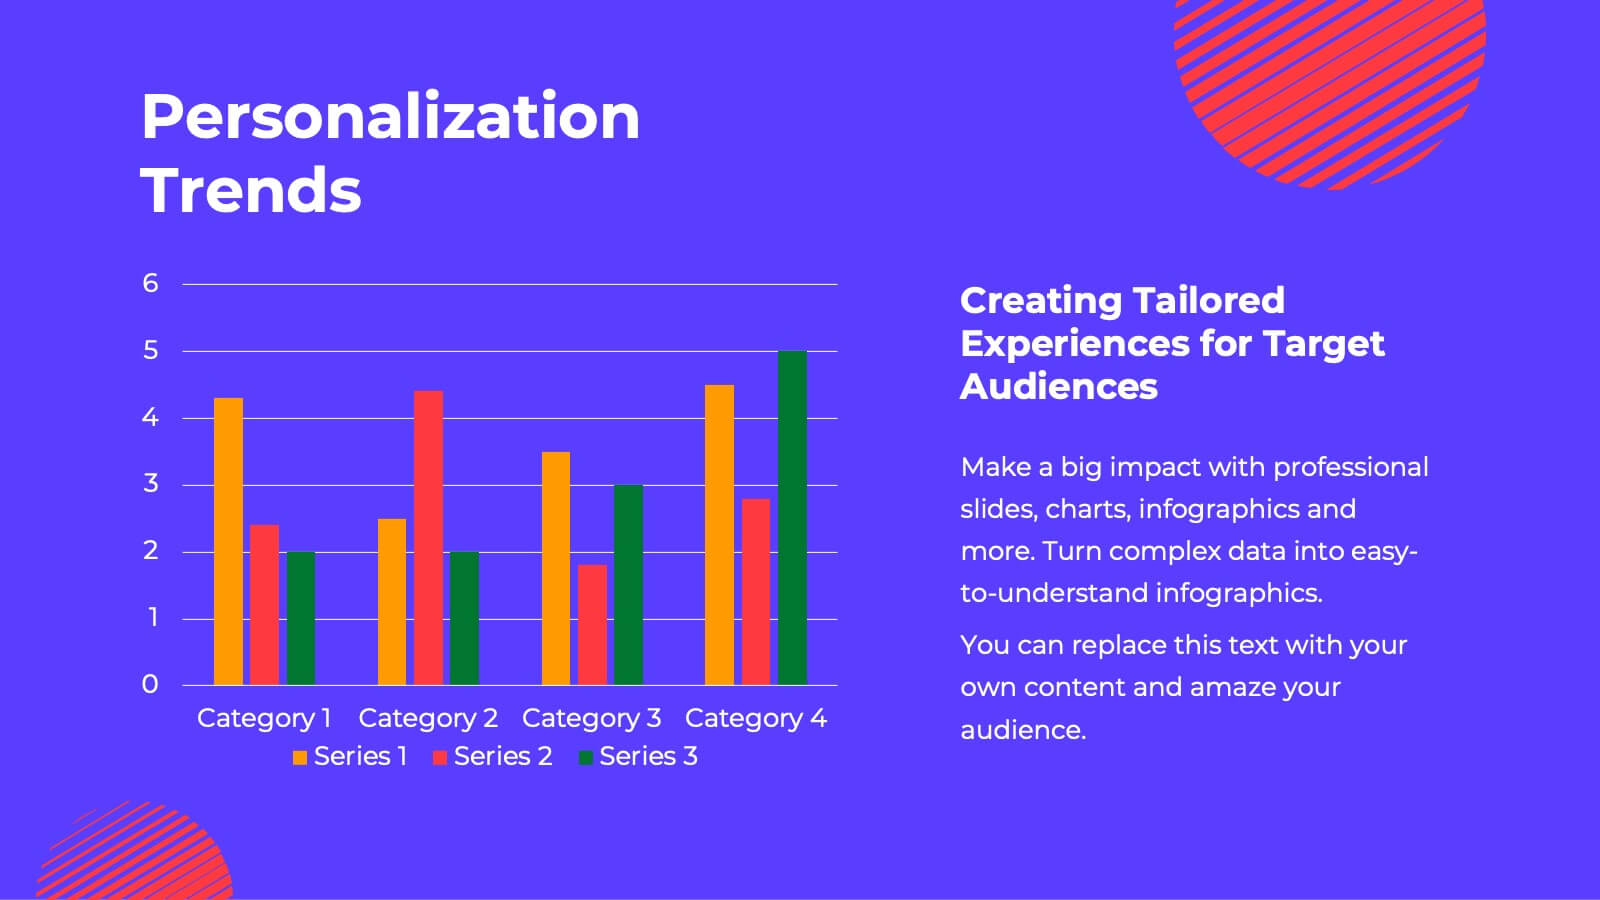
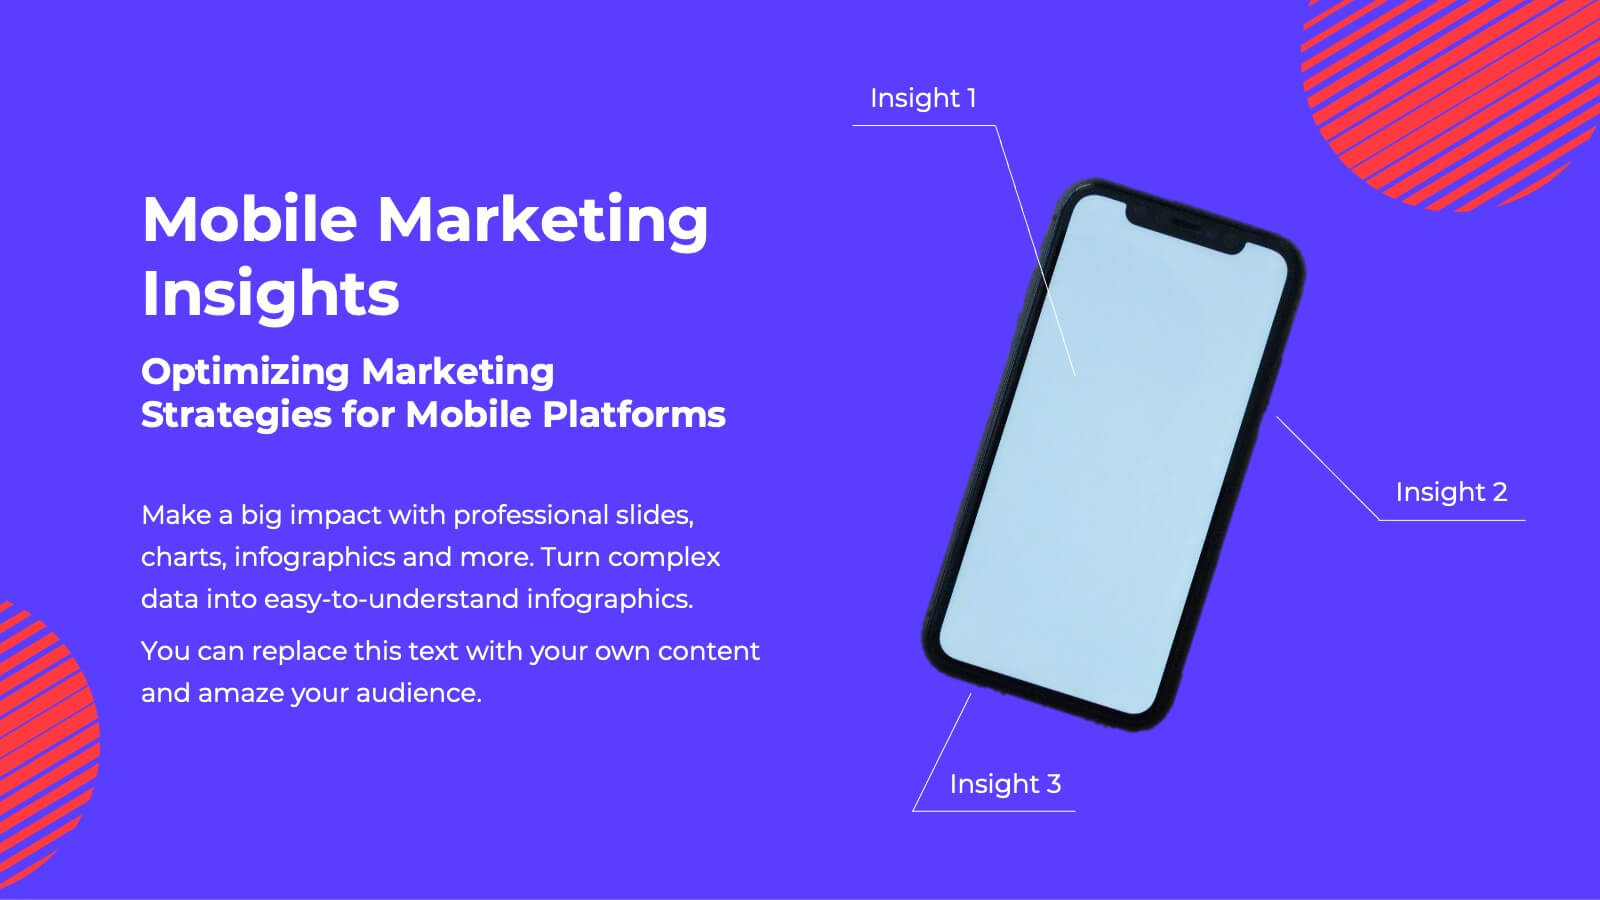
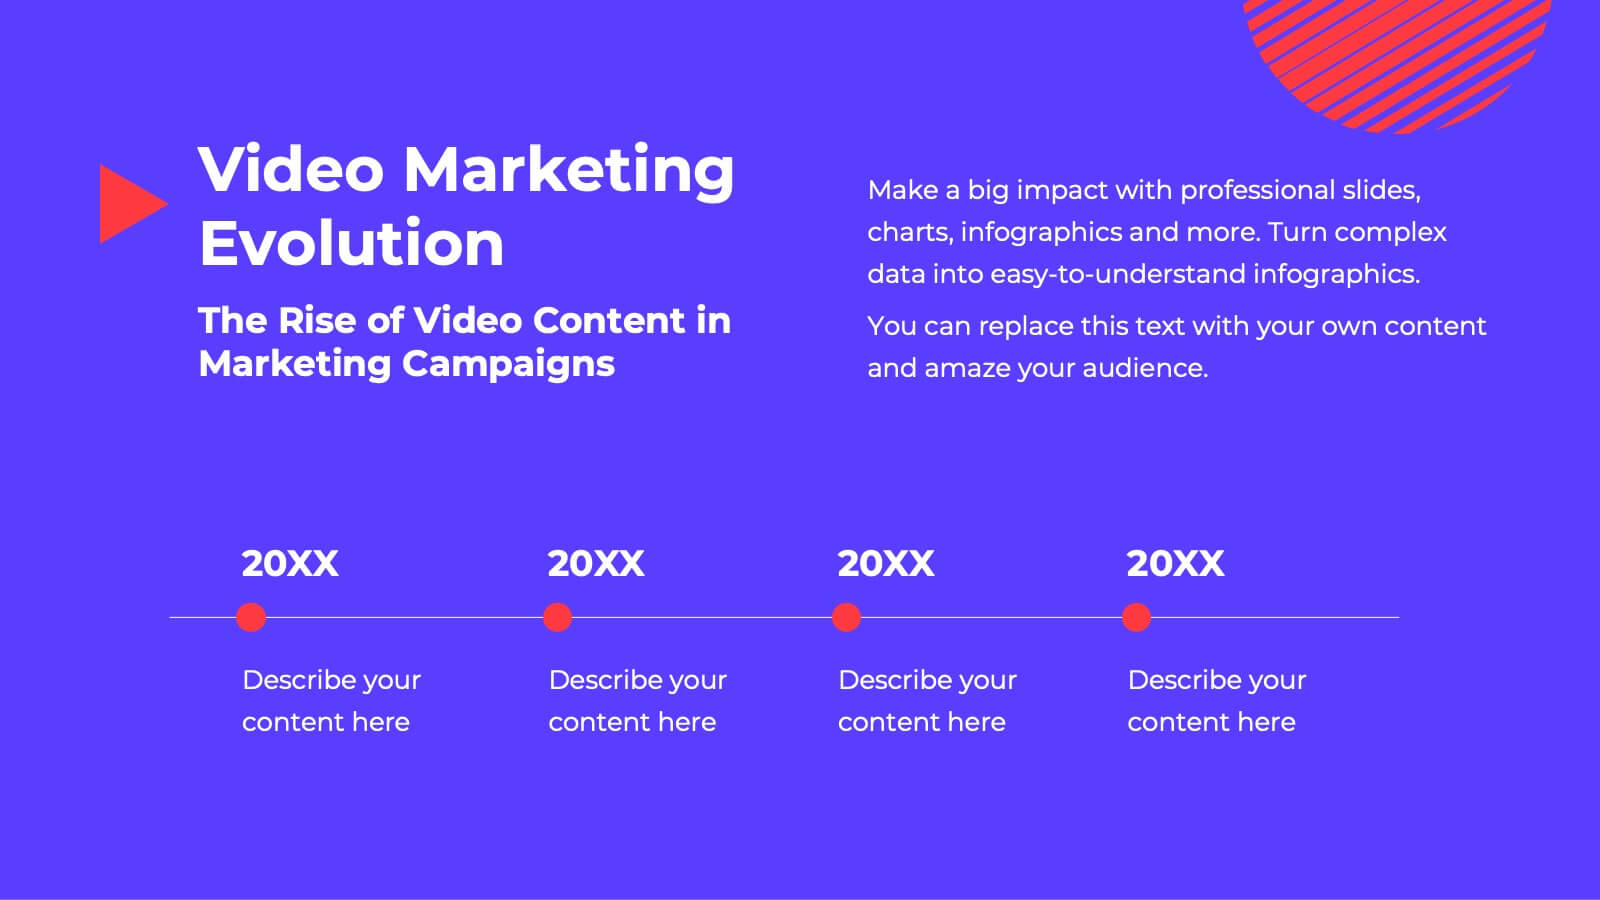
Fusion Marketing Campaign Presentation
Unleash the power of your marketing campaigns with this vibrant marketing campaign template! Dive into social media strategies, influencer marketing, data-driven insights, and more. Perfect for presenting to stakeholders and team members. Fully customizable and compatible with PowerPoint, Keynote, and Google Slides.


22 slides
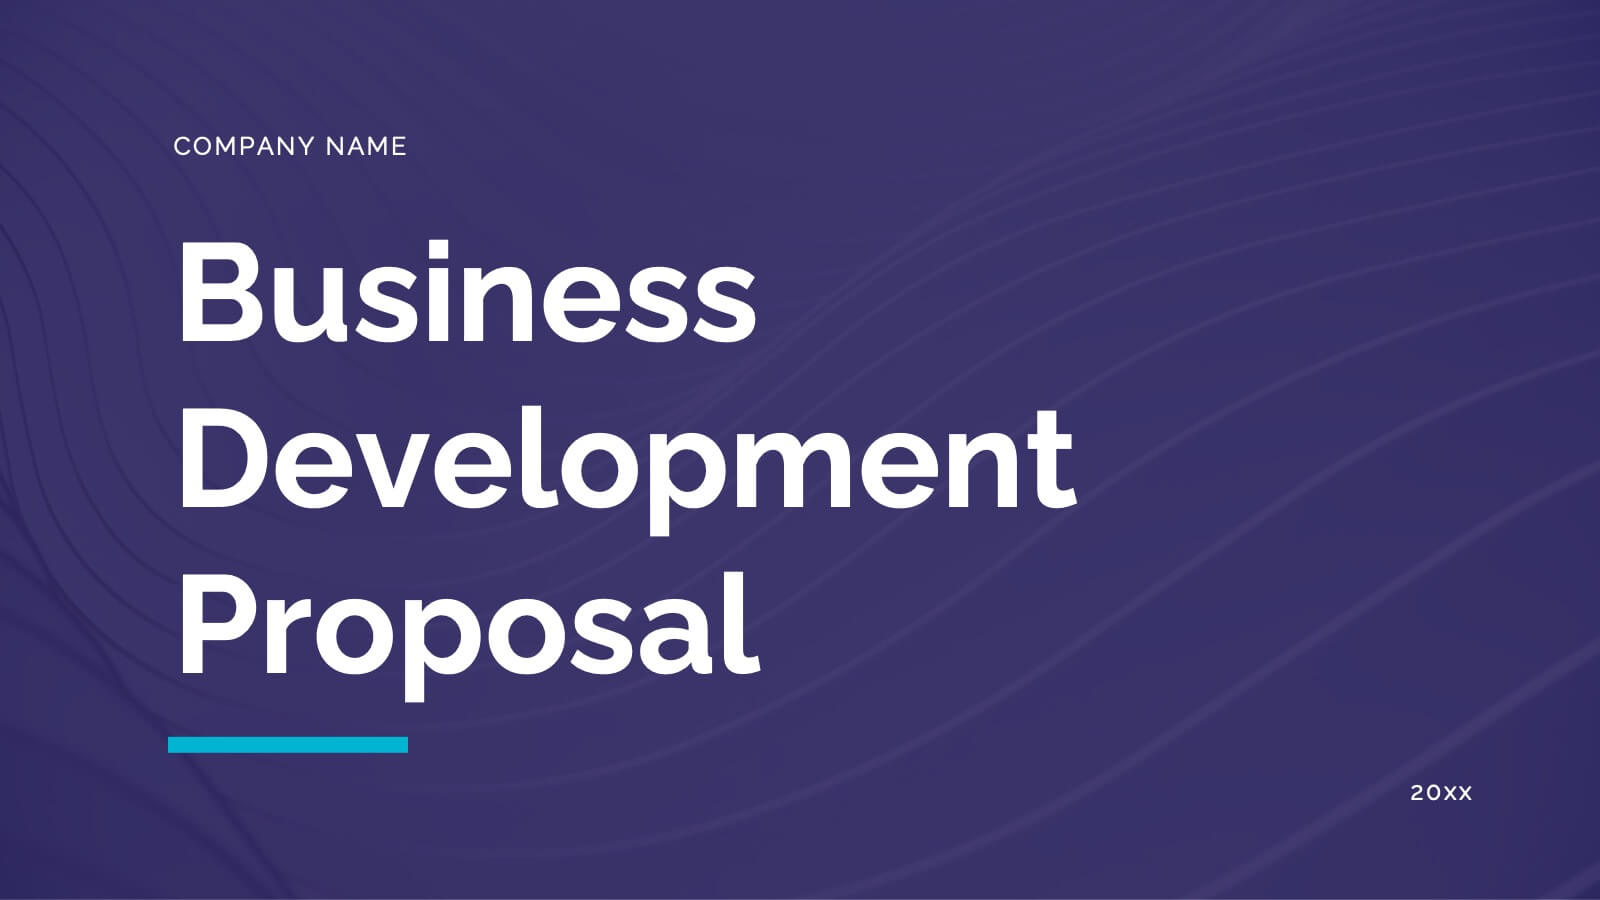
Nimbus Business Development Proposal Presentation
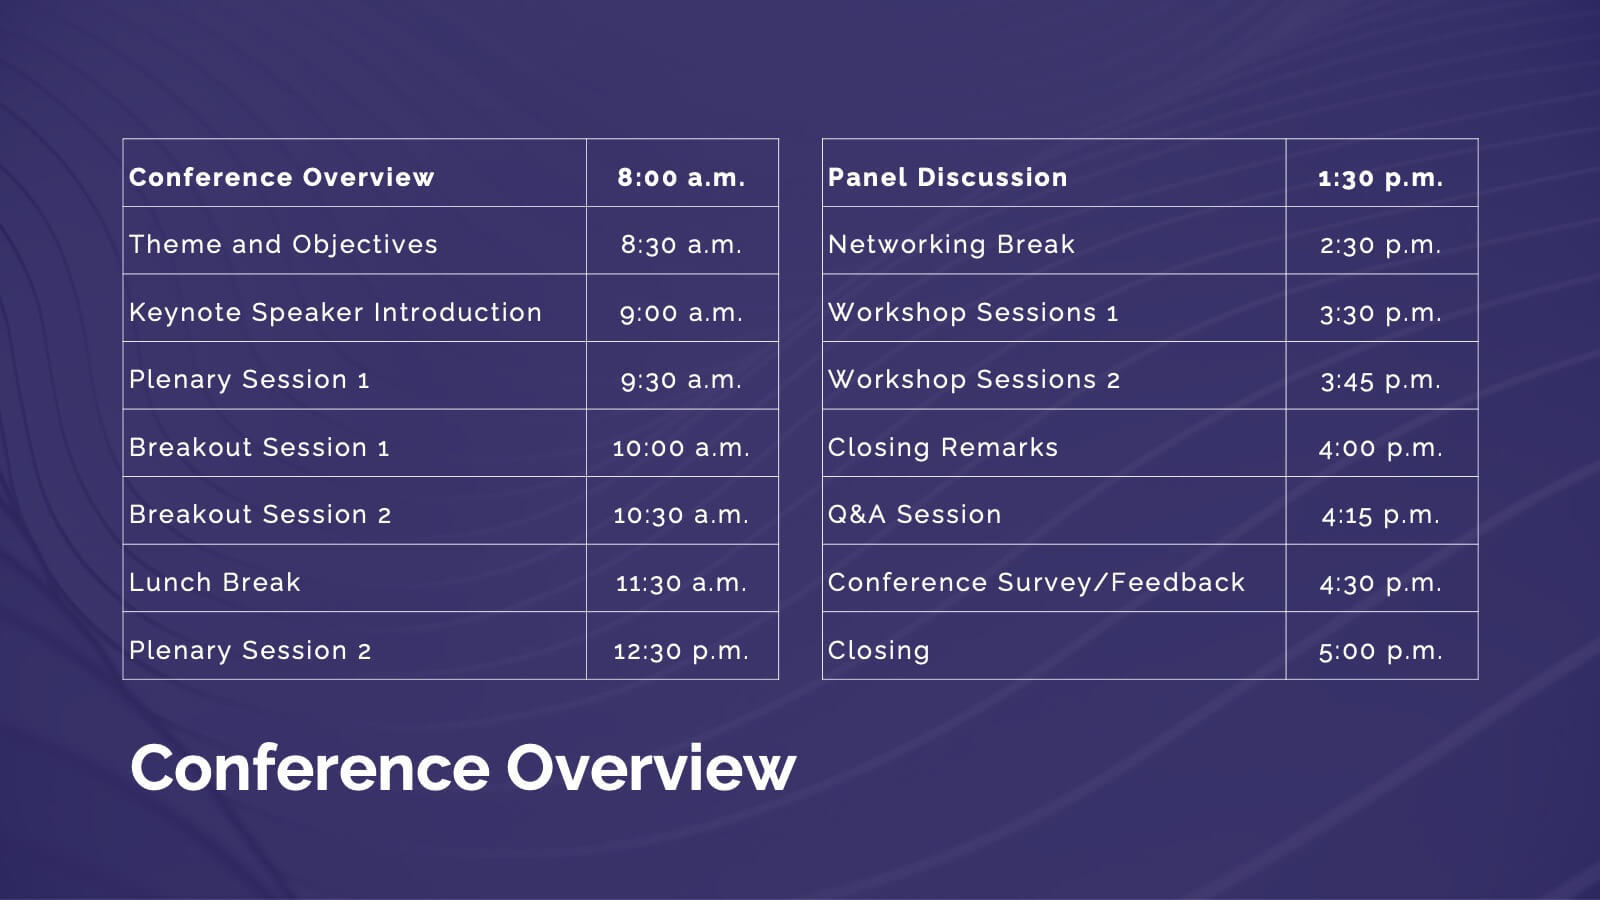
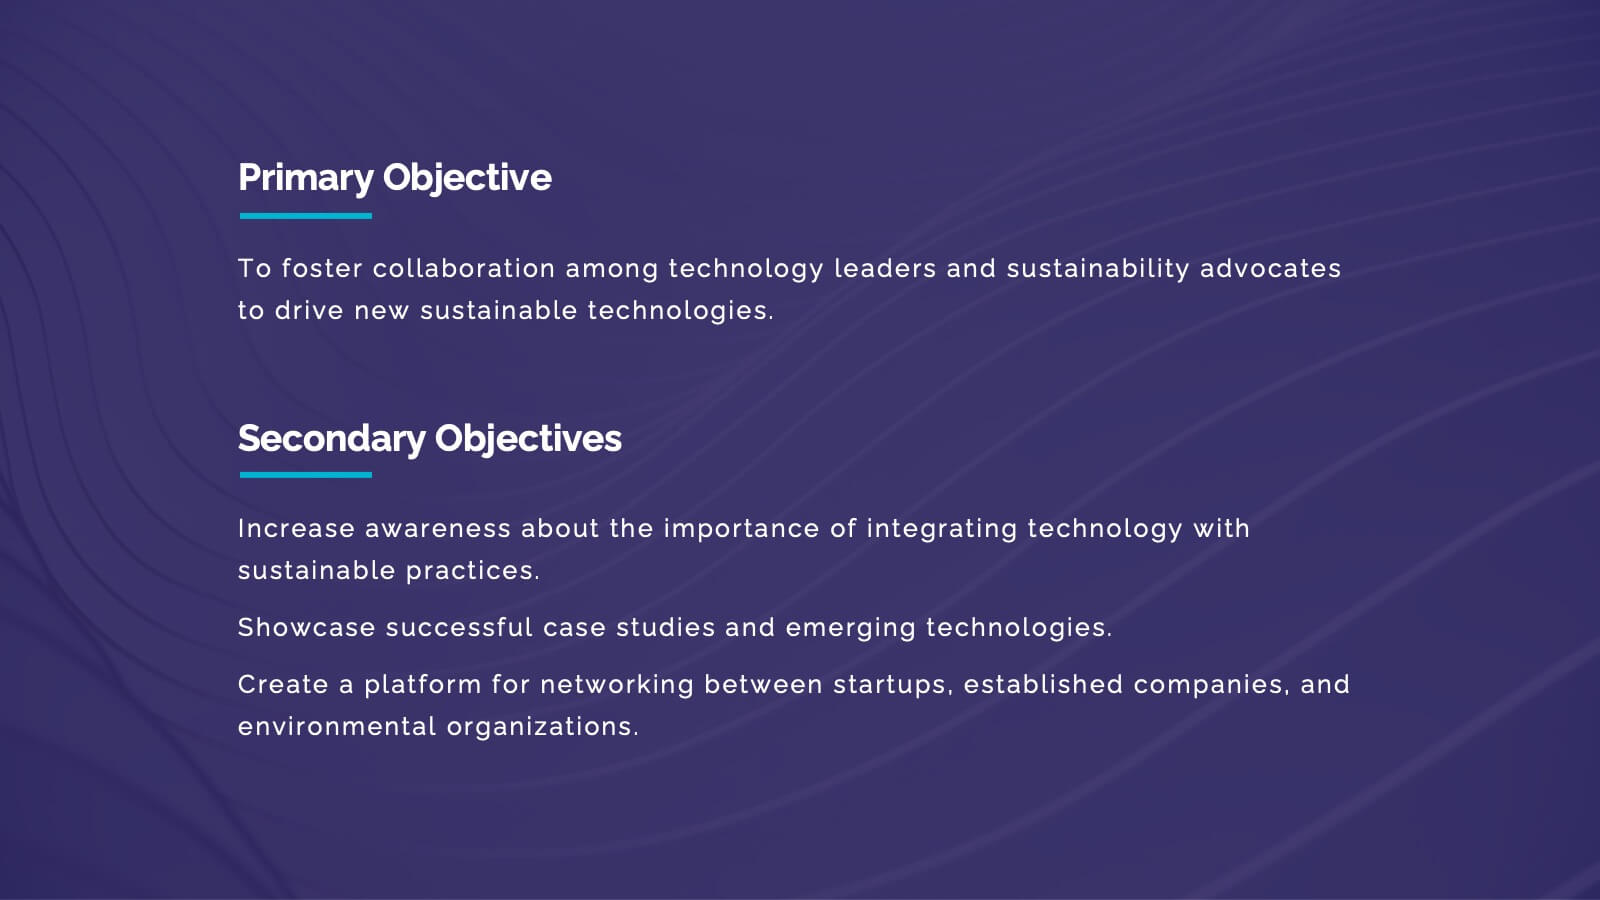
Boost your business presentations with this vibrant, professional template designed for business development proposals. Perfect for detailing conference overviews, themes, objectives, and keynotes, it features a clean and engaging layout. Highlight critical sessions and networking opportunities to captivate your audience. Compatible with PowerPoint, Keynote, and Google Slides, it ensures seamless presentations on any platform.


4 slides
Points-Based Membership Program Strategy Presentation
Communicate your rewards system with clarity using the Points-Based Membership Program Strategy presentation. This visual template is ideal for outlining tiered rewards, point accumulation methods, and redemption mechanics through a clean, card-themed layout. Perfect for loyalty teams, marketing strategists, and membership programs. Fully editable in PowerPoint, Keynote, and Google Slides.


5 slides
Business Goals Roadmap Presentation
Bring your long-term vision to life with a clear, structured roadmap that highlights each milestone in your business journey. This presentation helps you outline key objectives, track progress, and communicate strategic priorities with ease. Ideal for planning, strategy, and growth discussions. Fully compatible with PowerPoint, Keynote, and Google Slides.


7 slides
Investment Management Infographic
Investment management, also known as asset management or fund management, involves the professional management of various securities and assets with the goal of achieving specific investment objectives for individuals, institutions, or entities. This infographic will encourage your audience to start or enhance their investment journey for financial prosperity. Customize the content, design, and visuals to craft an engaging and informative infographic that educates about investment management. This infographic should serve as a useful guide for both beginners and those looking to refine their investment strategies.


6 slides
Academy Sports Infographic
Sports are physical activities or games that involve individual or team competition and are typically governed by specific rules. This infographic template highlights key aspects of sports and physical activities in an academy setting. Whether it's a school sports program, a community sports academy, or a professional training institute, this infographic provides a comprehensive overview of the benefits, programs, and facilities offered by an academy sports institution. This template is compatible with Powerpoint, Keynote, and Google Slides making it easy to navigate and can be easily customized to fit your presentation needs.


10 slides
Results-Oriented Strategy Solutions Presentation
Drive your message home with the Results-Oriented Strategy Solutions Presentation. This layout features a presenter and chart graphic to emphasize goal tracking, performance analysis, and strategic actions. Perfect for business updates, KPIs, or coaching sessions. Fully customizable for PowerPoint, Keynote, and Google Slides.


20 slides
Blaze UX UI Design Pitch Deck Presentation
Craft a visually stunning pitch that brings your UX/UI design process to life with this sleek and modern presentation template. From concept development to final prototypes, each slide is designed to showcase research, wireframes, typography, and more with a seamless, professional aesthetic. Fully compatible with PowerPoint, Keynote, and Google Slides.


6 slides
Prevention and Support Breast Cancer Strategy Presentation
Deliver powerful insights with the Prevention and Support Breast Cancer Strategy Presentation. Designed for impact, this layout uses gender icons, ribbons, and clear percentage visuals to present awareness, research data, and healthcare strategies. Ideal for advocacy groups, nonprofit campaigns, or medical briefings. Fully editable in PowerPoint, Keynote, Google Slides, and Canva.


8 slides
Business KPI Dashboard Presentation
Track performance at a glance with the Business KPI Dashboard Presentation. This clean, professional layout includes a speedometer-style gauge and monthly bar chart to showcase progress, goals, or metrics clearly. Ideal for reporting, analysis, or executive summaries. Fully editable and compatible with PowerPoint, Keynote, and Google Slides.


21 slides
Runewood Marketing Proposal Template Presentation
The Marketing Proposal Presentation Template provides 21 slides covering core aspects like market presence, growth strategies, and financial highlights. Perfect for agencies and businesses to showcase their marketing strategies effectively. Fully customizable and compatible with PowerPoint, Keynote, and Google Slides.


7 slides
Stock Market Futures Infographic
The stock market, also known as the equity market or share market, is a platform where buying, selling, and issuing shares of publicly-held companies take place. This infographic template serves as your compass through the intricate landscape of stocks and futures, empowering you with the knowledge to steer your investments towards a prosperous horizon. Compatible with Powerpoint, Keynote, and Google Slides. The striking visualizations present the clash between the bullish and bearish market forces, symbolizing the constant struggle that drives market movements. Easily showcase the latest stock prices with this template.


10 slides
Conceptual Mind Map for Projects
Illuminate your strategy with the Conceptual Mind Map for Projects Presentation. Designed in the shape of a lightbulb, this diagram visually connects five key project concepts to a central idea, perfect for presenting innovation, team workflows, or business planning. Easily editable in PowerPoint, Keynote, or Google Slides to suit any industry or audience.


5 slides
Cryptocurrency Market Trends Presentation
Navigate the dynamic world of digital finance with our "Cryptocurrency Market Trends" presentation templates. Perfect for analysts and enthusiasts alike, these templates provide a clear, visual representation of market movements and trends. They are fully compatible with PowerPoint, Keynote, and Google Slides, making them an excellent resource for anyone keen on the pulse of cryptocurrency markets.


20 slides
Astral UX UI Design Pitch Deck Presentation
Present your UX/UI design with flair! This template covers everything from design briefs and process steps to mood boards and final presentations. Perfect for showcasing design elements, wireframes, and project timelines. Ideal for impressing stakeholders and clients. Compatible with PowerPoint, Keynote, and Google Slides. Make your design pitch unforgettable!