


Features
- 5 Unique slides
- Fully editable and easy to edit in Microsoft Powerpoint, Keynote and Google Slides
- 16:9 widescreen layout
- Clean and professional designs
- Export to JPG, PDF or send by email


Do you have any questions?
Recommend


5 slides
Multi-Step Procedure and Execution Flow Presentation
Visualize complex processes with clarity using the Multi-Step Procedure and Execution Flow Presentation. Ideal for SOPs, task breakdowns, or team workflows, this layout helps you present sequential actions, decision points, and outcomes with a clean, structured flow. Fully editable in PowerPoint, Canva, and Google Slides.


21 slides
Harmony Project Management Plan Presentation
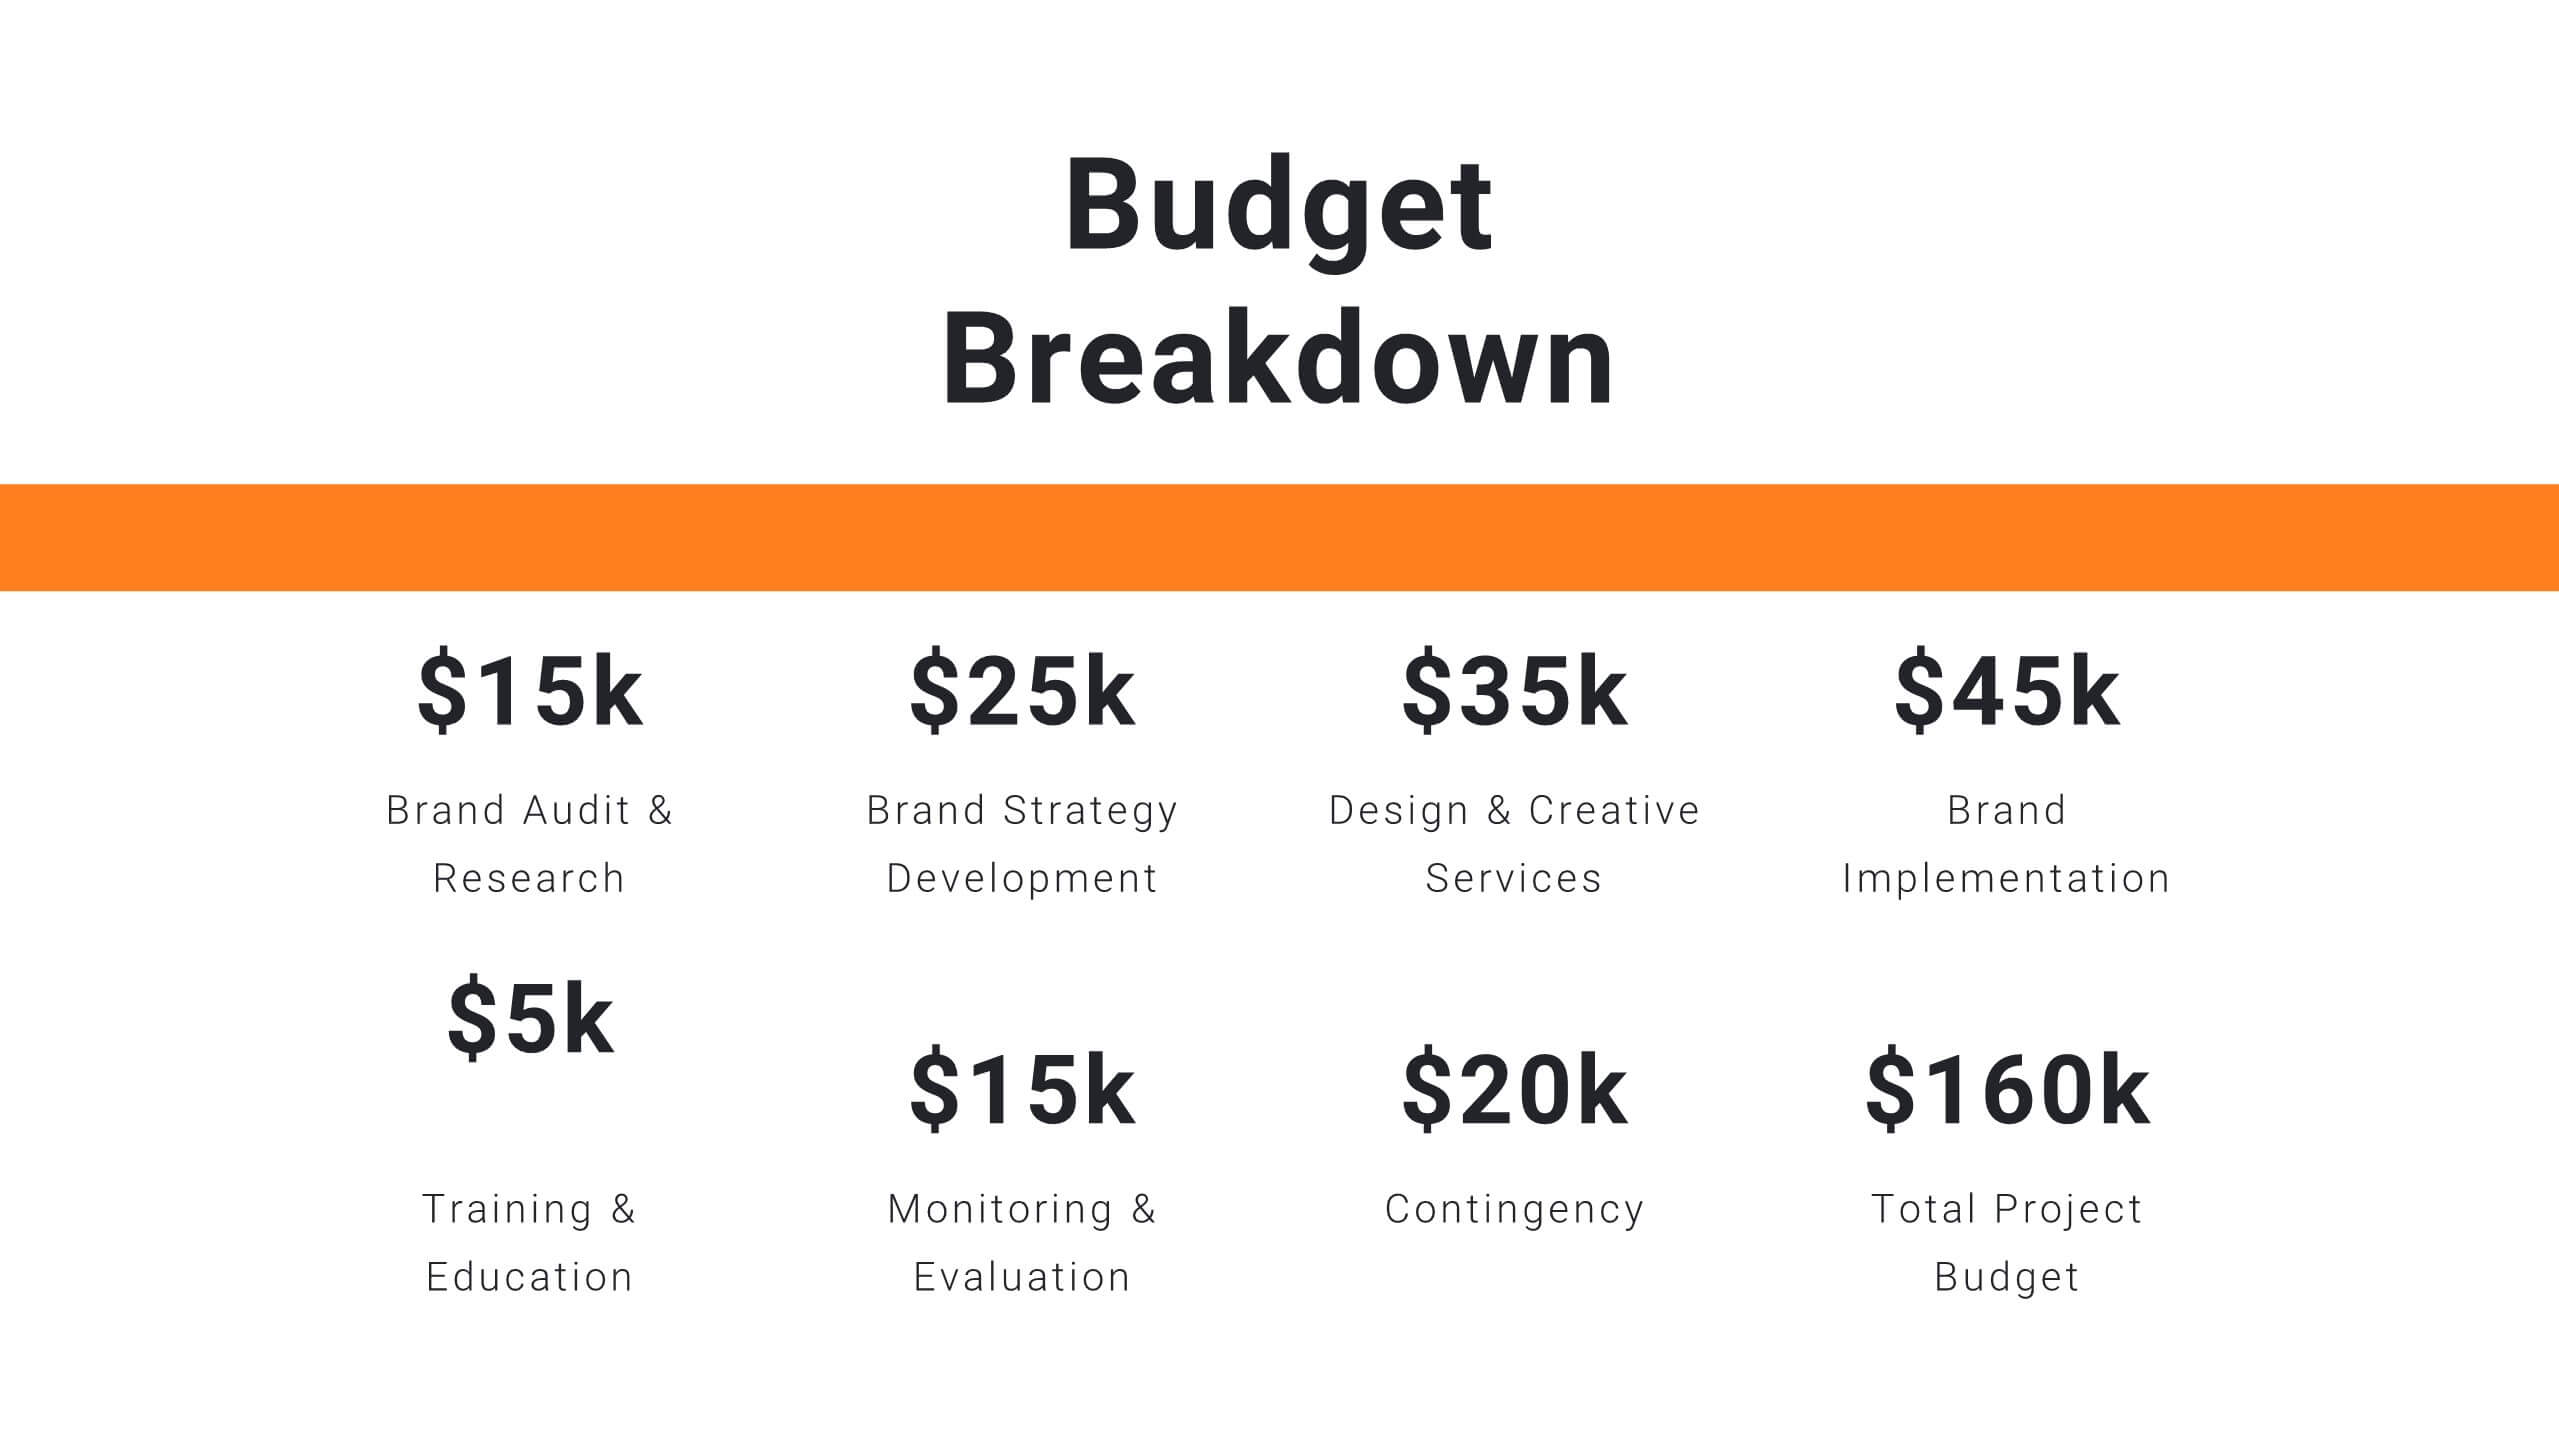
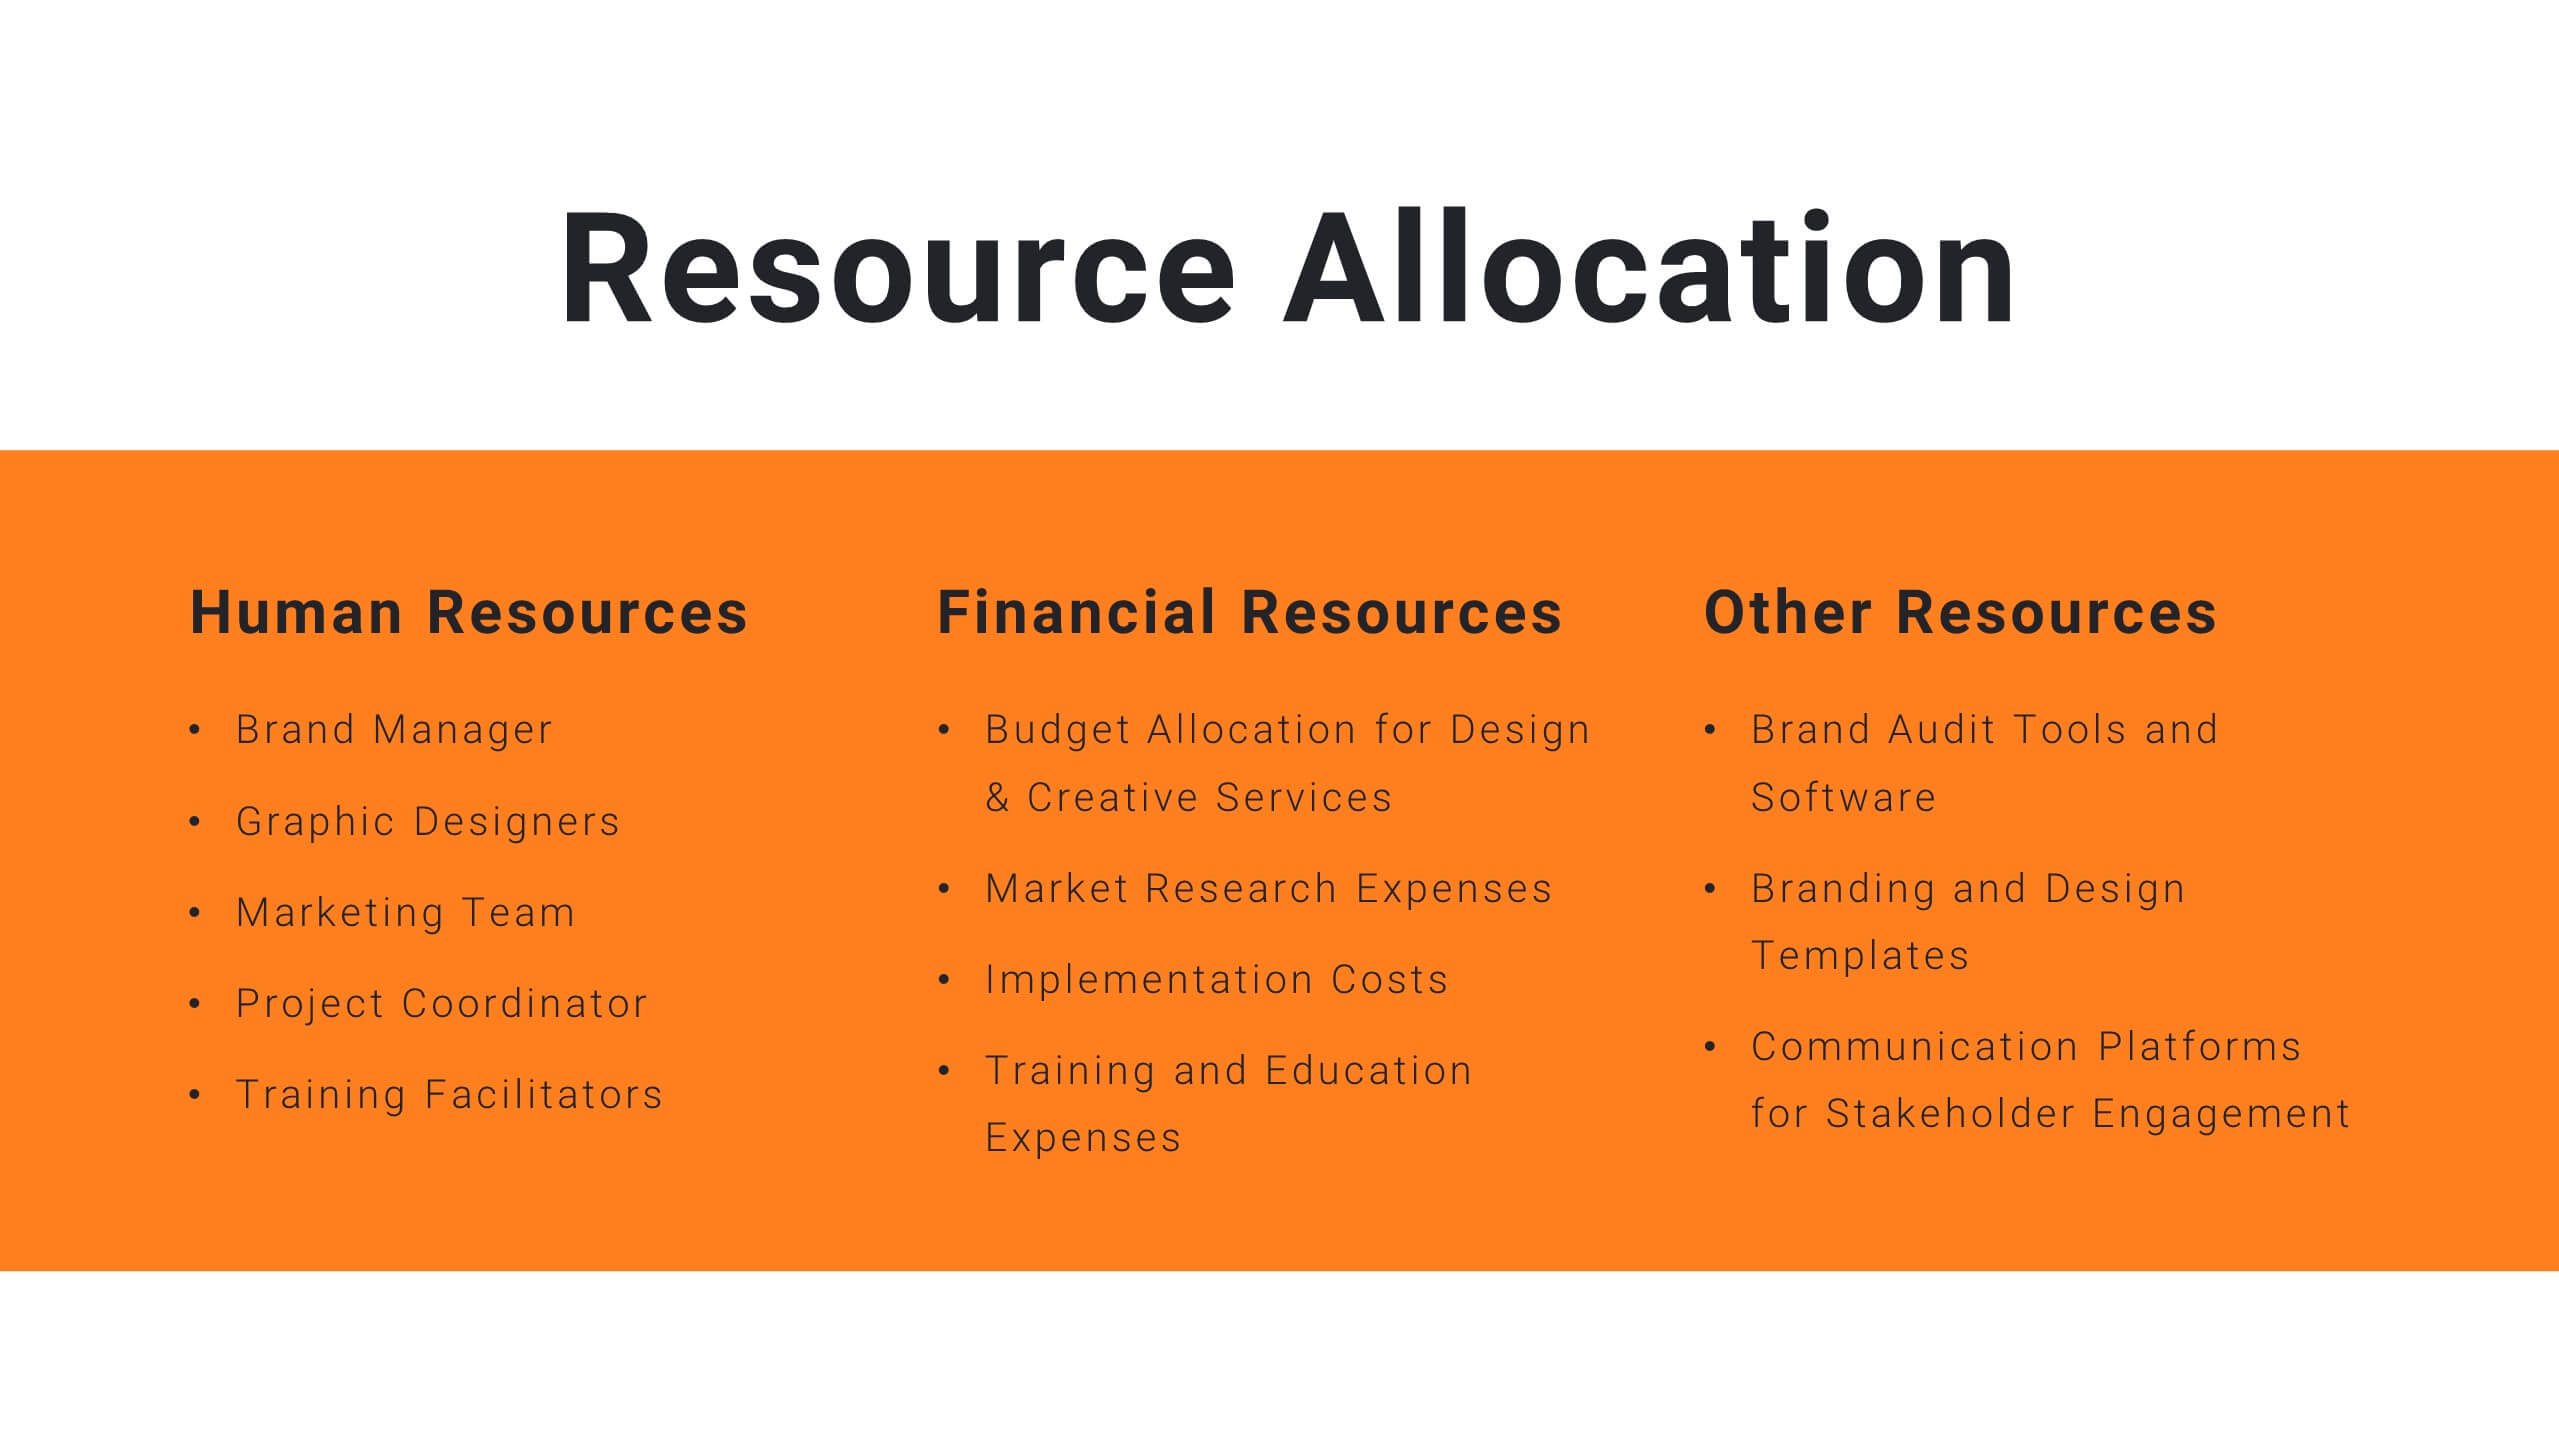
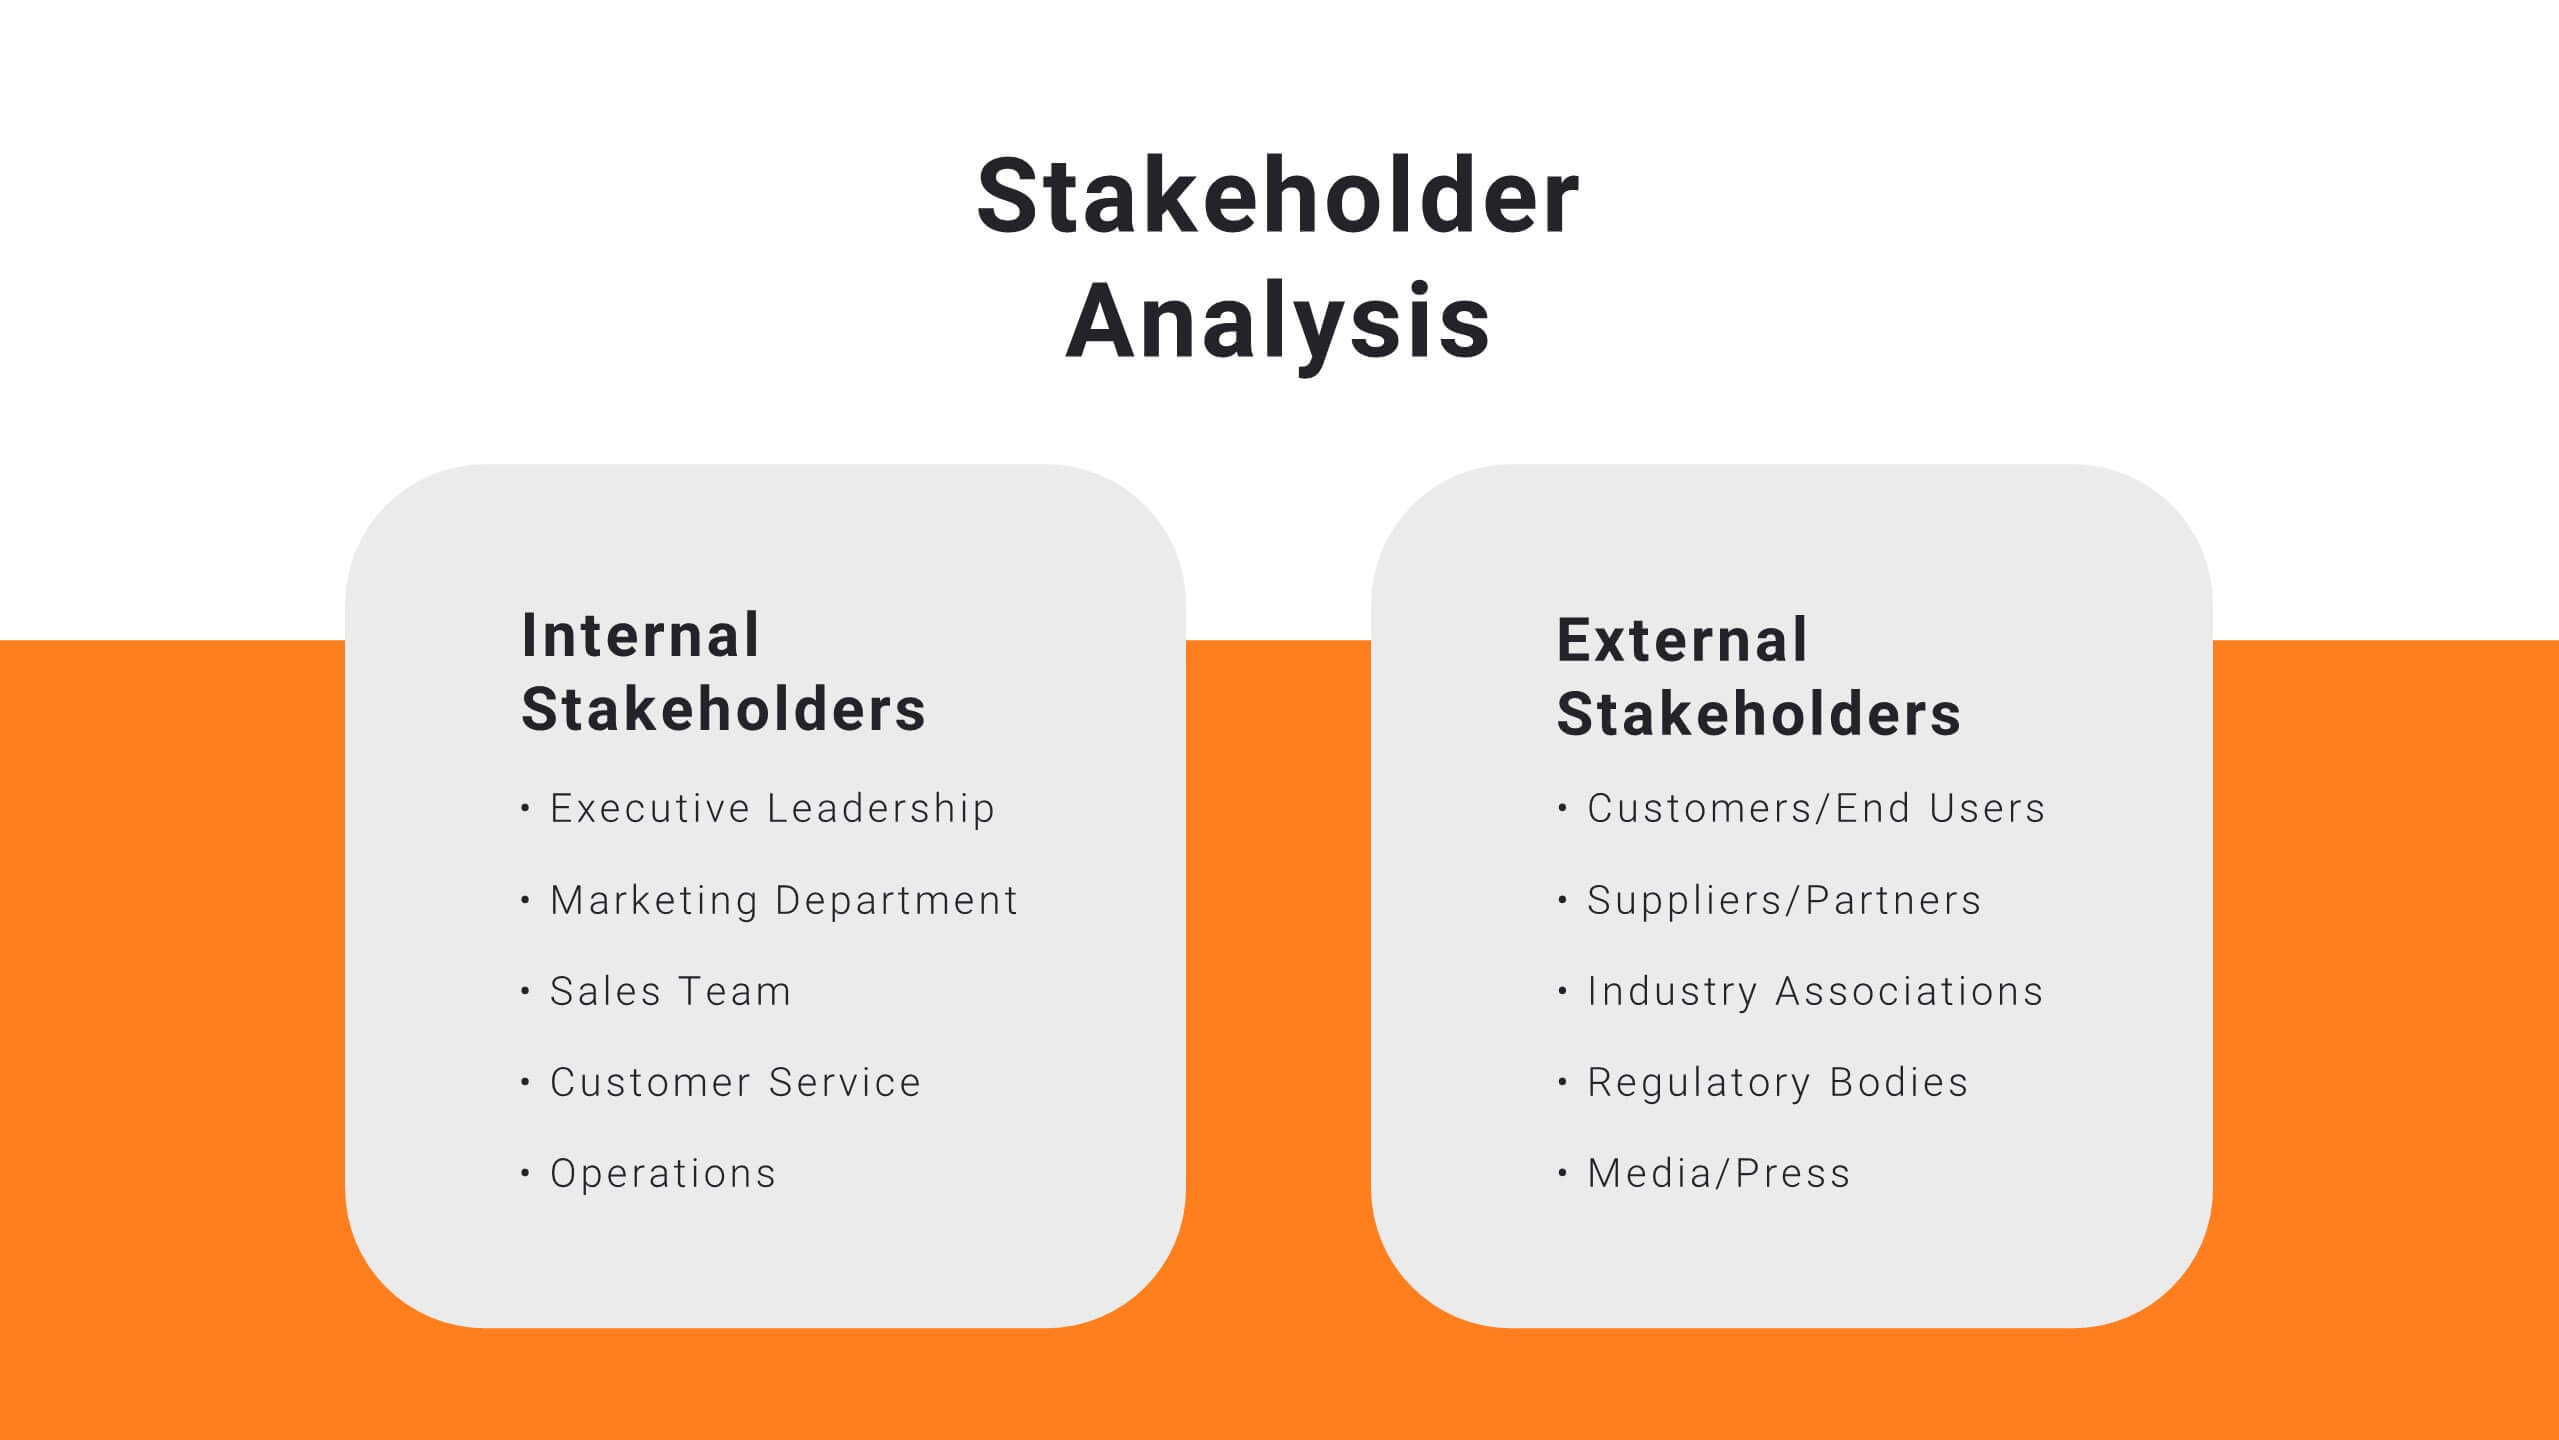
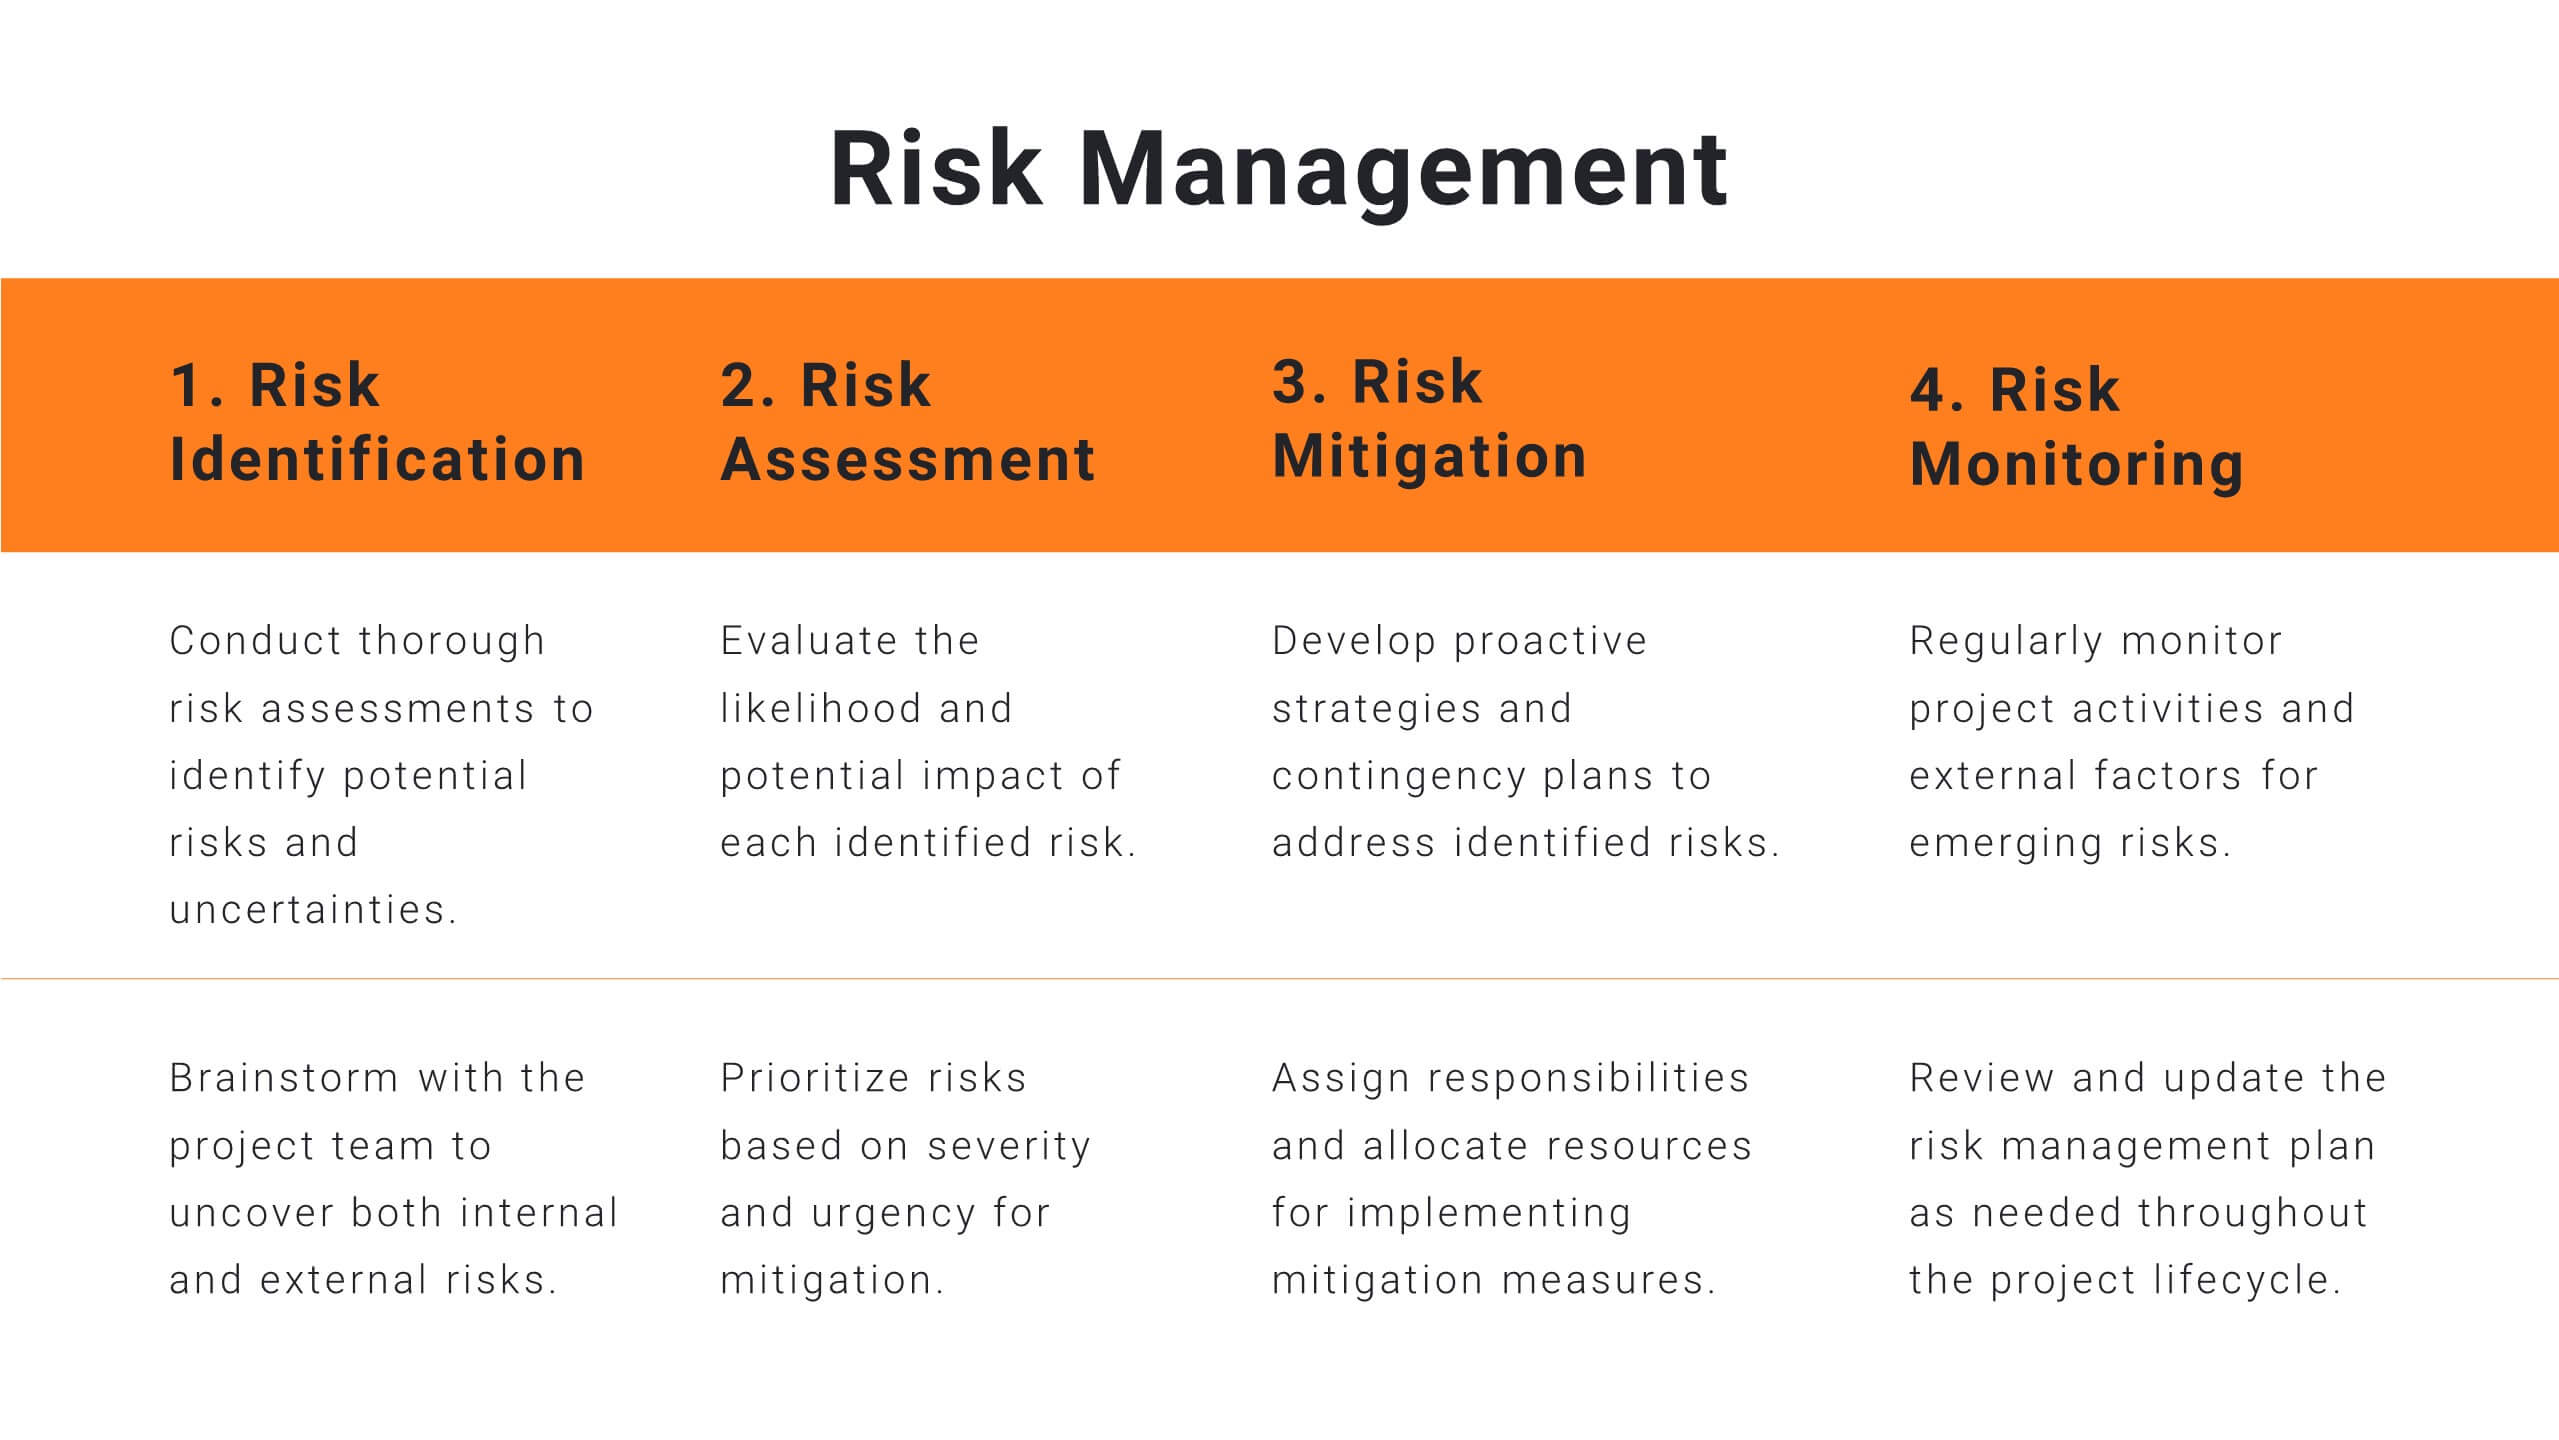
Plan your project efficiently with this comprehensive project management plan template! It covers all essential aspects including timeline, budget, resource allocation, and risk management. Ensure smooth project execution and achieve your objectives. Compatible with PowerPoint, Keynote, and Google Slides, it's designed to streamline your project planning and management process.


7 slides
Financial Health and Budget Planning Presentation
Present your budgeting journey with clarity using the Financial Health and Budget Planning Presentation. This slide features a horizontal flow diagram with six editable steps—perfect for outlining savings strategies, expense tracking, or financial goals. Each icon-based block helps highlight key actions. Fully customizable in PowerPoint, Canva, and Google Slides.


4 slides
Business Travel Logistic Plan Presentation
Make your business journey feel as smooth as your next flight! This infographic presentation template helps visualize logistics, travel routes, and resource allocation for corporate trips. Great for mapping key points and planning operations clearly. Fully editable and compatible with PowerPoint, Keynote, and Google Slides for easy customization and sharing.


5 slides
Business Threat Risk Assessment Strategy Presentation
Visualize your risk factors clearly with the Business Threat Risk Assessment Strategy Presentation. This X-shaped quadrant layout helps you outline and evaluate four key risk areas at a glance—ideal for threat mapping, vulnerability assessment, or contingency planning. Fully editable in Canva, PowerPoint, Keynote, and Google Slides.


7 slides
App Mockup Infographic
Elevate your app demonstrations with this vibrant collection of app mockup templates, specifically designed to showcase the functionality and design of mobile applications across various devices. Each template emphasizes the user experience, presenting your app in a clear and engaging manner that highlights its most compelling features. The templates are crafted with a clean, modern aesthetic, incorporating bright colors and clear typography to draw attention to key functionalities and user interfaces. Perfect for developers and designers looking to present their apps to clients, stakeholders, or potential users, these mockups provide a professional framework for displaying apps in context. Customizable to fit your specific needs, this collection allows you to seamlessly integrate your own app designs and screenshots, making it easier than ever to convey the look and feel of your app in a realistic setting. Whether for pitches, presentations, or promotional materials, these mockups are an invaluable tool for communicating the value and operation of your application.


5 slides
Comparison Table for Feature Mapping Presentation
Compare your product features with ease using this Comparison Table for Feature Mapping presentation. Ideal for highlighting similarities and differences across multiple offerings, this layout uses clean visuals and color-coded elements to show feature availability per product. Perfect for product teams, marketing, or internal decision-making. Compatible with PowerPoint, Canva, and Google Slides.


21 slides
Phoenix Design Portfolio Presentation
Elevate your design presentations with this stylish, contemporary template. Perfect for showcasing design portfolios, concept development, and project timelines, it features a modern layout with vibrant colors. Highlight key elements like color palettes, textures, and design processes to captivate your audience. Compatible with PowerPoint, Keynote, and Google Slides, it ensures seamless presentations on any platform.
23 slides
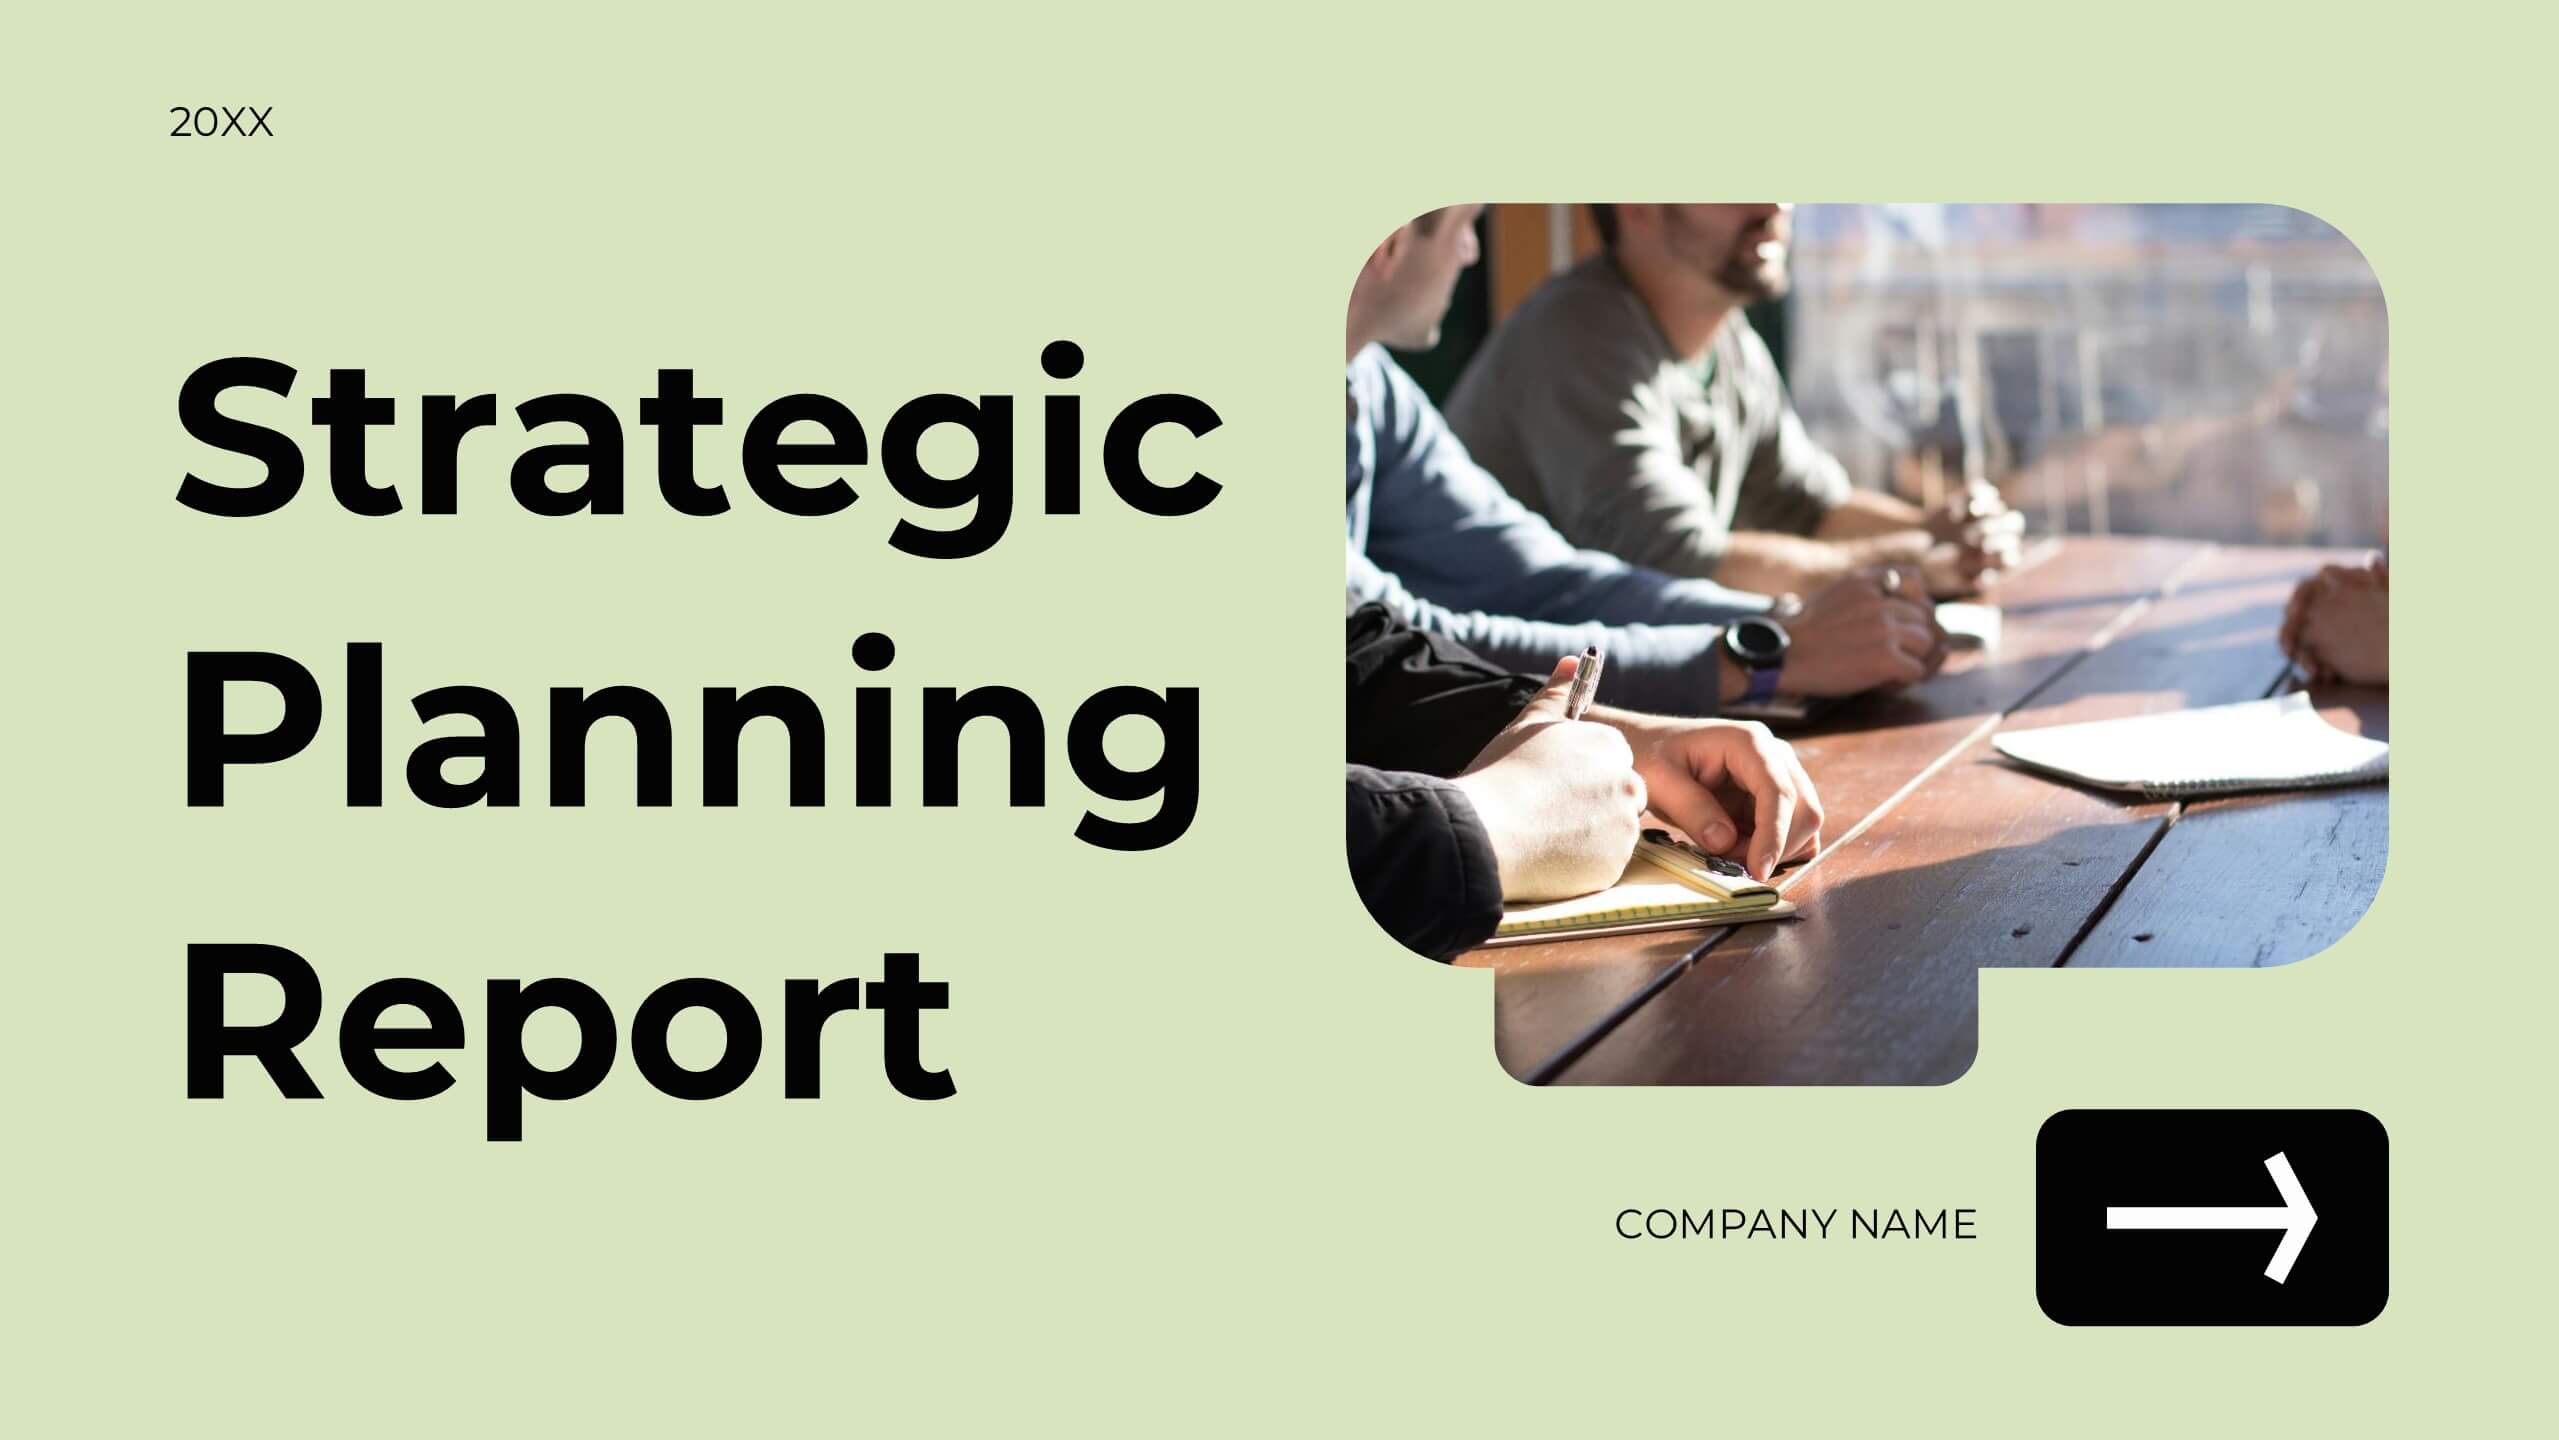
Zirconium Strategic Planning Report Presentation
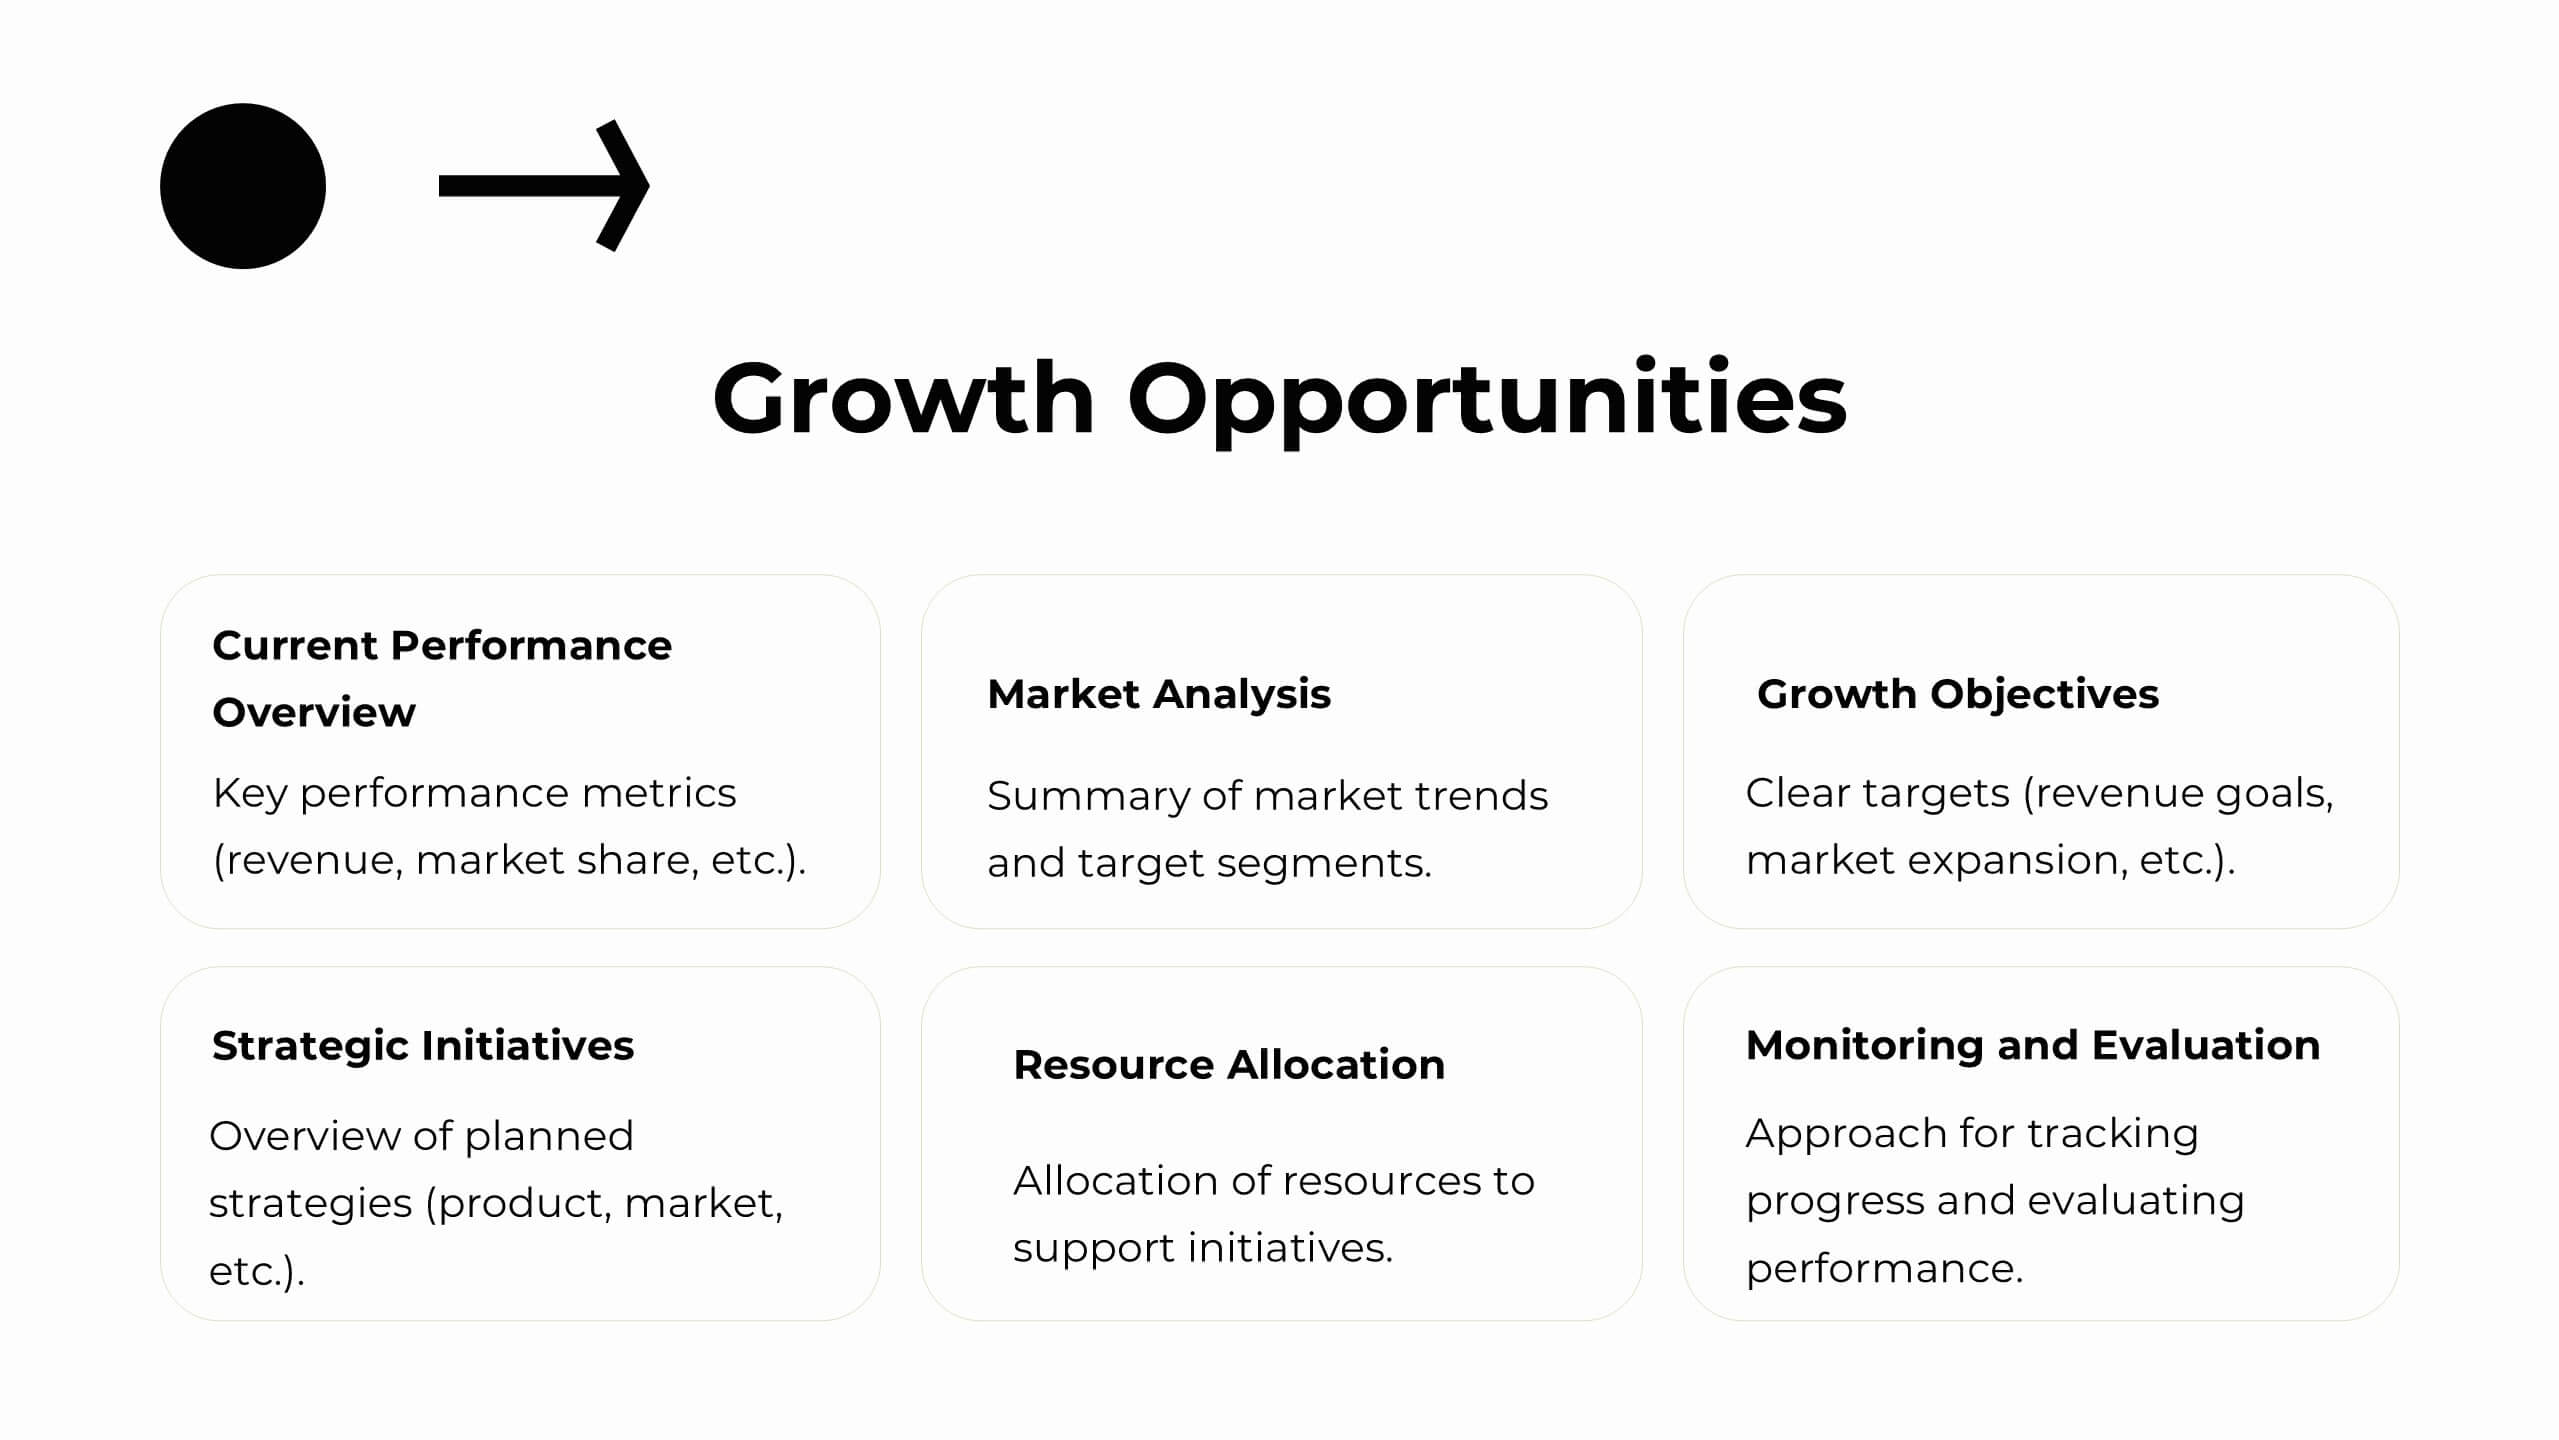
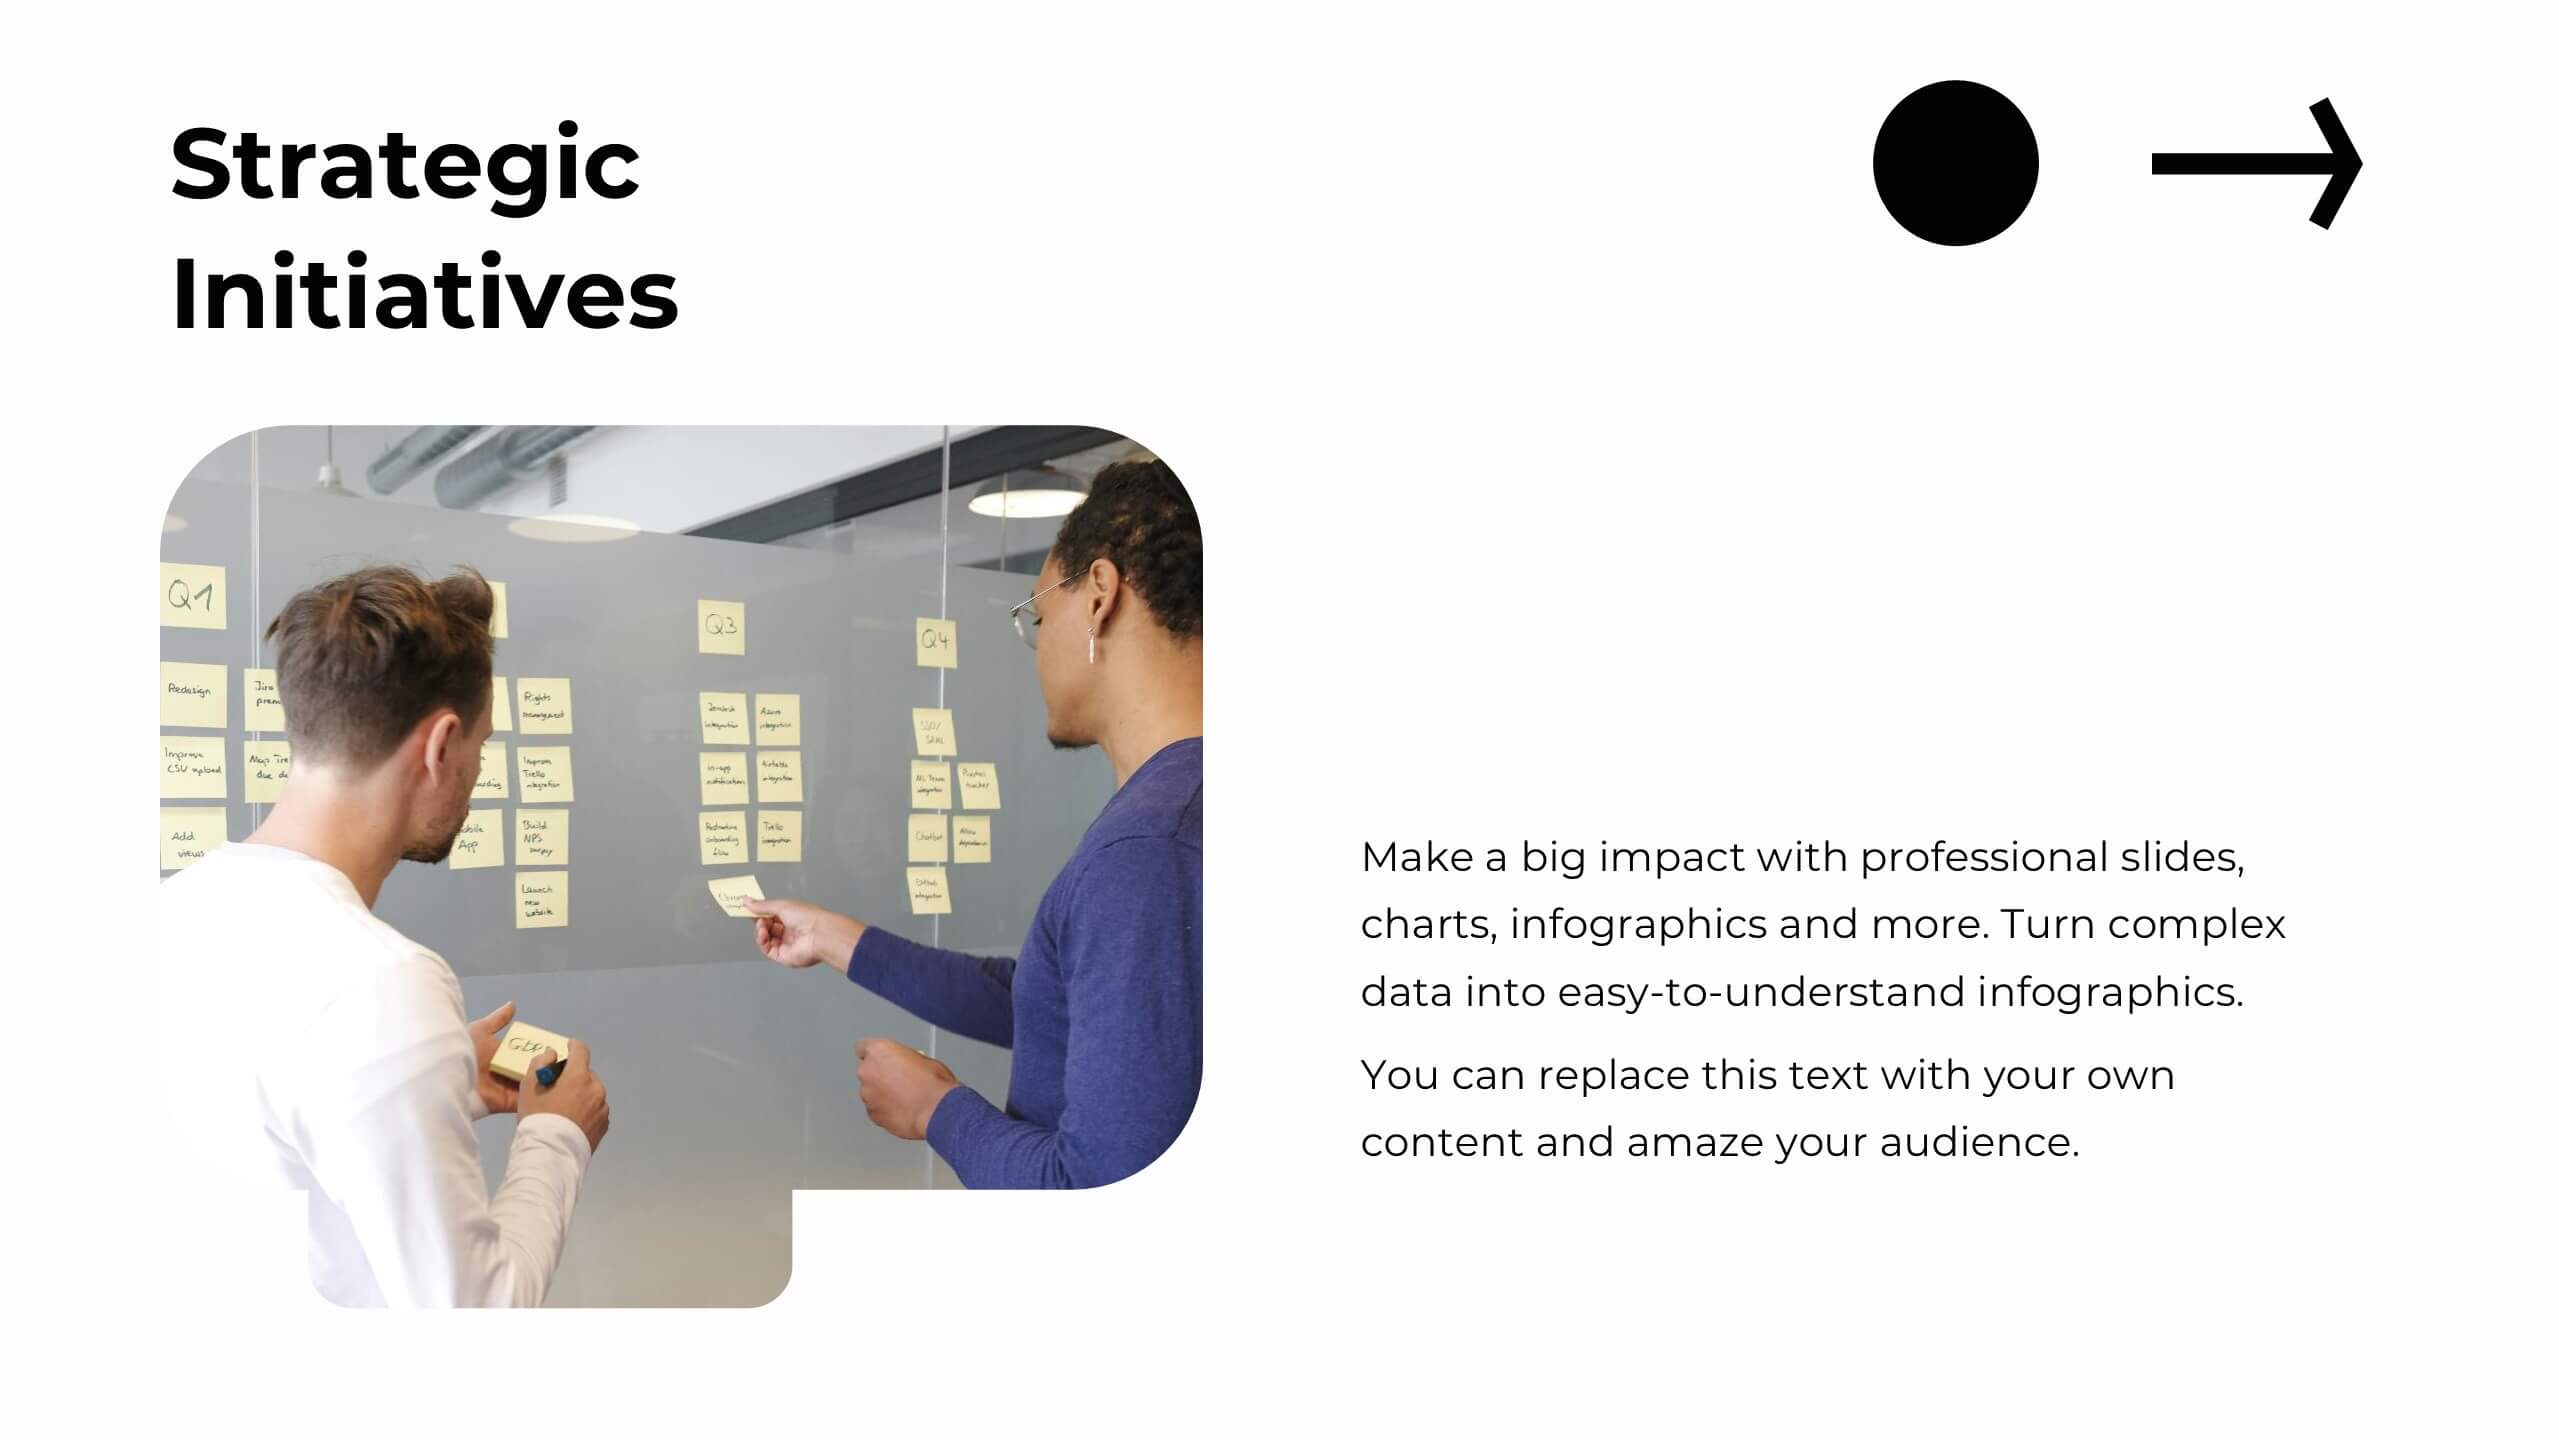
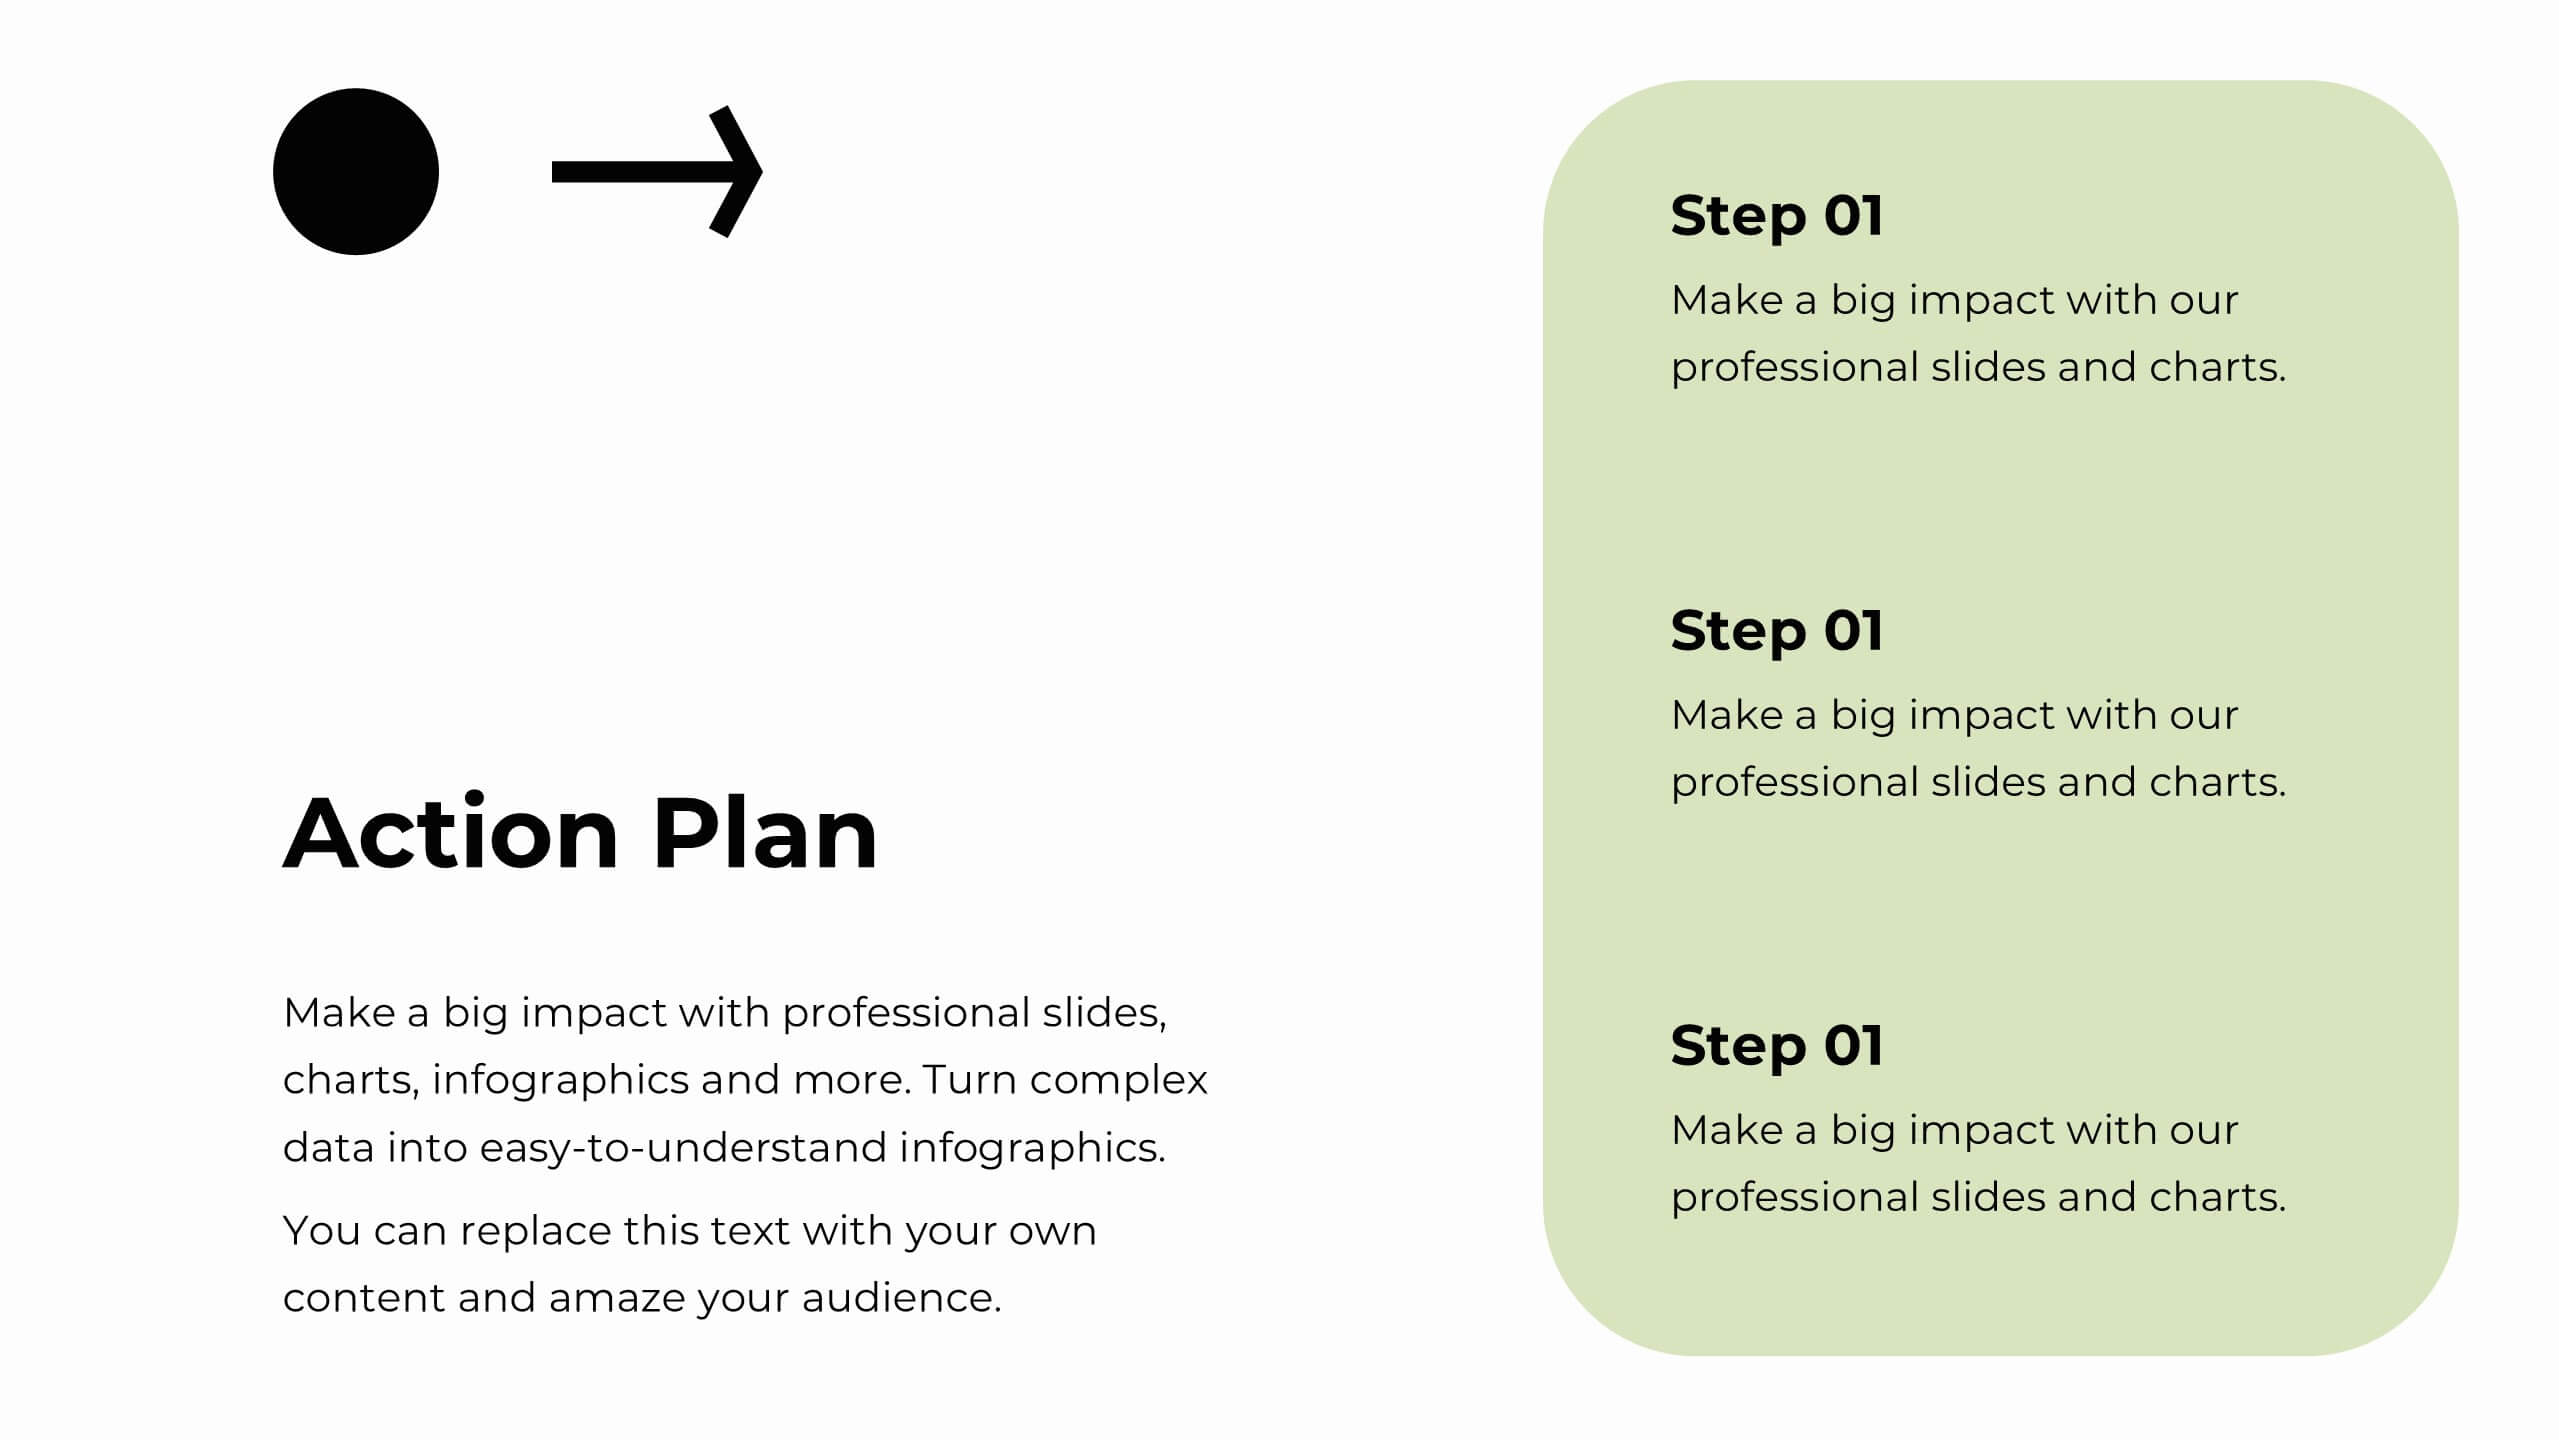
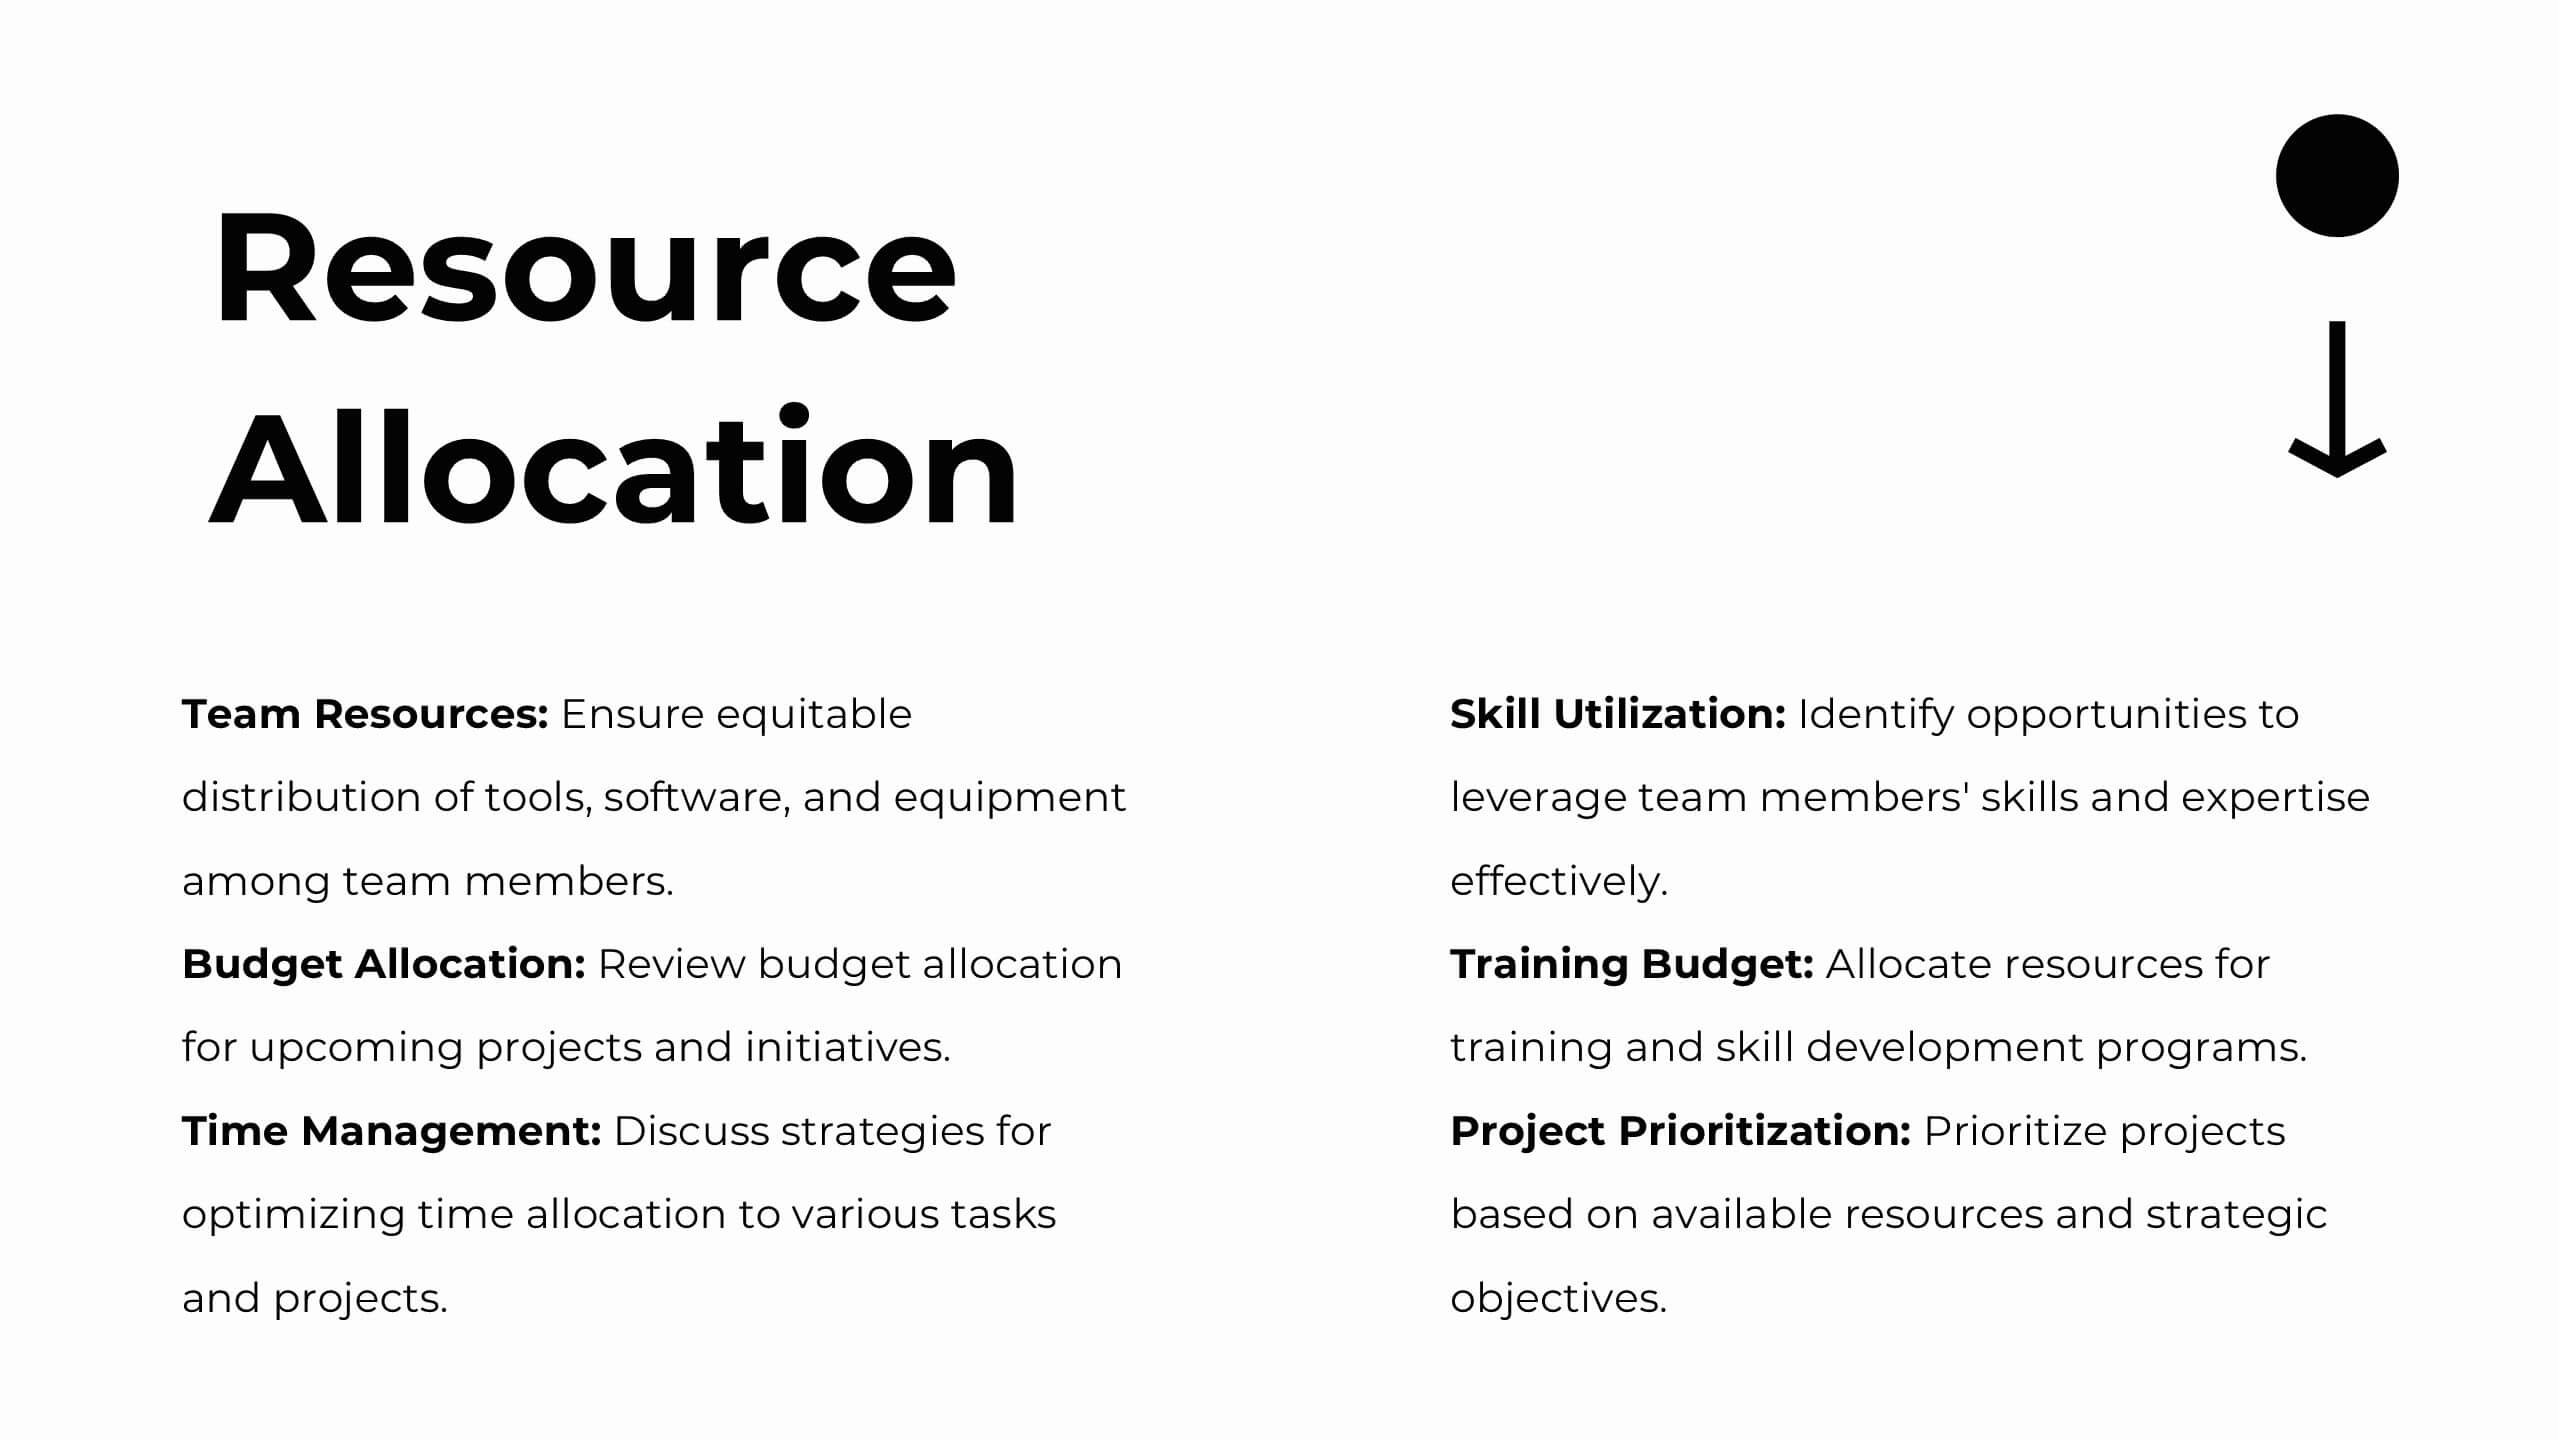
Plan and present your strategies with precision using this comprehensive strategic planning report template! Designed for clear communication of goals, market trends, SWOT analysis, and growth opportunities, it’s perfect for aligning team objectives and driving success. Fully customizable and compatible with PowerPoint, Keynote, and Google Slides, this template is ideal for strategic initiatives and performance reviews.


10 slides
Business Growth through Target Market Analysis Presentation
Showcase how strategic insights drive expansion with this step-by-step infographic. Designed with layered growth icons and space for titles and text, this layout helps illustrate the phases of market targeting, consumer profiling, and sales development. Perfect for marketing strategies, business development roadmaps, and client presentations. Fully customizable in PowerPoint, Keynote, and Google Slides


4 slides
Leadership Development and Growth Presentation
Explore the dynamics of effective leadership with our Leadership Development and Growth Presentation. This template illustrates the progressive stages of leadership maturity with unique, visually appealing graphics, making it ideal for workshops and seminars. Compatible with major presentation software to ensure accessibility and ease of use.


6 slides
Business Development Strategy Infographic
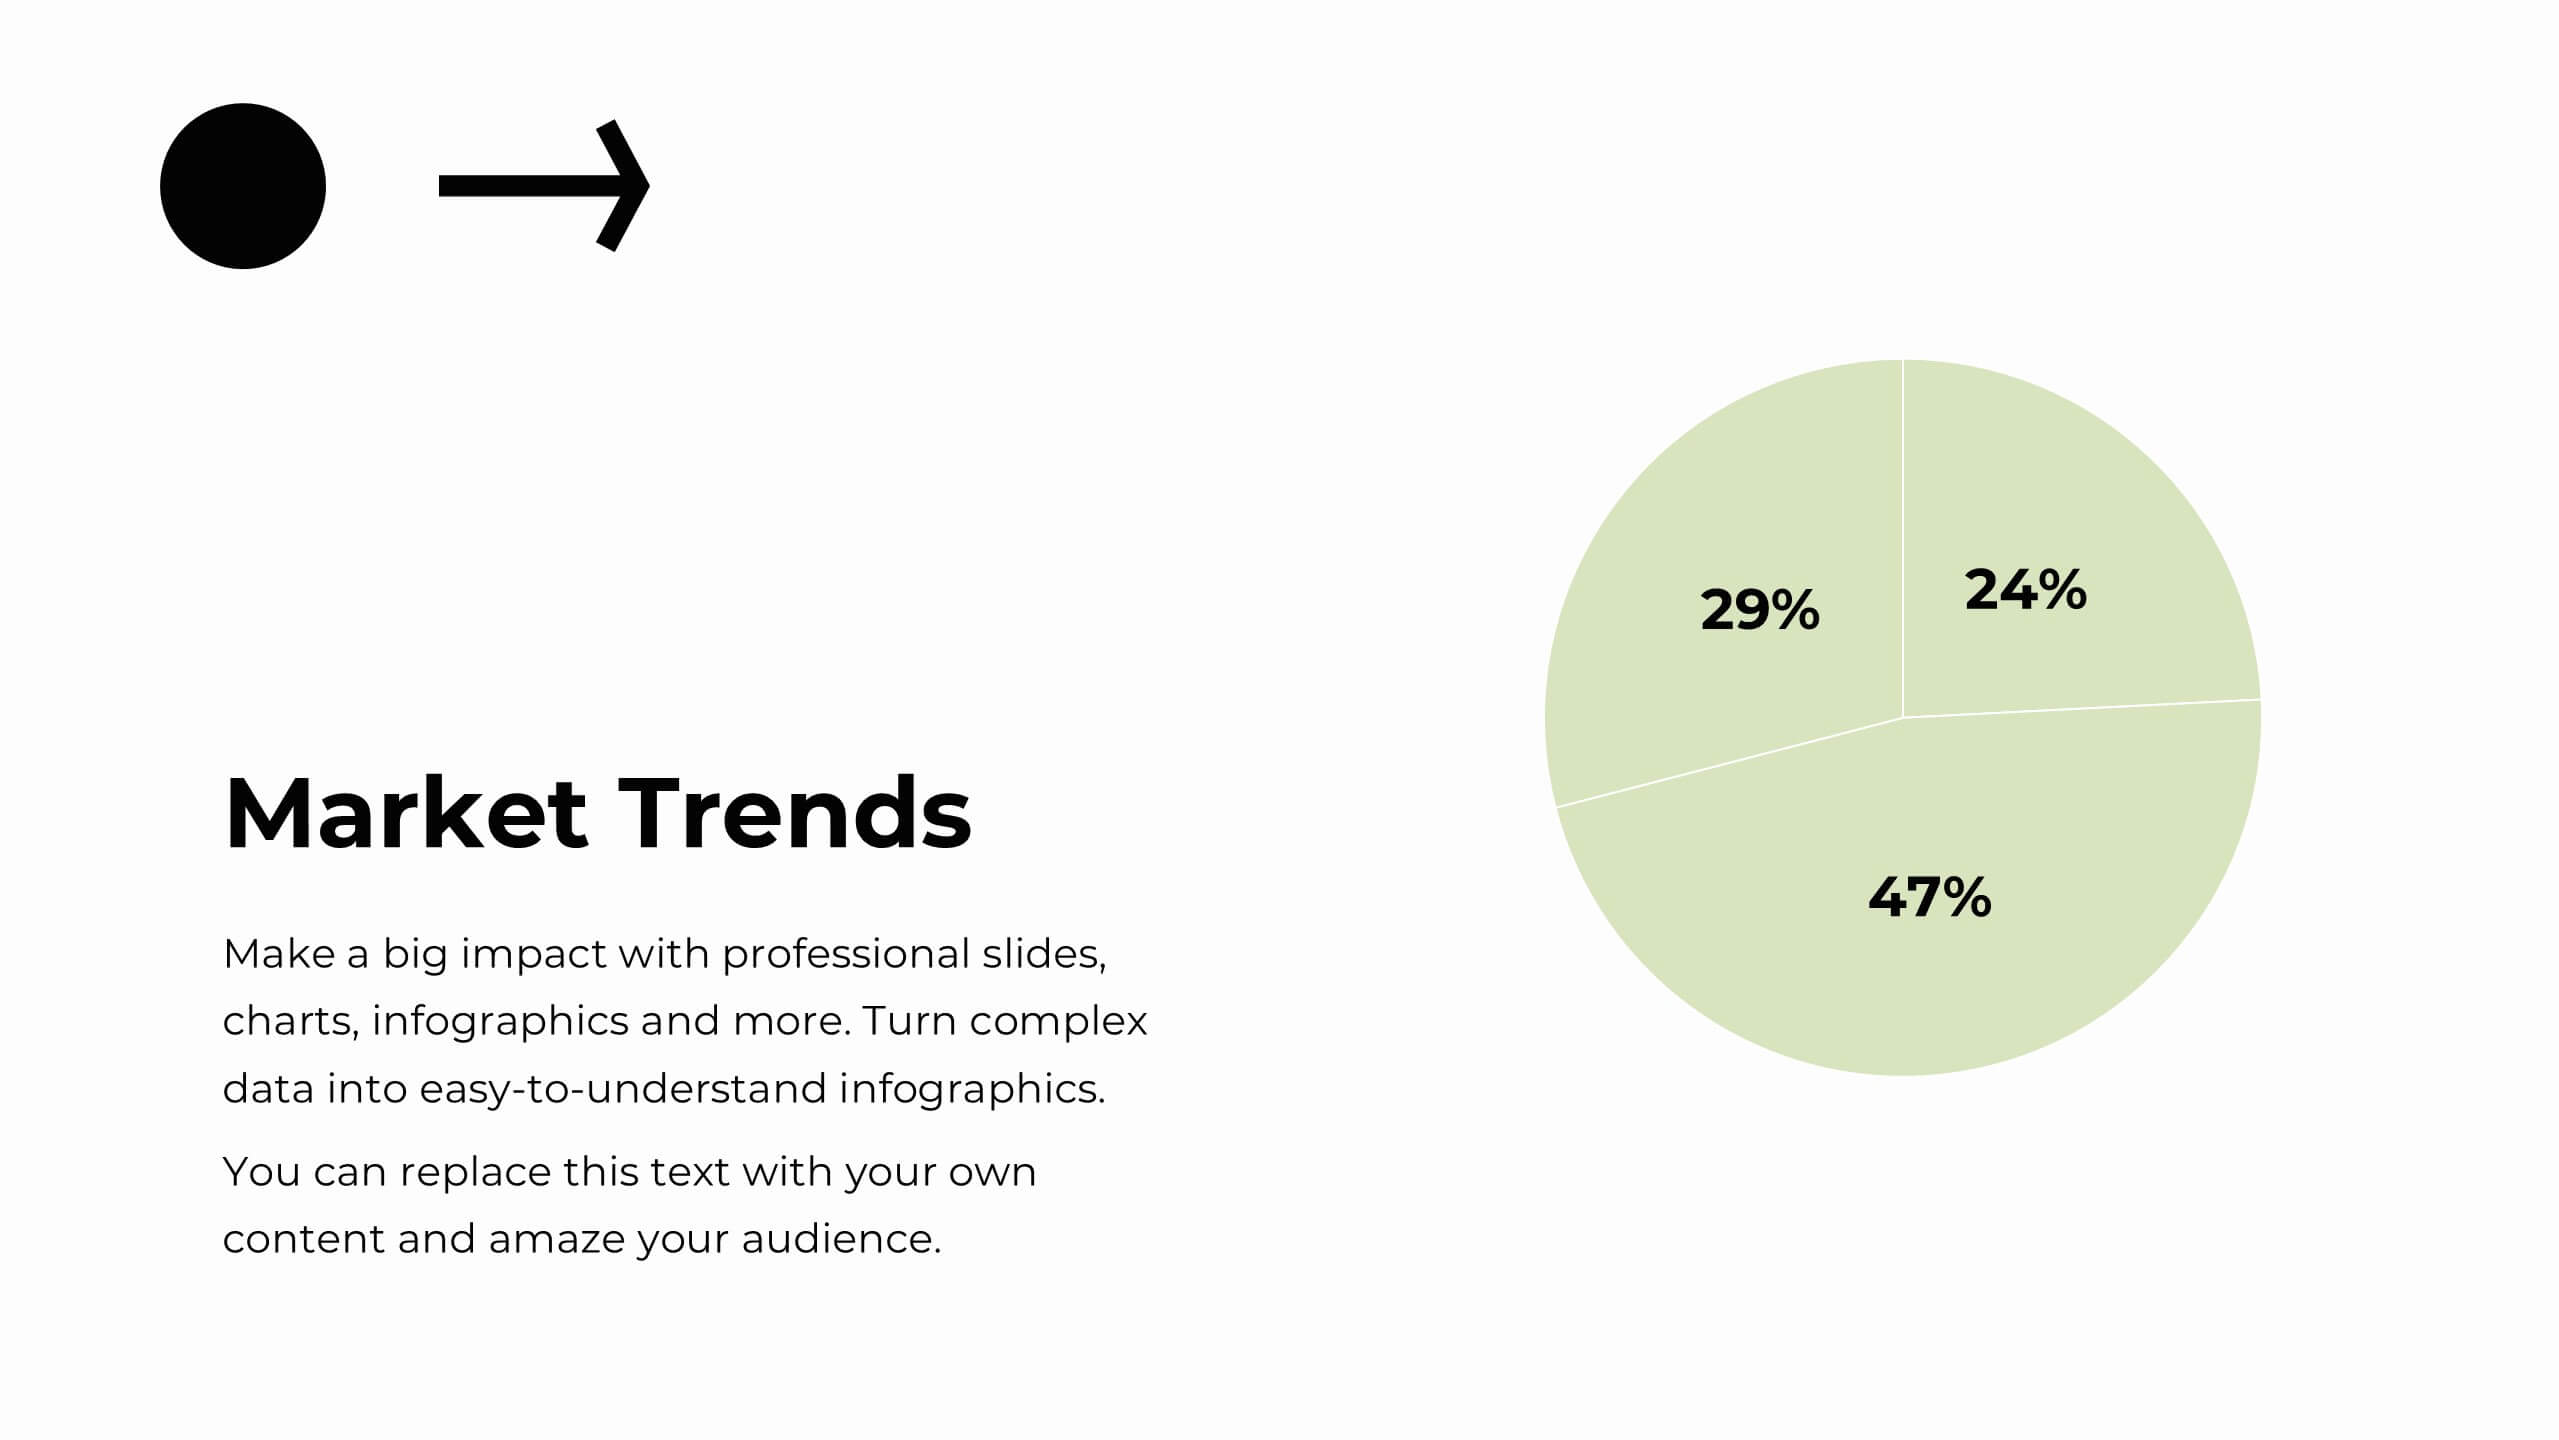
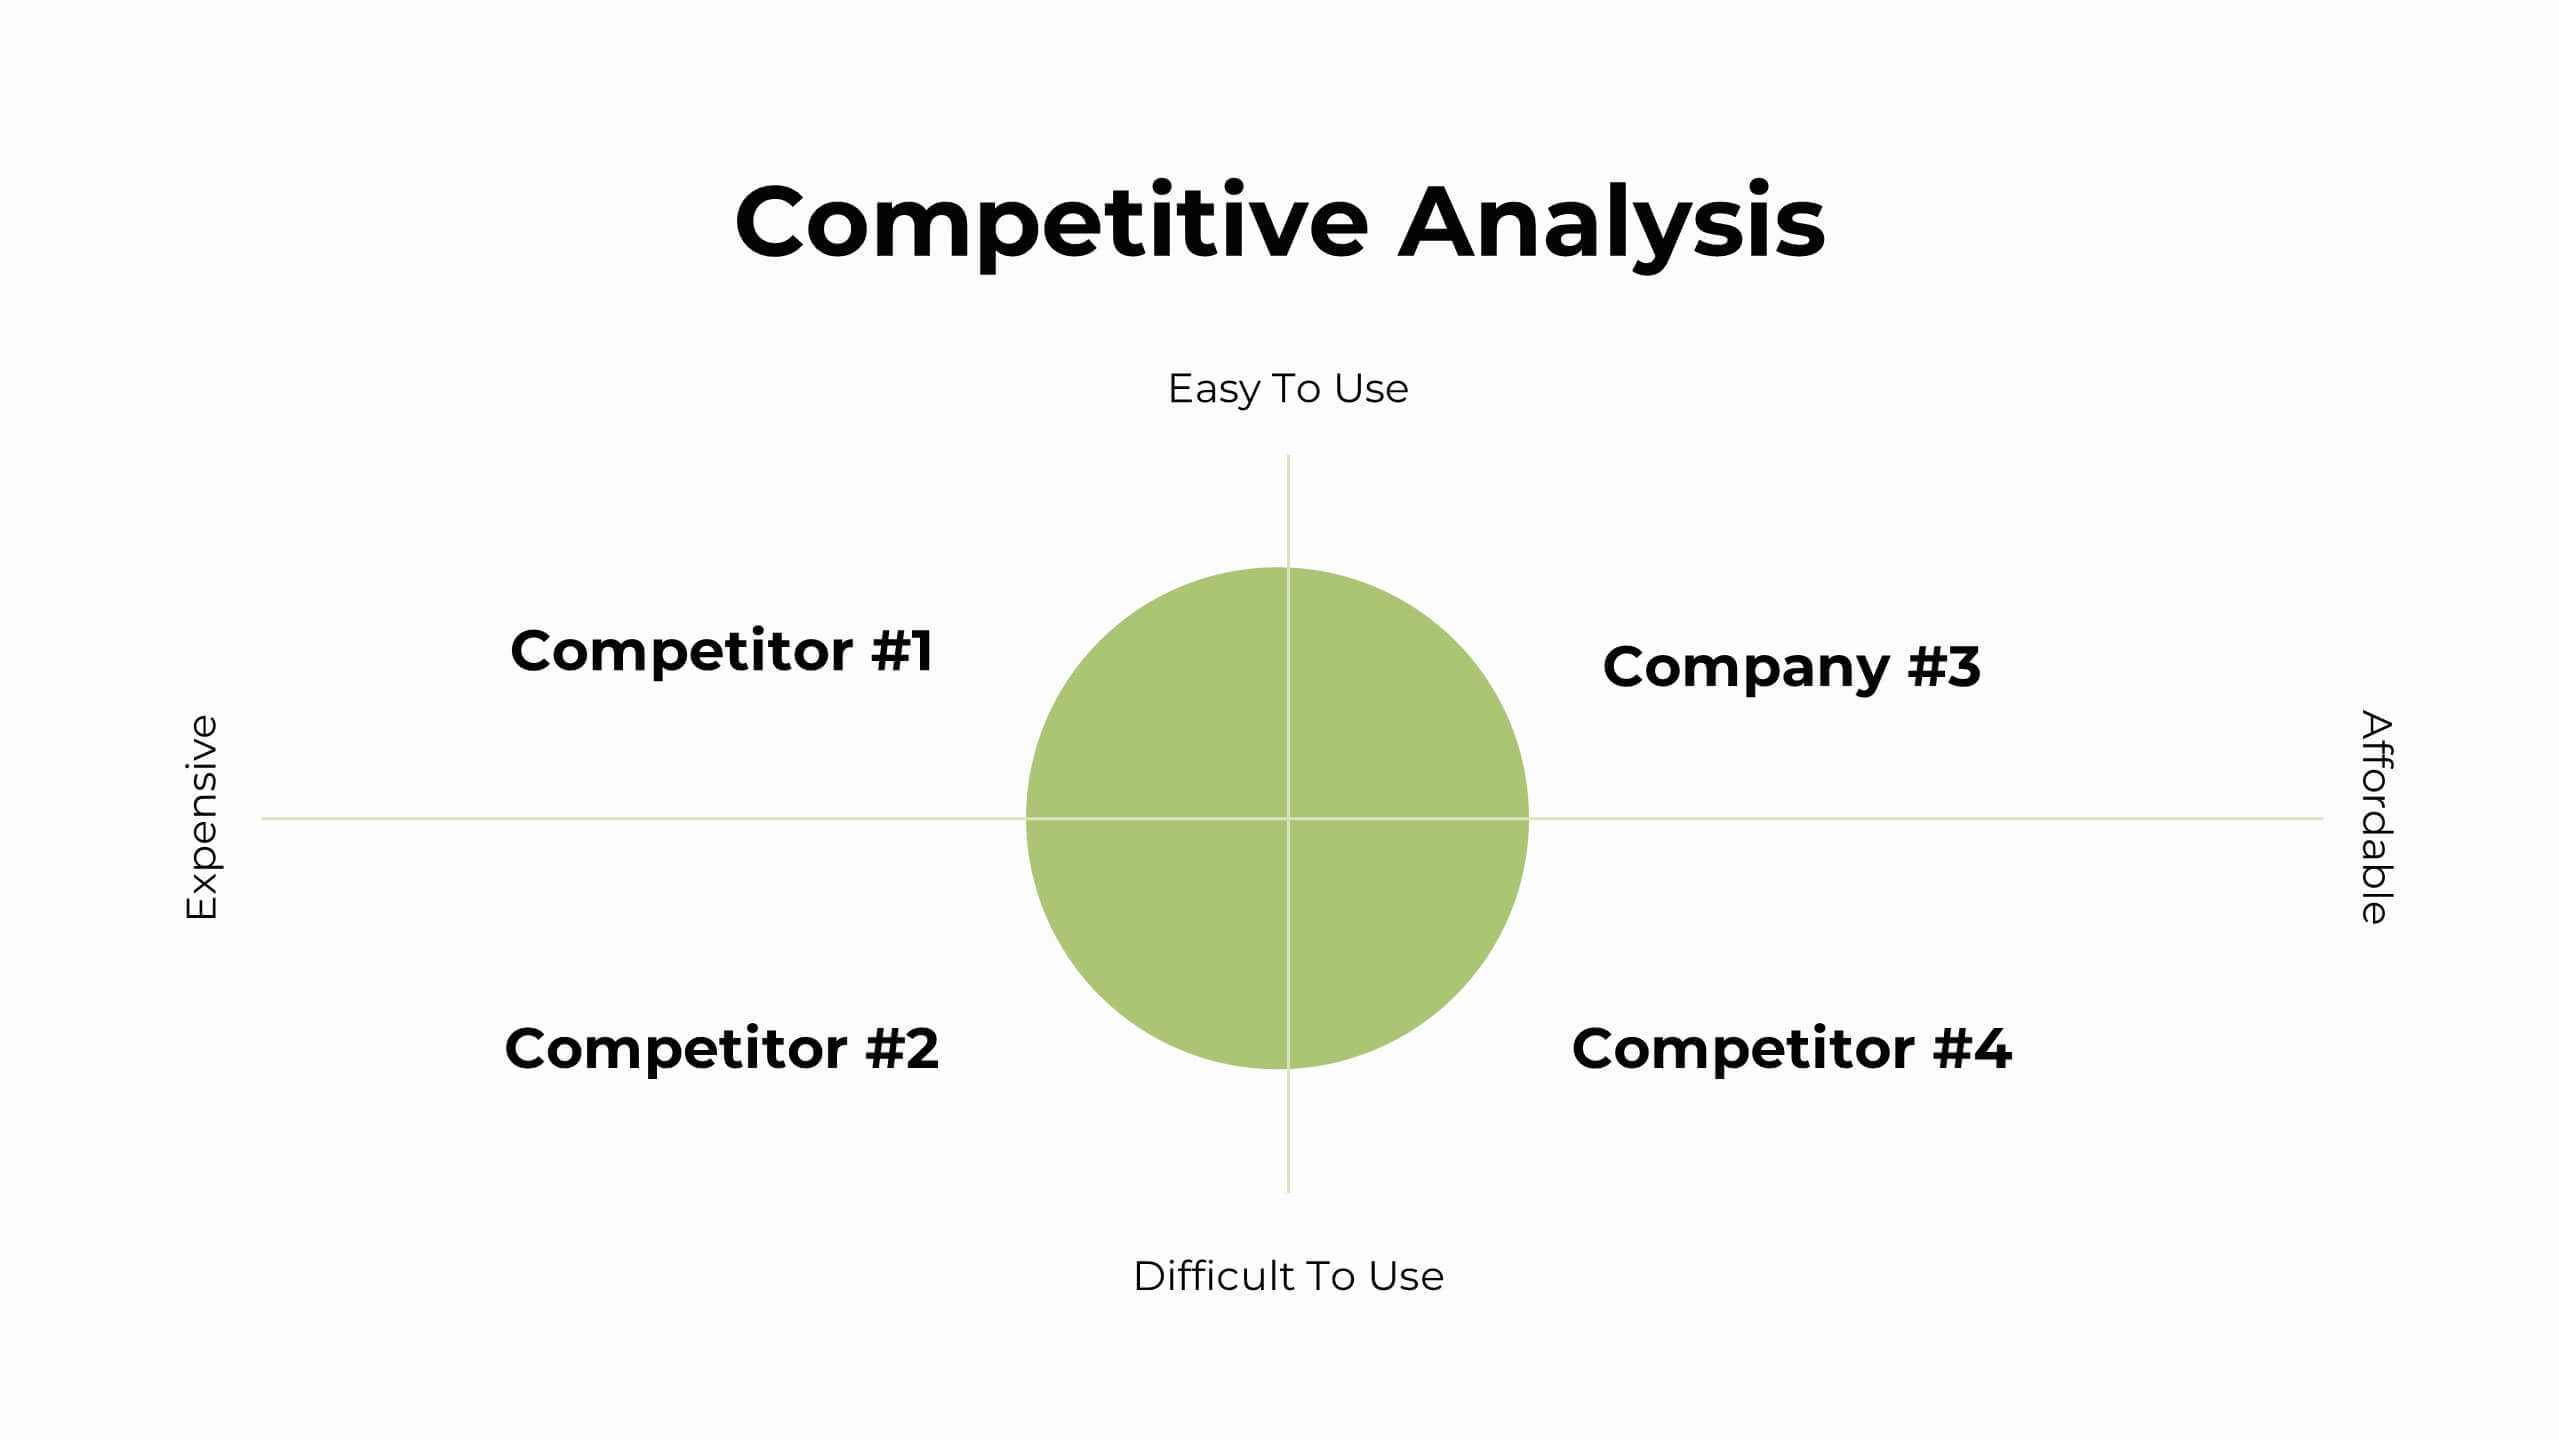
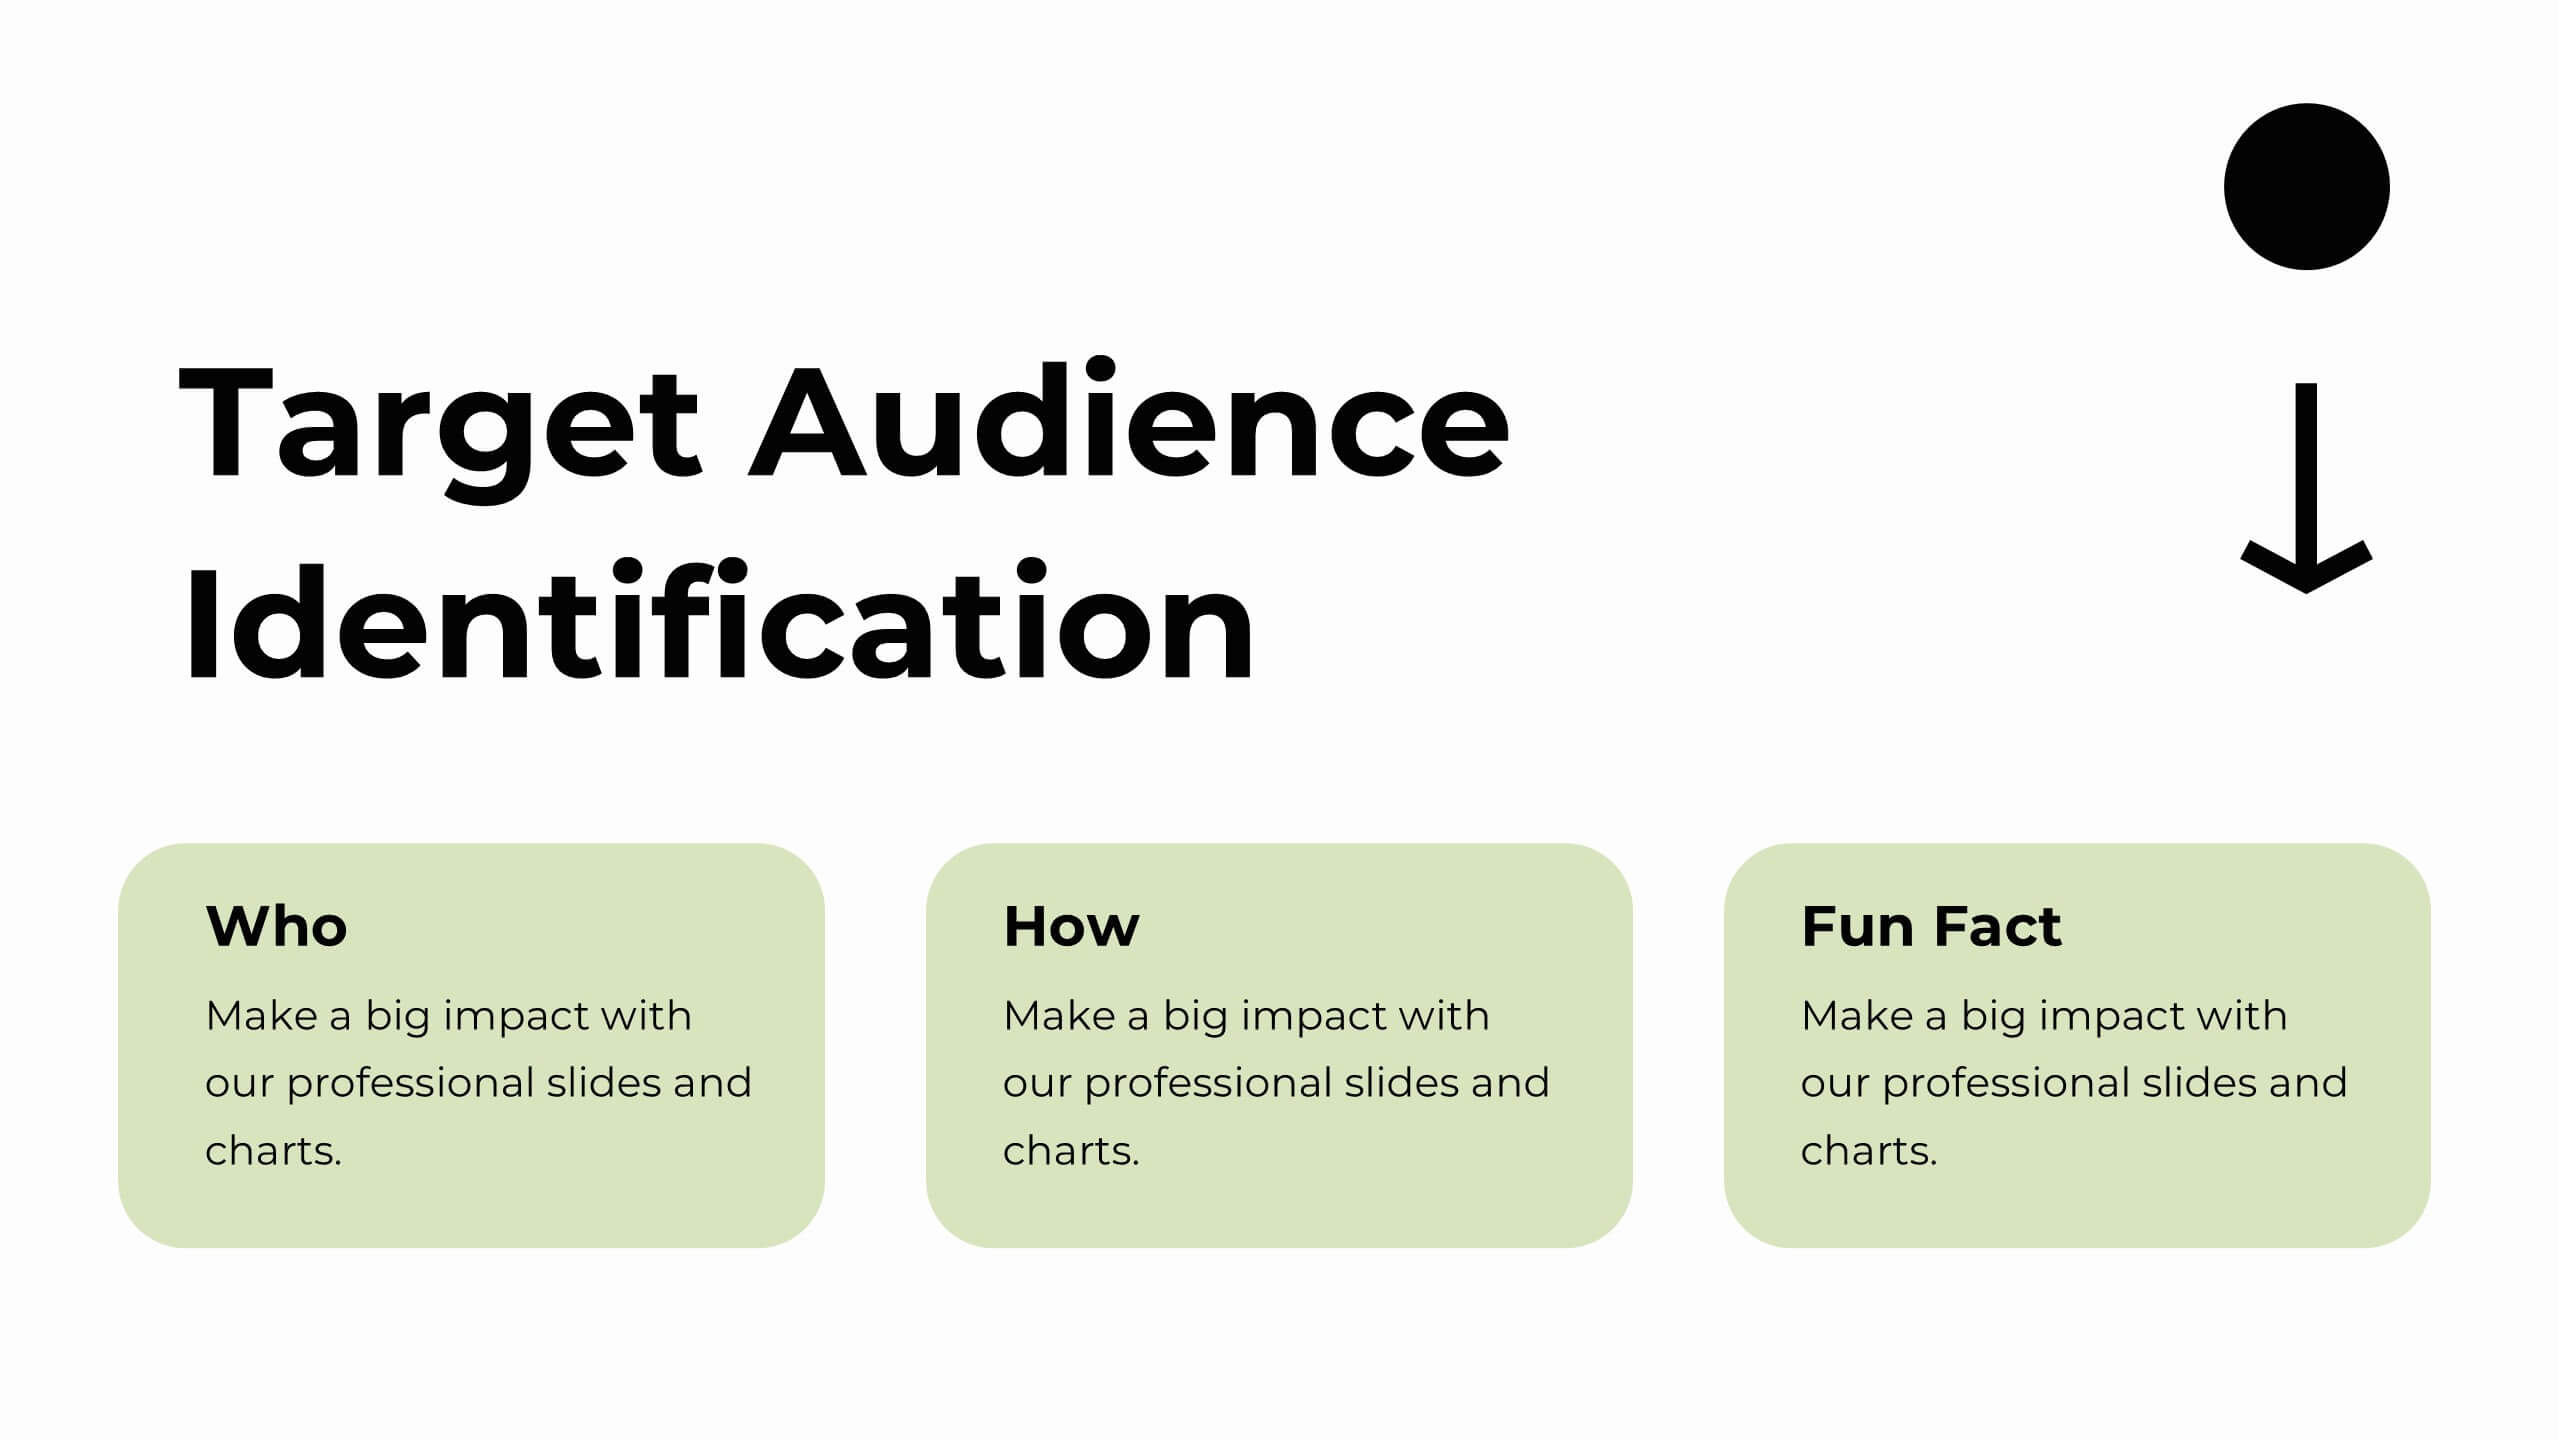
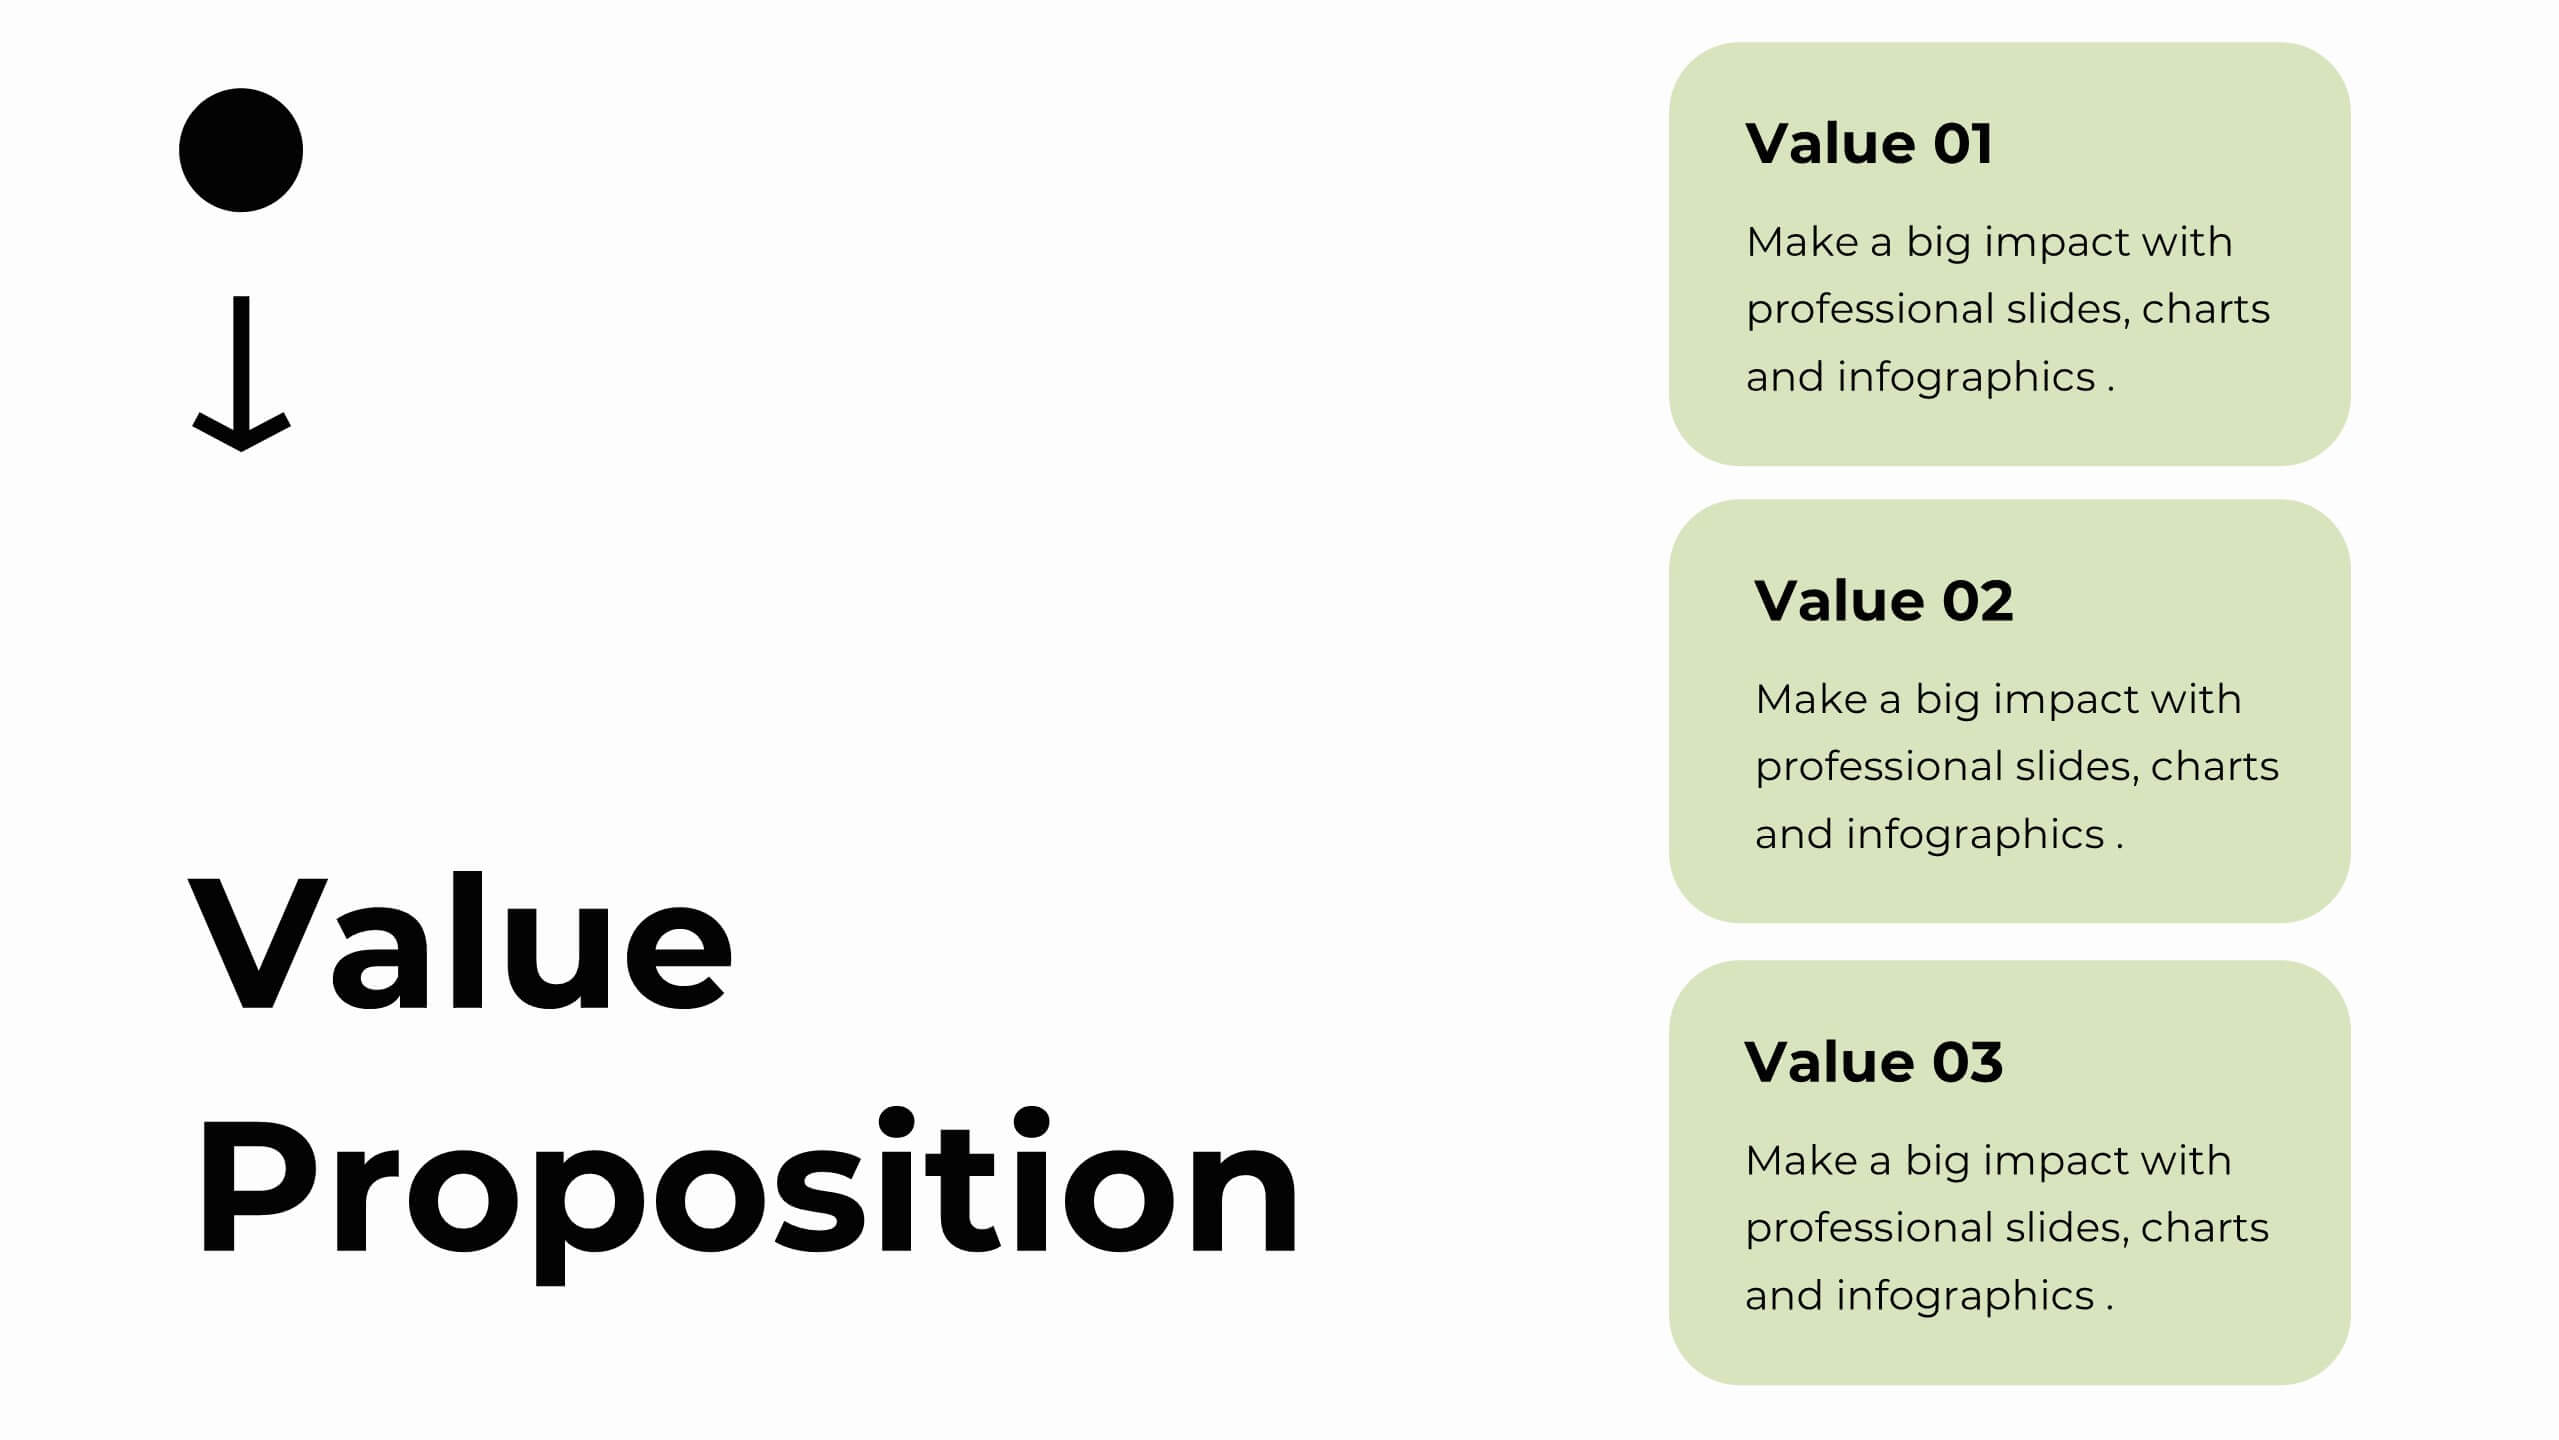
Business Strategy refers to a set of planned actions and decisions designed to achieve specific goals and objectives within an organization. This infographic template is designed to showcase the key elements and steps involved in a business development strategy. Ideal for entrepreneurs and marketing professionals, this template helps present the roadmap for business growth and success. The visuals showcase the market research and analysis conducted to identify target audiences, market trends, and competitors. Graphs and charts represent market growth potential and opportunities. This template is fully compatible with Powerpoint, Keynote, and Google Slides.


6 slides
Goal Setting and Strategic Planning Presentation
Present objectives and action plans with the Goal Setting and Strategic Planning template. Featuring a modern segmented design, this layout is perfect for outlining priorities, initiatives, and milestones. Fully editable in Canva, PowerPoint, and Google Slides, allowing you to adapt colors, icons, and text to match your business vision.


6 slides
Population Pyramid Infographic
A population pyramid, also known as an age-gender pyramid, is a graphical representation of the distribution of a population by age and gender. This infographic is a visually captivating presentation designed to illustrate the age and gender distribution of a population. It provides an easy-to-understand representation of the population structure, allowing viewers to grasp demographic patterns at a glance. Present your population data and demographic trends with this template. This enables viewers to grasp demographic patterns quickly and facilitates the key insights about a population's composition and changes over time.


4 slides
Ishikawa Diagram for Process Review Presentation
Visualize cause-and-effect relationships with the Ishikawa Diagram for Process Review Presentation. Also known as a fishbone diagram, this template is perfect for identifying potential root causes during quality control or team brainstorming sessions. Easily editable in Canva, PowerPoint, and Google Slides to match your workflow and style.


12 slides
SMART Goal Setting Presentation
Achieve clarity and focus with this SMART Goal Setting Presentation template. Featuring a visually engaging target and color-coded SMART framework, this slide helps break down objectives into Specific, Measurable, Attainable, Relevant, and Timely components. Perfect for business planning, project management, and personal development. Compatible with PowerPoint, Keynote, and Google Slides.


6 slides
Business Funnel Breakdown Visualization
Break down your entire sales or operational funnel with clarity using the Business Funnel Breakdown Visualization Presentation. This clean, 3D-styled funnel graphic divides your process into five editable layers, making it ideal for showcasing lead flow, process stages, or customer lifecycle phases. Fully customizable in PowerPoint, Keynote, and Google Slides.