


Features
- 10 Unique slides
- Fully editable and easy to edit in Microsoft Powerpoint, Keynote and Google Slides
- 16:9 widescreen layout
- Clean and professional designs
- Export to JPG, PDF or send by email


Do you have any questions?
Recommend


4 slides
Company Vision and Long-Term Goals Presentation
Present your company’s future with clarity and impact using this Company Vision and Long-Term Goals slide. Featuring a bar chart-style graphic with ascending growth stages, this template allows you to showcase strategic milestones, business values, or development phases. Each bar is paired with icons and editable text to highlight specific goals, making it ideal for leadership meetings, strategic planning, or investor pitches. Clean, modern, and customizable in PowerPoint, Keynote, and Google Slides.


4 slides
Real Estate Business Proposal
Make a lasting impression with this key-and-houses layout, perfect for unlocking your property pitch. Designed for real estate professionals, agencies, and consultants presenting market strategies or service offerings. Easily customizable in PowerPoint, Keynote, and Google Slides.


8 slides
Cloud Data Storage and Security Presentation
Visualize cloud security effortlessly with this Cloud Data Storage and Security template. Designed for IT teams, cybersecurity professionals, and cloud architects, this slide simplifies complex data protection strategies, storage models, and access controls. Featuring a modern cloud-based layout with clear, structured elements, it ensures easy interpretation of key security components. Fully editable and compatible with PowerPoint, Keynote, and Google Slides for seamless presentations.


7 slides
Root Cause Analysis for Problem Solving Presentation
Identify and Resolve Issues Effectively with this Root Cause Analysis for Problem Solving presentation template. Designed to streamline complex problem-solving, this layout features clear visual markers, structured iconography, and step-by-step segmentation to help teams analyze causes, pinpoint bottlenecks, and implement solutions efficiently. Ideal for project managers, business analysts, and operational teams, this template is fully customizable and works seamlessly in PowerPoint, Keynote, and Google Slides, ensuring a professional and engaging presentation experience.


7 slides
Annual Marketing Report Infographic
Elevate your corporate narrative with our meticulously curated Annual Report Infographic. Cloaked in the purity of white and varying professional blue tones, our template mirrors the precision and credibility essential for annual reviews. Enhanced with succinct infographics, coherent icons, and pertinent image placeholders, it weaves a year's data into a compelling visual story. Flawlessly adapted for Powerpoint, Keynote, or Google Slides. A quintessential instrument for CEOs, financial analysts, stakeholders, or any organization presenting its yearly milestones and future outlook. Reflect, report, and strategize; let every slide be a testament to your organization's journey and ambition.


20 slides
Legacy Product Launch Presentation
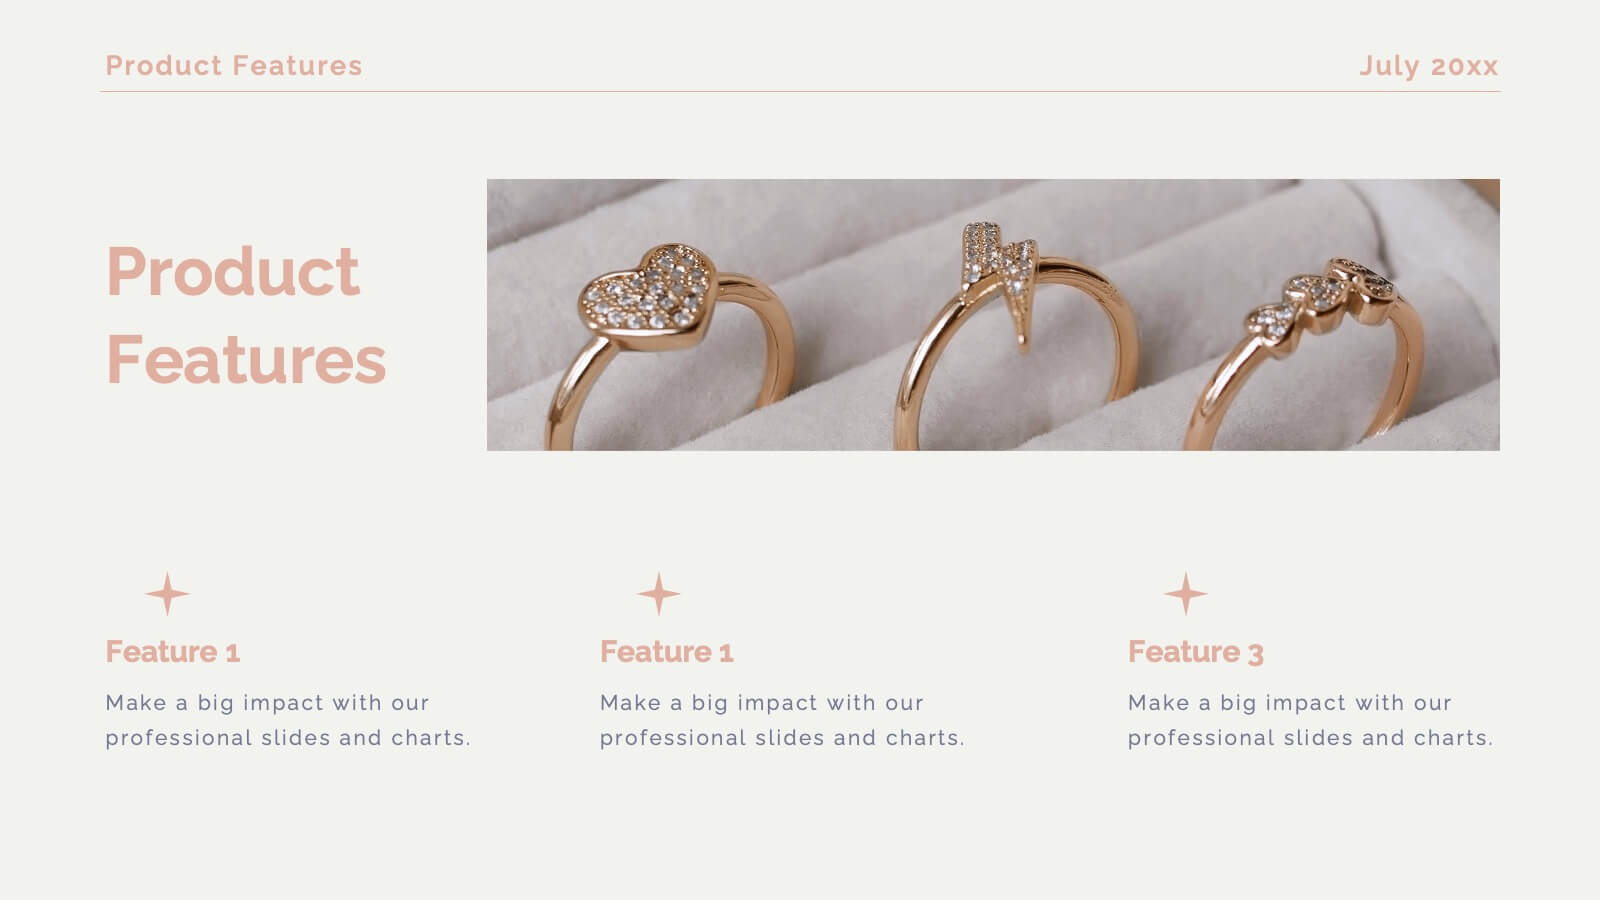
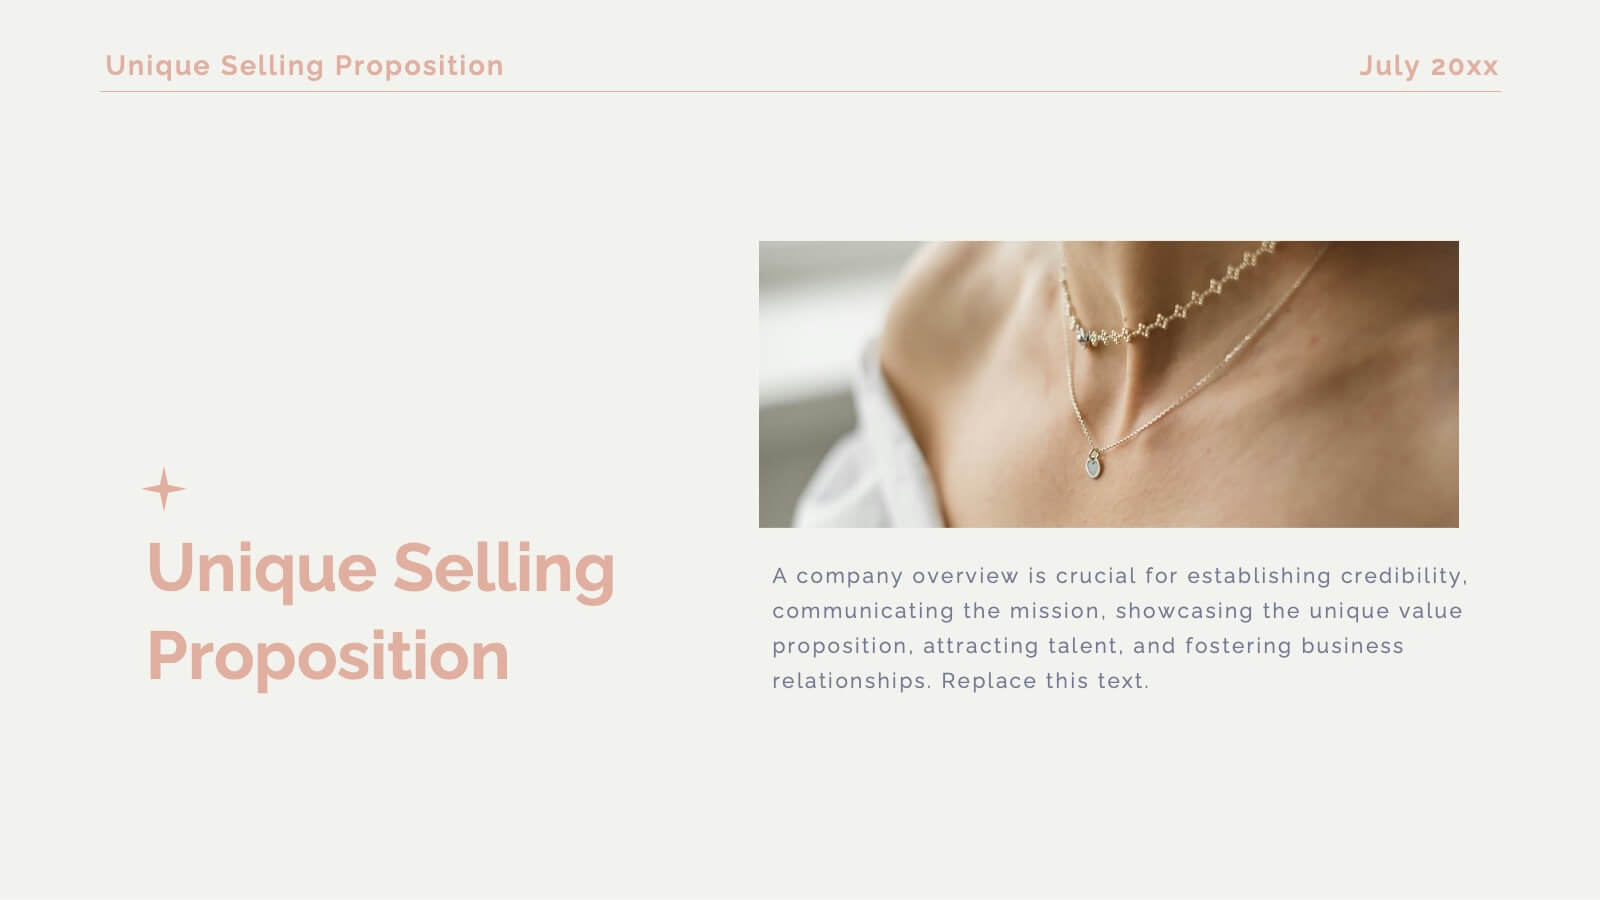
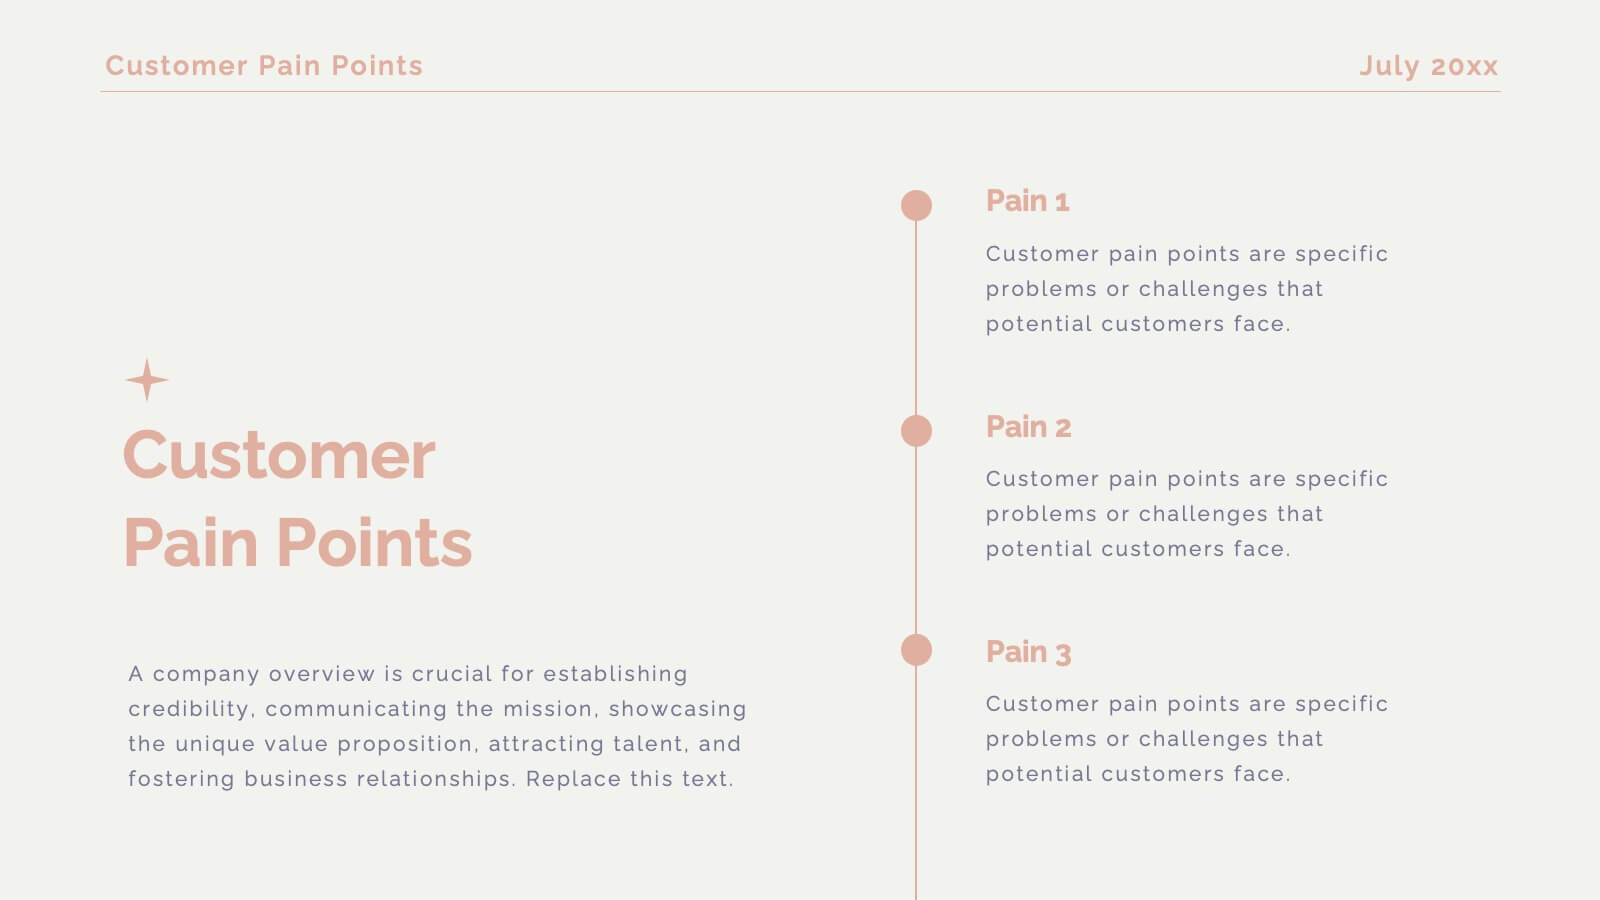
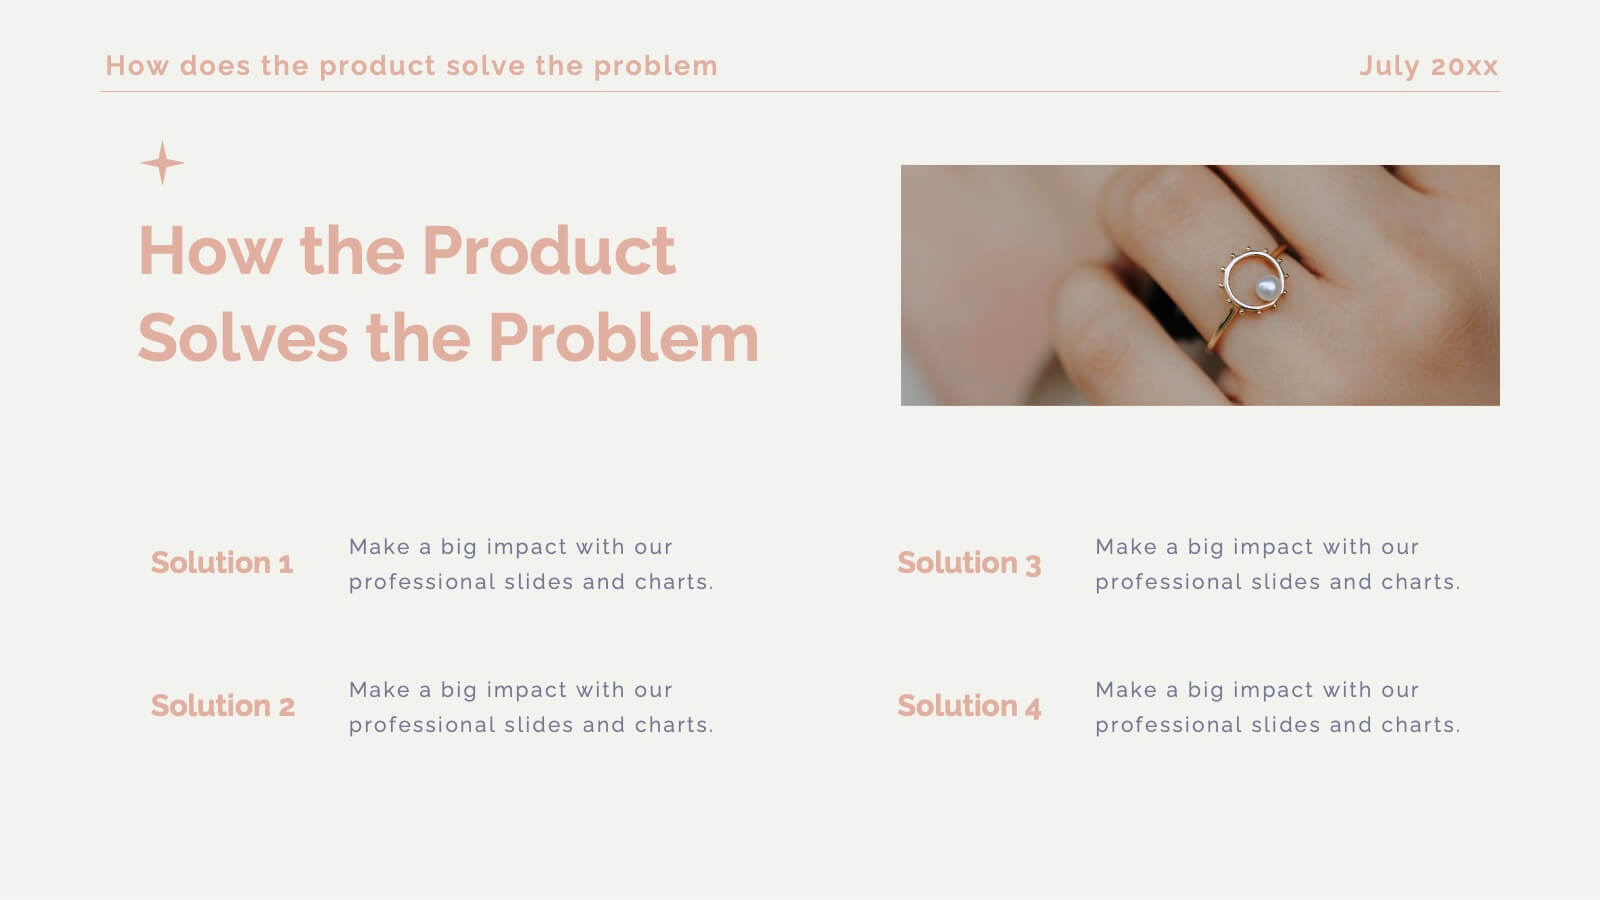
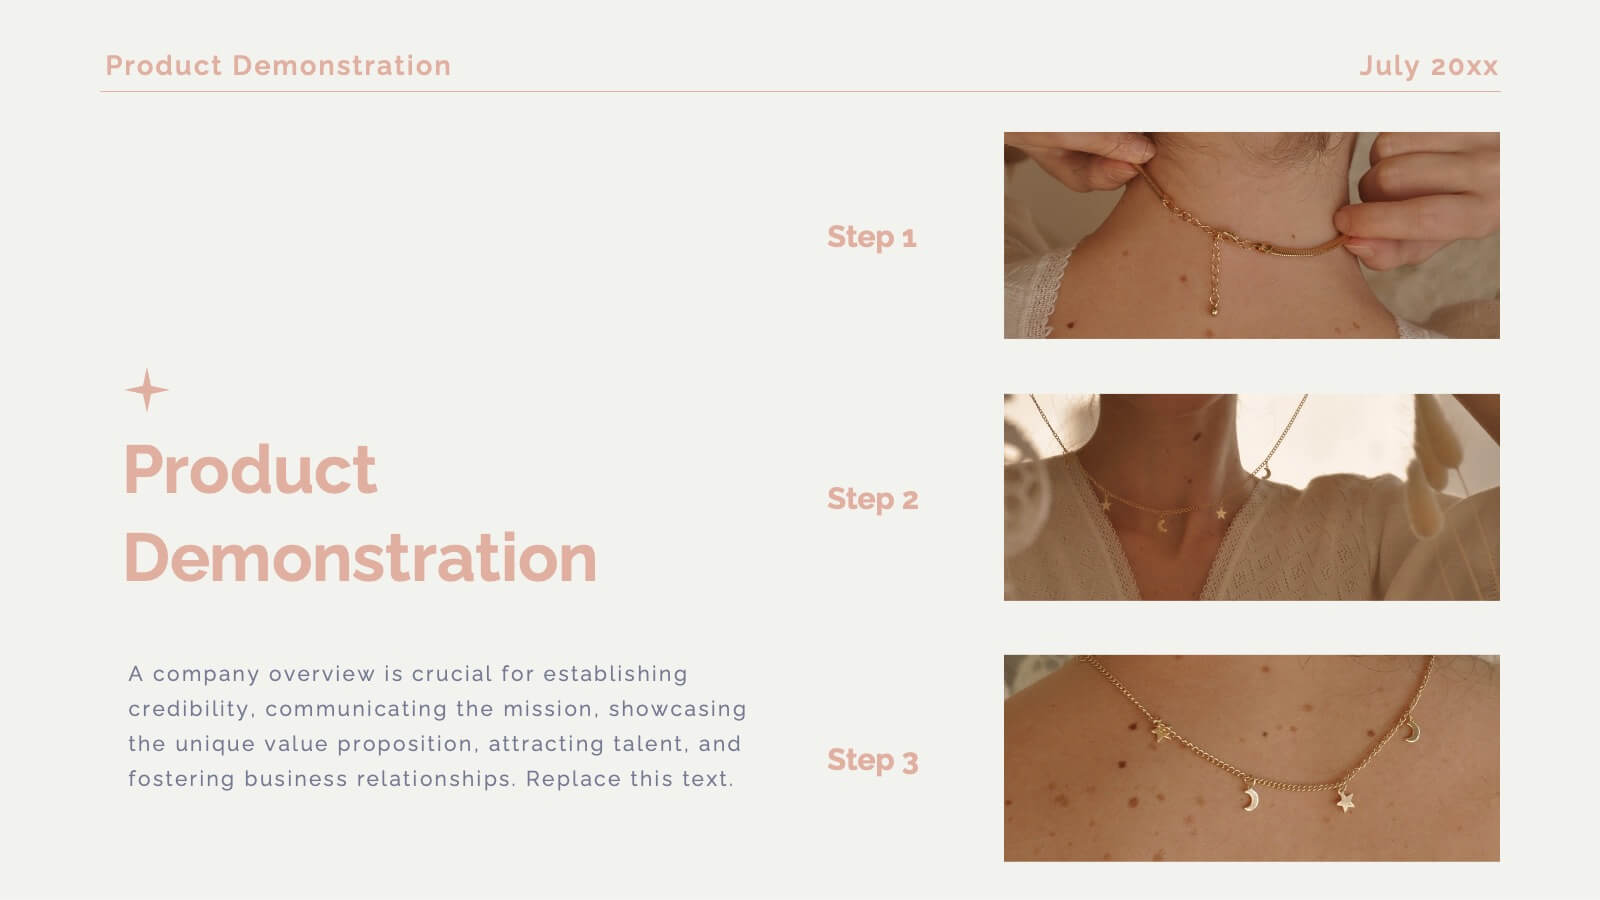
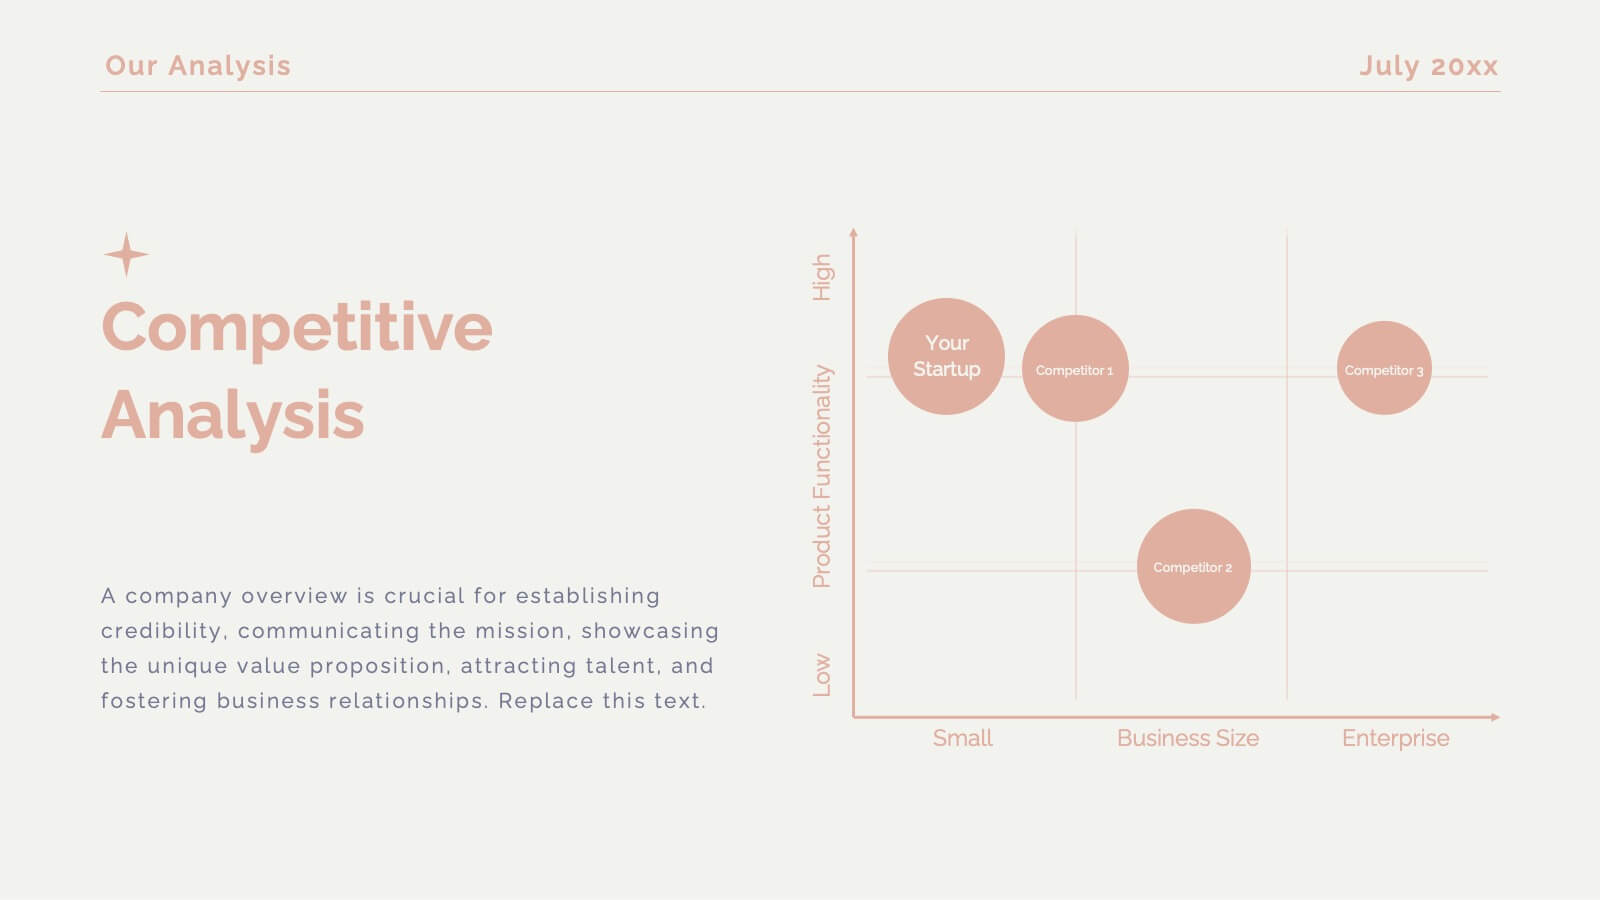
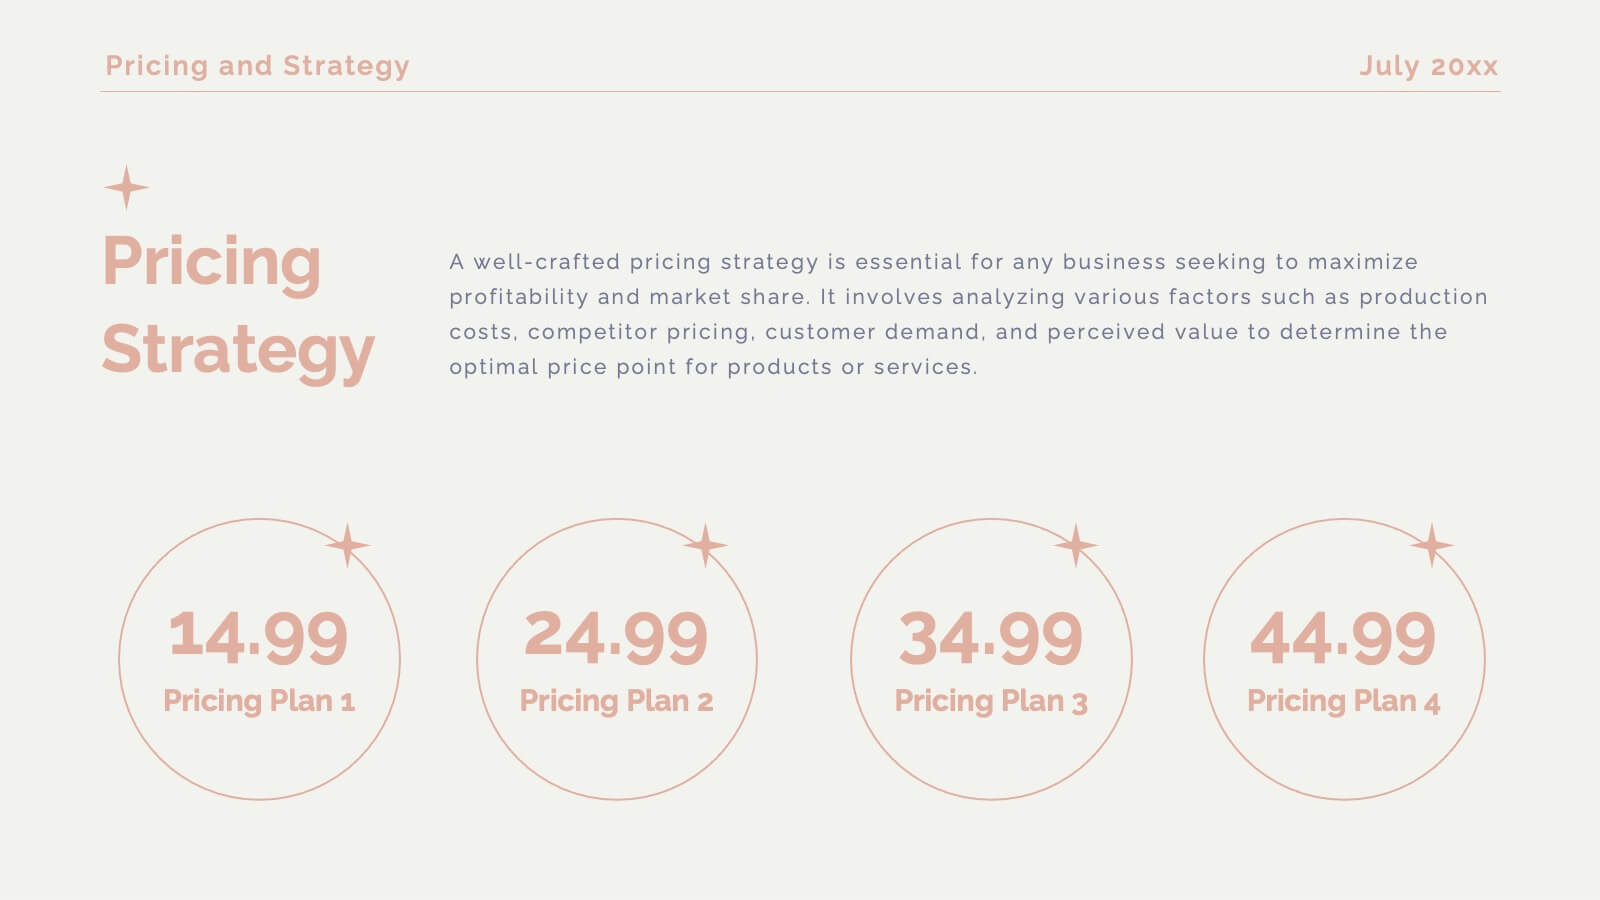
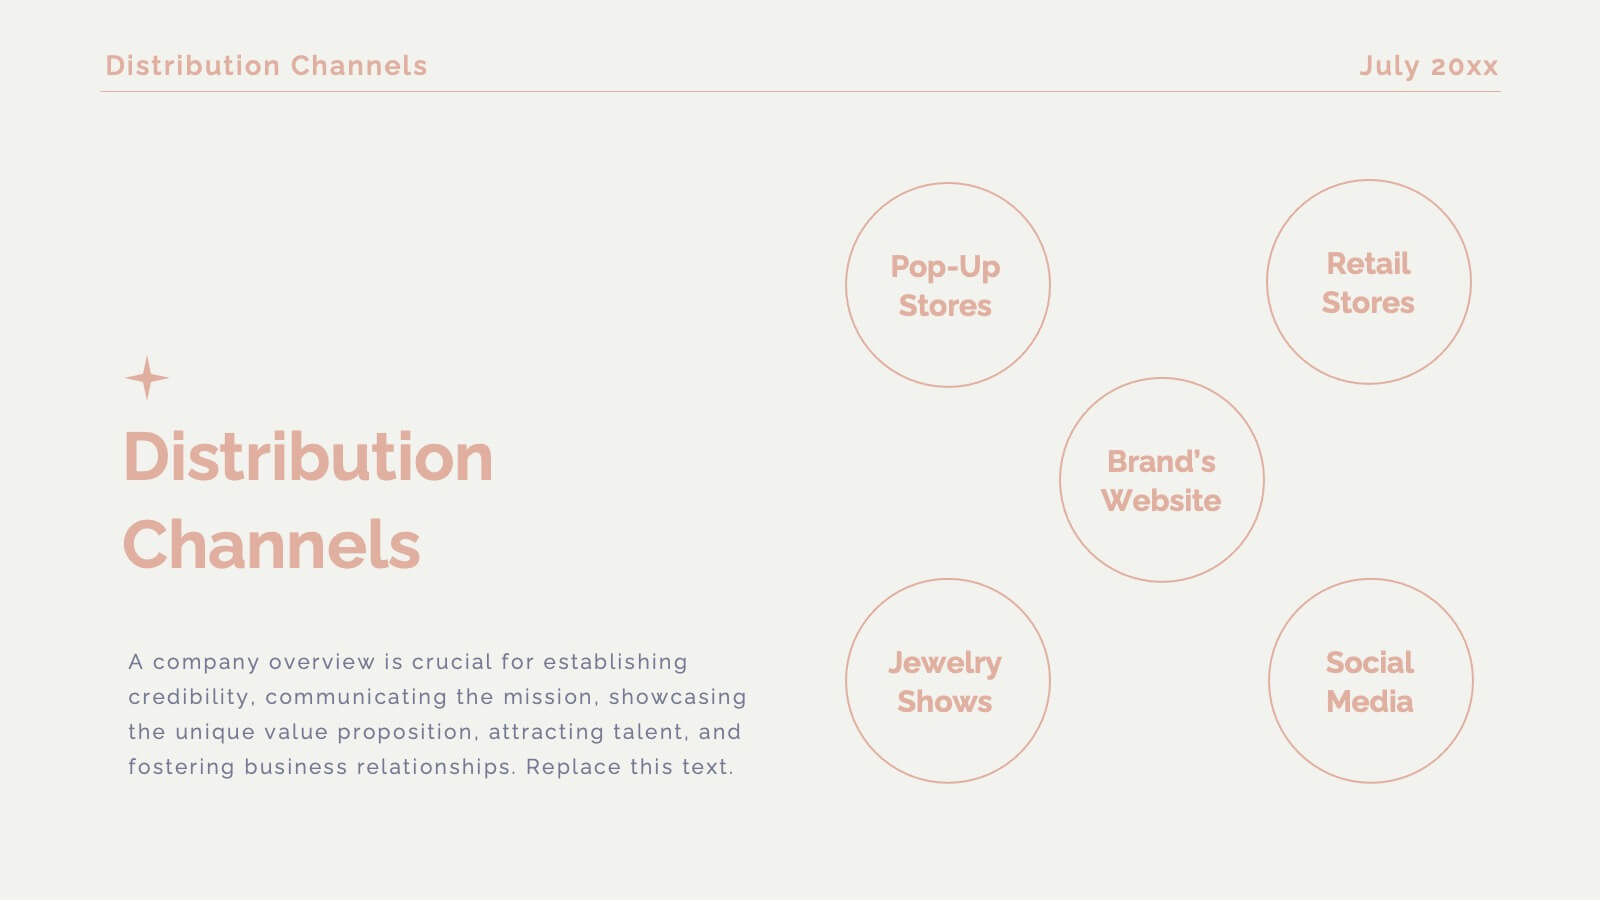
Get ready to unveil your product with a stunning and sophisticated launch template designed to captivate and convert! This template offers everything you need to present your product in the most compelling way possible, from an inviting welcome slide to an in-depth company overview that sets the stage for your brand’s story. The sleek design highlights key product features, unique selling propositions, and a thorough competitive analysis that positions your product as the market leader. With sections dedicated to customer pain points, solutions, and a powerful product demonstration, this template ensures your audience understands the value and impact of your offering. It also includes critical details like pricing strategy, distribution channels, and manufacturing processes, giving a full picture of your product’s journey from concept to market. Compatible with PowerPoint, Keynote, and Google Slides, this template is your ultimate tool for a successful product launch that leaves a lasting impression!


5 slides
Science Myths & Facts Infographics
Science myths are misconceptions or false beliefs that are widely circulated and often accepted by people, despite being contradicted by scientific evidence. These are engaging and educational infographic templates that aims to debunk common misconceptions and provide accurate information about various scientific topics. They present a collection of myths and their corresponding facts in a visually appealing and easy-to-understand format. The infographics utilizes eye-catching visuals, such as icons, illustrations, or images, to enhance the presentation and make the information more memorable.


7 slides
SEO Strategy and Keyword Plan Presentation
Spark your marketing roadmap with a bold, idea-driven layout that makes every action step clear and memorable. This presentation helps you outline search goals, explore keyword opportunities, and map out strategic priorities in a simple, visual flow. Fully compatible with PowerPoint, Keynote, and Google Slides.


6 slides
Investment Strategy Planning Presentation
The "Investment Strategy Planning Presentation" templates employ a clean and straightforward design with pentagon-shaped elements to visually represent various stages or components of investment strategies. Each template highlights key points with icons that effectively communicate the concept, making them especially useful for financial presentations where clarity and emphasis on specific financial strategies are crucial. This format supports a structured approach to presenting complex investment plans, helping to guide the audience through each phase of the strategy clearly and efficiently.


6 slides
Europe Regions Infographic
Europe is a diverse continent with various regions that have their own unique characteristics and cultural identities. This infographic provides an overview of the different regions in Europe. It is designed to help viewers understand the diverse geography, culture, and characteristics of each region within Europe. The template features a map of Europe that highlights the various regions. Viewers can easily identify and explore each region on the map. The template includes slides dedicated to providing key information such as capital cities and major landmarks. The template incorporates statistical data to showcase key facts and figures about each region.


5 slides
Execution Model Using RAPID Framework Presentation
Visualize decision-making accountability with the Execution Model Using RAPID Framework Presentation. This clean, color-coded matrix organizes roles across tasks using the RAPID method—Recommend, Agree, Perform, Input, Decide—making it easy to assign responsibilities at a glance. Ideal for strategic planning, team alignment, and project execution. Editable in PowerPoint, Google Slides, Keynote, and Canva.


7 slides
Human Anatomy Infographic Presentation
The Human Anatomy is the study of the structure and organization of the human body. This template is perfect for illustrating the most important aspects of anatomy and physiology in a fun, colorful way. This infographic is perfect for students, teachers, and medical practitioners. With this anatomy presentation, you can show how all organs, bones and tissues are connected together to make up incredible living organisms known as humans. Compatible with Powerpoint, keynote and google slides, this infographic template is a great way to explain each human organ in a simple and informative way.


6 slides
Break Even Analysis Rate Infographics
Analyze your business's break-even point effectively with our Break-Even Analysis Rate infographic template. This template is fully compatible with popular presentation software like PowerPoint, Keynote, and Google Slides, allowing you to easily customize it to illustrate and communicate critical break-even analysis concepts. The Break-Even Analysis Rate infographic template offers a visually engaging platform to calculate and display the point at which your business covers all its costs and begins to generate a profit. Whether you're an entrepreneur, financial analyst, or business owner, this template provides a user-friendly canvas to create informative presentations and reports on your break-even analysis. Optimize your financial decision-making with this SEO-optimized Break-Even Analysis Rate infographic template, thoughtfully designed for clarity and ease of use. Customize it to showcase your break-even calculations, assumptions, and scenarios, helping you make informed decisions about pricing, costs, and profitability. Start crafting your personalized infographic today to enhance your break-even analysis skills and strategies.


3 slides
Workflow Improvement and Progress Chart Presentation
Folders aren't just for files—they’re perfect for ideas too. This visual chart maps out streamlined processes, making it easier to track progress and improve internal workflow. Great for managers and teams, this infographic presentation template is fully compatible with PowerPoint, Keynote, and Google Slides for effortless editing and sharing.


5 slides
Political Campaign Strategies Infographics
A political campaign refers to the organized efforts of individuals or groups to promote a particular candidate, political party, or specific political agenda during an election or to raise awareness and support for a specific issue. These infographic templates are designed to showcase various strategies and techniques used in political campaigns. This is perfect for politicians, campaign managers, or anyone involved in the political arena who wants to present their campaign strategies. Its customizable layout and eye-catching design enable politicians to communicate their campaign, engage with their audience, and rally support for their goals.


3 slides
Clean Water Initiative Overview Presentation
Communicate sustainability goals with this clean, modern layout featuring water droplet and faucet visuals. Ideal for summarizing three core focus areas of your environmental or nonprofit program. The minimalist design keeps attention on your key points. Fully editable and compatible with PowerPoint, Keynote, and Google Slides for easy customization.


26 slides
Branding Agency Company Profile Presentation
Branding for a digital agency is essential for creating a strong and memorable identity that sets it apart from competitors and resonates with its target audience. This presentation is a professional template, designed to showcase the expertise and capabilities of a branding agency. With its modern and sleek design, this presentation is perfect for introducing the agency's services, achievements, and client success stories to potential clients, partners, or investors. This template is perfect to showcase successful branding projects and campaigns, emphasizing the challenges faced, the creative solutions employed, and the results achieved for clients.