


Features
- 4 Unique slides
- Fully editable and easy to edit in Microsoft Powerpoint, Keynote and Google Slides
- 16:9 widescreen layout
- Clean and professional designs
- Export to JPG, PDF or send by email


Do you have any questions?
Recommend


7 slides
Target Market Profiles Infographic
A Target Market Profile, also known as a customer profile or buyer persona, is a detailed description of a specific segment of a broader market that a business aims to target with its products or services. This infographic is a vibrant and insightful template designed to help you understand your audience better and enhance your marketing strategies. Explore the essence of audience segmentation and empower your marketing endeavors with a clear understanding of your target market. Compatible with Powerpoint, Keynote, and Google Slides. This infographic explores the world of targeted marketing and revolutionize your strategies.


4 slides
Core Company Value Mapping Presentation
Spotlight your business strengths with the Core Company Value Mapping Presentation. This slide design helps you break down and compare key value drivers using a structured visual format—ideal for internal strategy discussions, executive briefings, or stakeholder updates. Highlight metrics, priorities, or departments with side-by-side percentage comparisons and icon indicators. Fully editable in PowerPoint, Keynote, and Google Slides. A must-have for operations teams, consultants, and leadership presentations.


4 slides
Boardroom Strategy Meeting Overview Presentation
Align leadership goals and present strategic priorities with the Boardroom Strategy Meeting Overview presentation. Featuring a clean visual of executive collaboration, this template helps organize key discussion points, initiatives, and responsibilities in a structured layout. Ideal for quarterly planning, leadership updates, and strategic alignment sessions. Fully editable in PowerPoint, Keynote, and Google Slides.


7 slides
Success Iceberg Infographic
Iceberg Infographic are visual guides to understanding the world of business. Ideal for anyone who wants to understand the basics of business, from what it is and how it works to why it matters. This template is easy to read, and can be used for everything from data visualization to teaching people how to use a new product. Give your audience a look at the most important parts of your business. The template is easy to use, and allows you to highlight your data. Fully customizable and compatible with Powerpoint, Keynote, and Google Slides. There are multiple color themes, fonts, and shapes to choose from, and endless combinations to make it truly yours.


6 slides
Skills Gap Assessment Infographic
The Skills Gap refers to the mismatch between the skills and qualifications that employers seek in their workforce and the skills possessed by job seekers or employees. This infographic template is a visual representation of the evaluation and analysis of the skills gap within a specific organization, industry, or job sector. The infographic is designed to help businesses and stakeholders understand the disparity between the skills required for certain roles and the skills possessed by the current workforce. By identifying the skills gap, organizations can develop targeted training and development programs to bridge the gap and enhance their employees' skills.


5 slides
Natural Disaster Effects Infographics
Natural Disasters are sudden and extreme events caused by natural forces that result in significant damage, and loss of life. This template is designed to effectively educate your audience about the effects of natural disasters and promote awareness and preparedness for such events. With this template you can present the effects and consequences of various natural disasters. Compatible with Powerpoint, Keynote, and Google Slides. It features a nature design with customizable photo layouts, charts, and infographics that help illustrate the effects. Use these visuals to depict different types of natural disasters, such as earthquakes, floods, and wildfires.


26 slides
Summer Sale Presentation
Soak up the bright, sunny vibes of a presentation template that’s perfectly tailor-made for the lively summer season. Its radiant design, infused with the essence of summer sales and tropical aesthetics, is a perfect match for retail campaigns, travel promotions, or any topic that aims to bring the sizzle of summer into a room. Bright colors, playful graphics, and beach-inspired backgrounds set the stage for vibrant storytelling, whether you're introducing a seasonal team, showcasing hot vacation spots, or highlighting the latest summer fashion. The template not only captures the casual, cheerful spirit of the season but also ensures that your content makes a splash with clear, concise data displays and infographics. It’s a breeze to use across various platforms like PowerPoint, Keynote, and Google Slides, ensuring your summer message is as refreshing as a cool ocean wave.


8 slides
Business Value Proposition
Clearly communicate your brand’s core value with this quadrant-style slide, ideal for pitching key benefits, market differentiators, or service pillars. Designed for product managers, marketers, and business consultants. Fully editable in PowerPoint, Keynote, and Google Slides—customize icons, titles, and layout with ease.


7 slides
Work From Home Benefits Infographic
The modern digital era has ushered in a revolution: the feasibility of working from home. Our work from home benefits infographic, crafted with a crisp white palette highlighted by shades of red and subtle black touches, dives deep into the multifaceted advantages of remote work. Whether it's the flexibility in hours, reduced commute stress, or the savings made, this template sheds light on every facet. This infographic template is perfect for professionals, team leaders, and organizations keen to adopt this model, its seamlessly compatible with PowerPoint, Keynote, and Google Slides.


7 slides
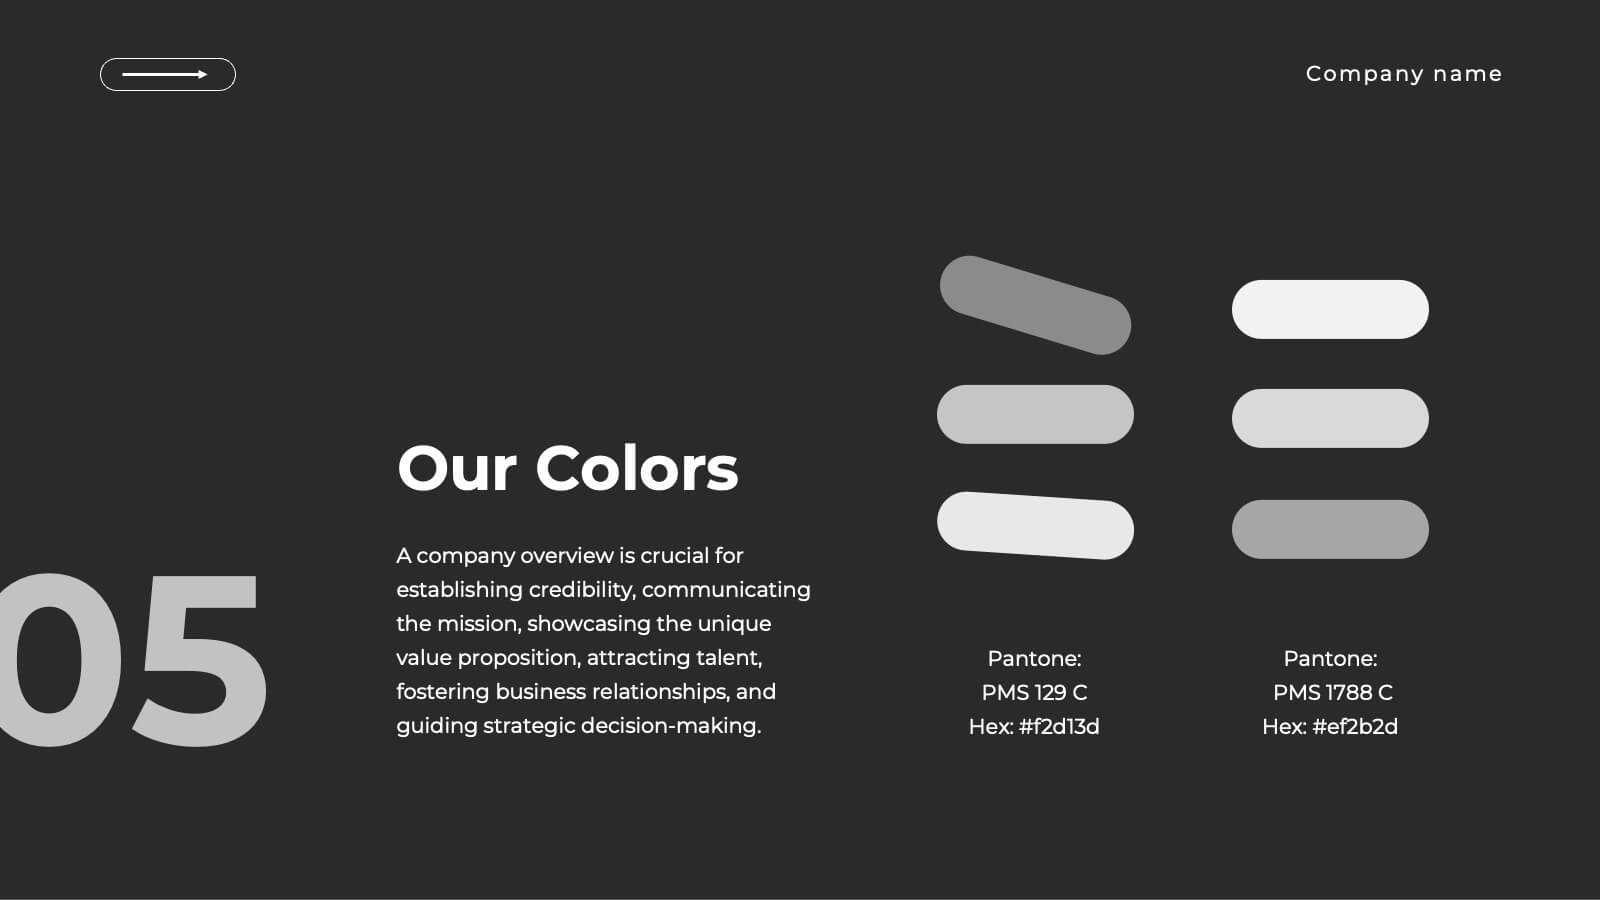
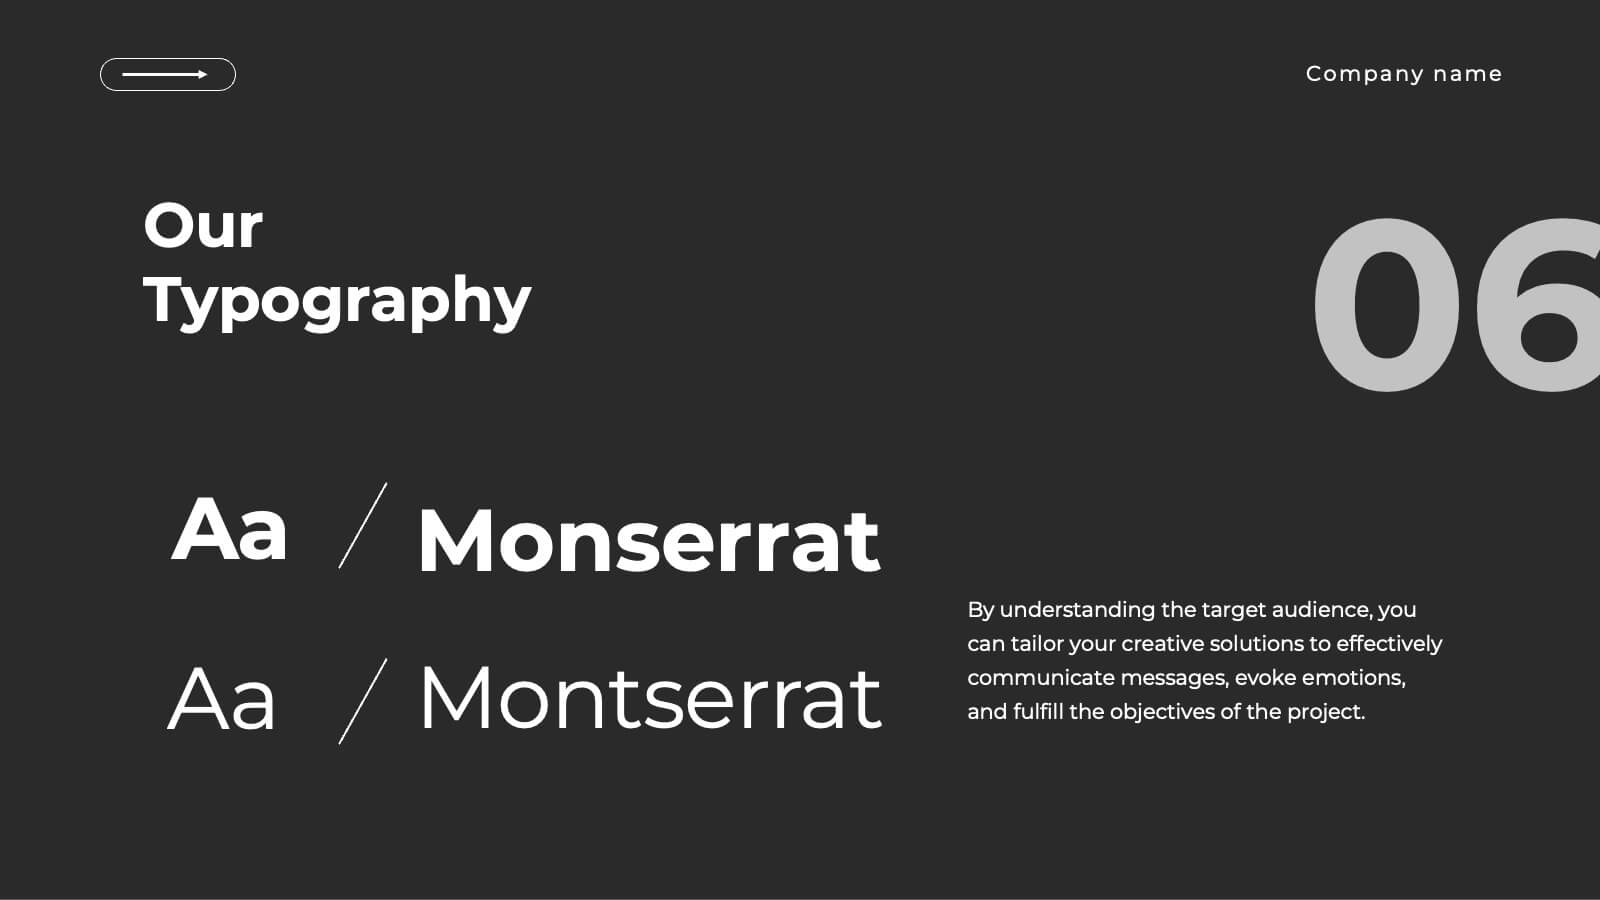
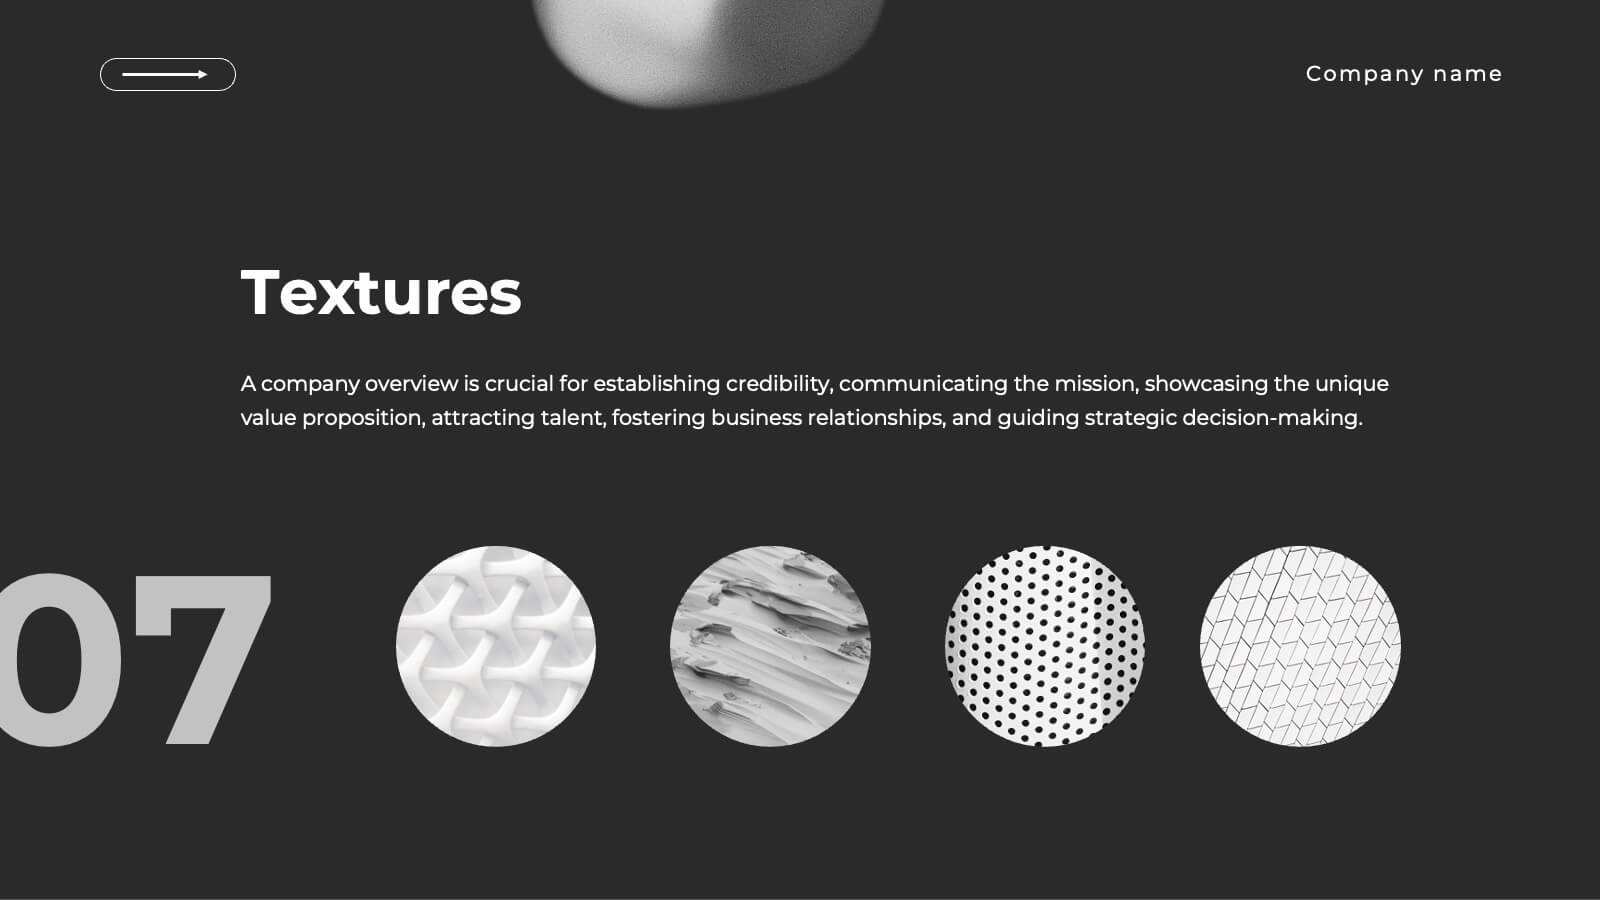
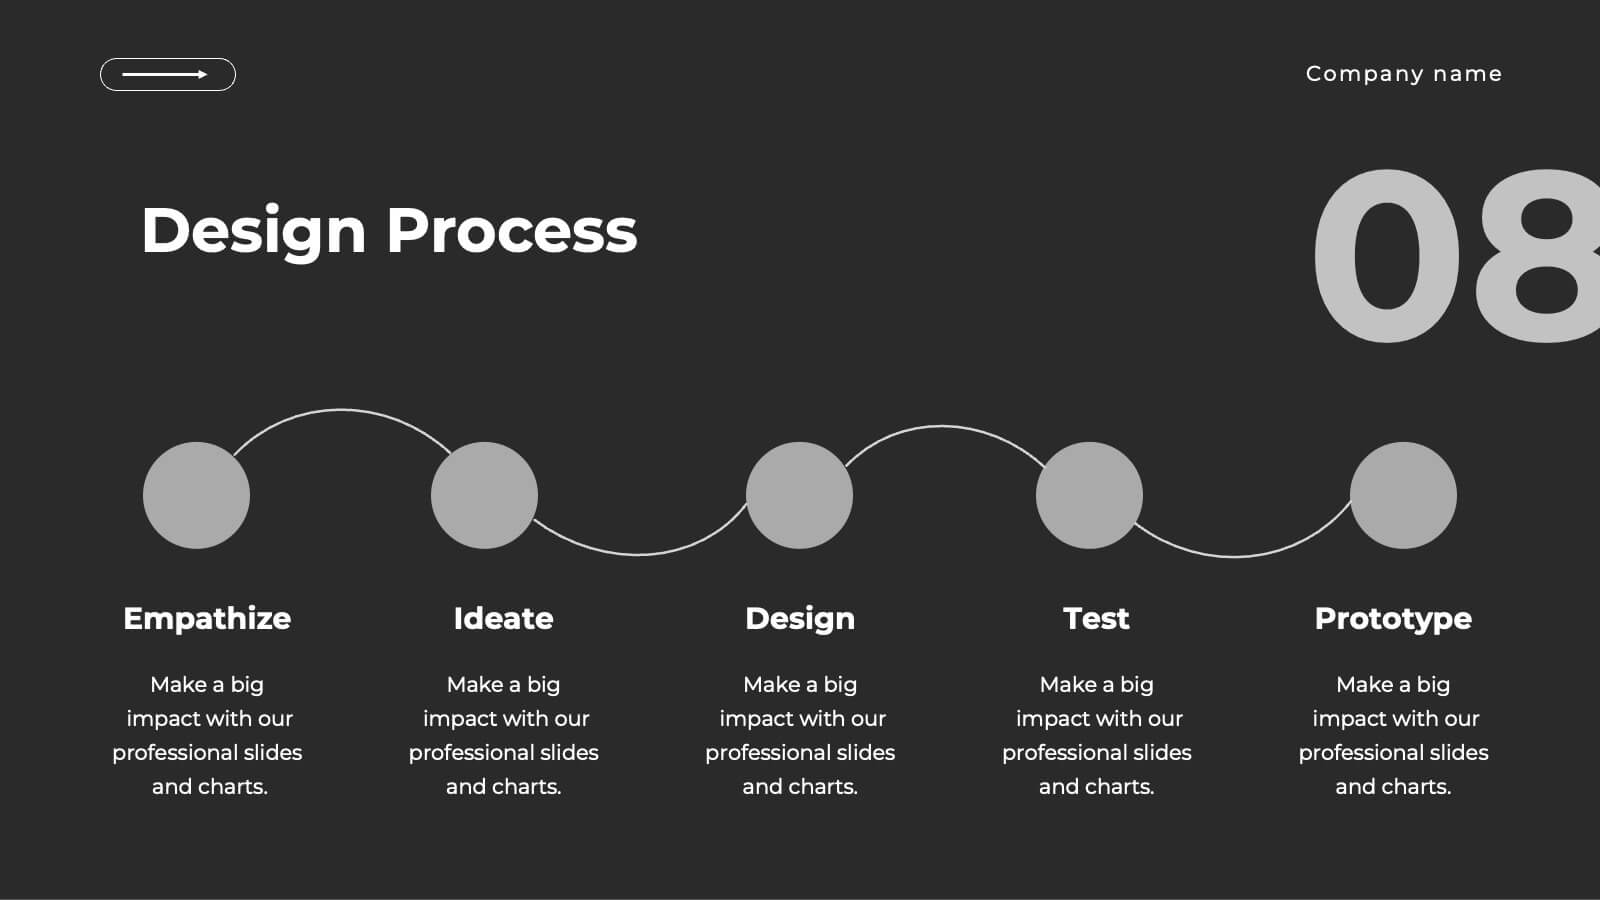
Company Profile Structure Infographic
This series of templates is meticulously crafted to represent a company’s structure in a detailed and organized manner. Each template varies in design and layout, ensuring that there is a style to suit different business needs and preferences. From straightforward, clean layouts to more dynamic, visually engaging designs, these templates provide an excellent basis for companies to present their organizational structure, core team members, departmental divisions, and key business areas effectively. Key information such as company values, mission statements, and strategic objectives can be clearly highlighted, allowing companies to communicate their business essence and operational ethos to stakeholders. Each template also accommodates data visualization through charts, graphs, and infographics, which are instrumental in depicting growth trajectories, performance metrics, or demographic breakdowns. With customization options, these templates can be tailored to reflect a company's unique brand identity, including color schemes, typography, and corporate logos, making each presentation not only informative but also reflective of the company's image. This collection is ideal for corporate introductions, stakeholder meetings, and internal presentations aimed at fostering a clear understanding of the company’s operational framework and strategic direction.


20 slides
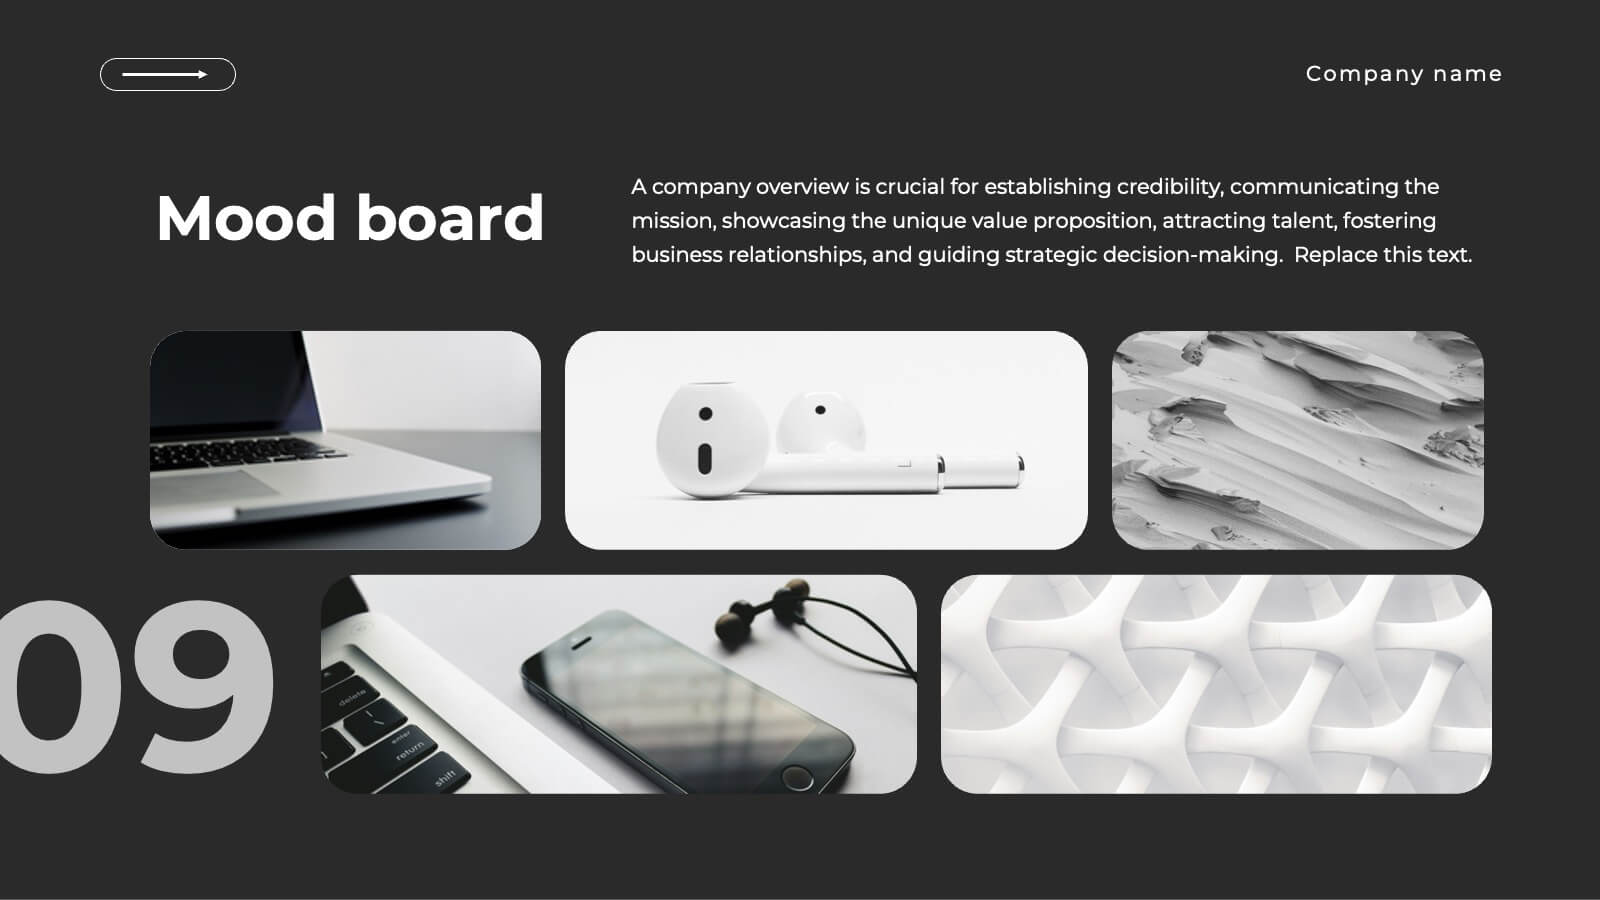
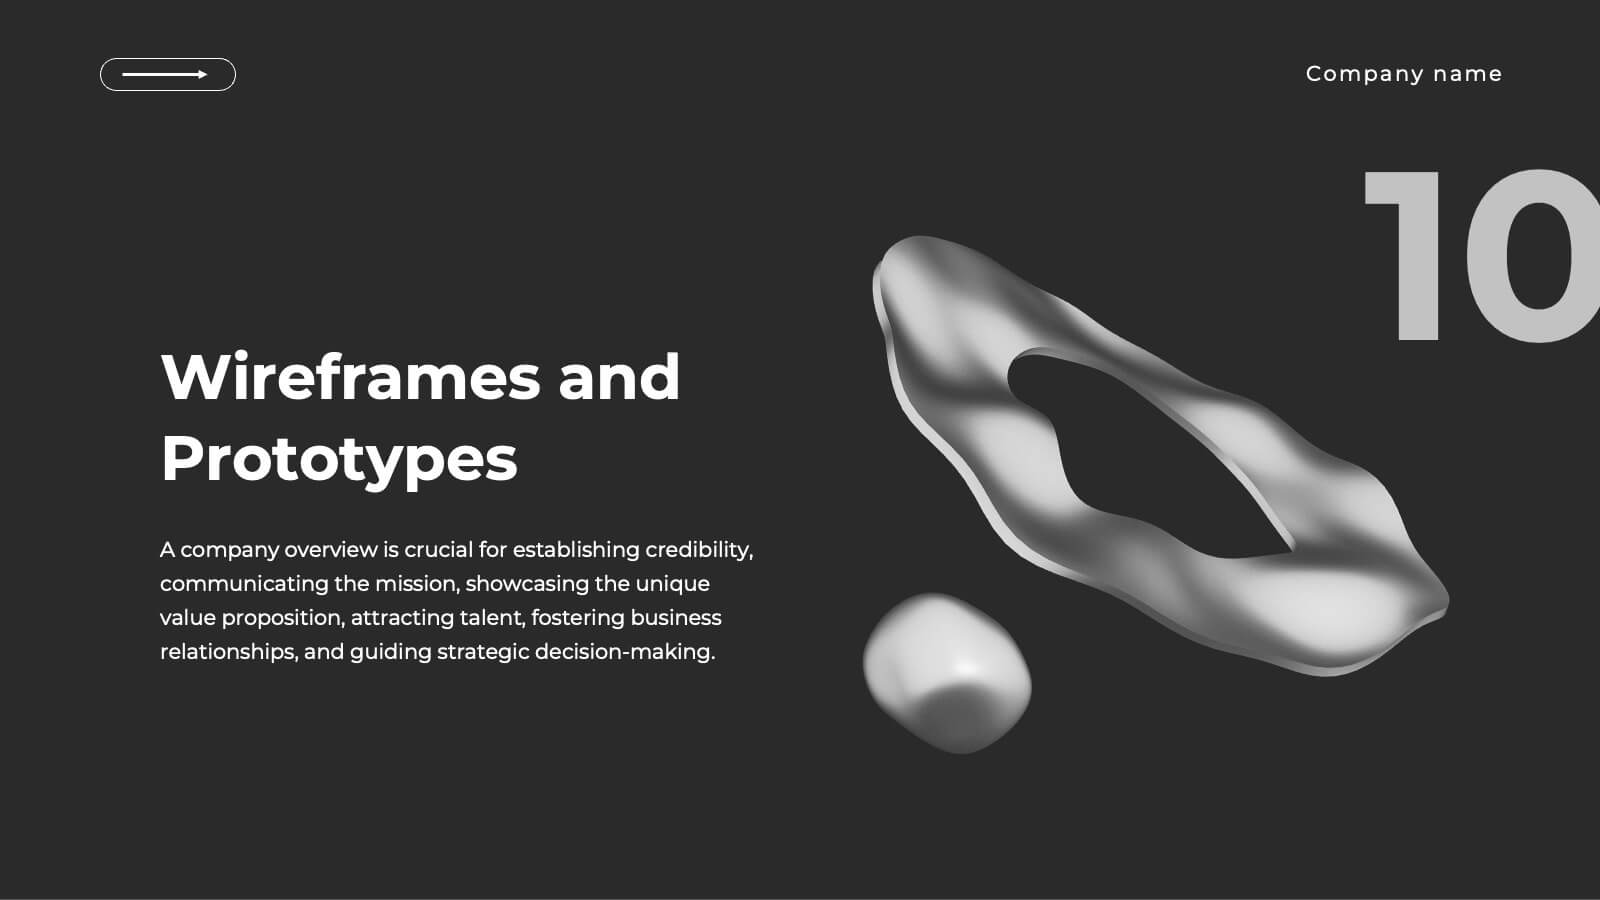
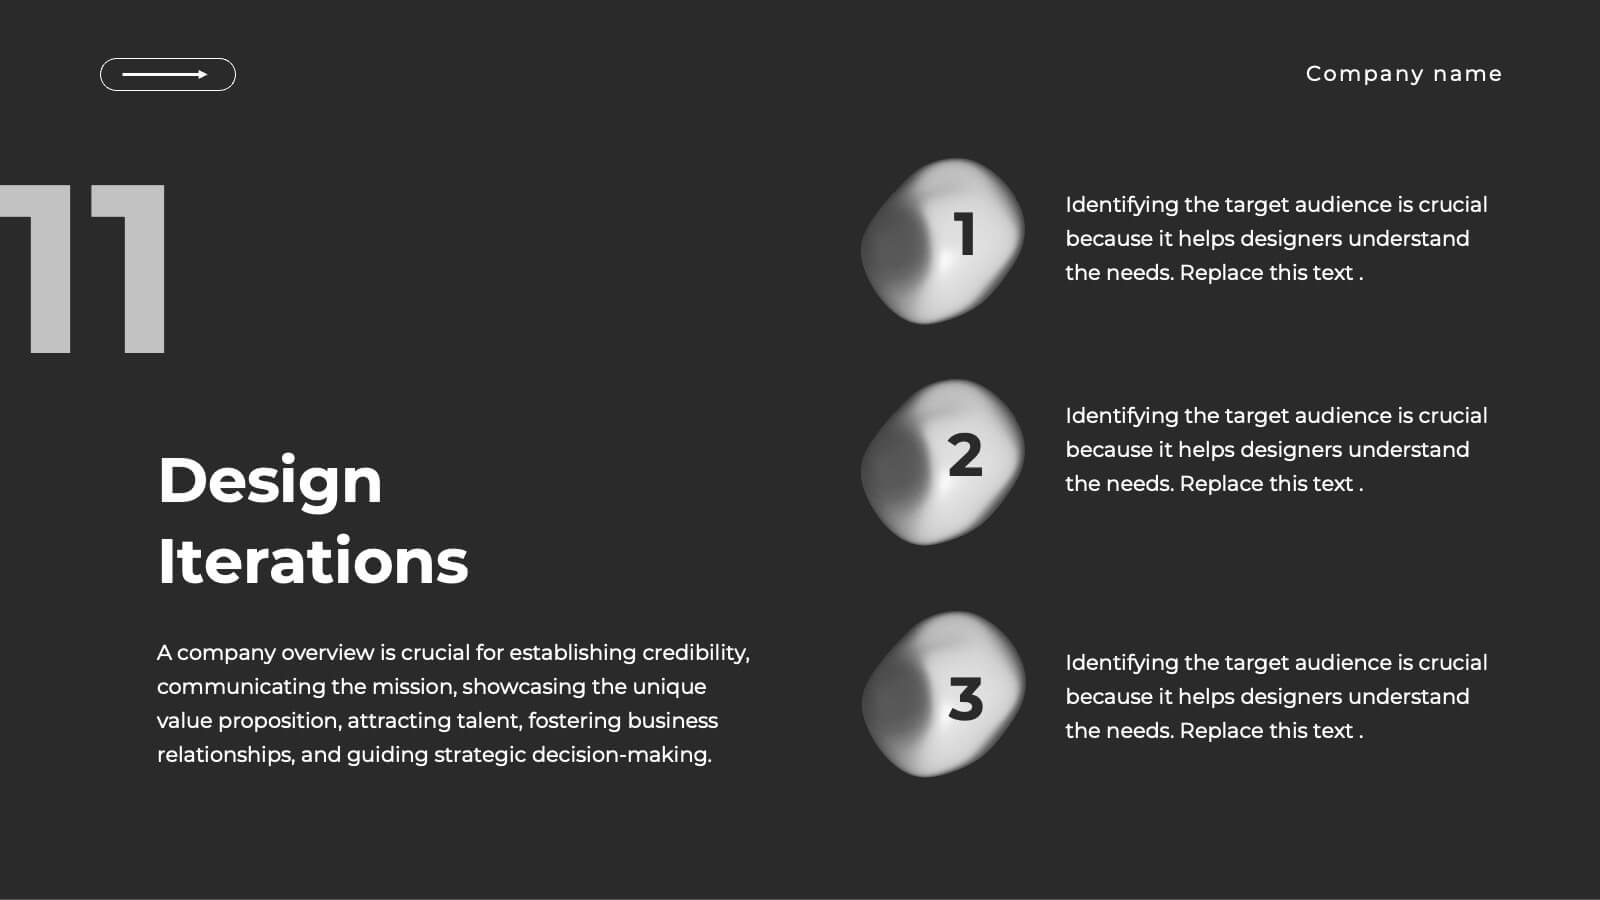
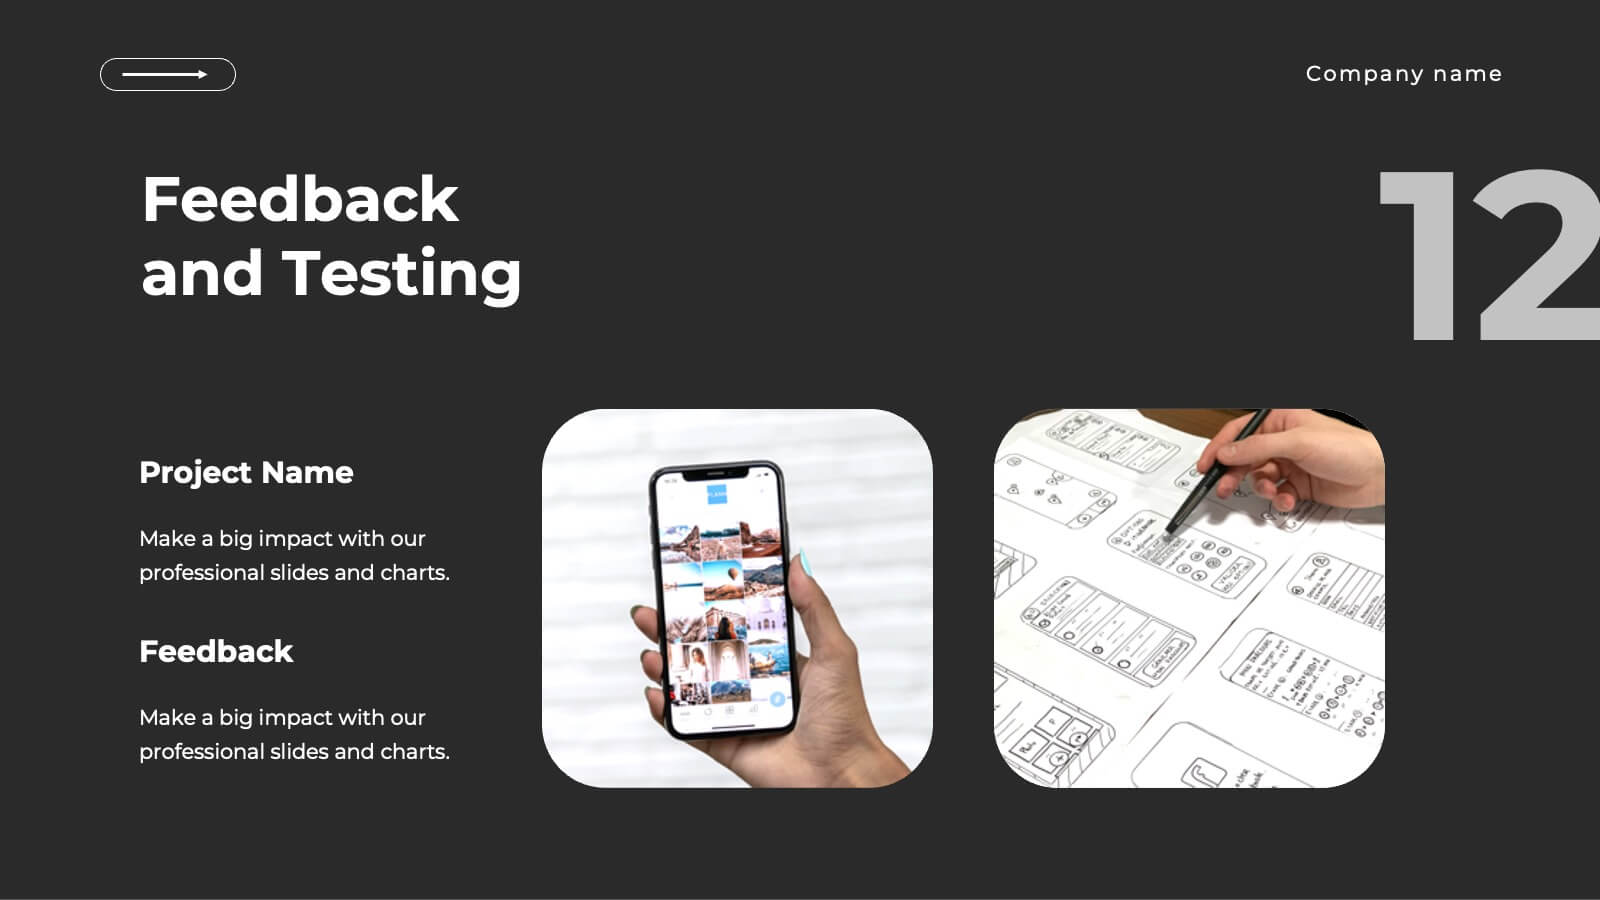
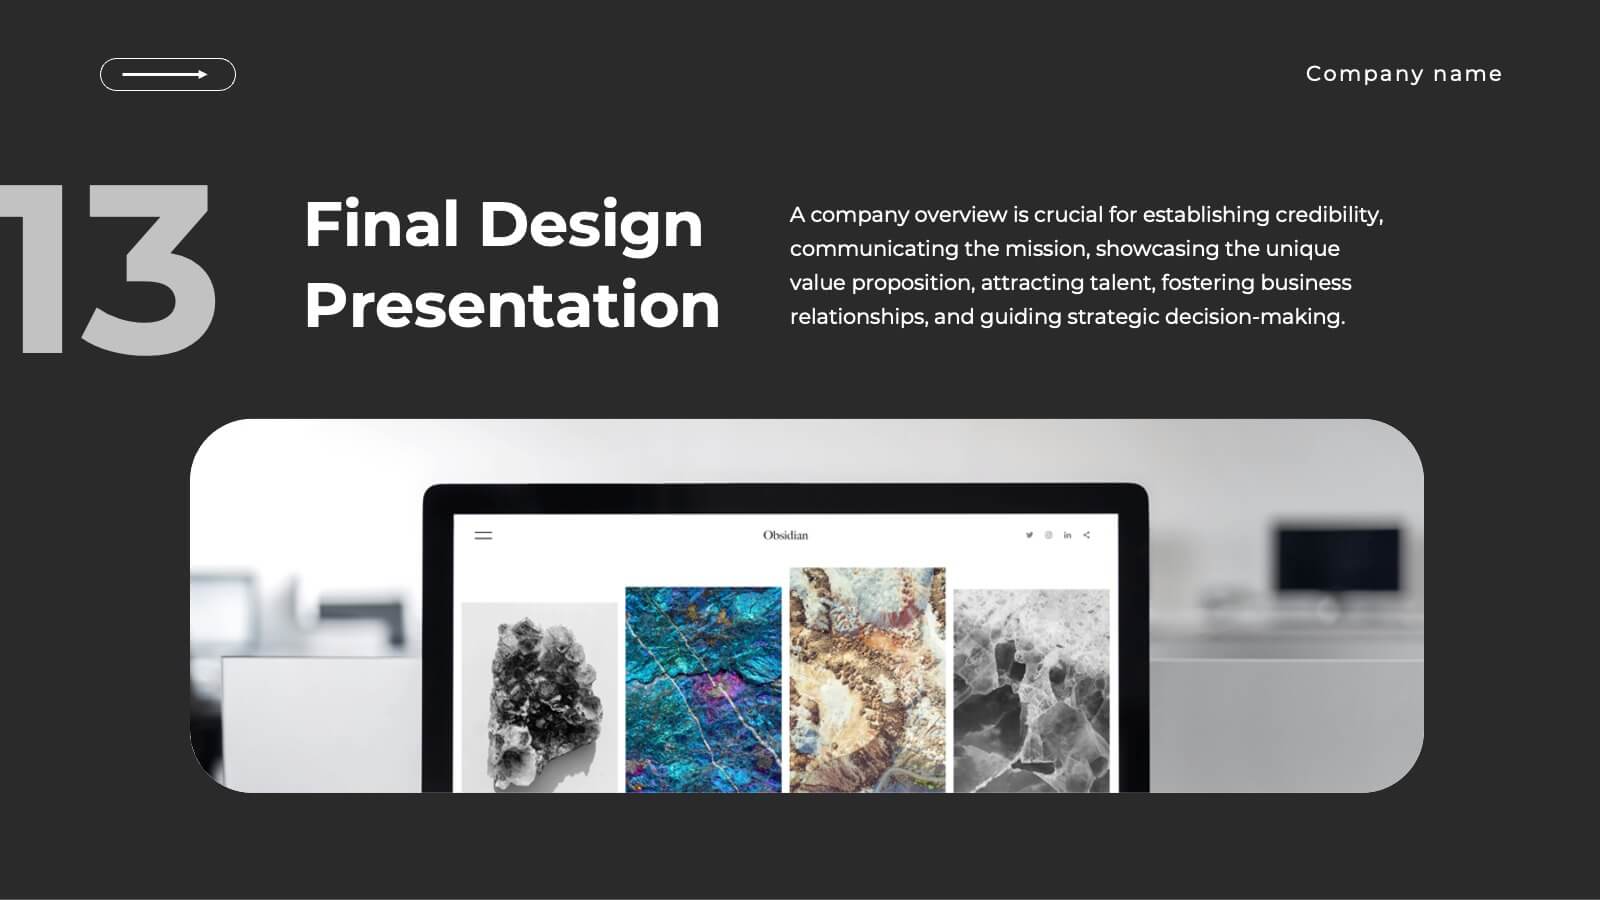
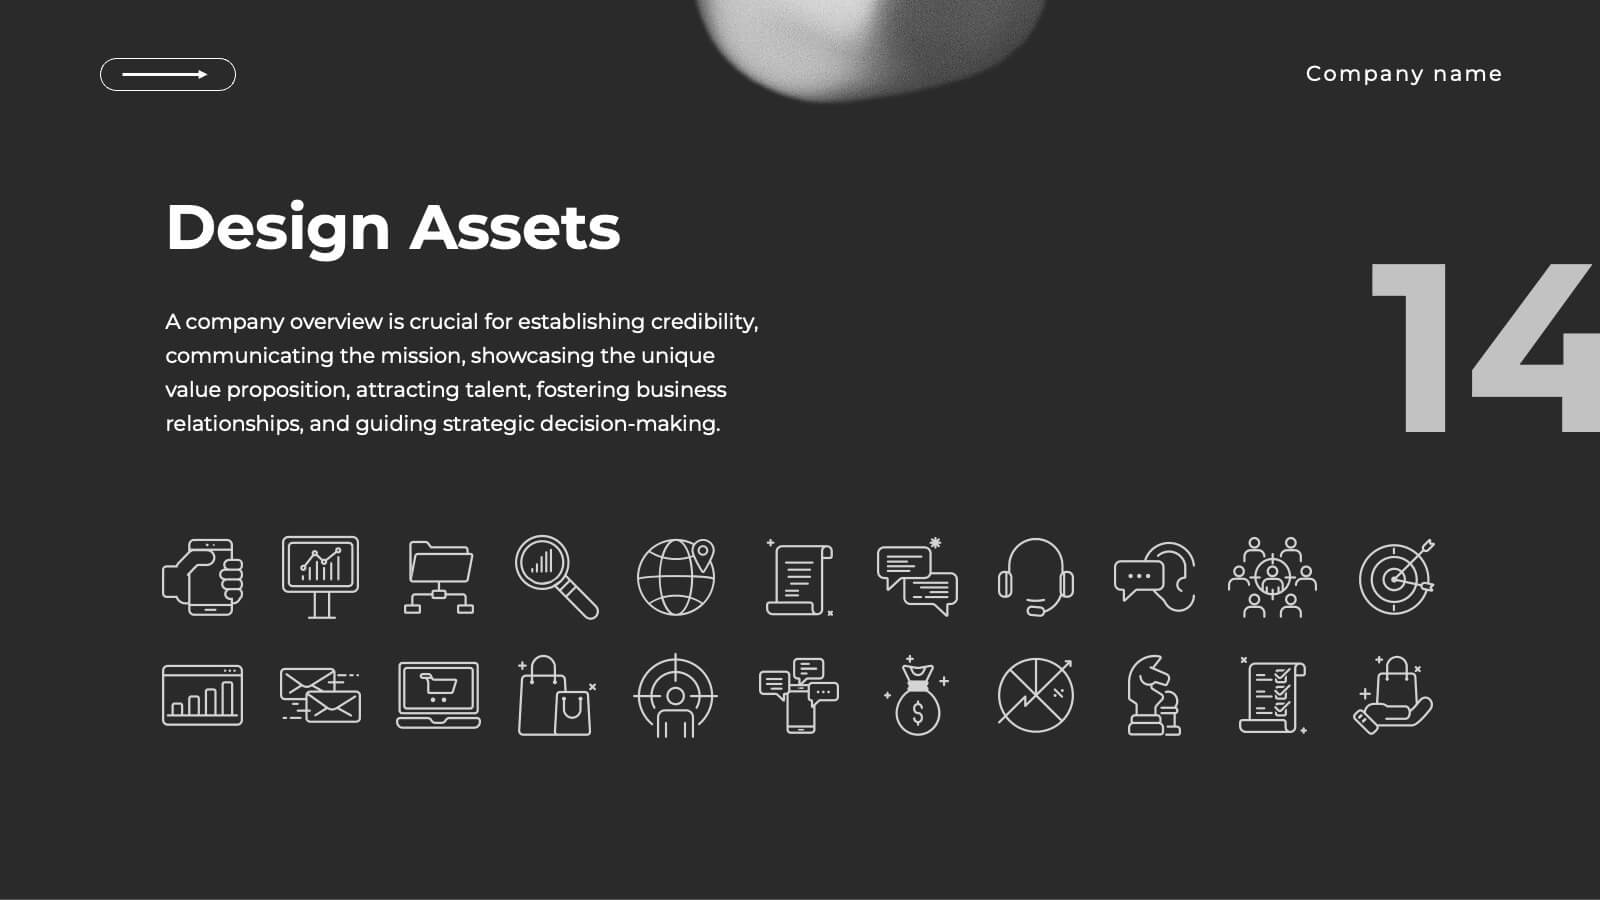
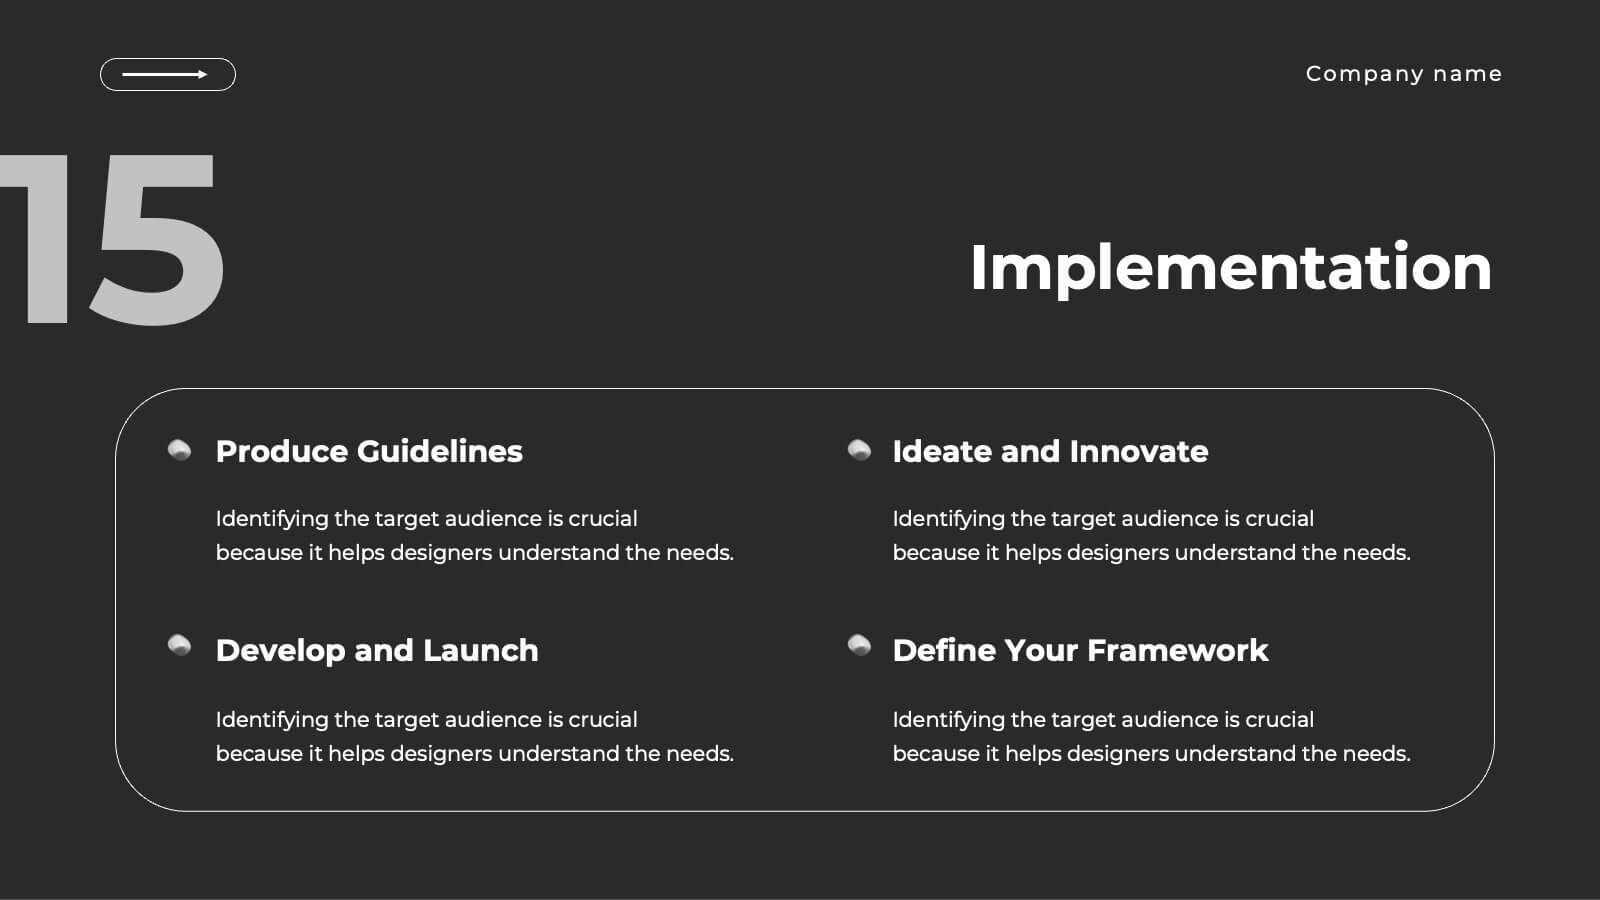
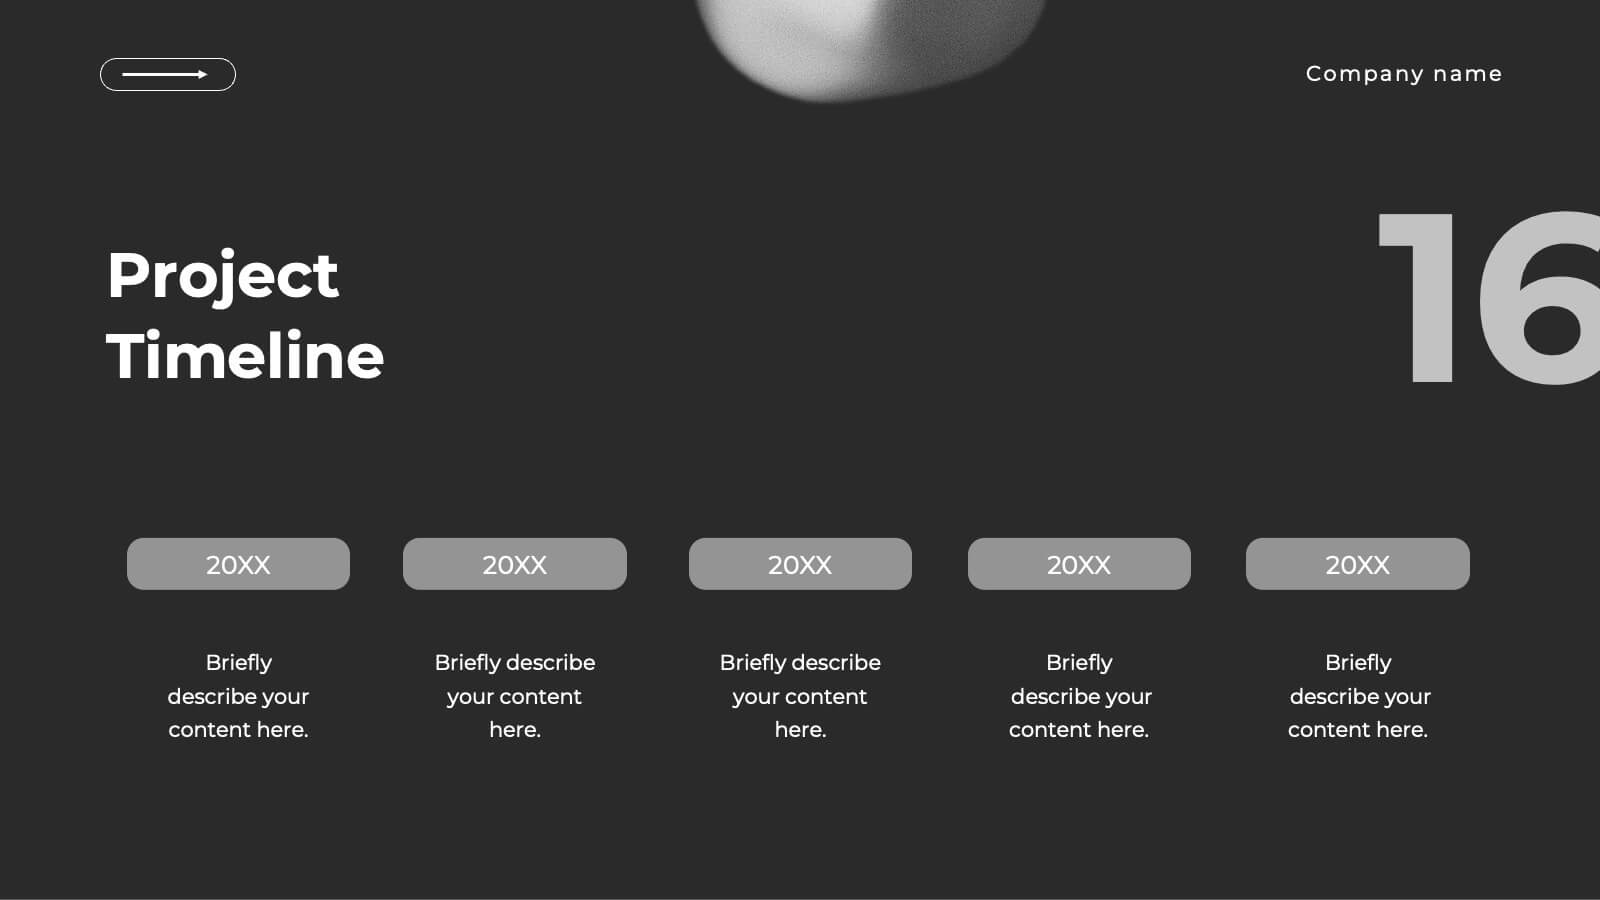
Realm UX UI Design Pitch Deck Presentation
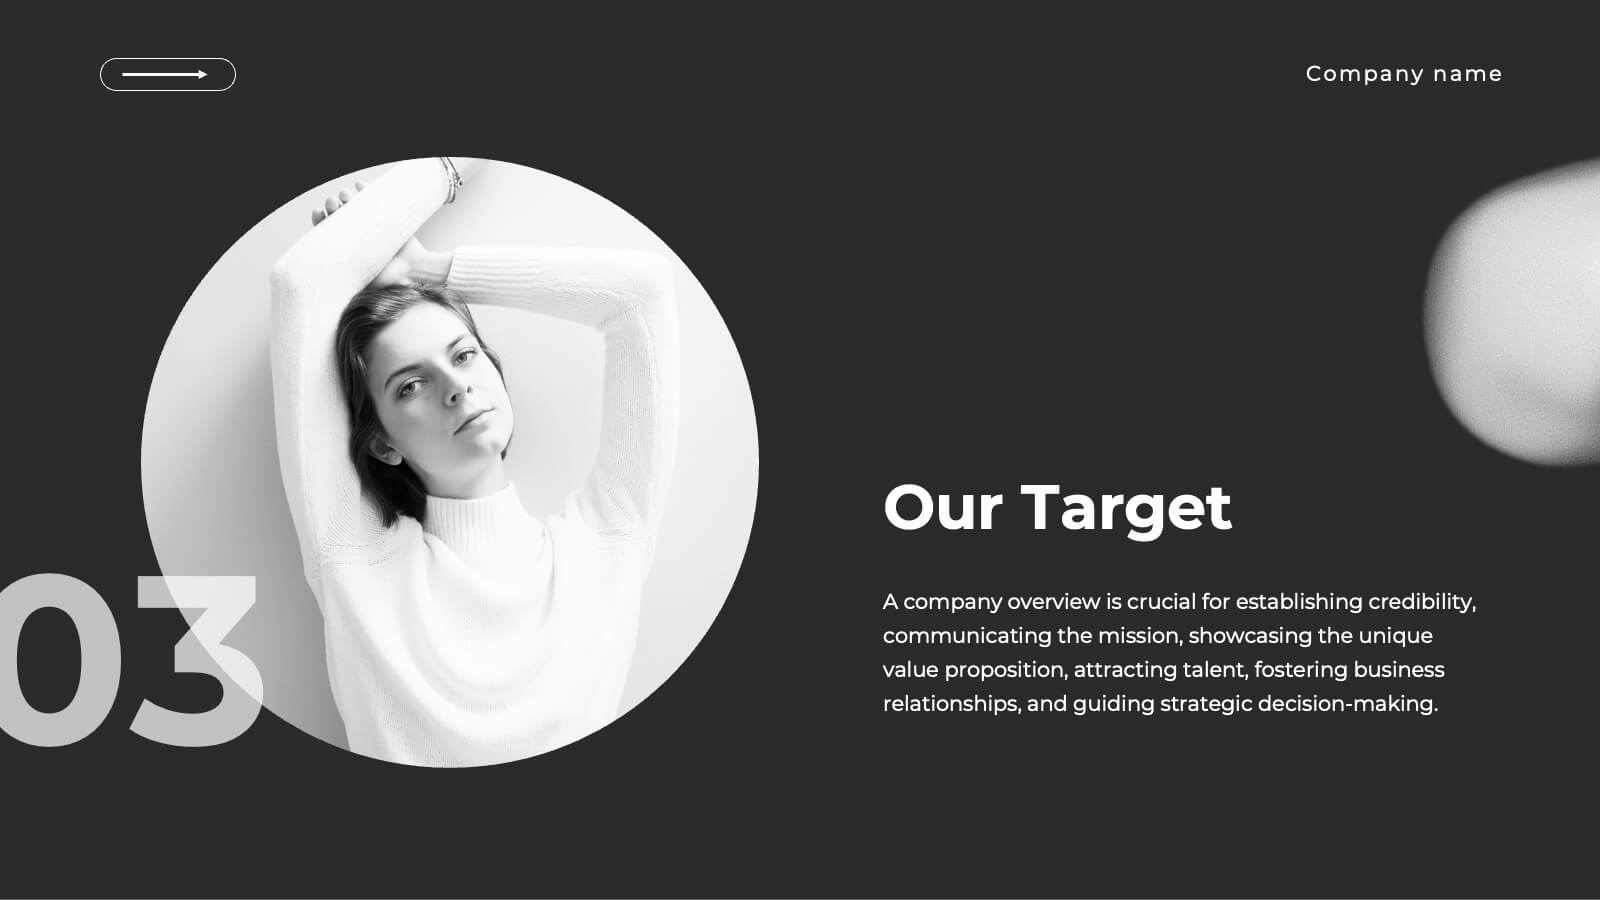
Present your UX/UI design process with this sleek and modern design template! It covers everything from concept development to wireframes, prototypes, design iterations, and final design presentation. Fully customizable and compatible with PowerPoint, Keynote, and Google Slides, it’s perfect for design teams and professionals looking to showcase their creative process effectively.


26 slides
Dayne Presentation Template
This beautiful and professional Wedding Cake Template Dayne is the perfect template to boost your business with impressive wedding cake portfolio. Dayne is a great template for showing off bakers, who are sharing about wedding cakes. It also can be used for other themes, as well as personal or business. The color scheme works well with this theme. Pictures and charts are also made for easy editing as well as easy readability. The design is clean and professional looking, so clients feel comfortable and excited about their upcoming events or products. Look no further this is the one for you!


22 slides
Muse UX Case Study Presentation
Deliver compelling UX case studies with a sleek presentation template designed to highlight your design journey and results. Ideal for showcasing your user-centered approach, it includes dedicated slides for project overview, user research, personas, journey mapping, wireframes, prototyping, and user testing. Clearly communicate your design principles and decision-making processes with visual design elements and brand guidelines. With specific sections for feedback, accessibility considerations, and project outcomes, this template ensures every aspect of your UX process is captured in a structured and visually engaging manner. Whether you're presenting to clients, stakeholders, or design teams, this template is fully editable and compatible with PowerPoint, Google Slides, and Keynote. Its modern design and professional layout provide an effortless way to convey the value of your UX work, making a lasting impact on your audience. Tailor it to your brand, and elevate your case studies today!


22 slides
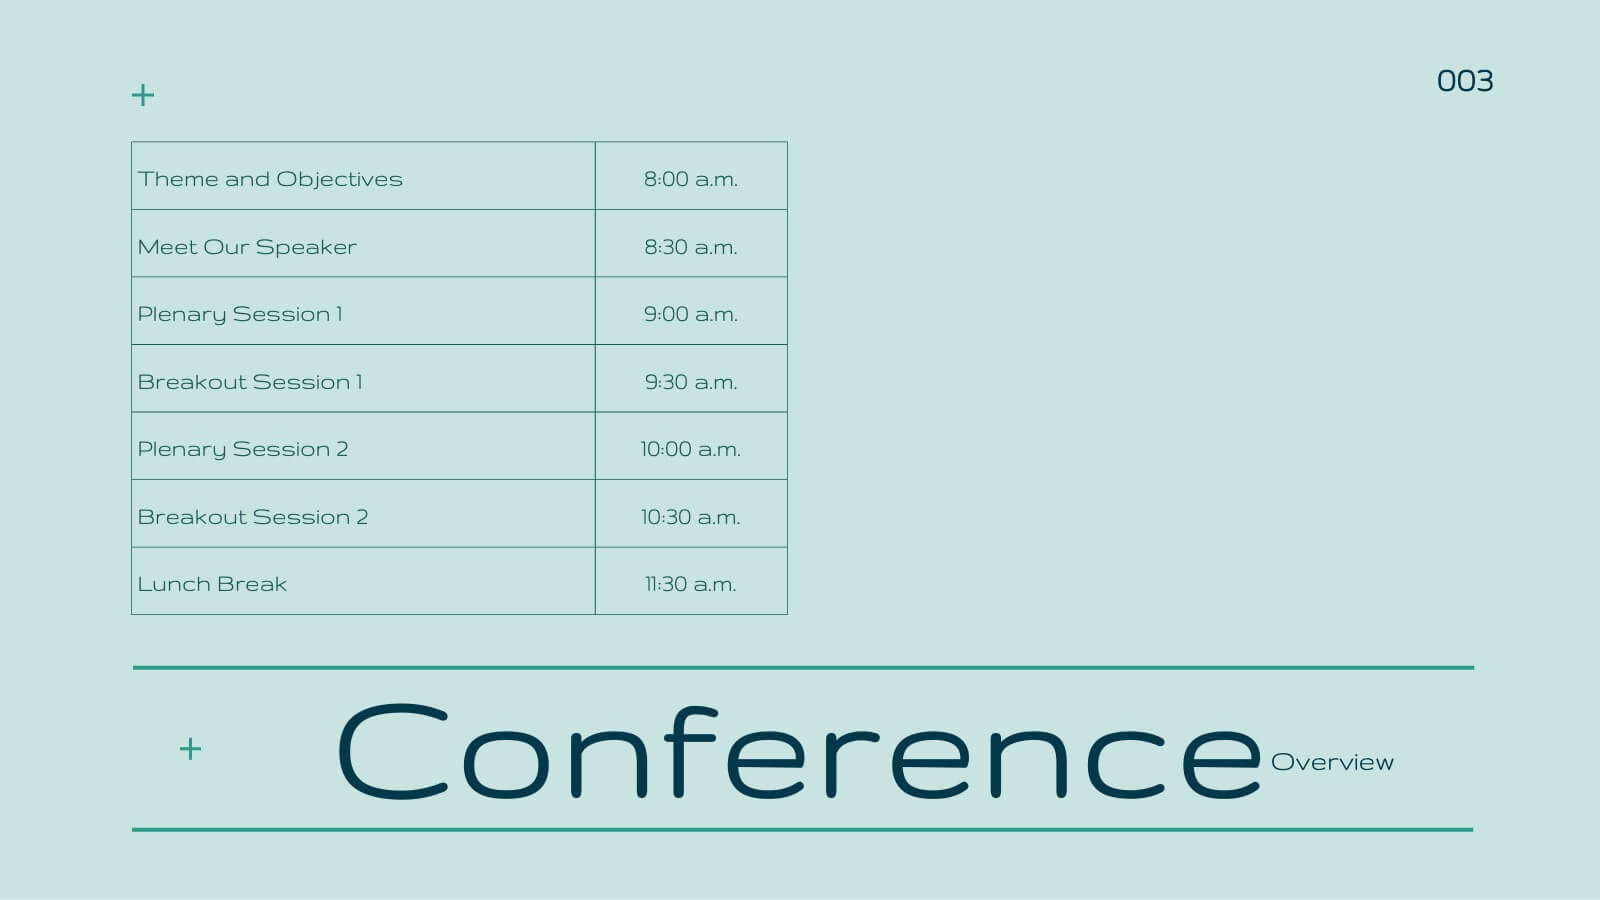
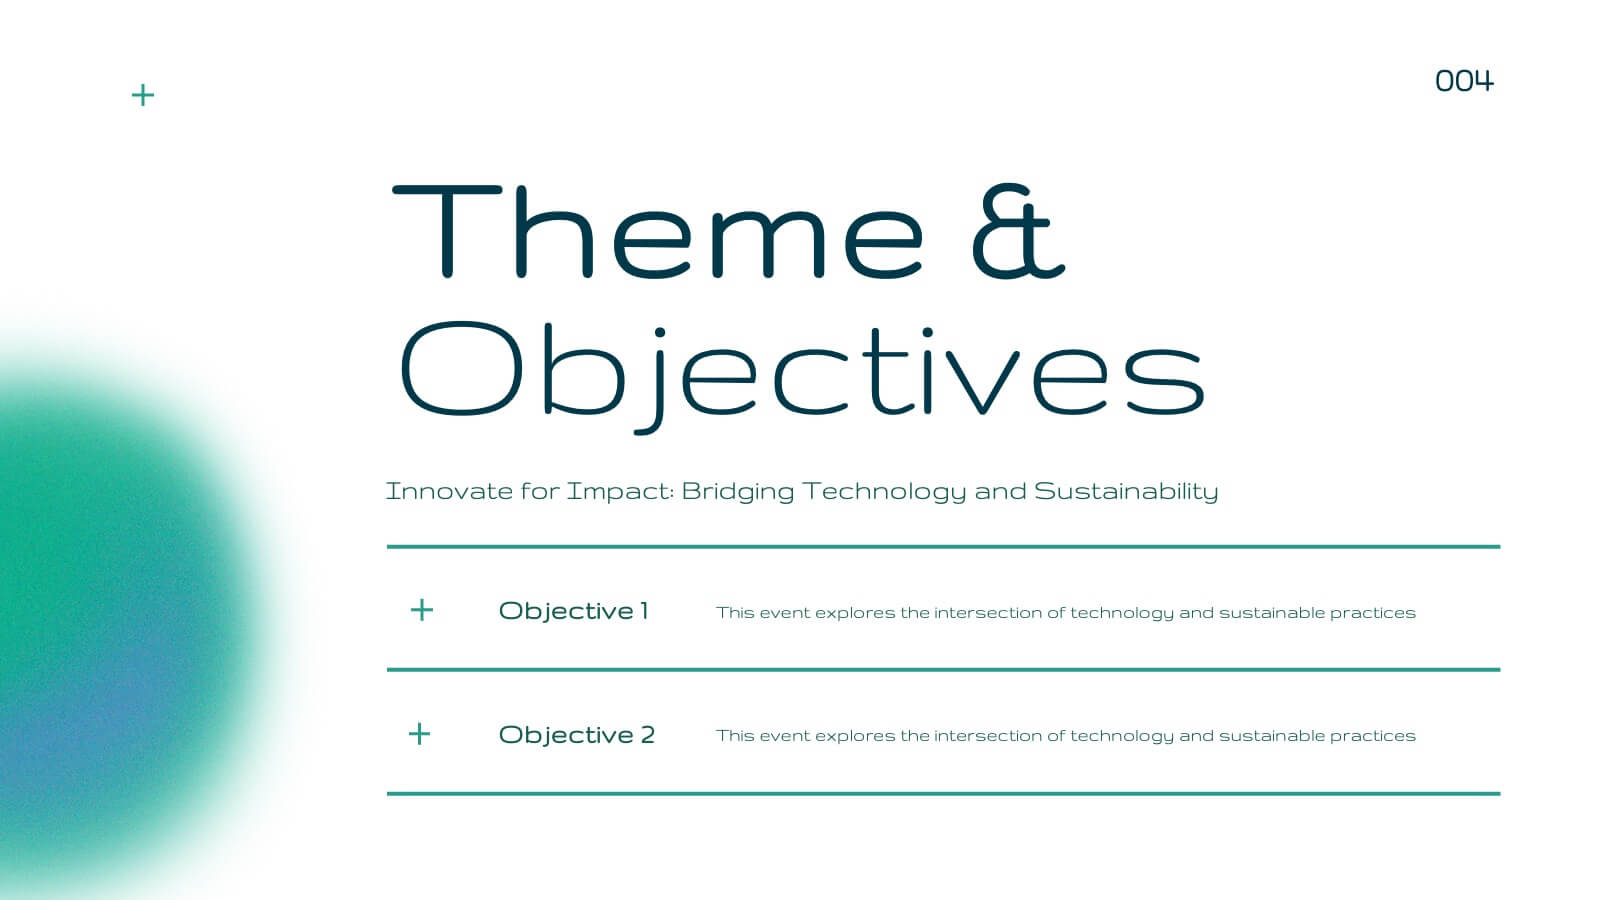
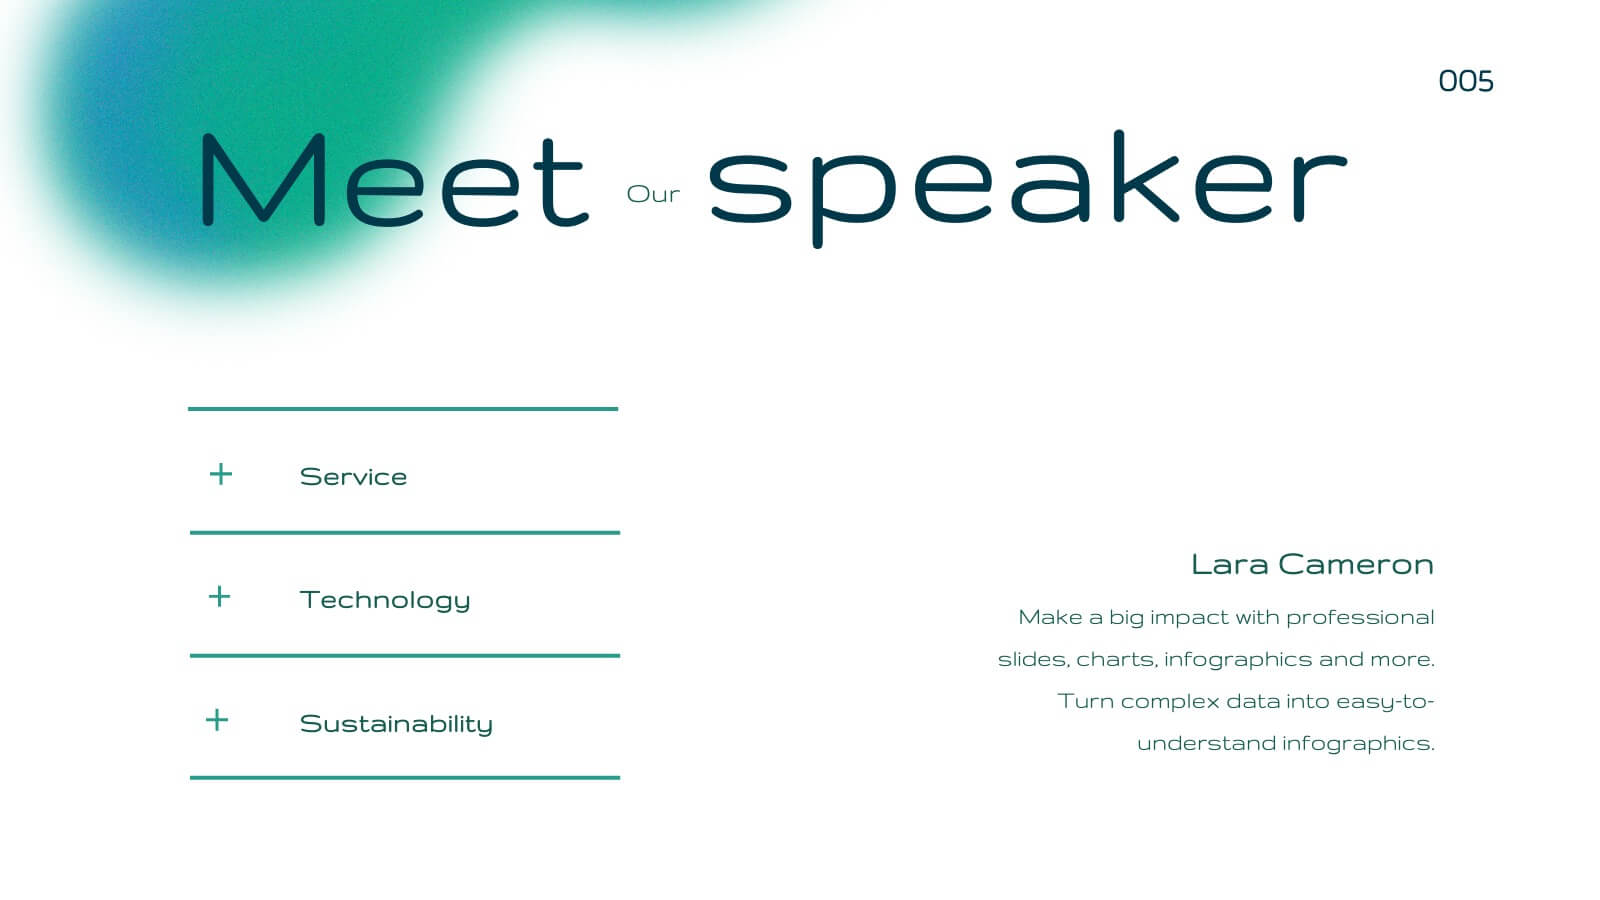
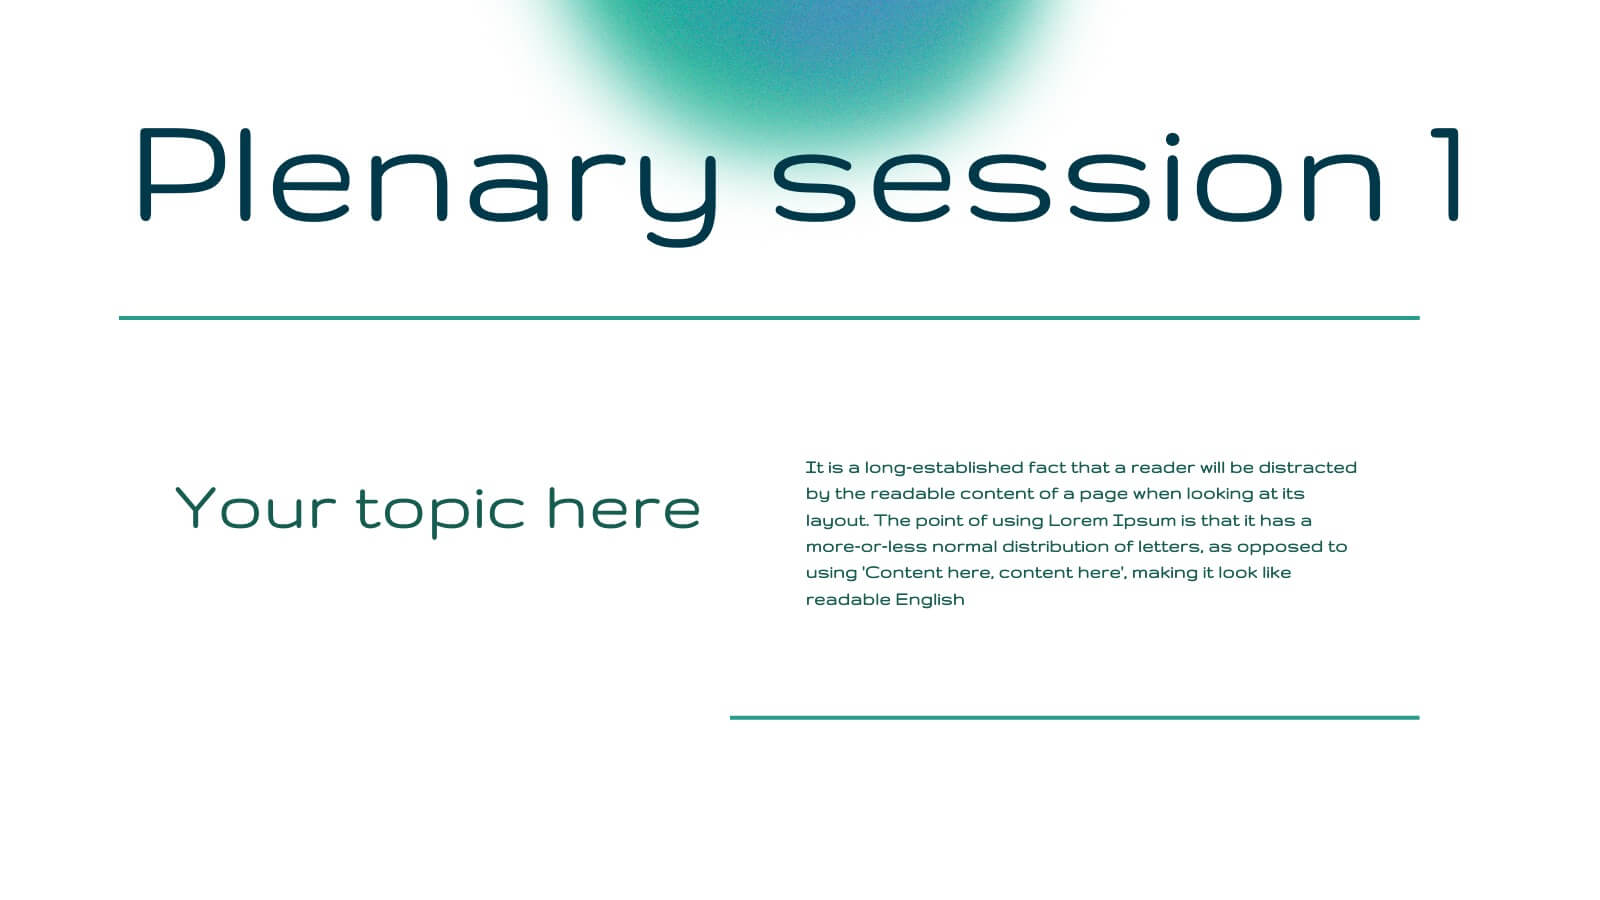
Blaze Business Operations Plan Presentation
Elevate your business presentations with this elegant, modern template designed for comprehensive business operations. Perfect for covering themes, objectives, workshops, and panel discussions, it ensures a professional and engaging delivery. The clean design and structured layout enhance clarity and impact. Compatible with PowerPoint, Keynote, and Google Slides, it’s versatile for any platform.


20 slides
Venus Design Proposal Presentation
Present your design proposal with confidence using this sleek and professional layout! It includes everything from problem statements and proposed solutions to budget breakdowns, milestones, and team expertise, ensuring every detail is covered. Ideal for client presentations or internal project pitches, this template is fully compatible with PowerPoint, Keynote, and Google Slides.


6 slides
Financial Trading and Stock Performance Presentation
Explore market dynamics with the "Financial Trading and Stock Performance" presentation template. Perfect for finance professionals, these slides offer a visual analysis of stock trends over the years. Featuring bar graphs and gauge charts for annual comparison, it's designed for impactful presentations. These templates are compatible with PowerPoint, Keynote, and Google Slides, enhancing their accessibility across different platforms.


4 slides
Root Cause Problem Solving Presentation
Uncover insights with a clear, visual approach that makes complex issues easy to understand and communicate. This presentation guides audiences through identifying underlying problems, mapping causes, and highlighting solutions in a structured, memorable way. Clean icons and tree-based visuals keep your message engaging. Fully compatible with PowerPoint, Keynote, and Google Slides.