


Features
- 5 Unique slides
- Fully editable and easy to edit in Microsoft Powerpoint, Keynote and Google Slides
- 16:9 widescreen layout
- Clean and professional designs
- Export to JPG, PDF or send by email


Do you have any questions?
Recommend


7 slides
Change Management Presentation Template
Our Change Management Infographic is designed to visually present your information. This infographic presentation comes with a seven page layout, all neatly arranged into a well-organized structure, which shows the steps of a change management process. This can be used for any kind of presentation purpose, education, employees, new product launch or even for training executives, managers and supervisors. With this template the variety of elements included are to help you create your own personalized content, you can make your own presentations for any business or industry in just minutes!


5 slides
Global Warming Crisis Infographics
Global Warming refers to the long-term increase in the Earth's average surface temperature, primarily caused by the buildup of greenhouse gases in the atmosphere. This vertical infographics includes information about the effects of climate change on the planet. There are designed sections where you can feature data on rising temperatures, sea levels, and extreme weather events. These infographics feature unique designs that incorporate colors and images that convey the severity and urgency of this crisis. The goal of this template is to raise awareness about the need to address the global warming crisis and mitigate the impact of climate change.


5 slides
Medical Anatomy Chart Slide Presentation
Present body systems or organ-related topics with this anatomy chart slide. Designed with pinpoint callouts linked to a human silhouette, it helps explain up to four body parts or functions. Ideal for health, biology, or patient education presentations. Fully editable in PowerPoint, Keynote, or Google Slides for clean, visual storytelling.


8 slides
Customer Market Segmentation Analysis
Visualize your audience insights with precision using the Customer Market Segmentation Analysis Presentation. This slide features a sleek, layered funnel design with percentage bars and arrow pointers—ideal for illustrating demographic splits, buyer behavior, or psychographic segments. With space for four data-driven categories and custom labels, this template is perfect for marketers, analysts, and product teams looking to present actionable customer data. Fully editable in PowerPoint, Keynote, and Google Slides, and easy to adapt to any color scheme or branding.


22 slides
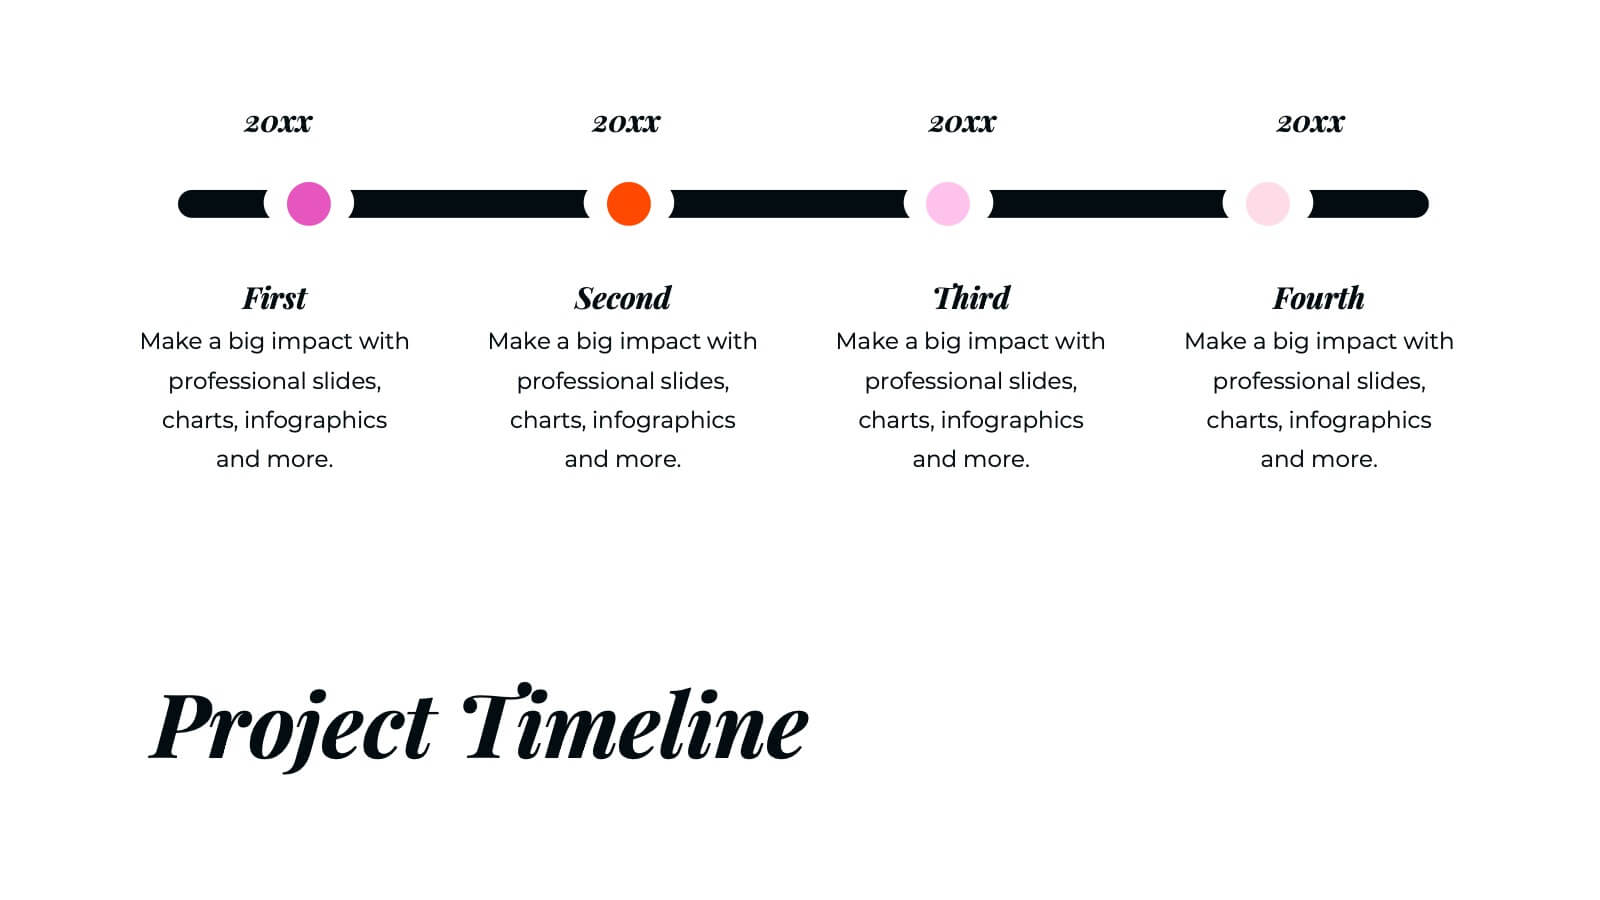
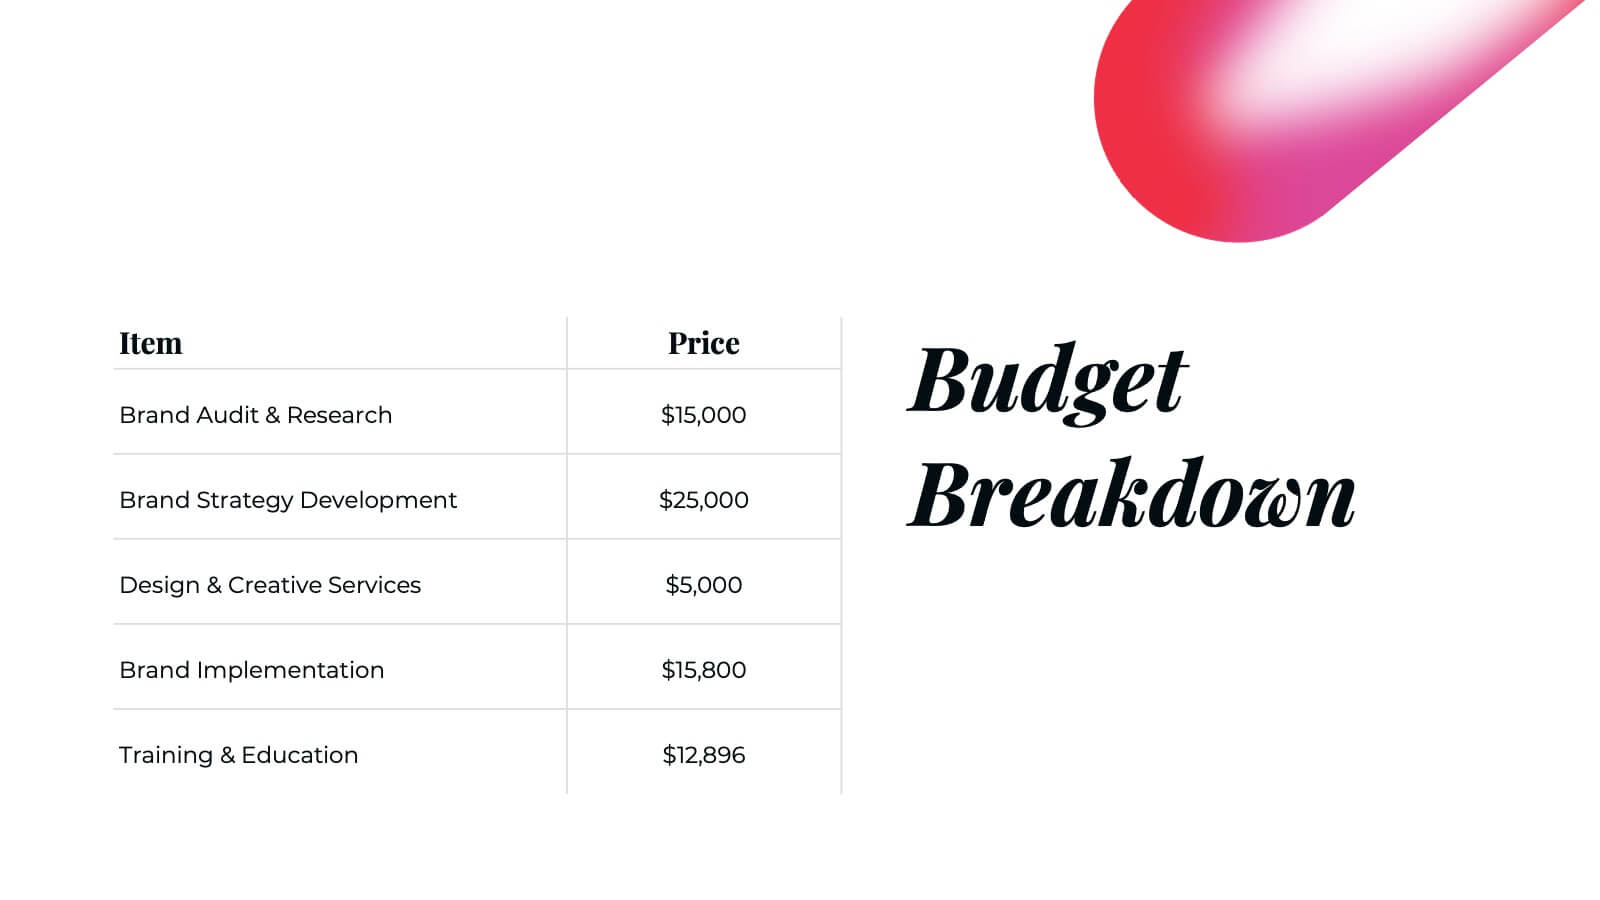
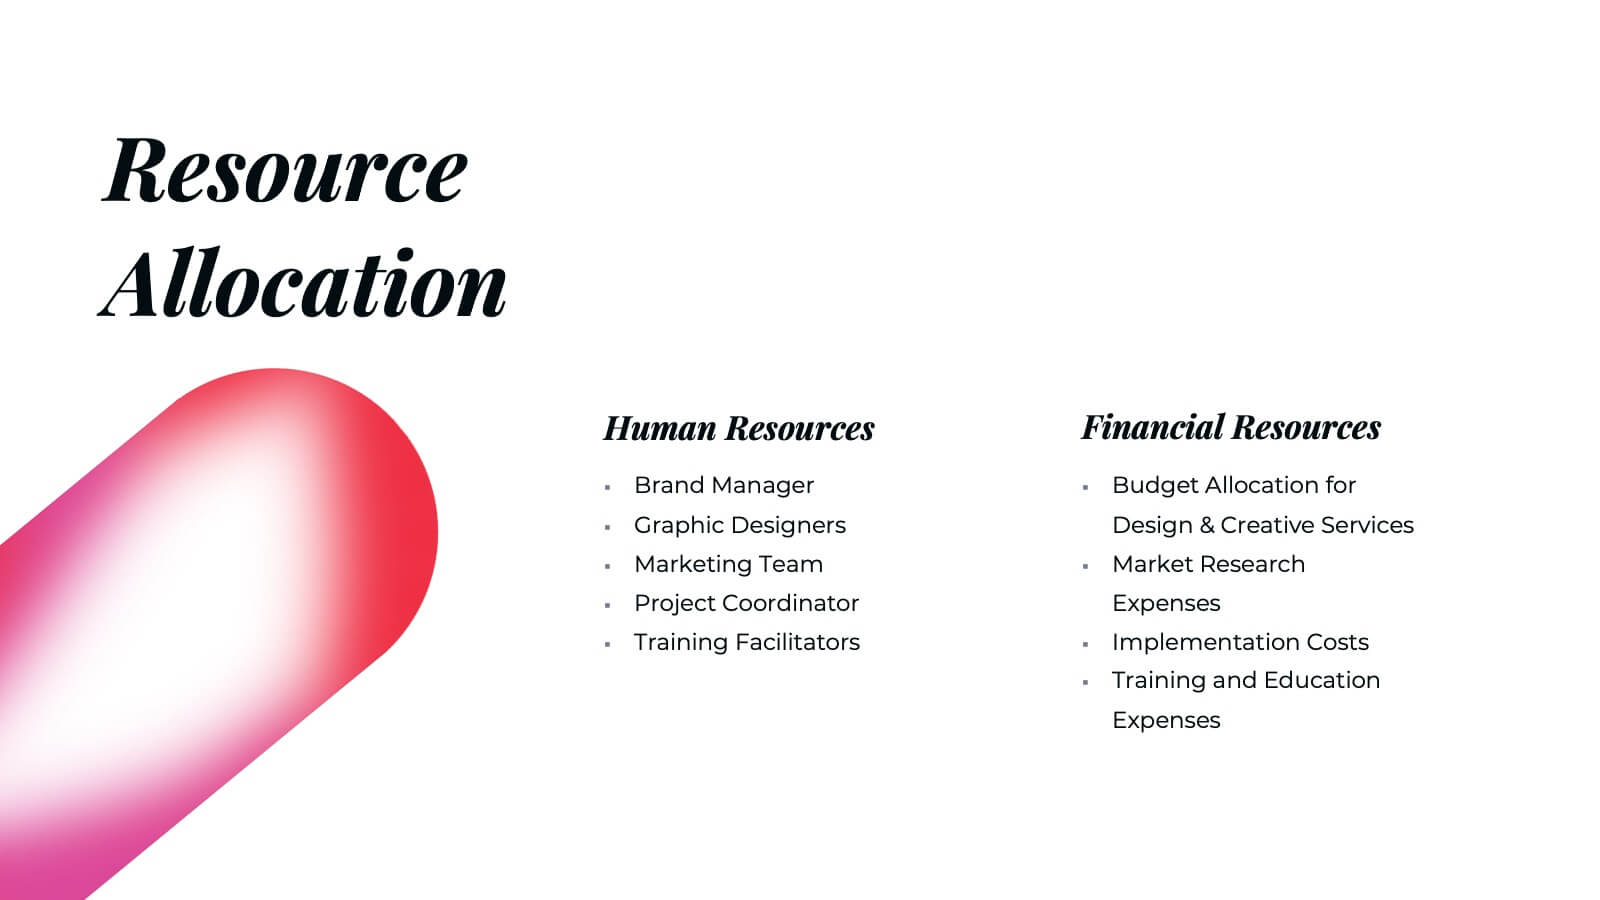
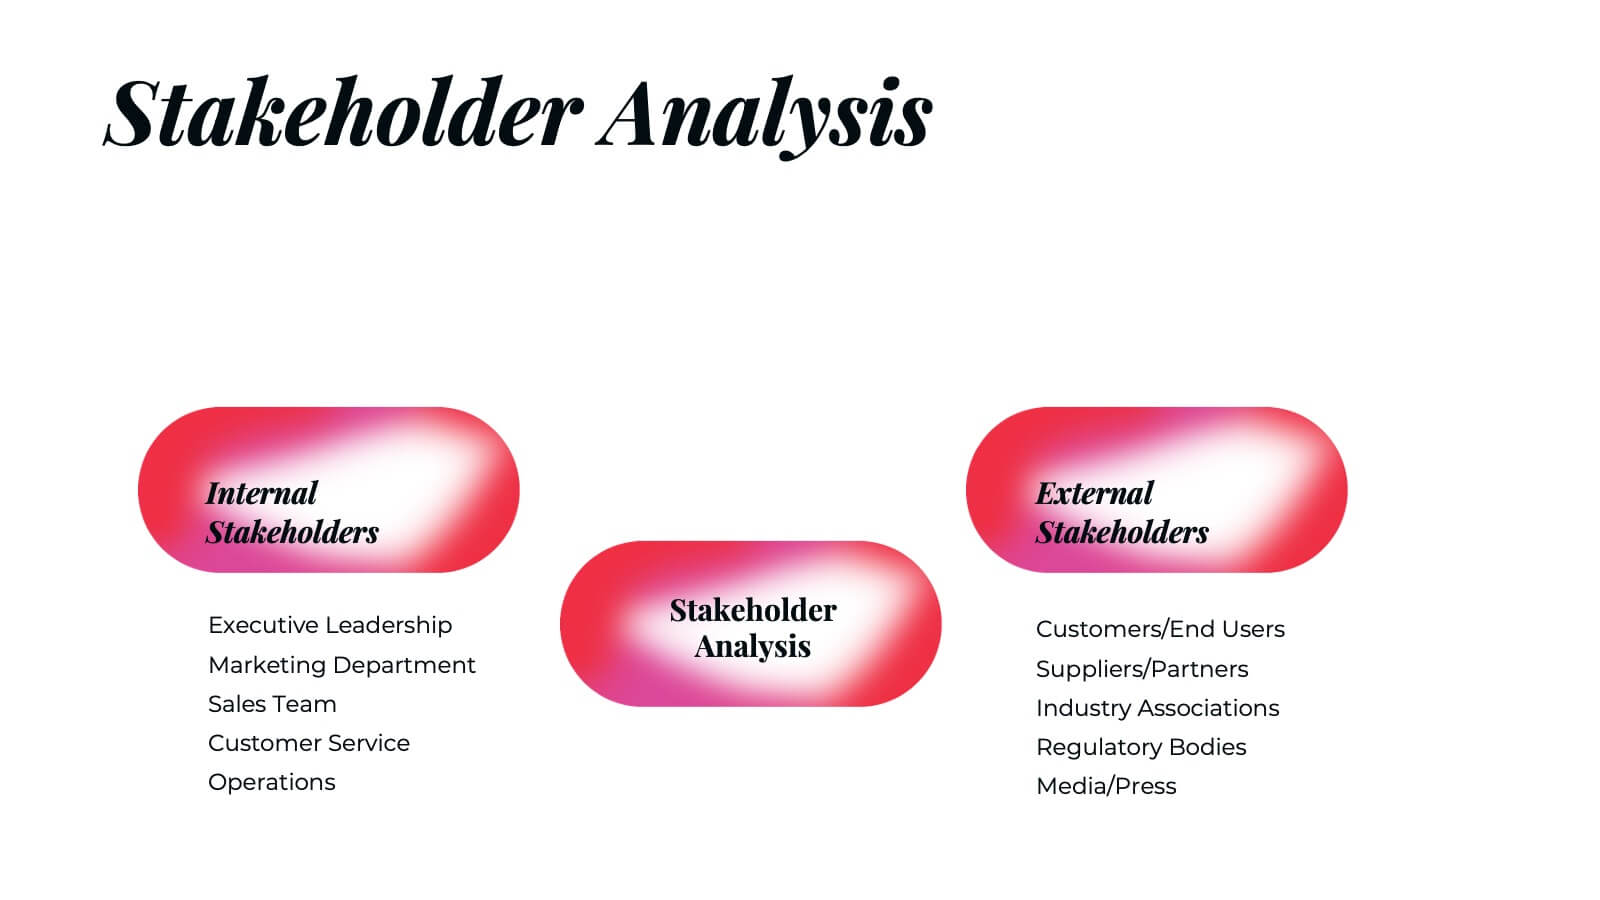
Moonstone Detailed Project Execution Plan Presentation
Create a compelling project execution plan with this vibrant and well-structured presentation template! Covering every key aspect from problem statements and objectives to risk management and quality assurance, this template provides a clear roadmap for your project. It’s perfect for organizing timelines, budget breakdowns, and stakeholder analysis. Compatible with PowerPoint, Keynote, and Google Slides for smooth presentations.


5 slides
Benefits of Good Nutrition Infographics
Good Nutrition is crucial for overall health, disease prevention, weight management, mental well-being, energy levels, and various other aspects of our physical and mental health. These vertical infographic templates can be used to present the importance and advantages of maintaining a healthy and balanced diet. These are designed to educate and inspire individuals to make informed choices about their nutrition and overall well-being. Perfect for educational presentations, nutrition workshops, wellness programs, or health-related websites, these templates provide valuable information and visual aids to promote better nutrition choices.
21 slides
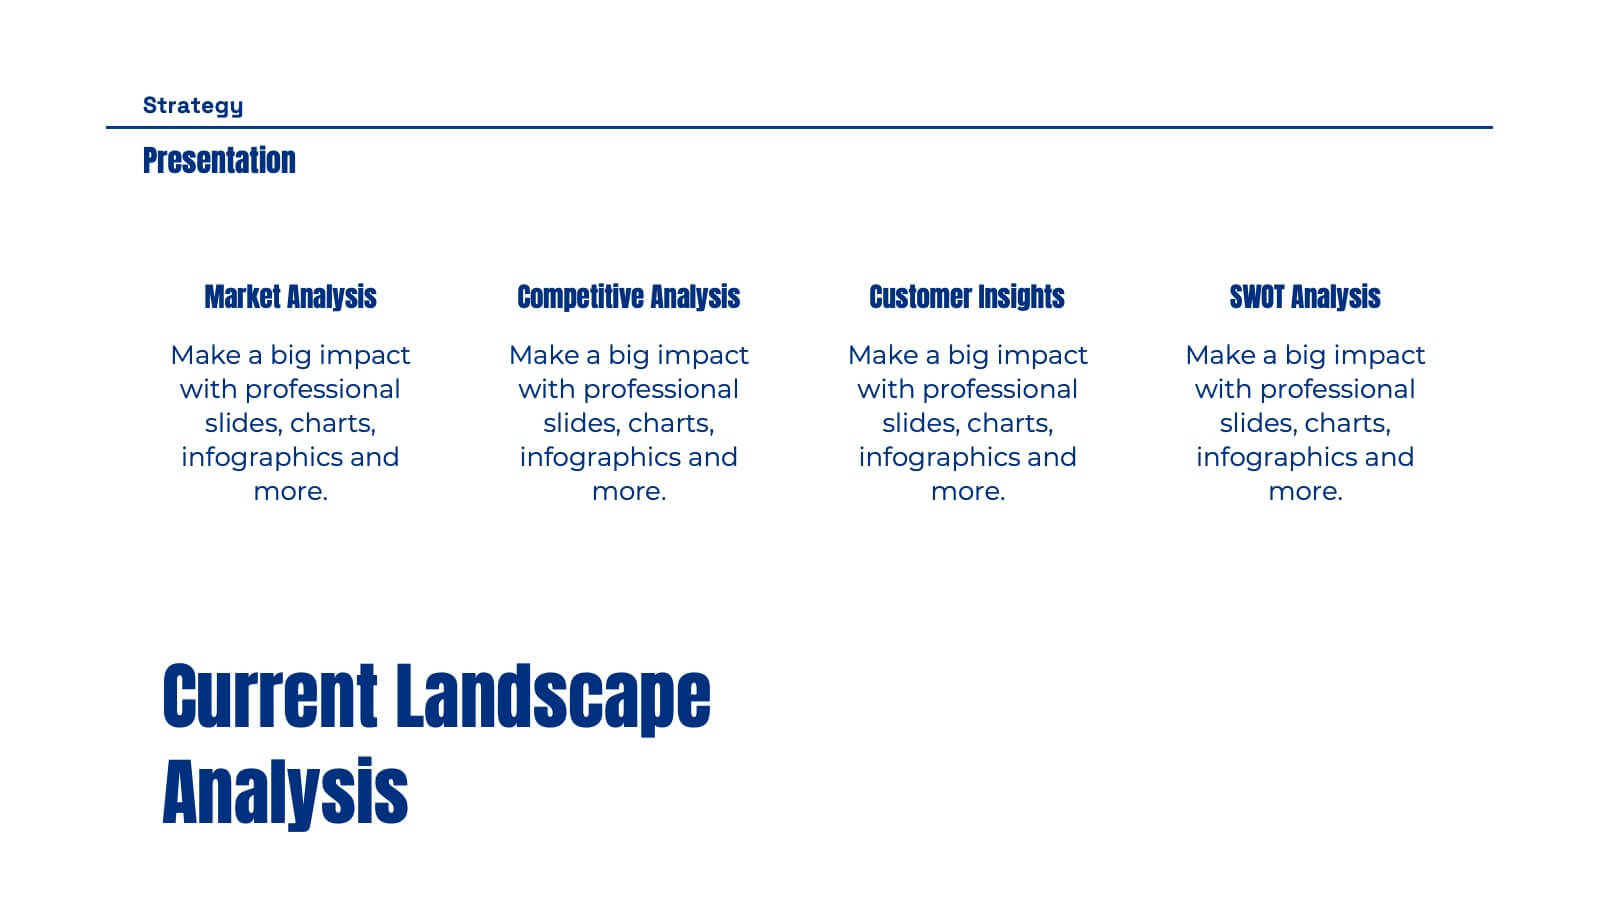
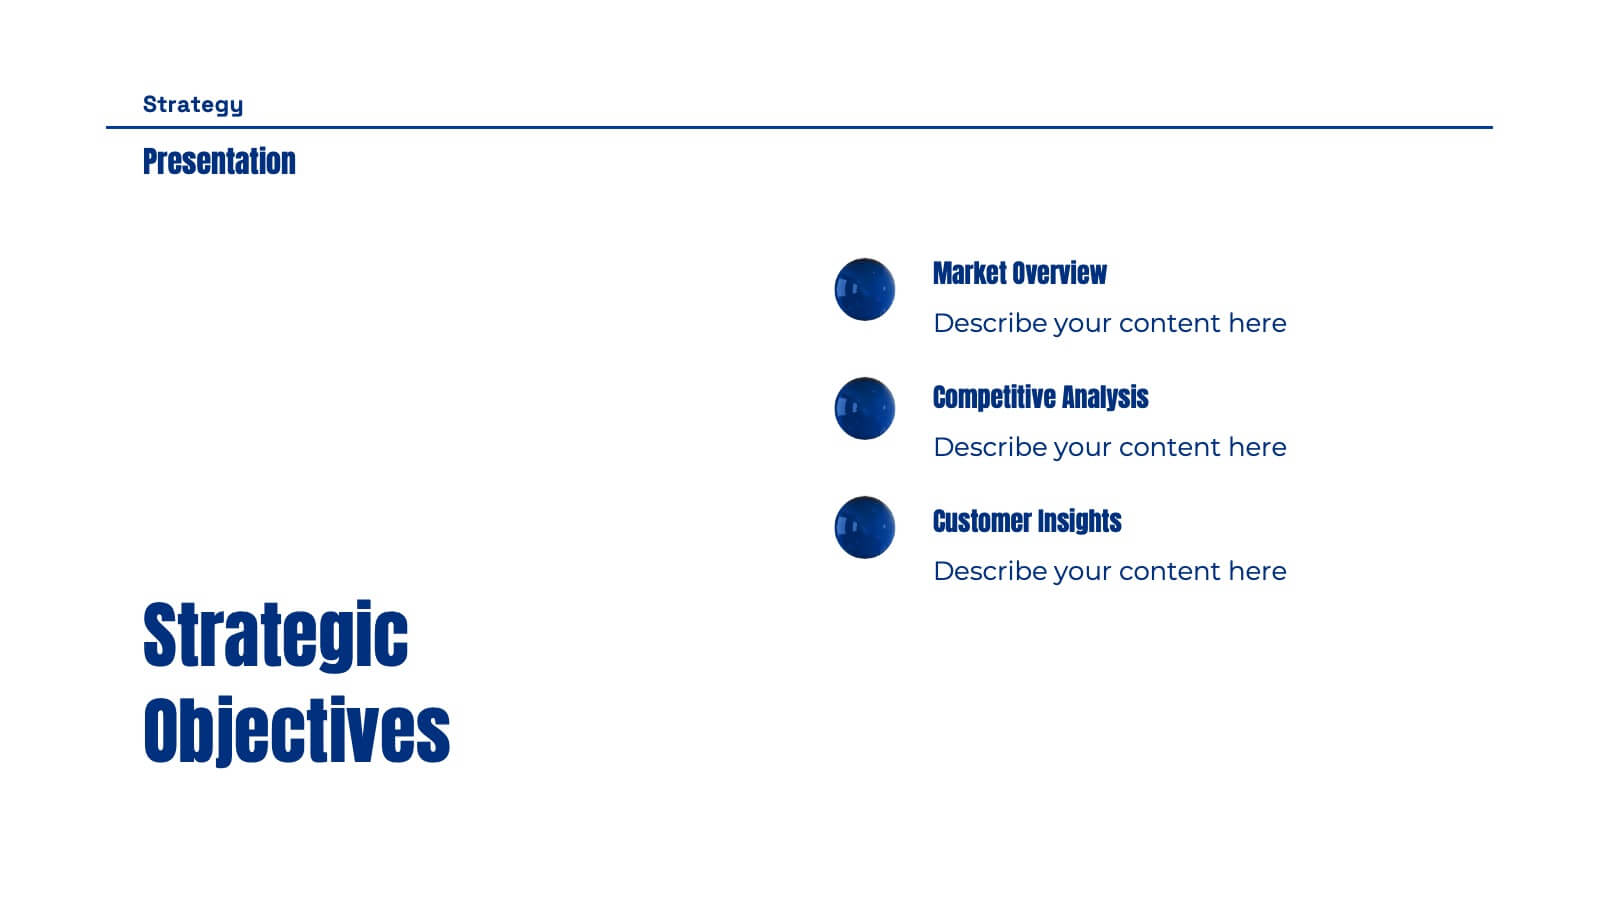
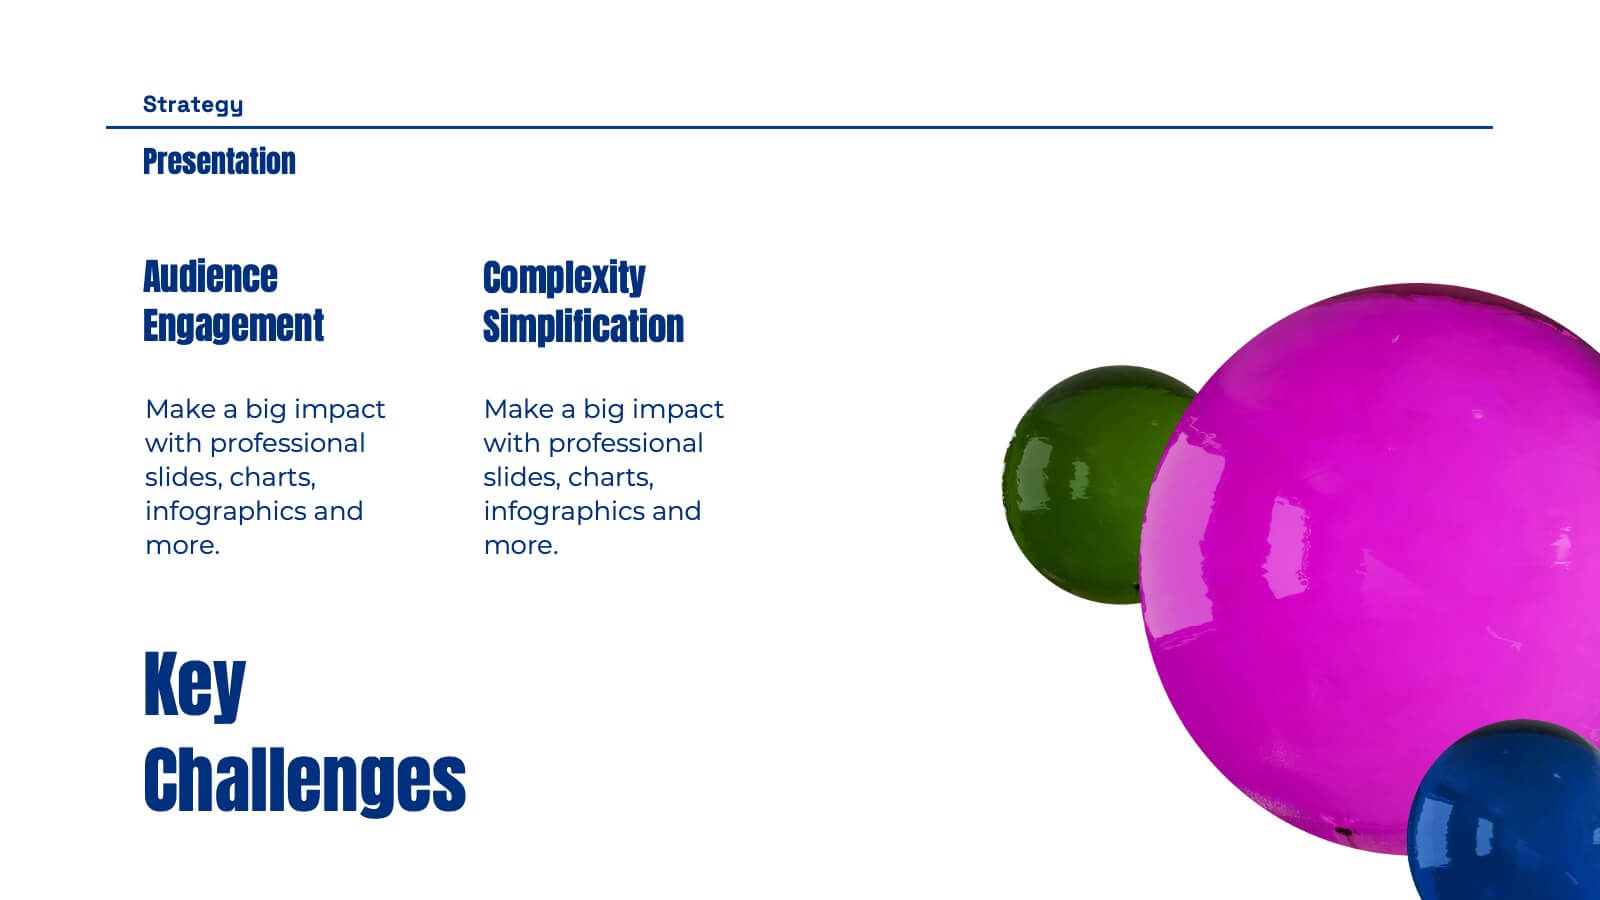
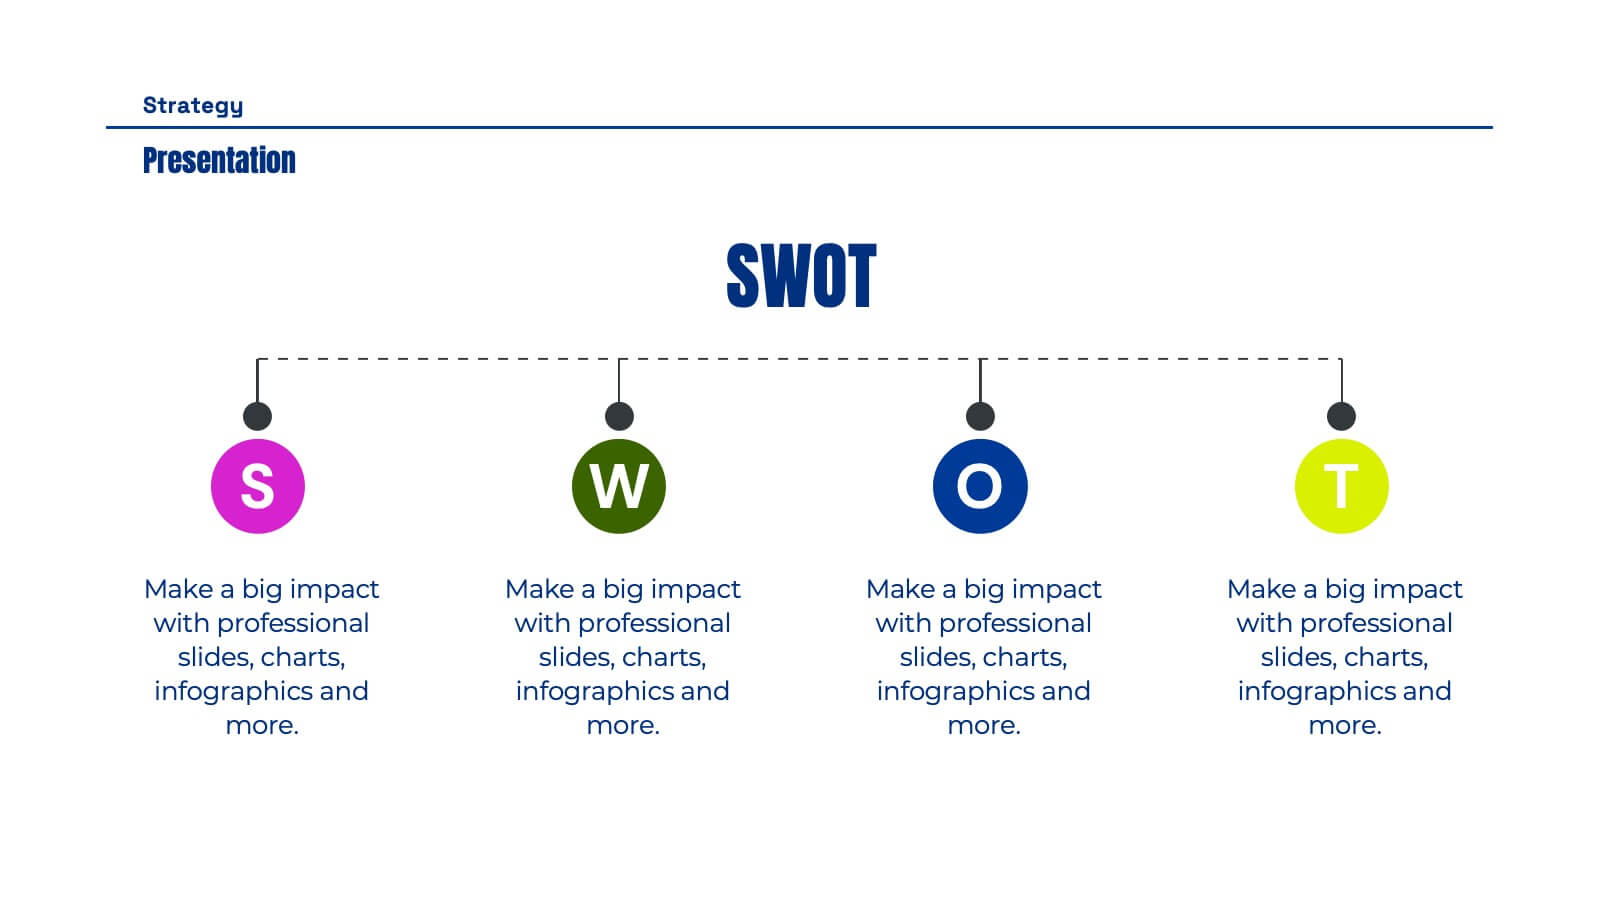
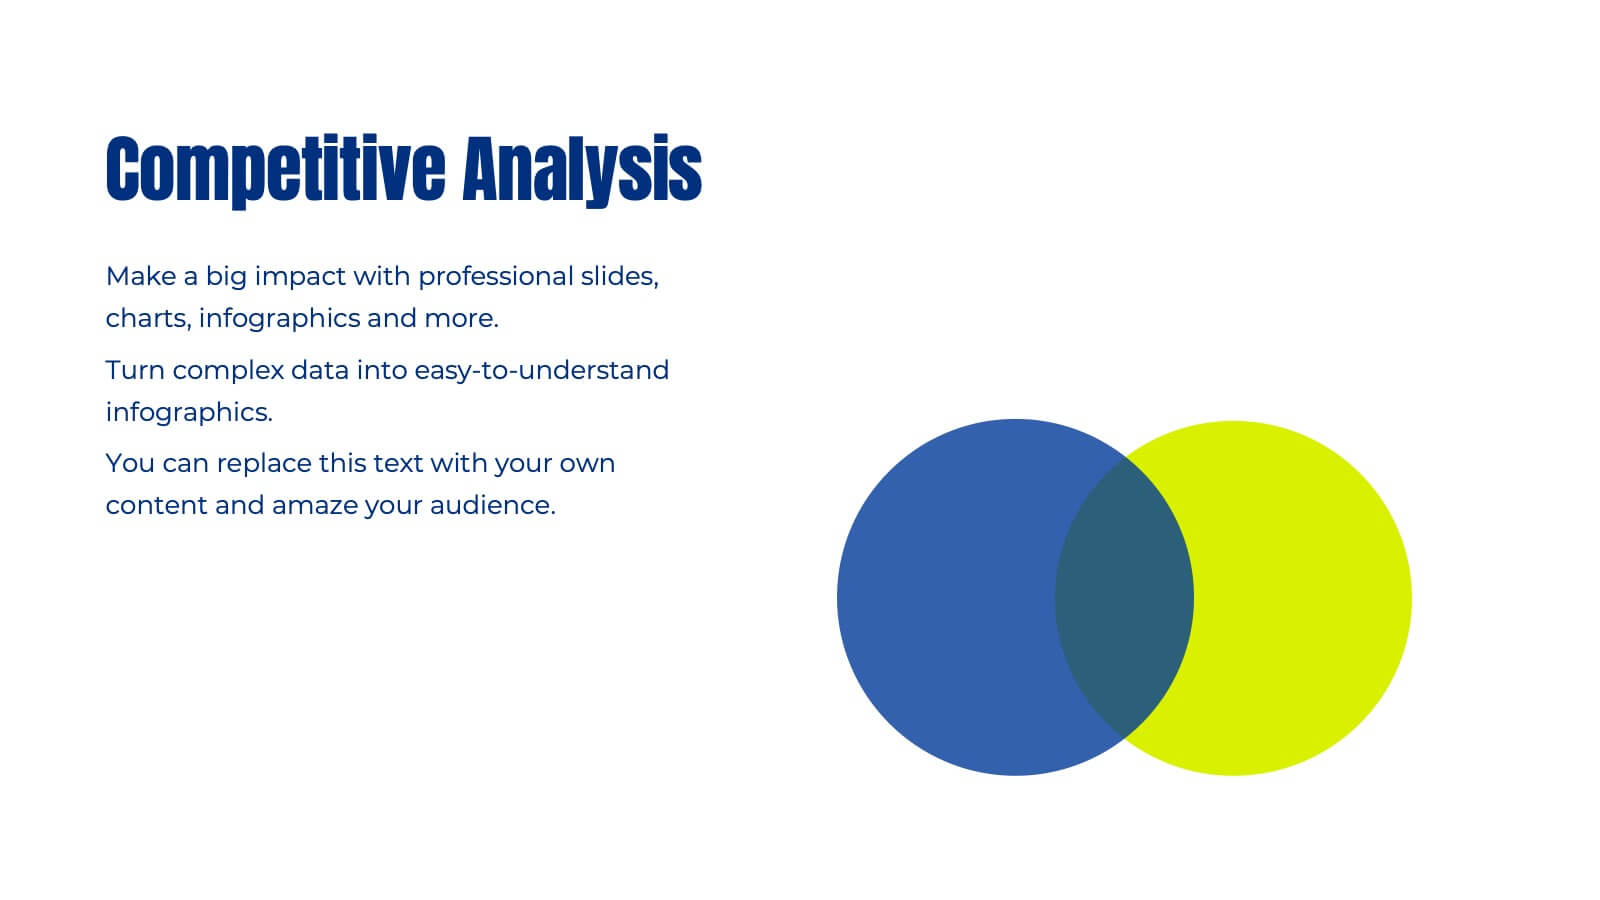
Ops Business Strategy Presentation
Set your strategy in motion with this dynamic, visually striking presentation template! Perfect for conveying key business insights like competitive analysis, market trends, and strategic objectives, it helps organize your plan for success. Each slide focuses on clarity and effectiveness, making it ideal for impactful presentations. Compatible with PowerPoint, Keynote, and Google Slides for effortless use across platforms.


22 slides
Leviathan Sales Pitch Deck Presentation
This sales pitch deck template is designed to captivate your audience with a sleek, modern design. It features key slides like problem statement, solution, business model, and financials, ensuring a comprehensive presentation. Compatible with PowerPoint, Keynote, and Google Slides, it's perfect for showcasing your business's unique value proposition and growth strategy.


8 slides
Tourism Strategy and Location Guide Presentation
Planning a strategy that inspires wanderlust? This sleek presentation template helps organize global tourism goals with location-based insights, iconic visuals, and easy-to-edit layout sections. Perfect for destination marketing, regional analysis, or travel business pitches. Fully compatible with PowerPoint, Keynote, and Google Slides for effortless editing and impactful delivery.


4 slides
Simple RACI Matrix Overview Presentation
Bring instant clarity to every role with a clean, puzzle-style layout designed to map responsibilities without confusion. This presentation helps teams outline who leads, supports, approves, and stays informed in any project, turning tasks into a simple visual grid. Fully editable and compatible with PowerPoint, Keynote, and Google Slides.


6 slides
Logistics and Procurement Supply Chain Presentation
Optimize your supply chain strategy with the Logistics and Procurement Supply Chain template. Designed to illustrate key logistics processes, procurement flows, and operational efficiency, this structured layout helps you present crucial data with clarity. Fully customizable and compatible with PowerPoint, Keynote, and Google Slides for seamless business integration.


23 slides
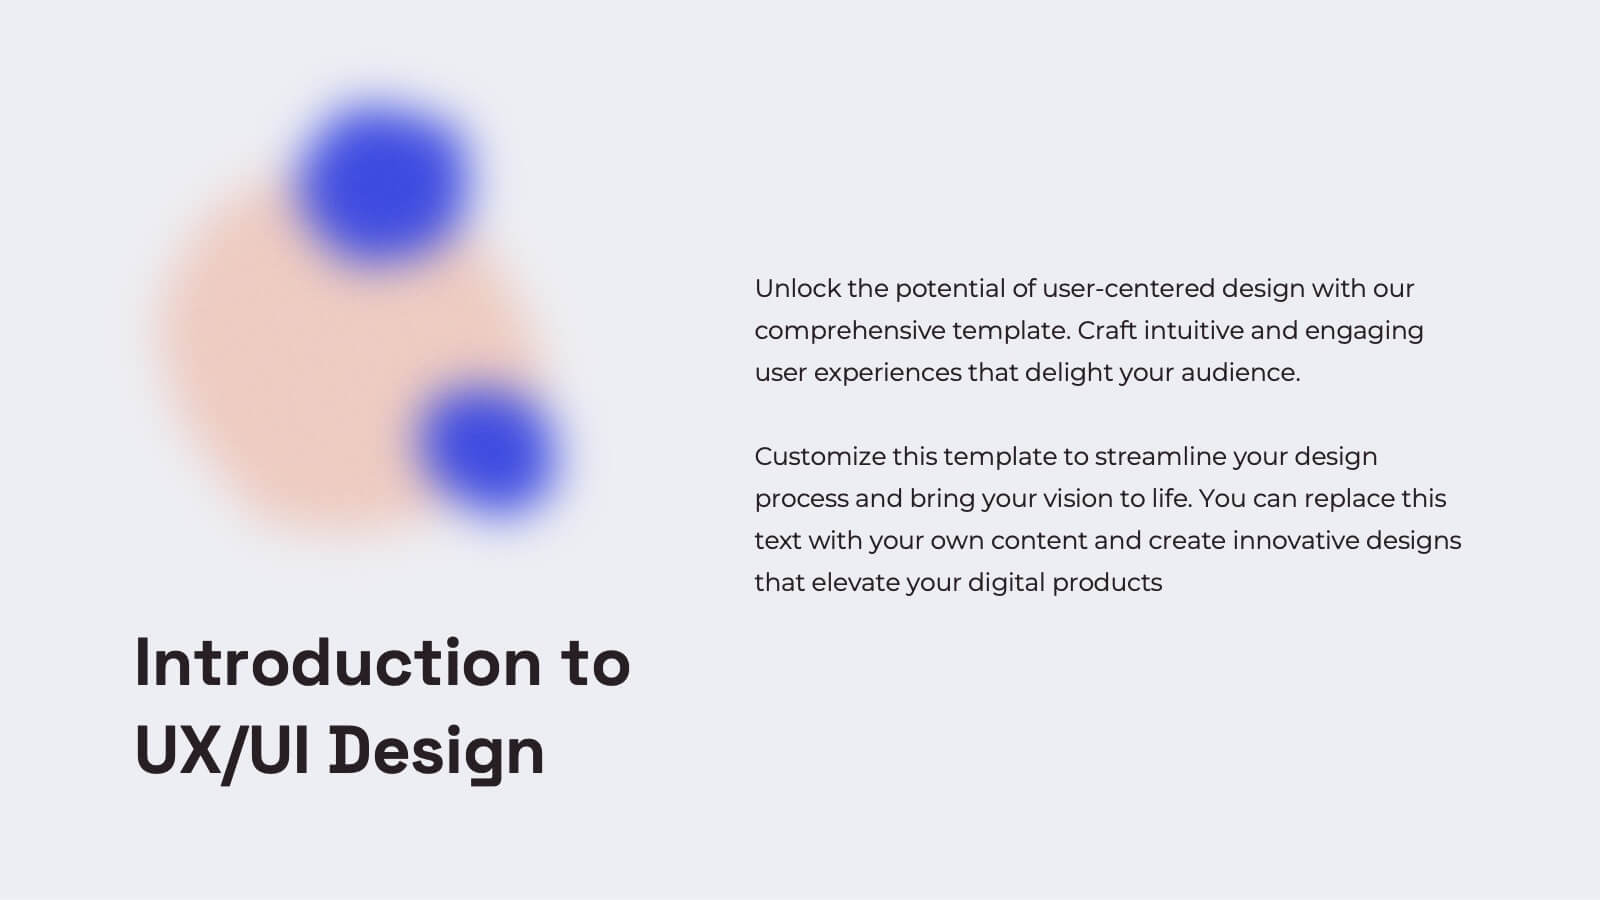
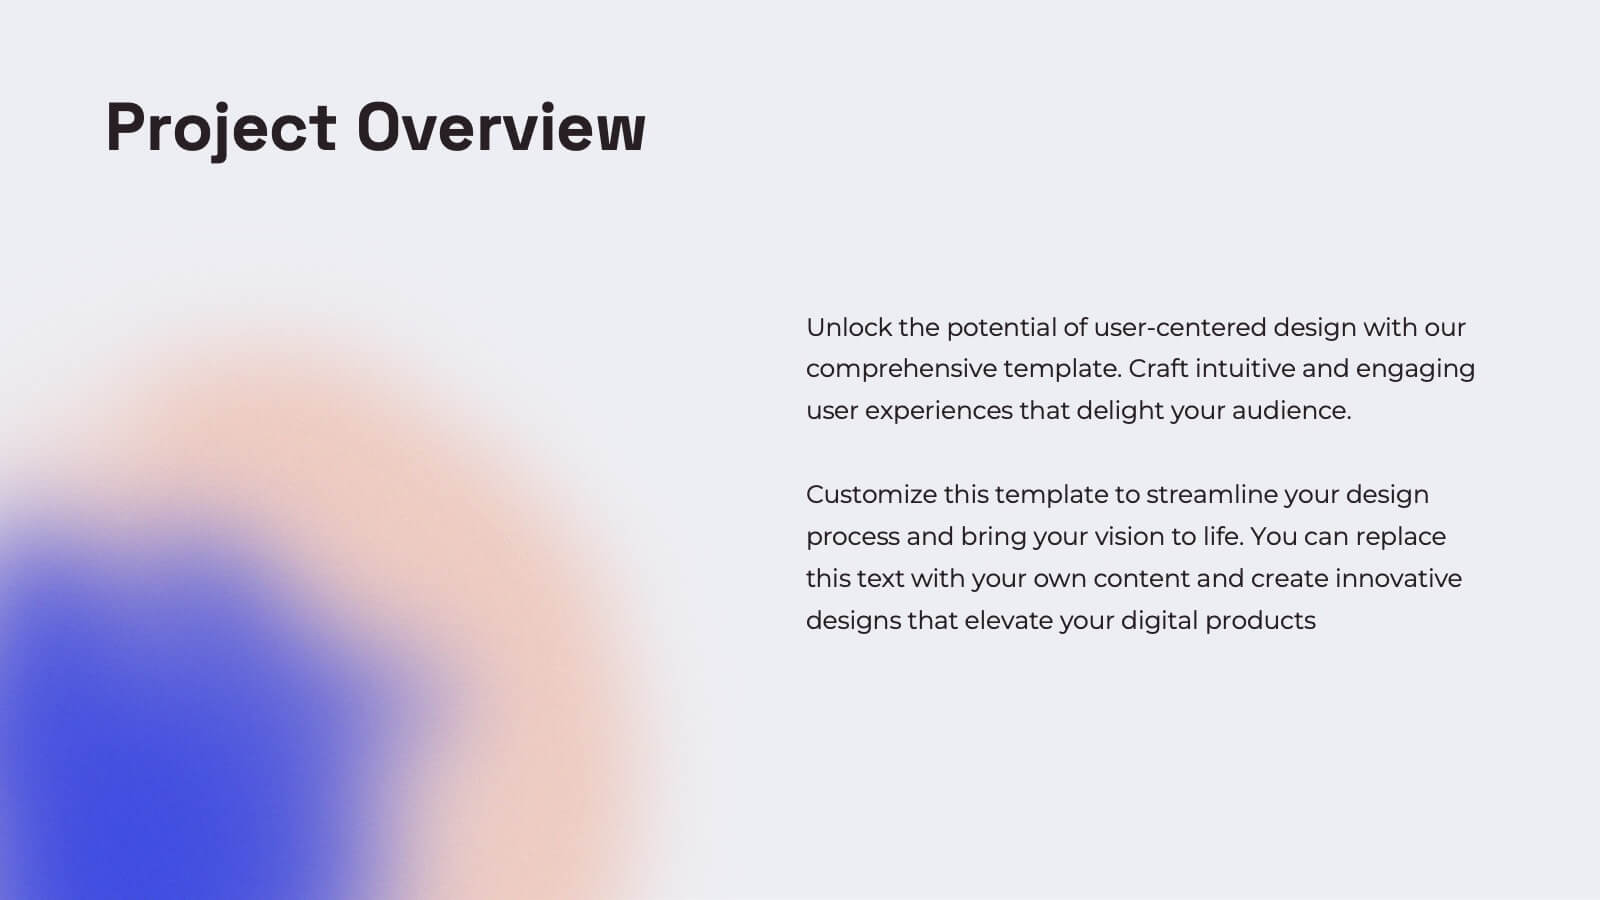
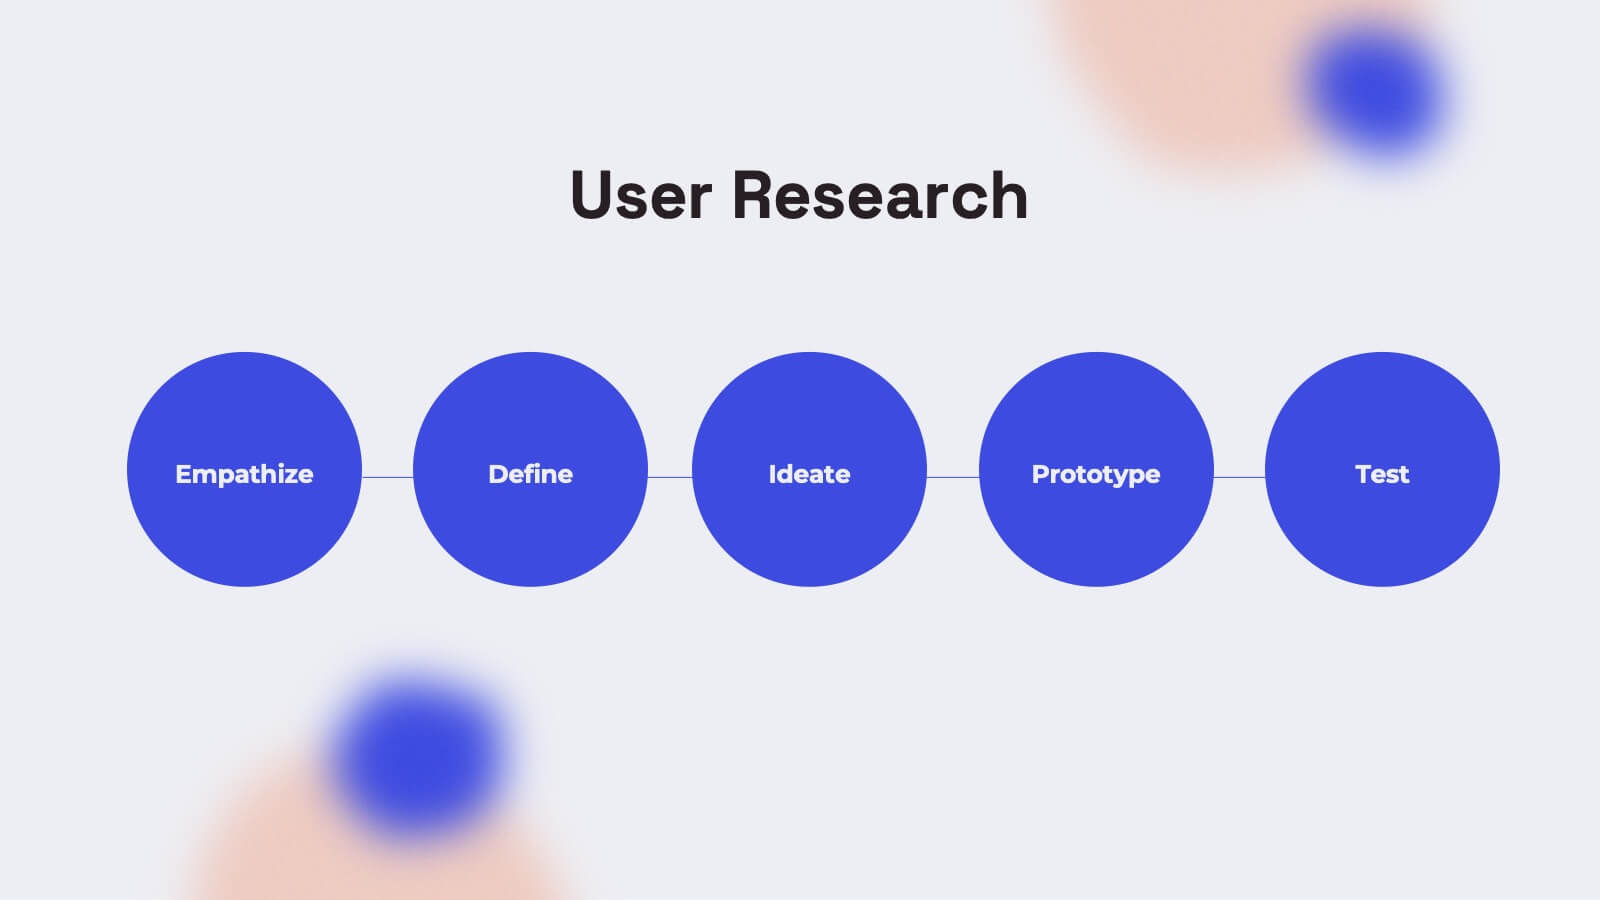
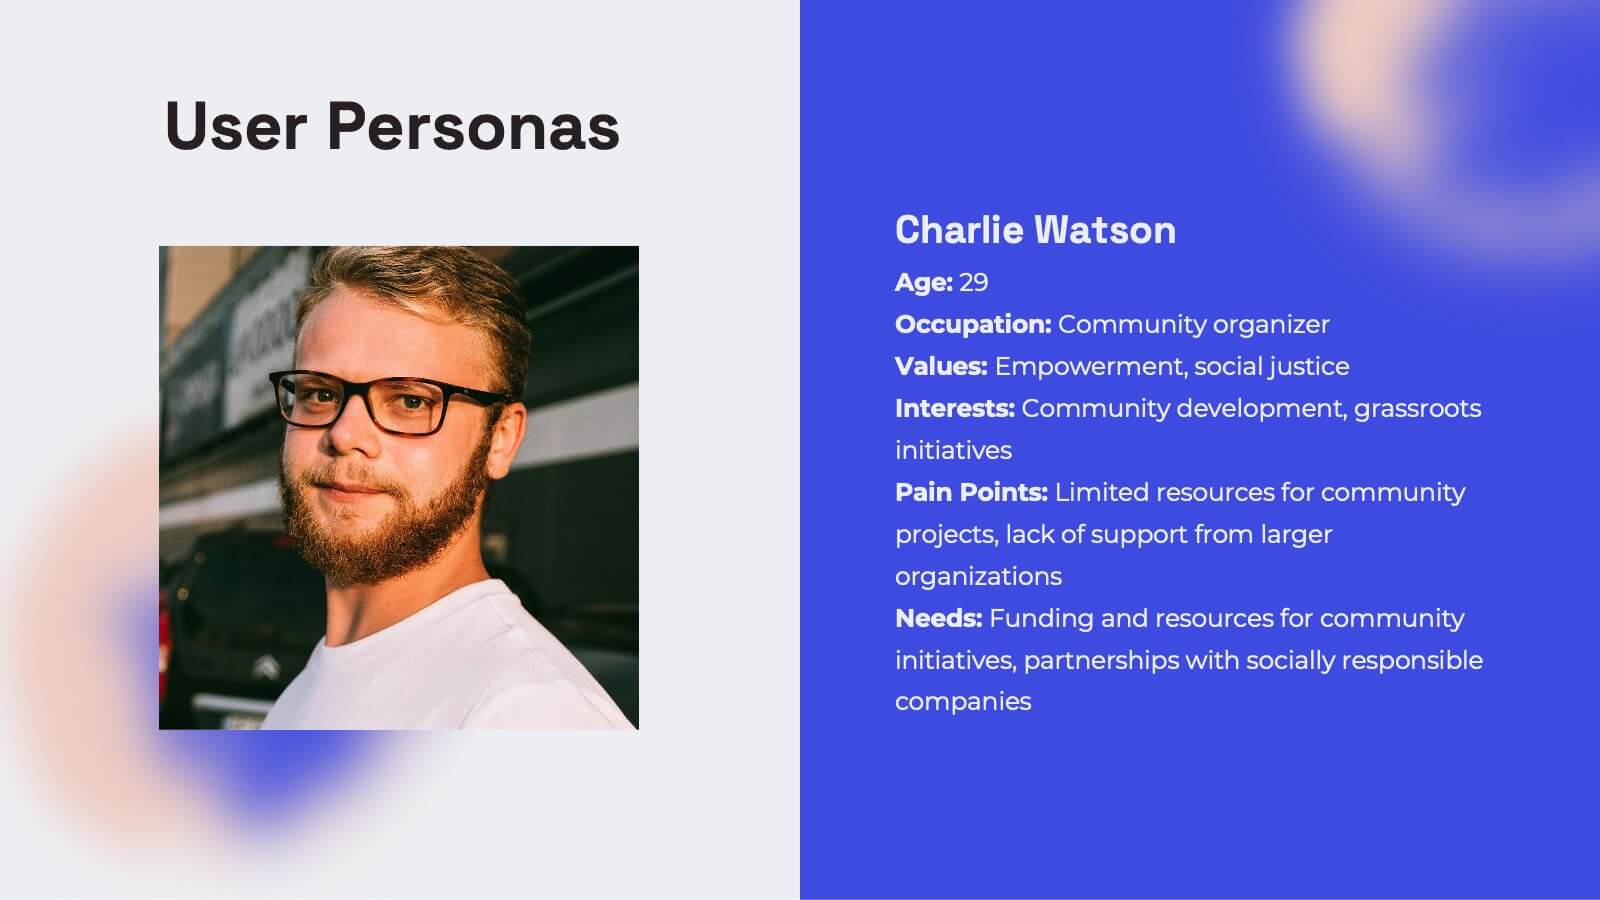
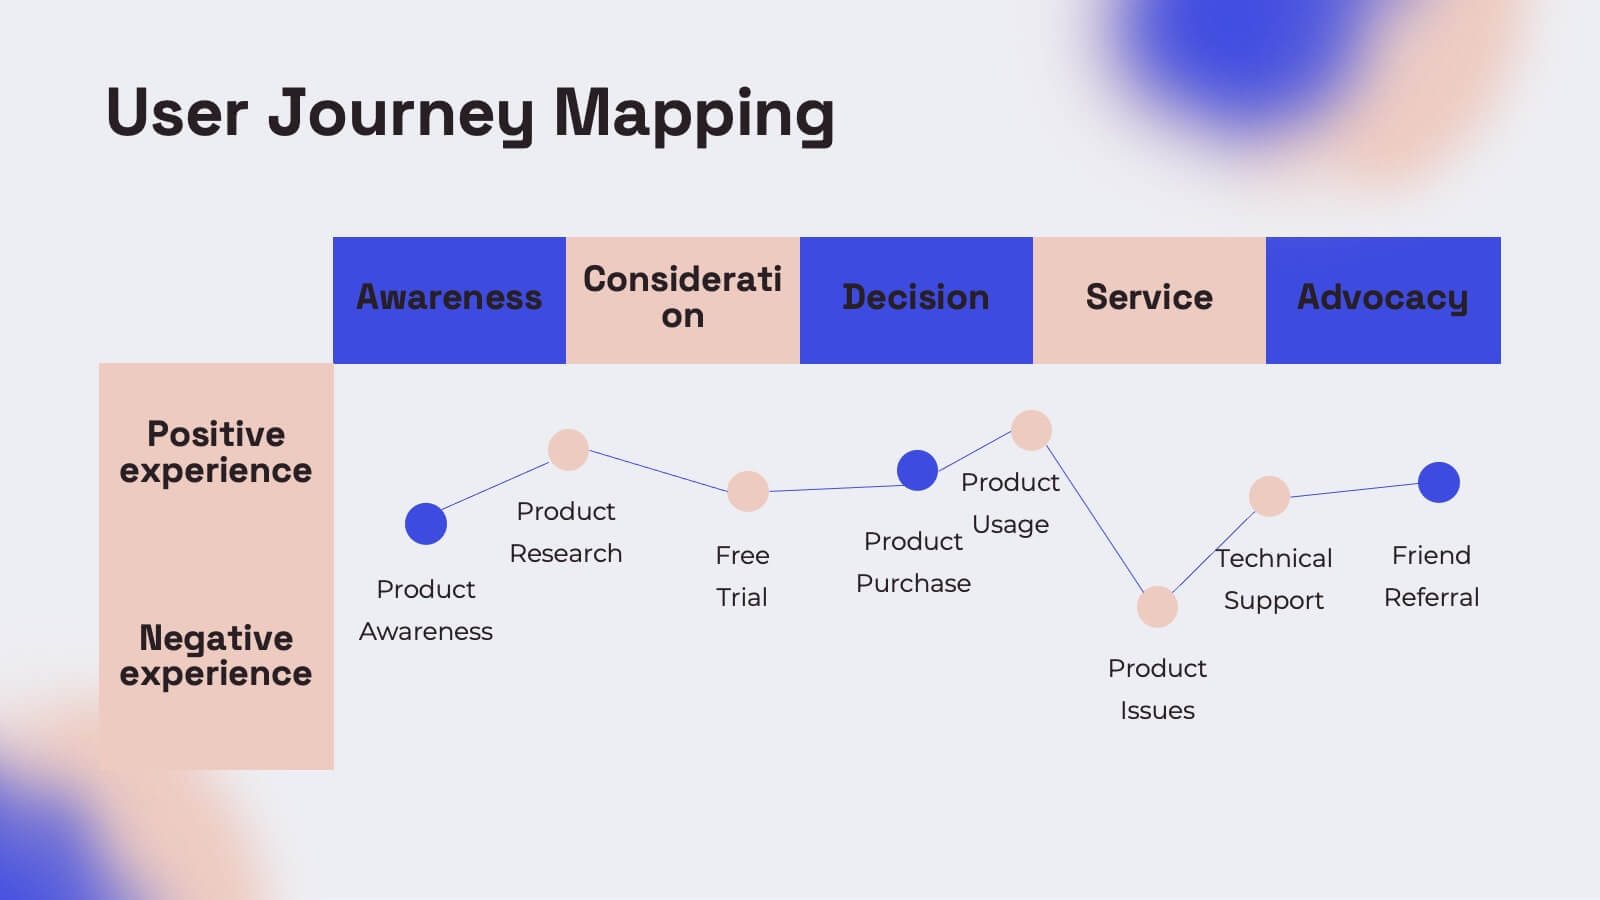
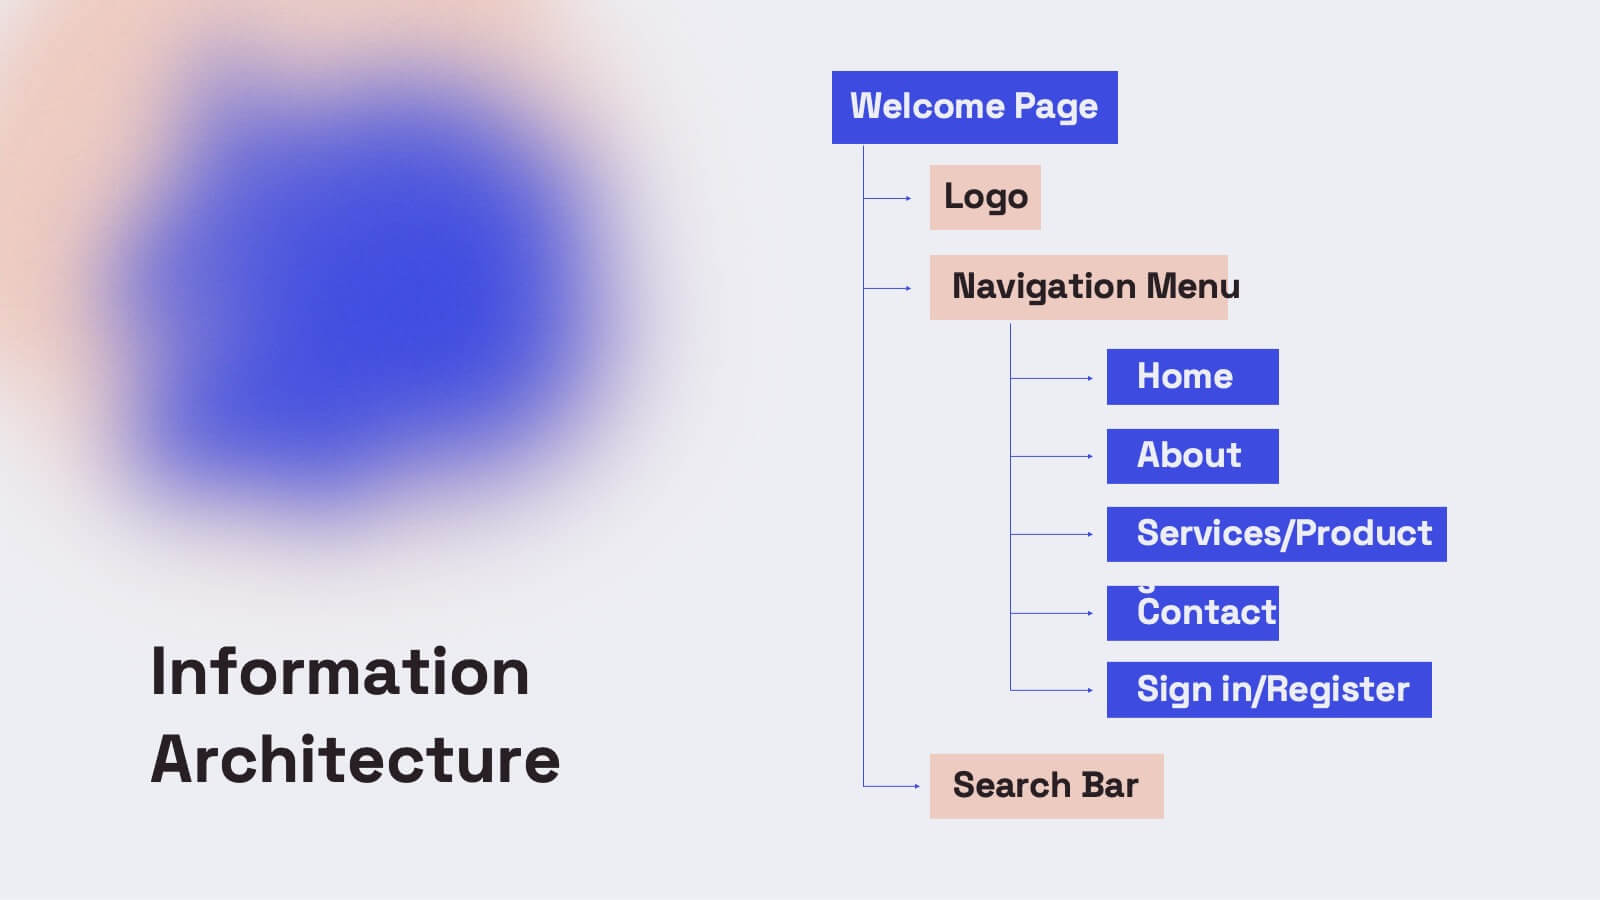
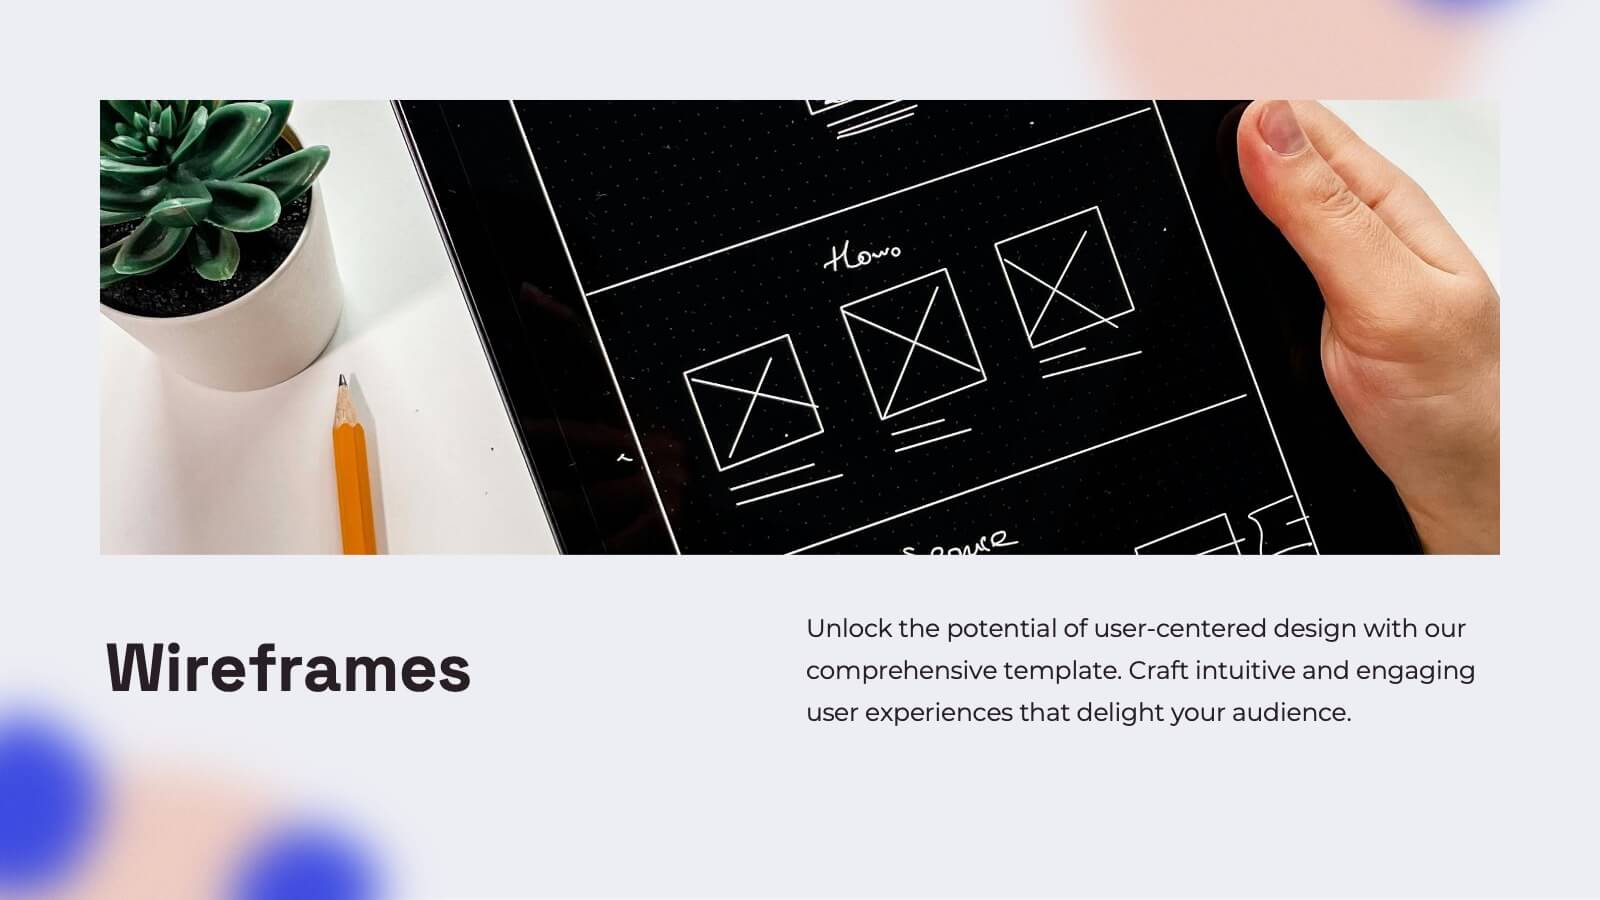
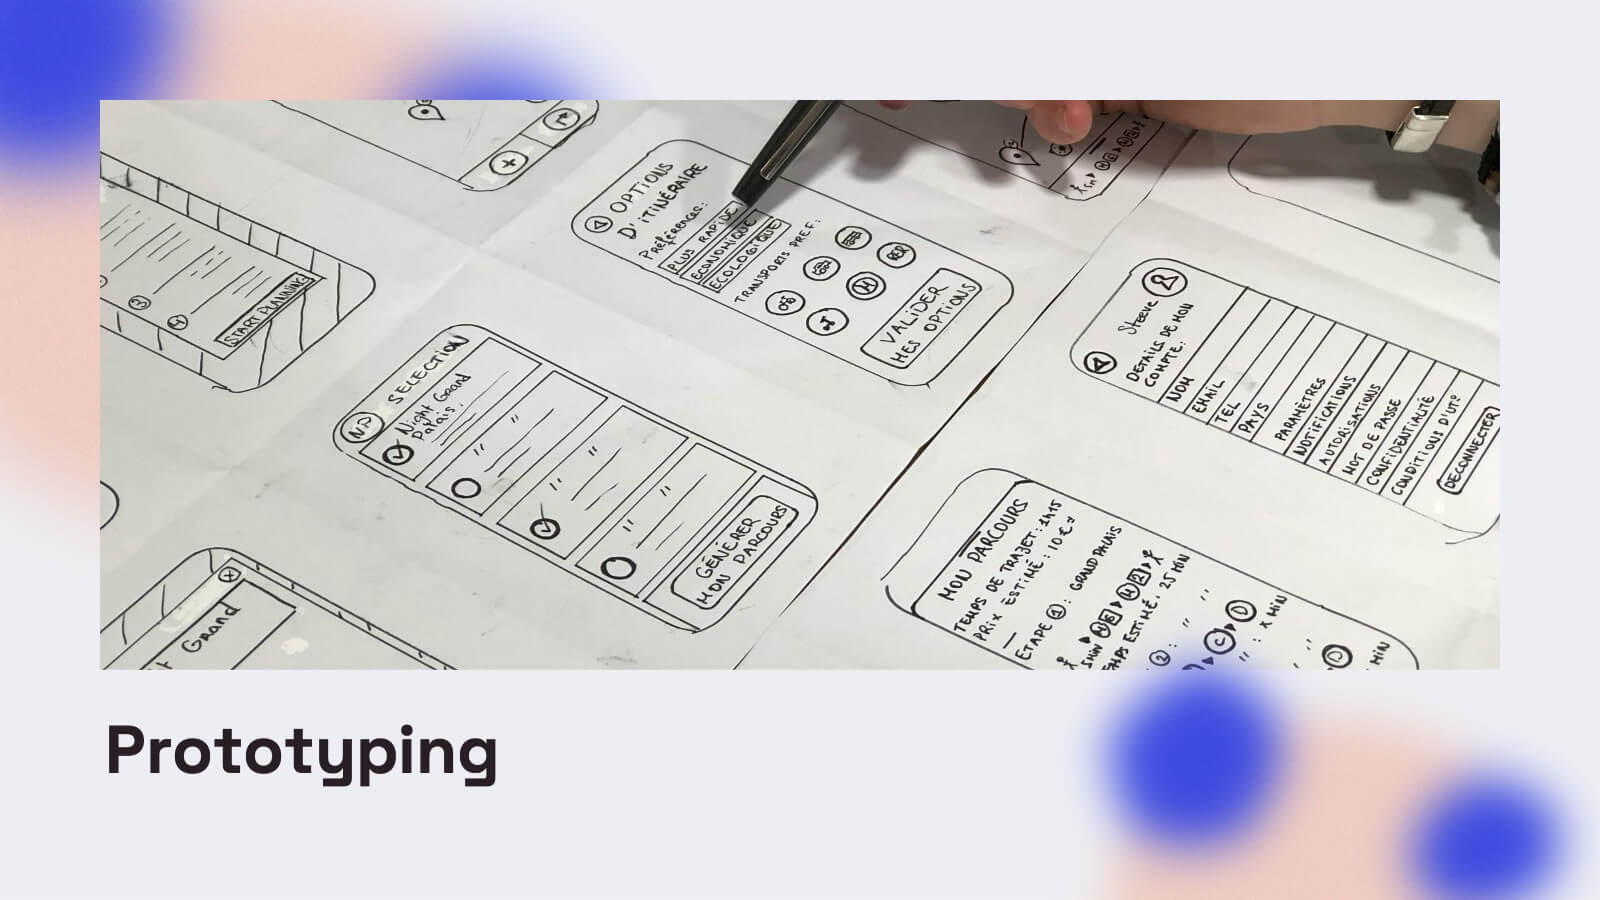
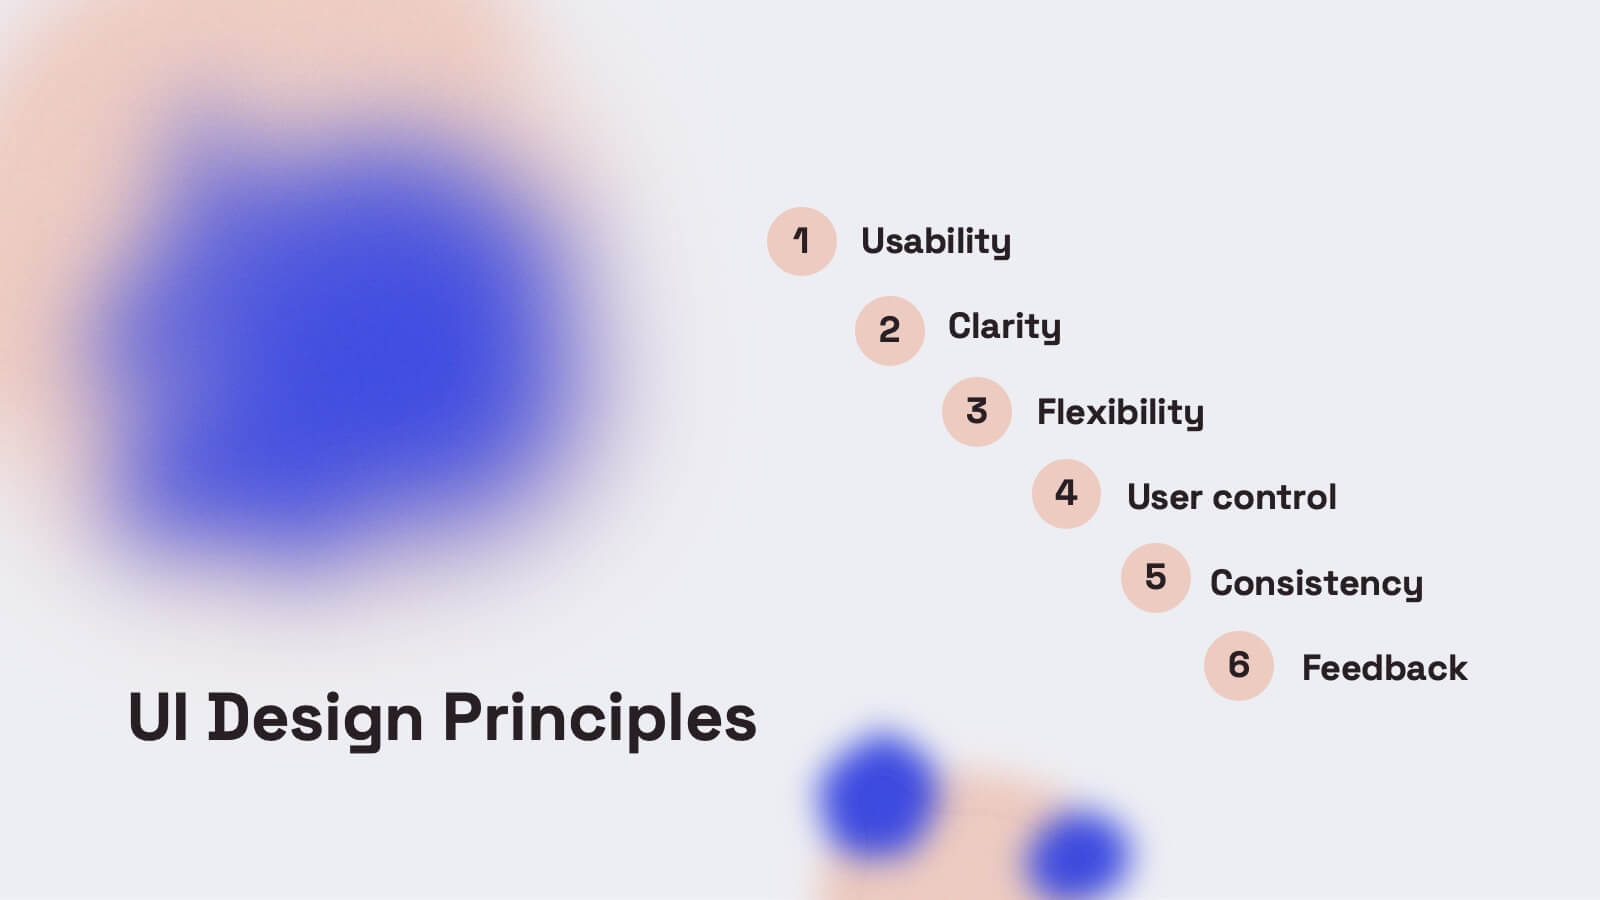
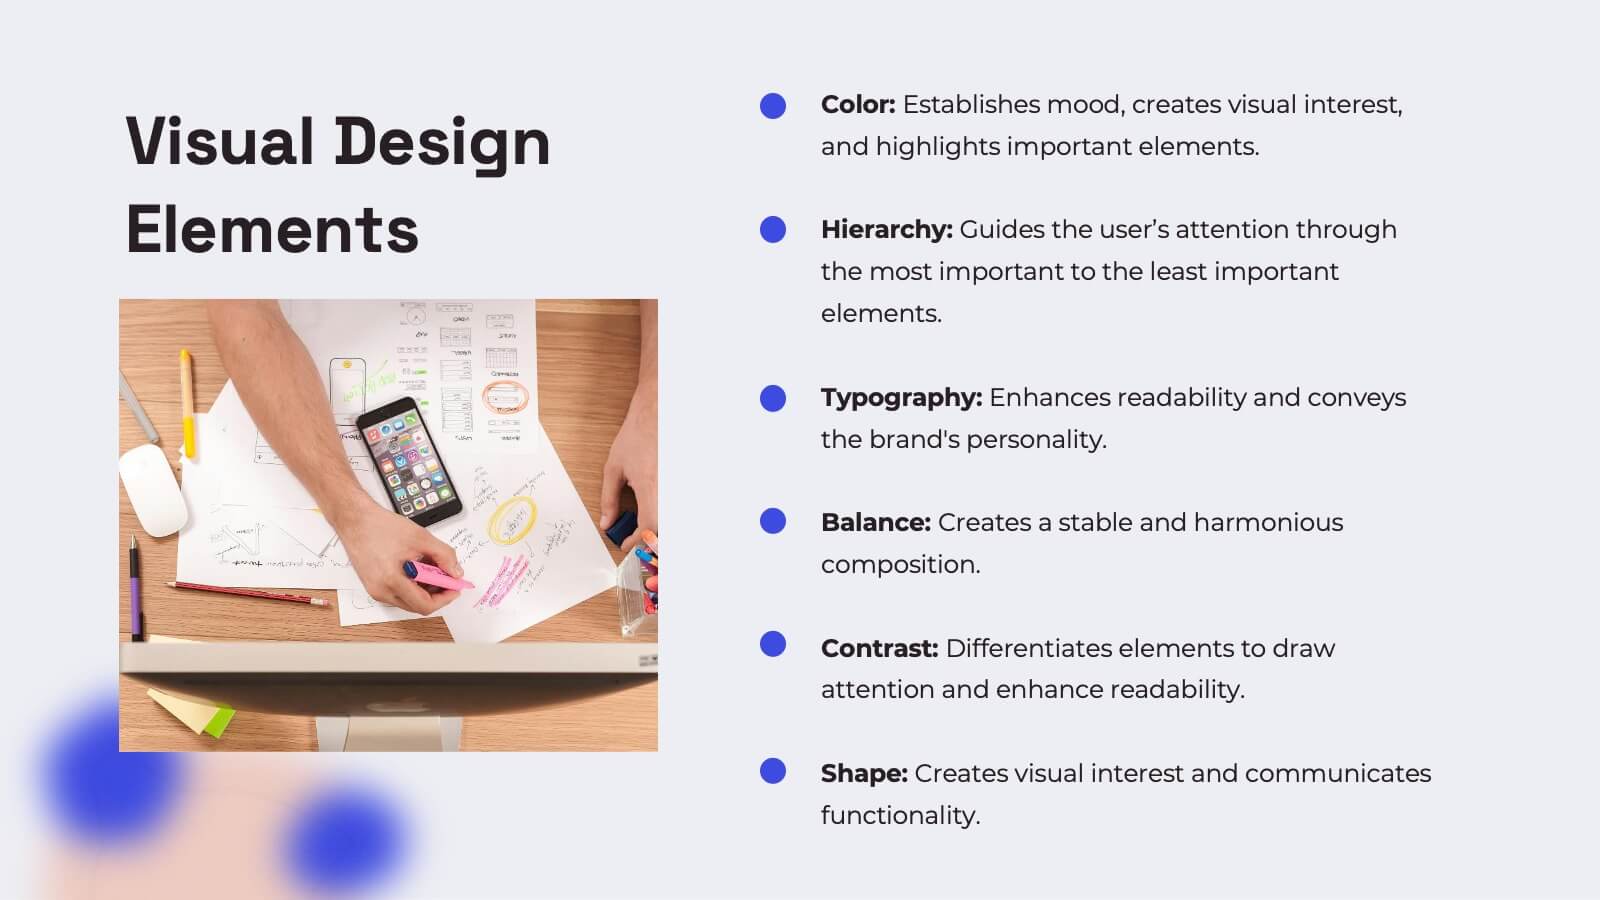
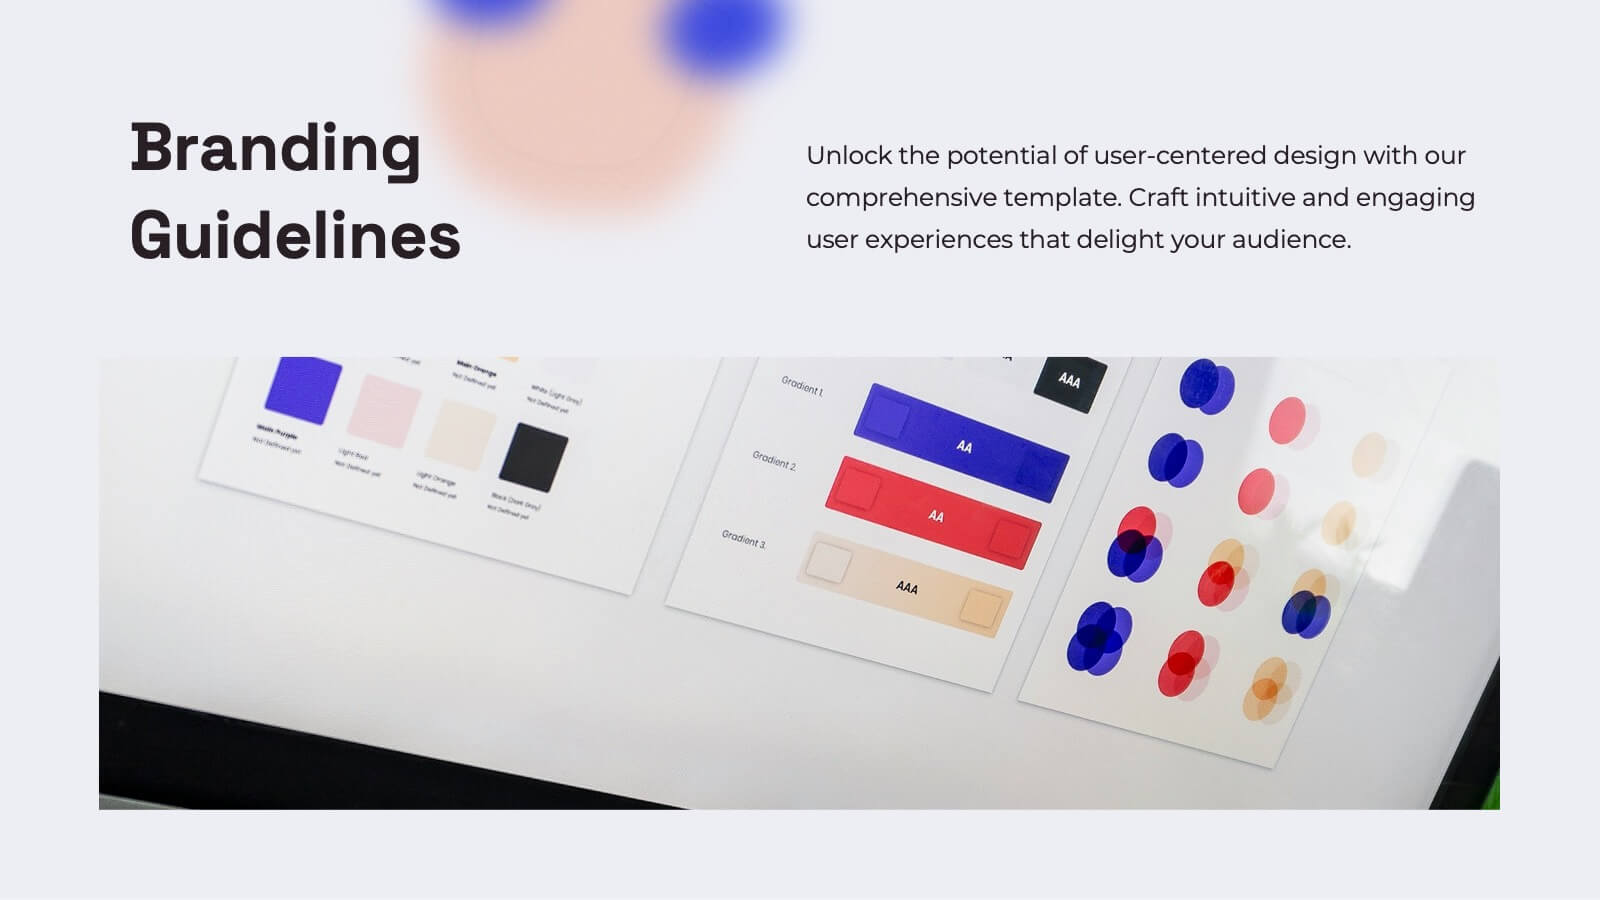
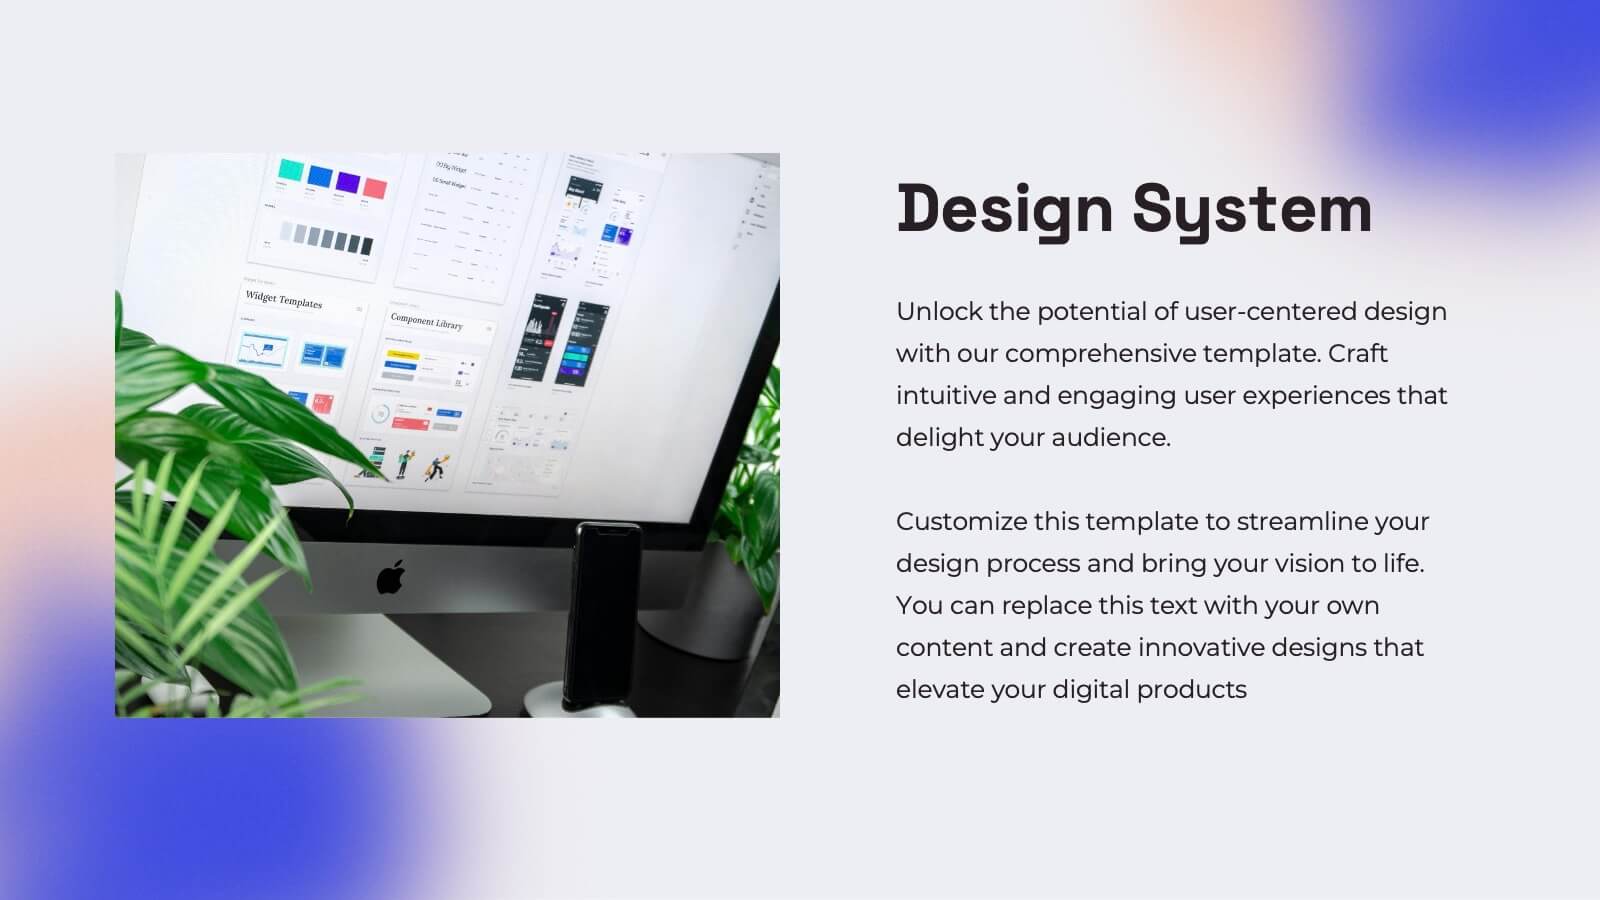
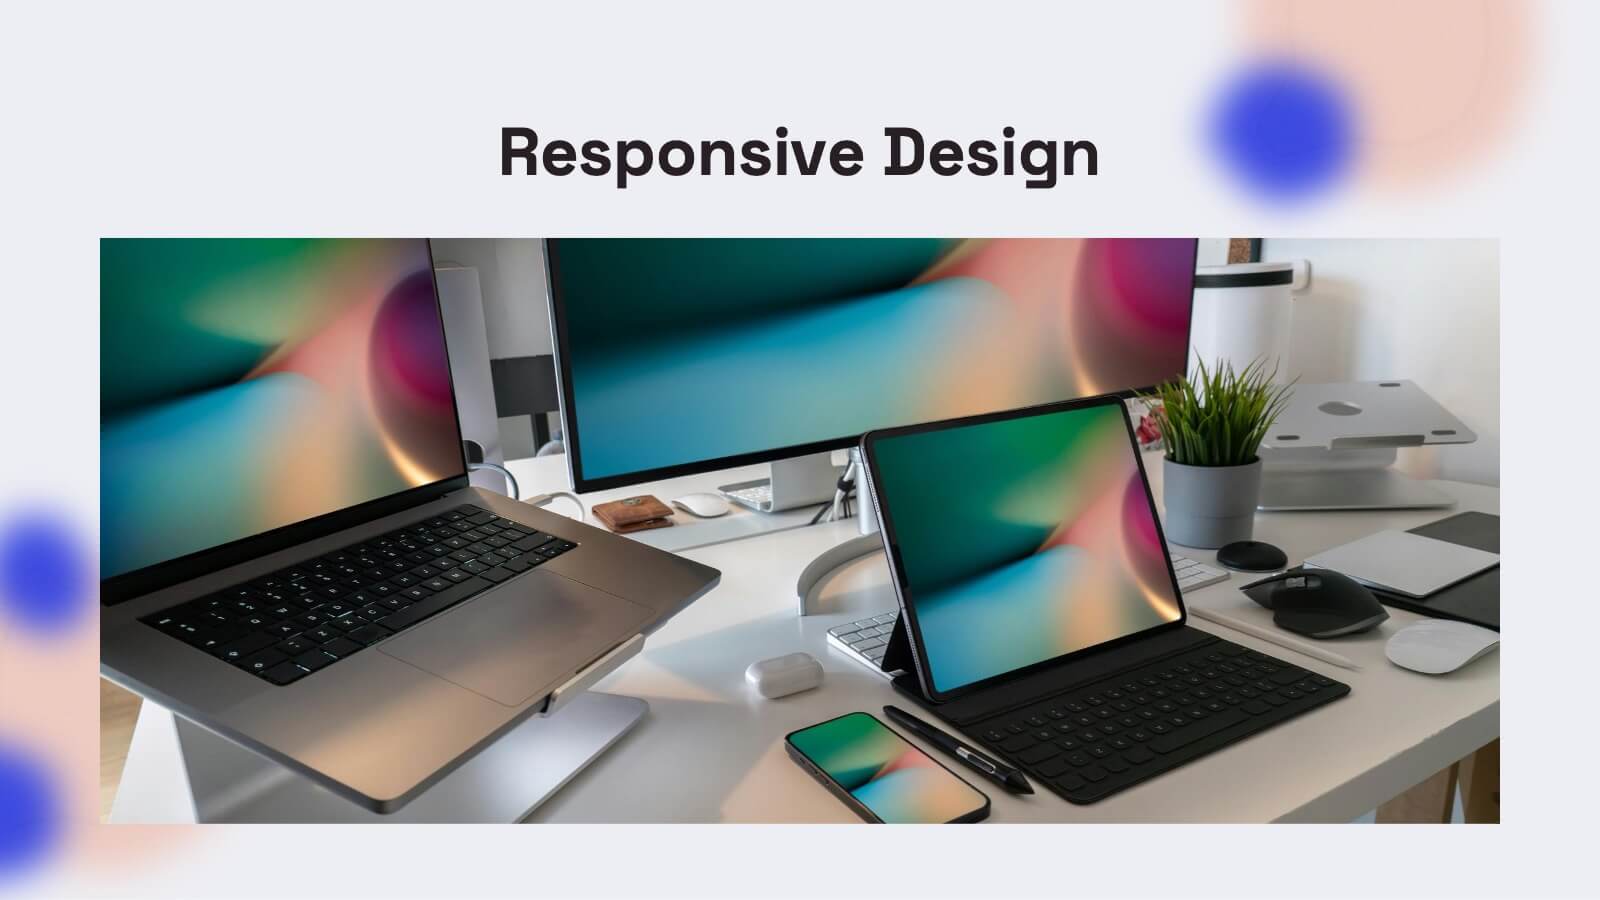
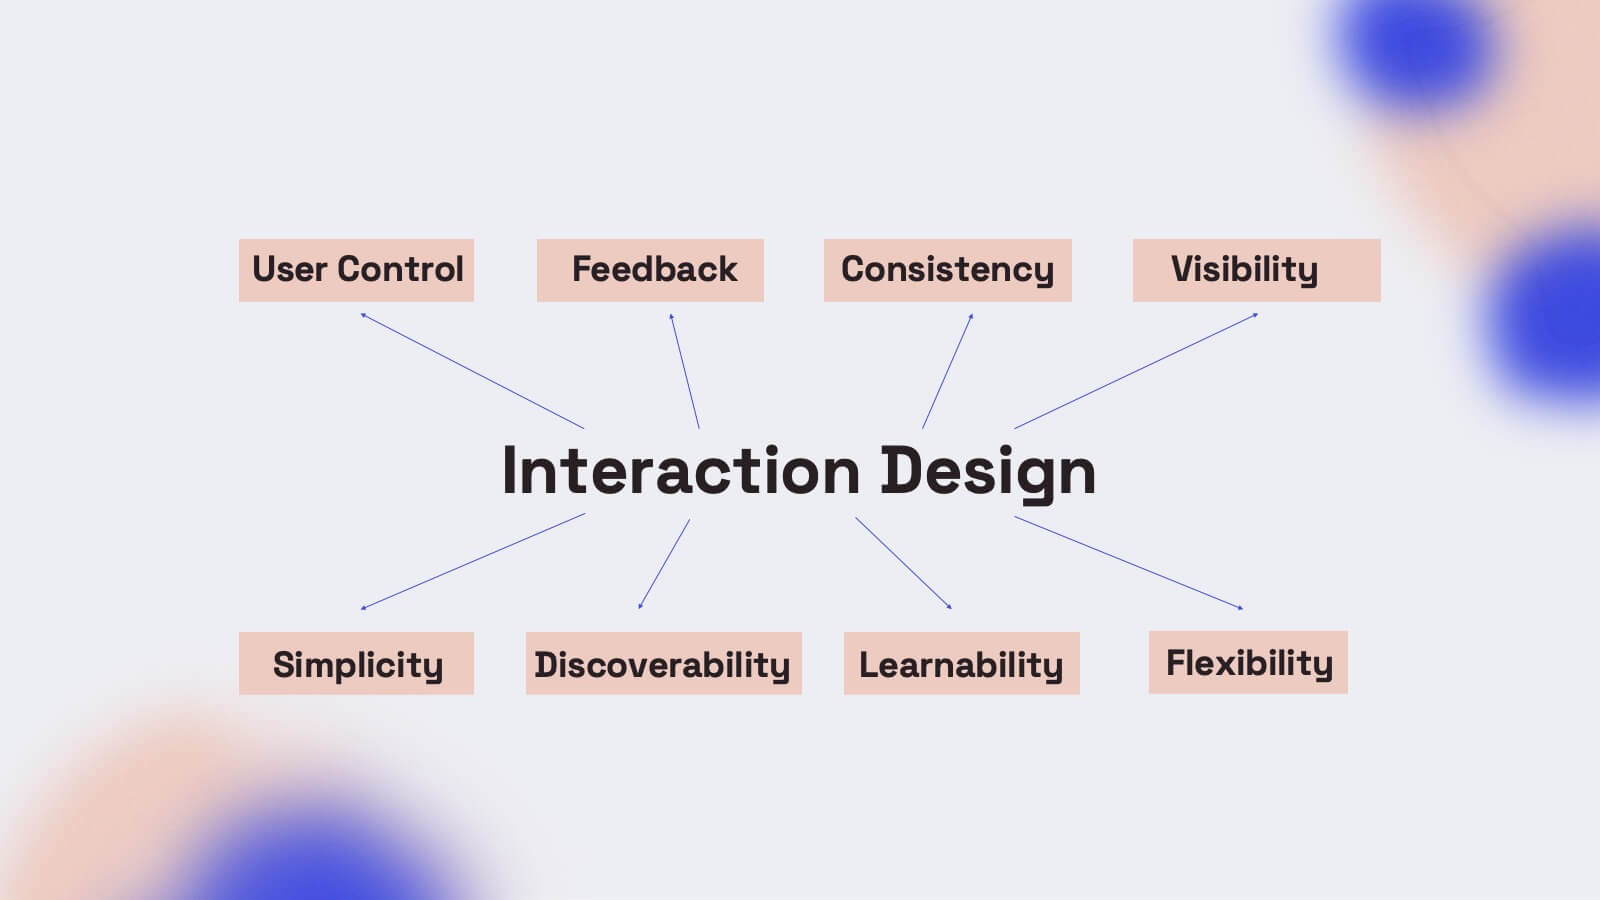
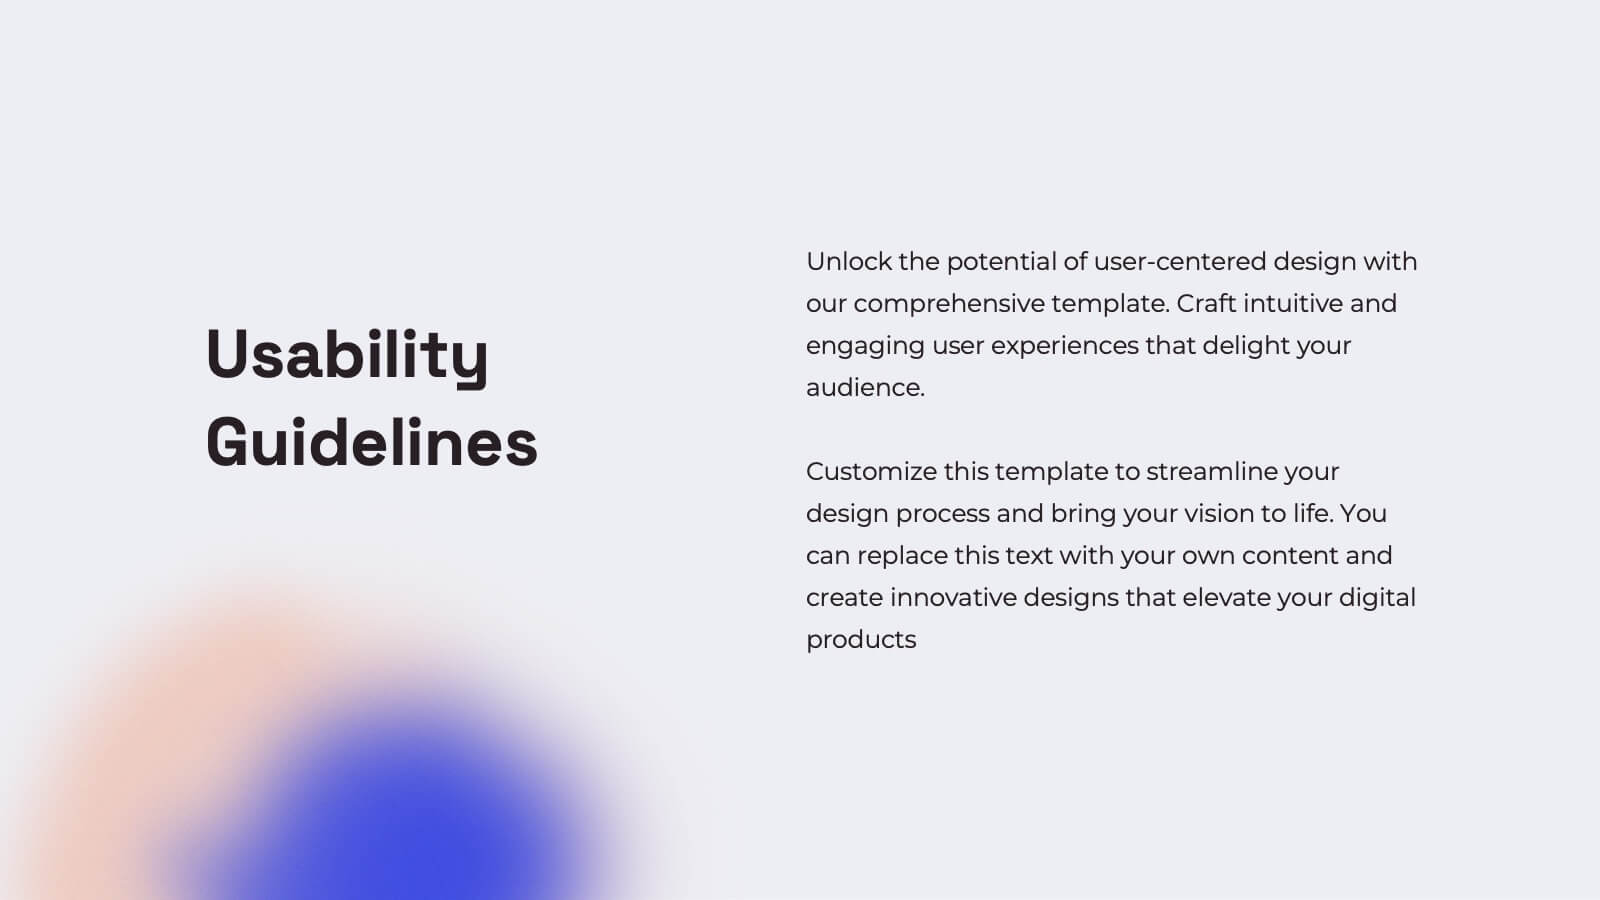
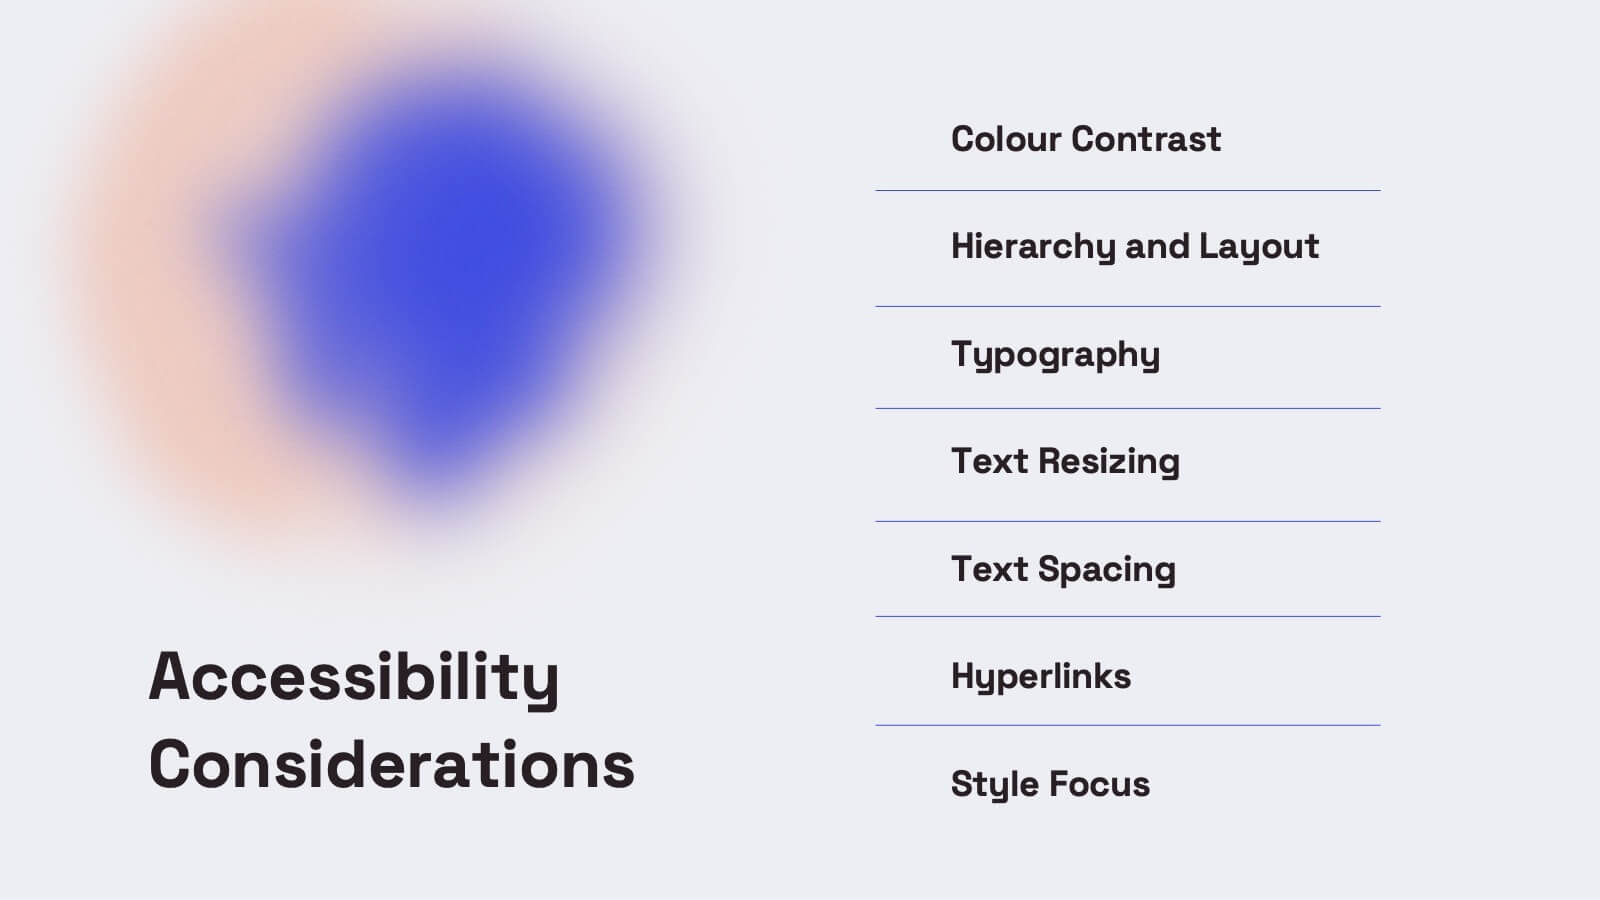
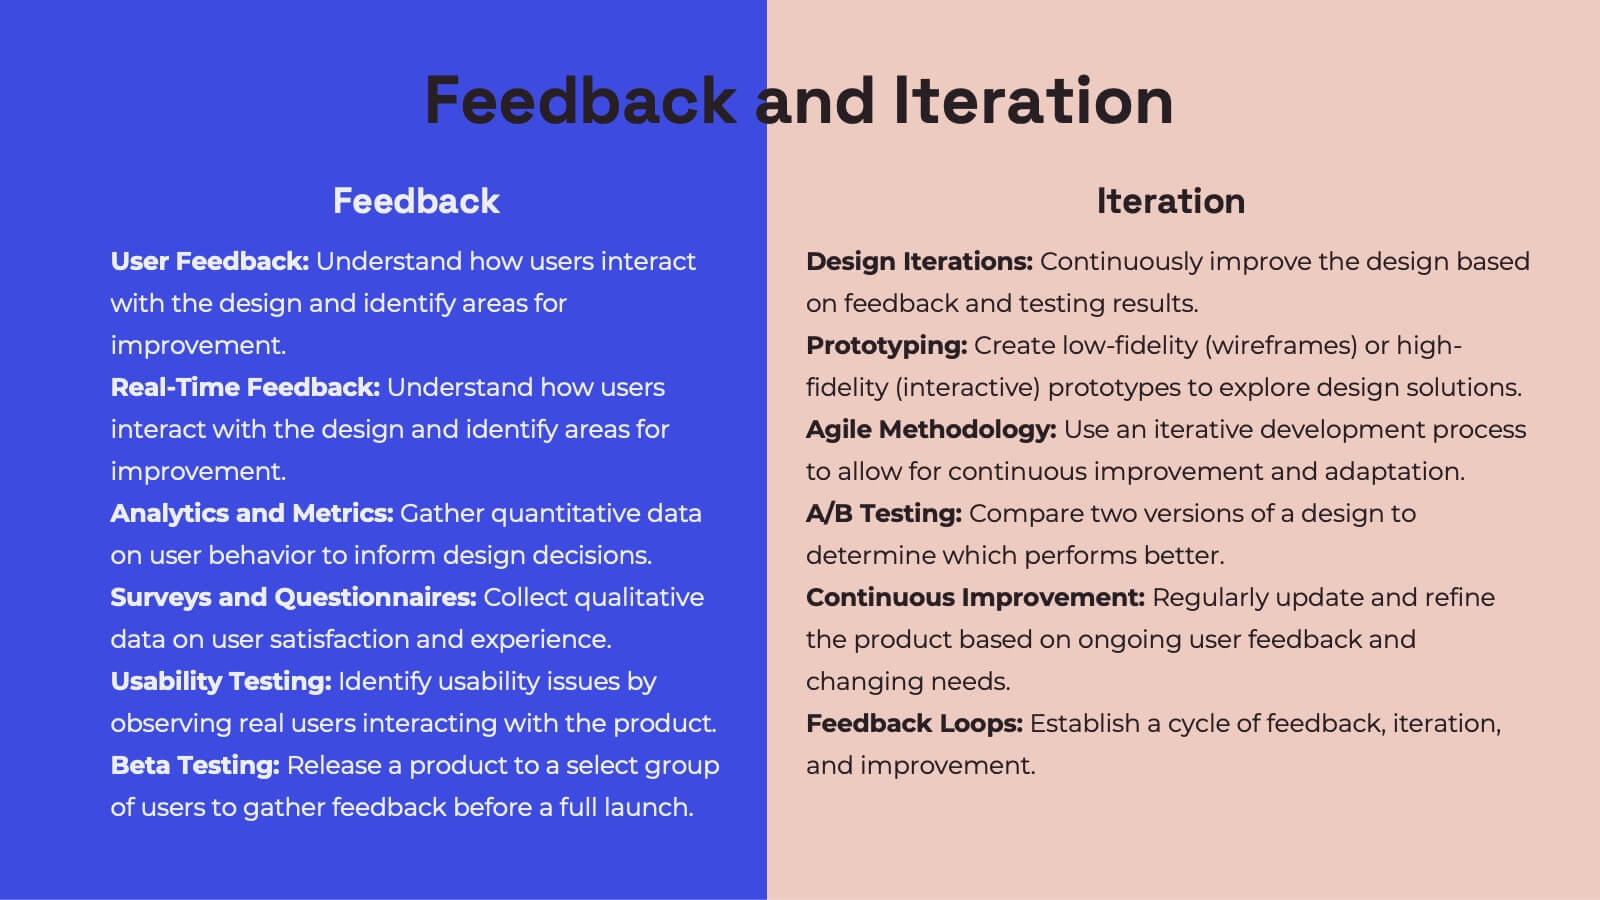
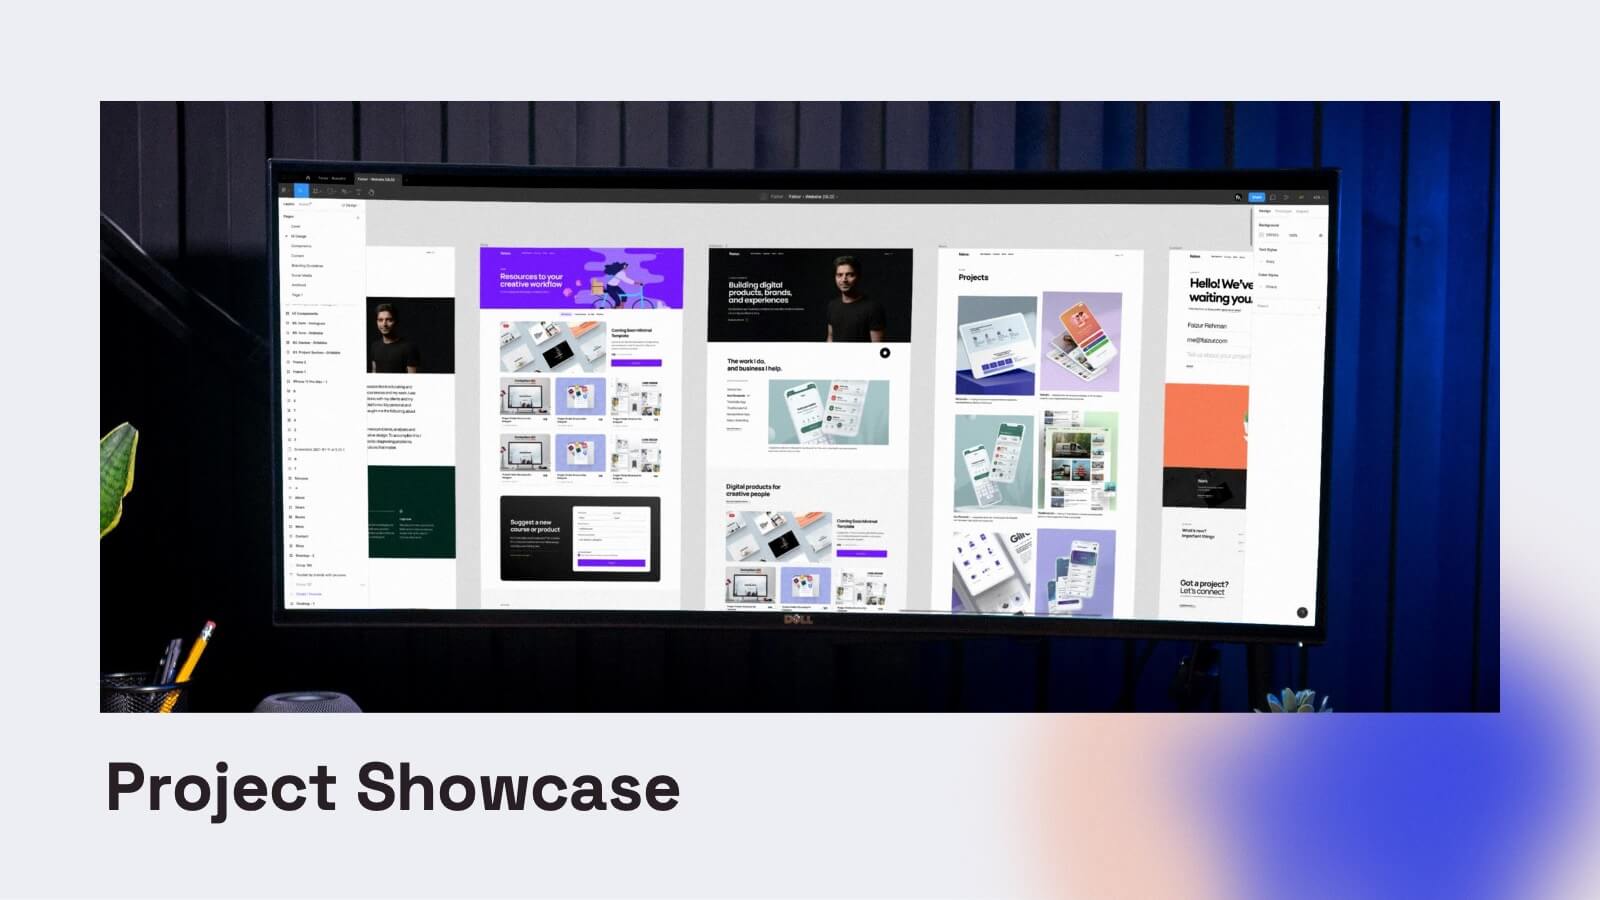
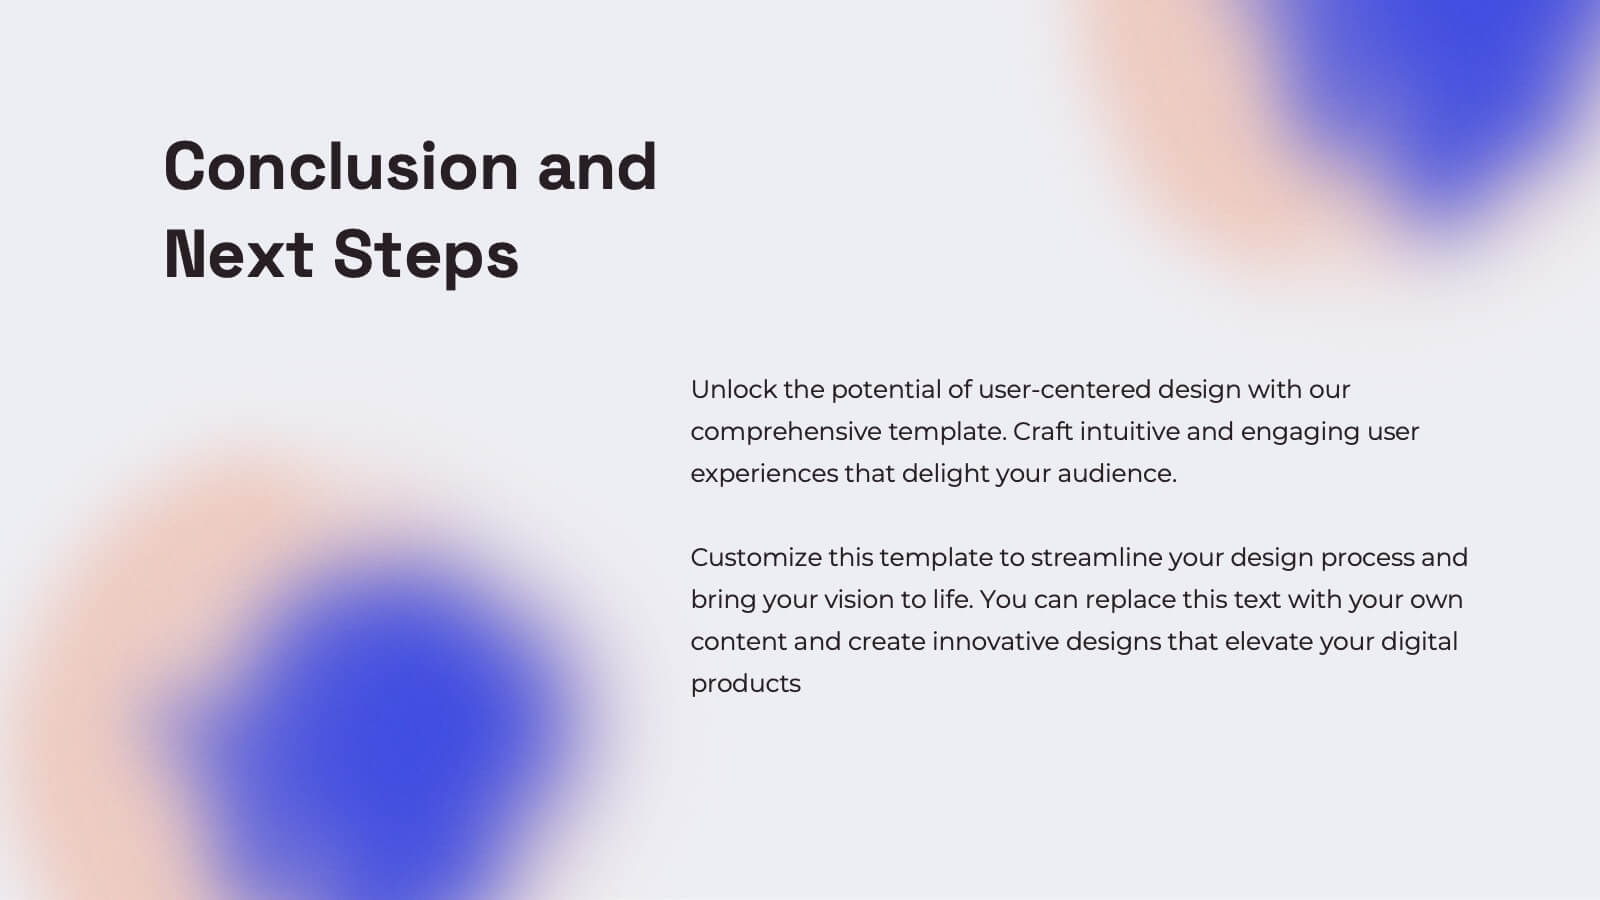
Gemini UX Design Presentation
Enhance your UX presentations with this vibrant and user-friendly template. Designed to cover every aspect of UX design, from user research and personas to wireframes and prototyping, this template ensures a comprehensive and engaging delivery. Its modern design and structured layout make your insights clear and impactful. Compatible with PowerPoint, Keynote, and Google Slides, it's perfect for any platform.


7 slides
Butterfly Visualization Layout Presentation
Bring balance and clarity to your data storytelling with a sleek, symmetrical design that connects ideas seamlessly. This presentation is ideal for visualizing comparisons, workflows, or interconnected topics in a clean and engaging format. Fully customizable and compatible with PowerPoint, Keynote, and Google Slides.


5 slides
Climate Change Response Strategy Deck Presentation
Communicate your climate action roadmap clearly with this Climate Change Response Strategy Deck Presentation. Featuring a directional arrow flow design, this layout helps visualize progressive steps in sustainability, adaptation, or policy initiatives. Ideal for ESG reporting, environmental briefings, or nonprofit strategy sessions. Works seamlessly with PowerPoint, Keynote, and Google Slides.


5 slides
Business Gaps and Solutions Assessment Presentation
Spot the gaps and climb to clarity with this smart pyramid-style assessment design. Perfect for identifying weaknesses and matching them with targeted solutions, this layout helps teams visualize challenges at every level of the business. Use it to guide strategy with confidence. Works great in PowerPoint, Keynote, and Google Slides.


6 slides
Strategy Wheel Infographic Slide
Present key strategies, priorities, or action items in a visually engaging circular format. This infographic template is ideal for showcasing 5 interconnected components in business plans, marketing strategies, or process flows. Fully editable in PowerPoint, Keynote, and Google Slides for seamless customization.


7 slides
Agenda for Change Infographic
Our agenda slides for change initiatives are meticulously designed to support organizations in outlining and managing transformational meetings. Each slide is crafted to guide discussion and decision-making processes that are essential for successful change management. These templates feature structured layouts to help you present the steps of the change process, from inception to execution. With elements like timelines, checklists, and progress bars, these slides make it easy to communicate the sequence of activities, key milestones, and responsibilities. The use of clean lines, subtle colors, and modern typography ensures that the information is presented in an organized and professional manner, facilitating clear communication and effective engagement. Fully customizable, these agenda slides can be adapted to reflect your organizational branding and specific change management frameworks. They are ideal for use in strategic planning sessions, workshops, or regular team meetings where managing change is the agenda.