


Features
- 8 Unique slides
- Fully editable and easy to edit in Microsoft Powerpoint, Keynote and Google Slides
- 16:9 widescreen layout
- Clean and professional designs
- Export to JPG, PDF or send by email


Do you have any questions?
Recommend


4 slides
Mirror Data Distribution Butterfly Format Presentation
Present side-by-side comparisons with clarity using the Mirror Data Distribution Butterfly Format Presentation. This layout helps visualize balanced data sets, performance comparisons, or goal vs. outcome metrics with mirrored bars and intuitive icons. Fully customizable in Canva, PowerPoint, Google Slides, and Keynote to match your brand's aesthetic and message.


6 slides
Ecommerce KPI Dashboards Infographic
Elevate your eCommerce reporting with our comprehensive KPI Dashboard Infographics. Tailored for seamless integration with PowerPoint, Google Slides, and Keynote, this template offers a clear and colorful representation of key performance indicators critical to online business success. From tracking sales growth to monitoring customer engagement metrics, our infographics provide an intuitive layout to display data-driven insights that drive decision-making. This template transforms complex data sets into straightforward visuals, making it easier to communicate progress with your team. Use this template to keep a pulse on your eCommerce performance and narrate the story behind the numbers.


6 slides
Onboarding 30-60-90 Day Roadmap Presentation
Get your team excited from day one with this colorful, easy-to-follow visual layout! This presentation template helps clearly map out onboarding goals and key activities across 30, 60, and 90 days. Perfect for HR professionals and team leads, it's fully editable and works with PowerPoint, Keynote, and Google Slides.


5 slides
Smart Decision Making Models Presentation
Make complex choices simple with this modern and colorful template designed to visualize analytical thinking and structured planning. Ideal for presenting frameworks, strategies, or goal-setting models, it helps communicate logic and clarity effectively. Fully compatible with PowerPoint, Keynote, and Google Slides for smooth customization and presentation delivery.


5 slides
Suicide Prevention & Awareness Infographics
Suicide Awareness plays a vital role in addressing the global public health issue of suicide. These vertical infographics are powerful and informative designs that aim to raise awareness about suicide prevention, promote mental health, and provide essential information to help individuals recognize the signs and support those in need. With its thoughtful and sensitive design, the template communicates important statistics, facts, and resources. The template is fully customizable, allowing you to personalize the infographics with your own content, including local helpline numbers, support services, or specific awareness campaigns.


5 slides
Strategic Planning with Foundational Pillars Presentation
Define the structure behind your strategic vision with the Strategic Planning with Foundational Pillars presentation. This template showcases four strong pillars beneath a classical pediment, symbolizing the stability and balance of your business strategy. Each pillar represents a core principle—perfect for themes like leadership, values, operations, or goals. Clean, modern, and entirely editable in PowerPoint, Keynote, and Google Slides, this visual works great for executive briefings, annual plans, or business consulting pitches.


6 slides
Problem Analysis Infographic
These slides provide a structured and aesthetically pleasing approach for detailing problem analysis within a project or organizational context. Each slide incorporates various design elements that guide the viewer through the steps or layers of the problem, allowing for a comprehensive understanding and discussion. The use of soft color palettes and clear text placement ensures that the information is easily digestible. The diverse layouts cater to different aspects of problem analysis, from bullet points to diagrammatic representations, making these templates versatile for various presentation needs. These are ideal for presenting complex information in a straightforward manner to ensure clear communication of issues and strategies within team meetings or presentations to stakeholders. The flexibility of the design also allows for easy customization to suit specific project requirements or branding needs.


5 slides
Role Assignment Matrix Framework Presentation
Simplify task delegation with the Role Assignment Matrix Framework Presentation. Ideal for defining roles and responsibilities in a clear, table-based layout, this matrix helps organize who does what across departments or project phases. Perfect for RACI charts or team alignment. Fully editable in PowerPoint, Google Slides, Keynote, and Canva.


28 slides
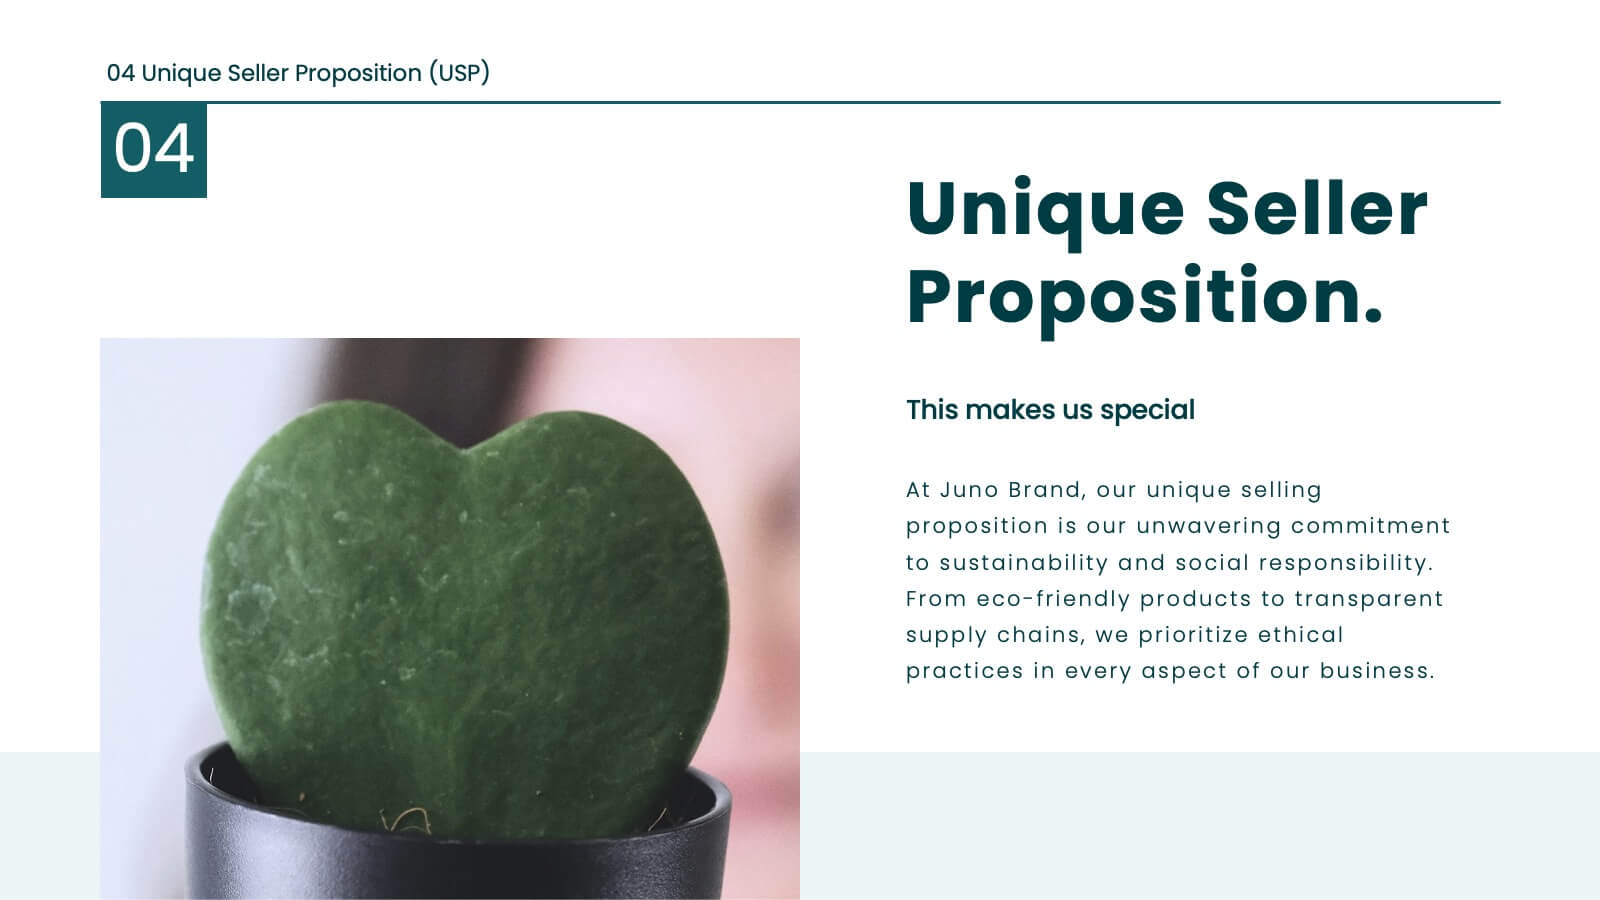
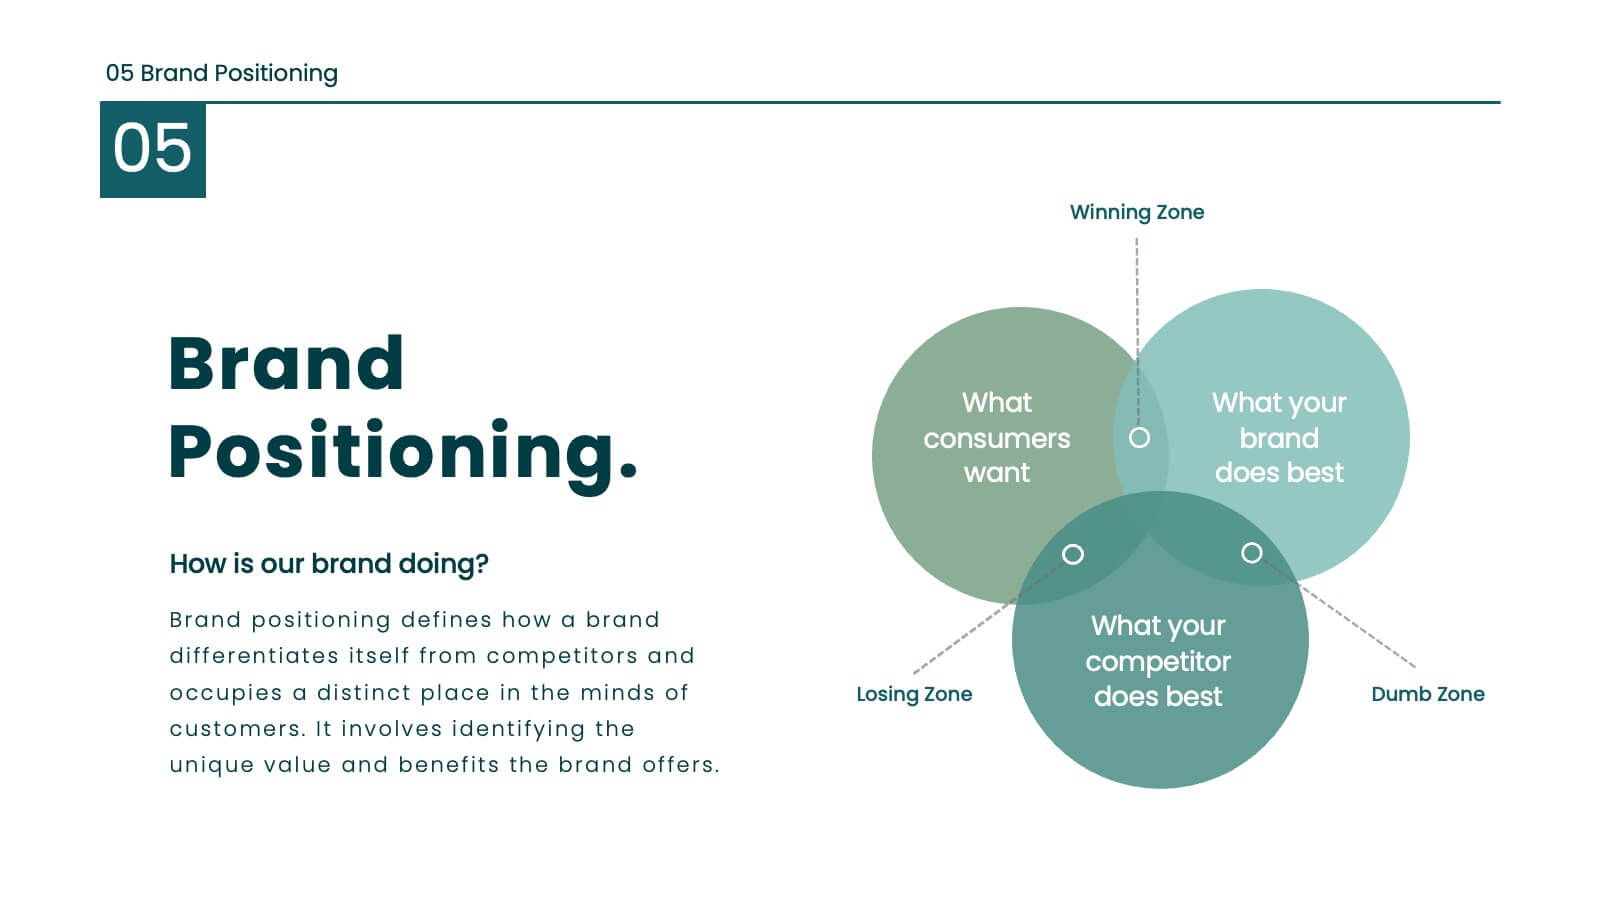
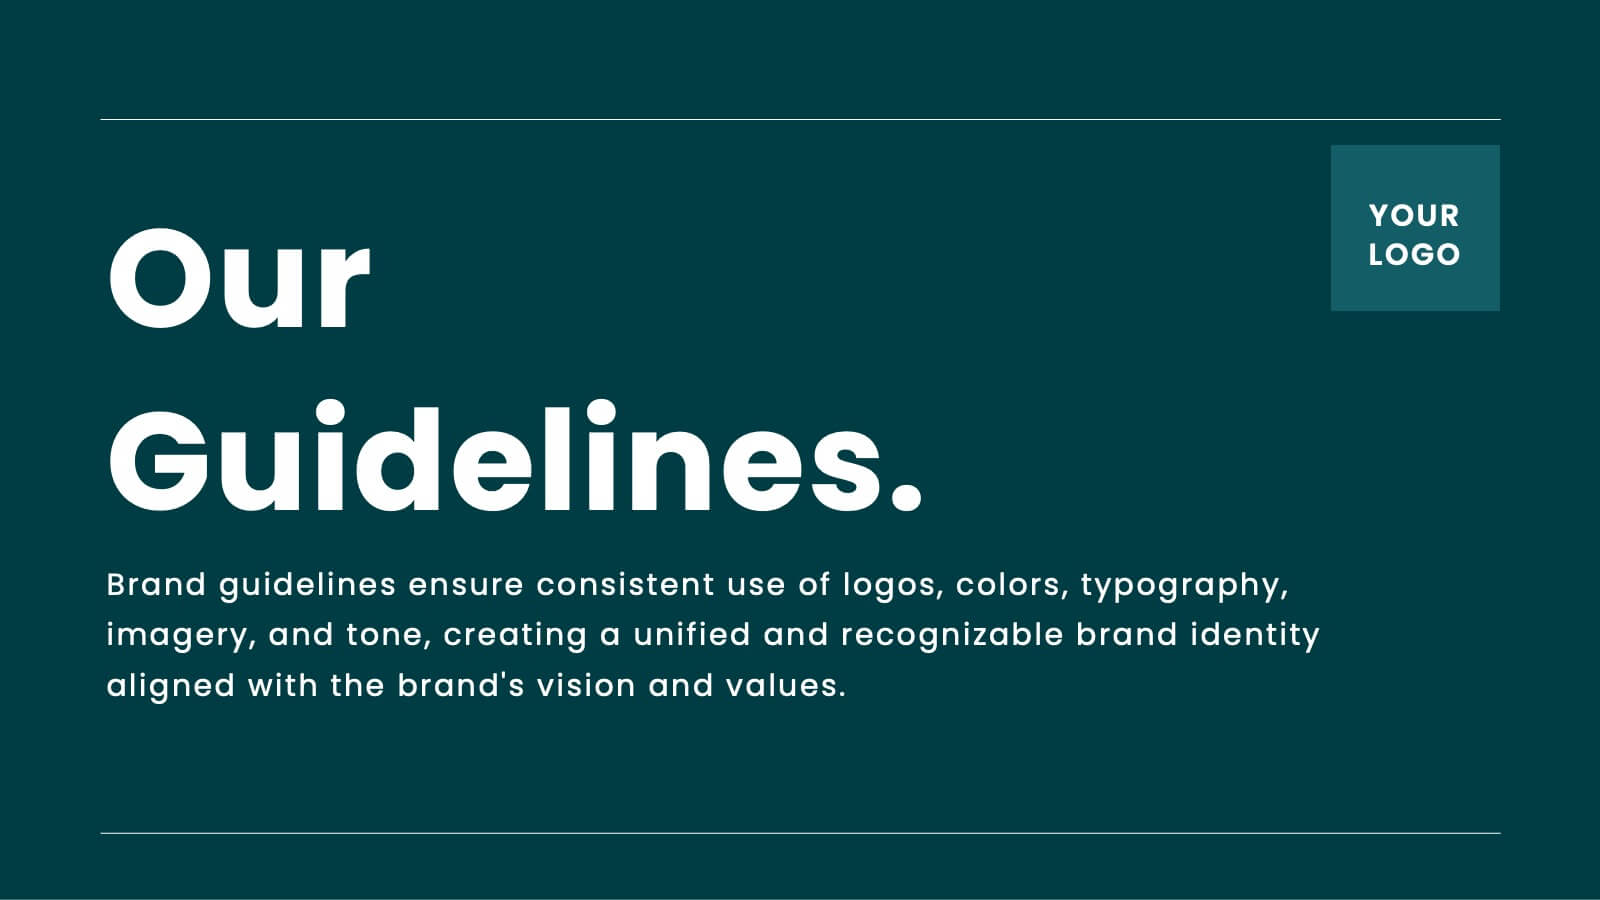
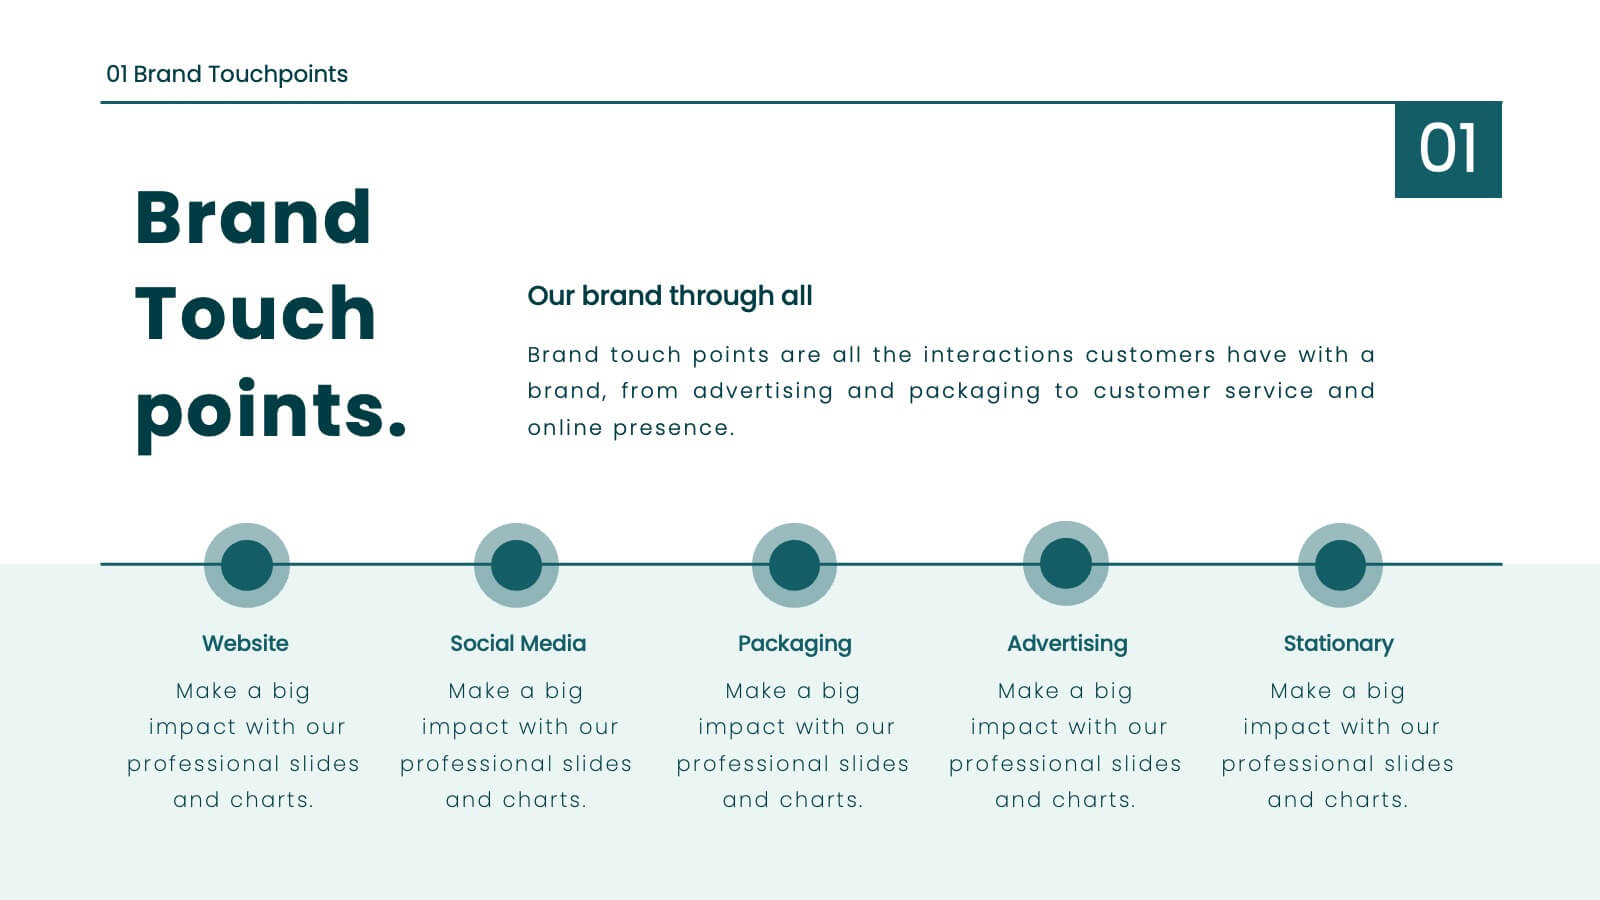
Juno Brand Guidelines Proposal Presentation
Define your brand's identity with this comprehensive, stylish presentation template. Perfect for detailing brand guidelines, vision, mission, and market analysis, it features a clean design with a professional layout. Highlight key elements like color palettes, typography, and unique selling propositions to ensure consistency and clarity. Compatible with PowerPoint, Keynote, and Google Slides, it’s ideal for any platform.


5 slides
Cybersecurity Threat Analysis Presentation
Stay one step ahead with this bold, eye-catching slide design that makes complex cyber risk insights clear and easy to present. This layout helps you break down key threats, vulnerabilities, and security actions in a clean visual structure. Fully compatible with PowerPoint, Keynote, and Google Slides.


5 slides
Harvey Ball Rating System Overview Presentation
Visualize performance ratings or feature comparisons with the Harvey Ball Rating System Overview Presentation. This template uses vertical bar visuals combined with Harvey ball icons to communicate progress, satisfaction, or status across four key areas. Clean, intuitive, and ideal for executive summaries or status dashboards. Fully editable and compatible with PowerPoint, Keynote, and Google Slides.


24 slides
Djinn Brand Identity Presentation
Unleash the power of your brand with this sleek and modern presentation template! From brand identity components to target audience personas, this template covers everything you need to craft a cohesive and compelling brand strategy. Whether showcasing brand guidelines or success stories, it’s designed for maximum clarity and impact. Compatible with PowerPoint, Keynote, and Google Slides for effortless presentations.


4 slides
Corporate Hierarchy Levels Diagram Presentation
Visualize organizational structures clearly with this Corporate Hierarchy Levels Diagram Presentation. Designed for showcasing leadership flow, team divisions, or reporting relationships, each slide features a simple tiered layout with editable icons and placeholders. Great for business planning, team introductions, or org chart overviews. Fully customizable in PowerPoint, Keynote, Canva, and Google Slides.


4 slides
Layered Pyramid Structure Diagram Presentation
Break down your data into visual layers with this Layered Pyramid Structure Diagram presentation. Ideal for showing proportions, hierarchies, or step-based processes, each pyramid tier is color-coded and labeled with editable titles and percentage values. Fully customizable in Canva, PowerPoint, and Google Slides to match your business or educational needs.


5 slides
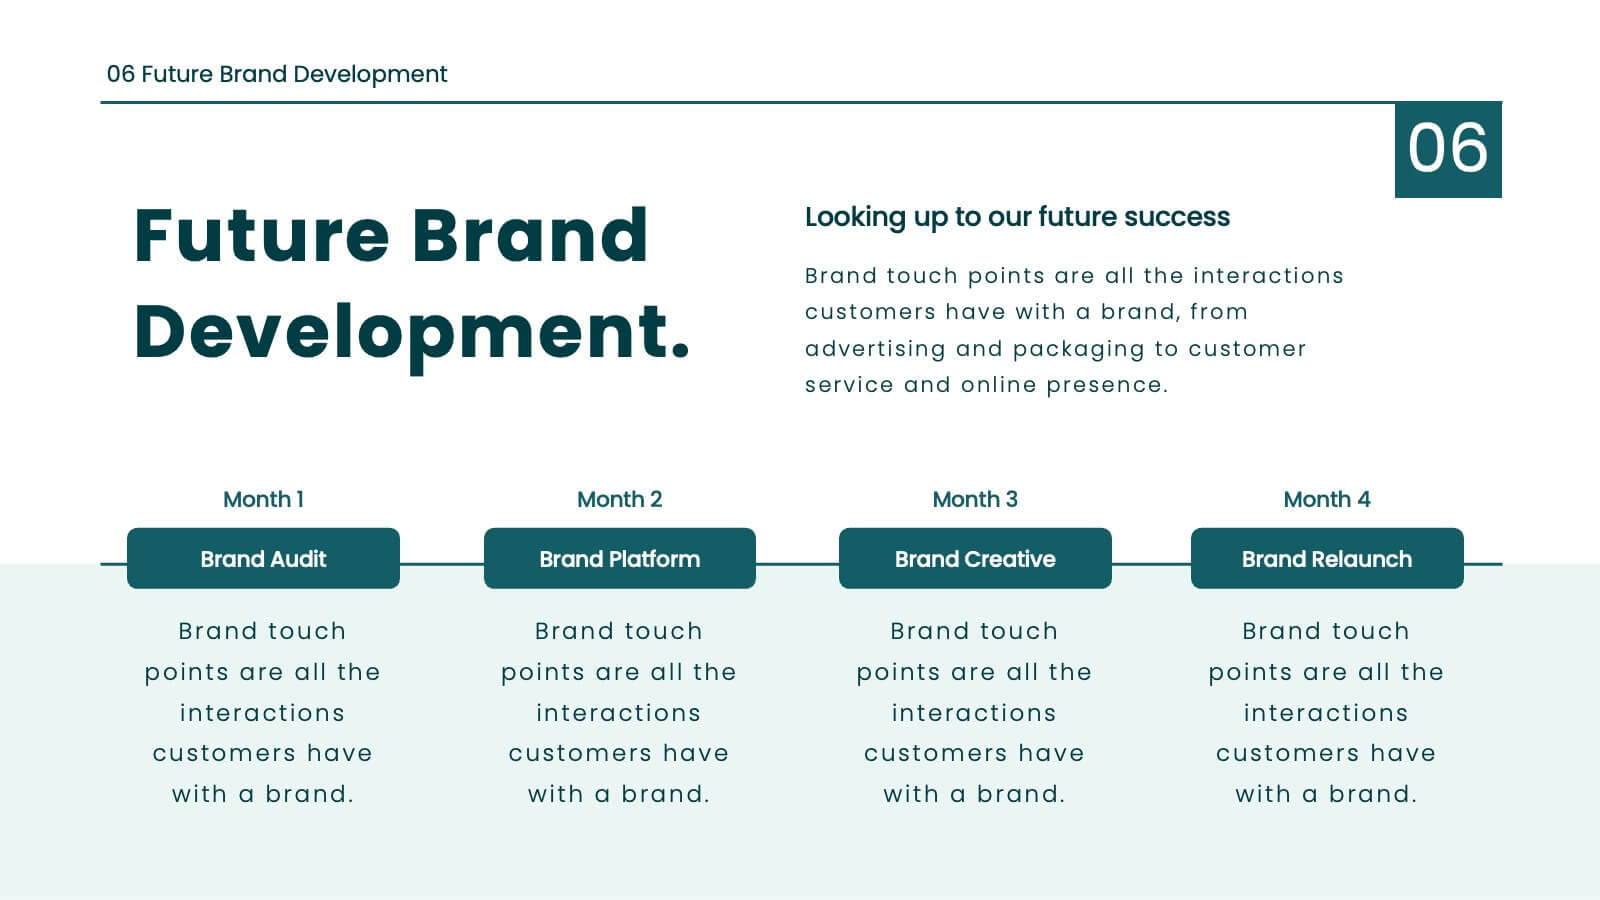
Training and Development Onboarding
Streamline your employee learning journey with the Training and Development Onboarding Presentation. This modern, five-step roadmap uses a wave-style flow from A to E, allowing you to break down each stage of training with matching step labels and title placeholders. Ideal for HR professionals, team leaders, and onboarding managers, it’s perfect for introducing structured learning, role-specific training, or compliance modules. Compatible with PowerPoint, Keynote, and Google Slides, and fully editable to match your brand style.


7 slides
Aviation Terms Infographic
Take flight with our aviation terms infographic, designed with a serene palette of white, blue, and hints of orange that echo the hues of the sky. This meticulously crafted infographic decodes the intricate jargon of the aviation world, making it a breeze for enthusiasts, trainees, and even seasoned aviators to grasp. Ideal for flight schools, airline training programs, and aviation seminars, this infographic simplifies complex terminologies with ease. With full compatibility across PowerPoint, Keynote, and Google Slides, sharing your knowledge of the skies has never been more accessible or visually appealing.


6 slides
North America Sales Distribution Presentation
Showcase regional performance clearly with the North America Sales Distribution Presentation. This slide combines a clean bar chart and a regional map to help visualize sales data across key areas. Ideal for performance reviews, strategy meetings, or investor updates. Fully editable in Canva, PowerPoint, and Google Slides.