


Features
- 5 Unique slides
- Fully editable and easy to edit in Microsoft Powerpoint, Keynote and Google Slides
- 16:9 widescreen layout
- Clean and professional designs
- Export to JPG, PDF or send by email


Do you have any questions?
Recommend


20 slides
Faelight Project Proposal Presentation
A professional project proposal template for showcasing company overview, objectives, scope of work, timelines, and budget breakdowns. Includes sections for client testimonials, pricing structures, and risk mitigation strategies. Fully customizable for various industries and ideal for pitching new projects. Compatible with PowerPoint, Keynote, and Google Slides for seamless presentations.


5 slides
Modern Business Pitch Presentation
Stand out in any meeting with a sharp, minimalist design that brings your business story to life. This presentation is perfect for outlining goals, showcasing data, and pitching ideas with confidence. Fully editable and compatible with PowerPoint, Keynote, and Google Slides for easy, professional customization.


6 slides
1-Page Executive Summary Slide Presentation
Bring clarity to complex updates in a single, colorful layout designed to keep your audience engaged from start to finish. This clean and modern slide breaks down key messages into six distinct points, making it easy to showcase progress, milestones, or strategies. Fully compatible with PowerPoint, Keynote, and Google Slides.


5 slides
Circular Wheel for Process Flow
Visualize five interconnected stages or phases in a clean, circular layout. Ideal for presenting workflows, continuous cycles, or recurring business processes with clarity and structure. Easily customizable in PowerPoint, Keynote, and Google Slides to match your project needs.


6 slides
Data-Driven Decision Making Presentation
Showcase your data-to-action process with this clean, step-by-step layout. Ideal for illustrating analytics workflows, this template features five connected stages with modern icons and clear labeling. Perfect for business, tech, or strategy presentations. Fully editable in Canva, PowerPoint, and Google Slides to match your branding and communication needs.


5 slides
Financial Budget Infographics
Financial goals refer to specific objectives and targets that individuals or businesses set to manage their finances effectively and achieve financial success. These vertical infographics are designed to help individuals and businesses effectively present their financial budgets and plans. Whether you're a financial analyst or a business owner, this template is perfect for conveying complex financial information in a clear and concise manner. These infographics provide an overview of the budget, showcasing key financial goals, total income, and total expenses. This features visuals to help users set and track financial goals.

21 slides
Juventas Product Roadmap Presentation
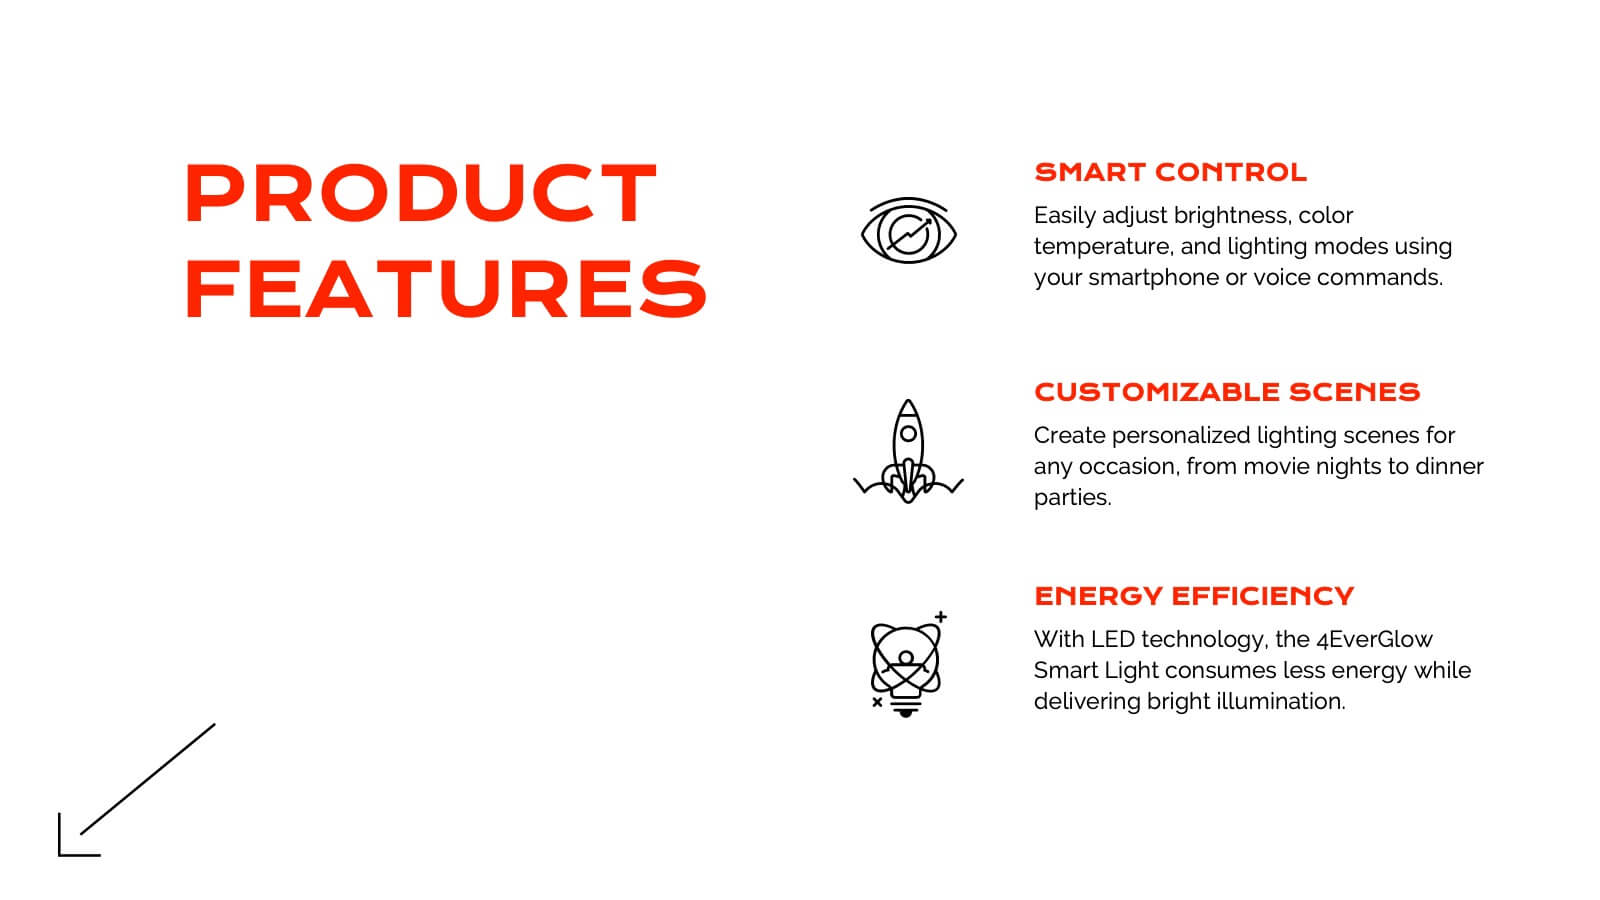
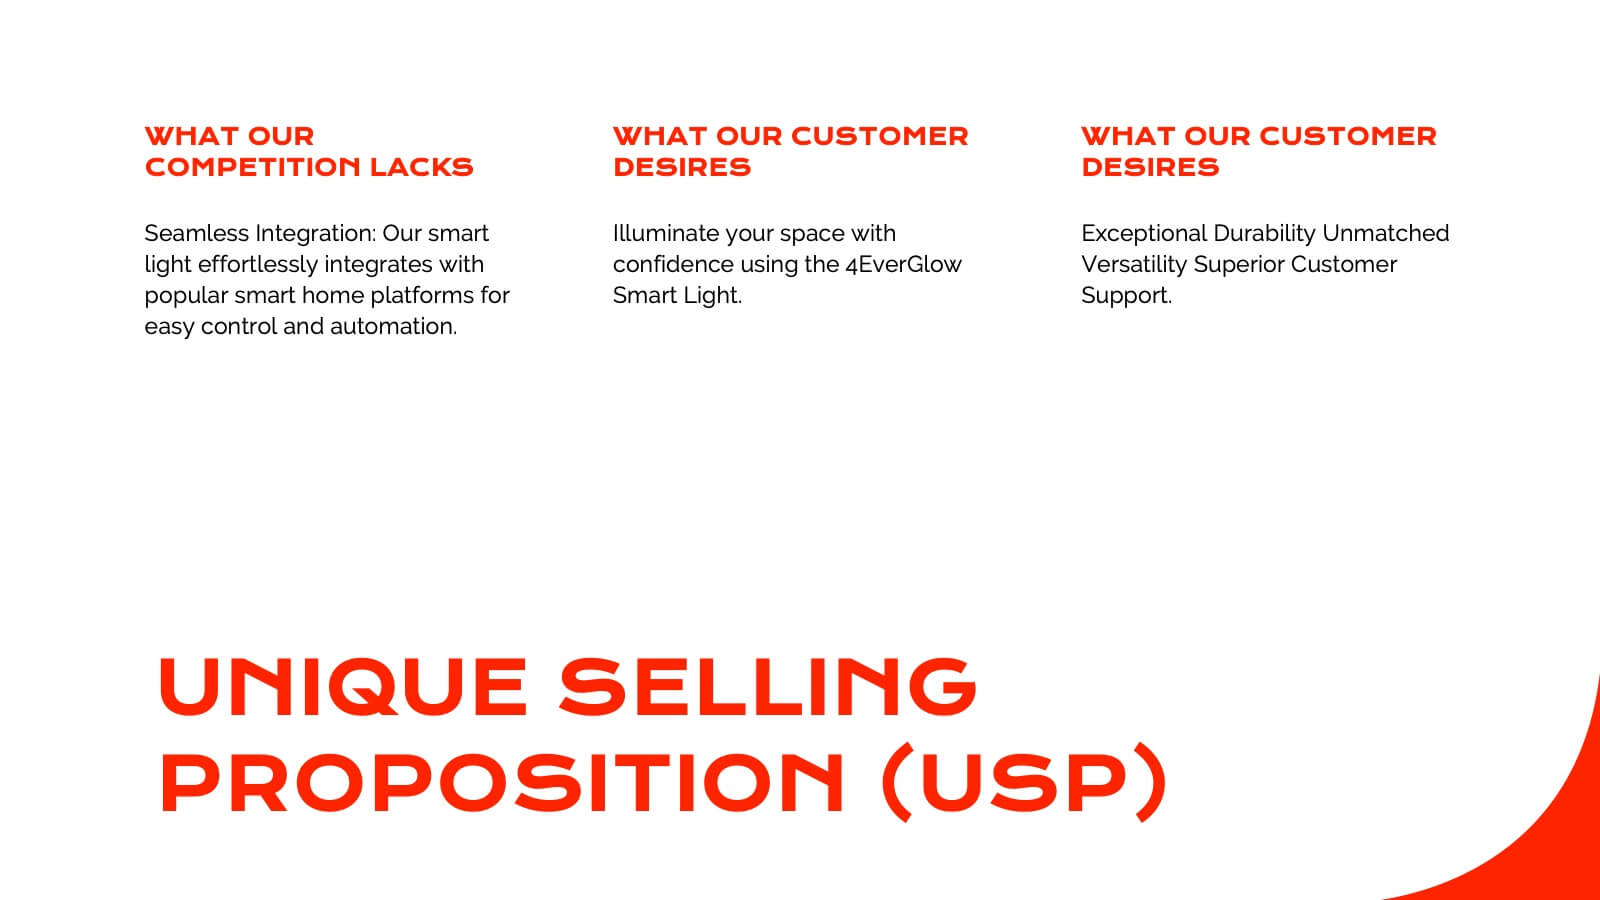
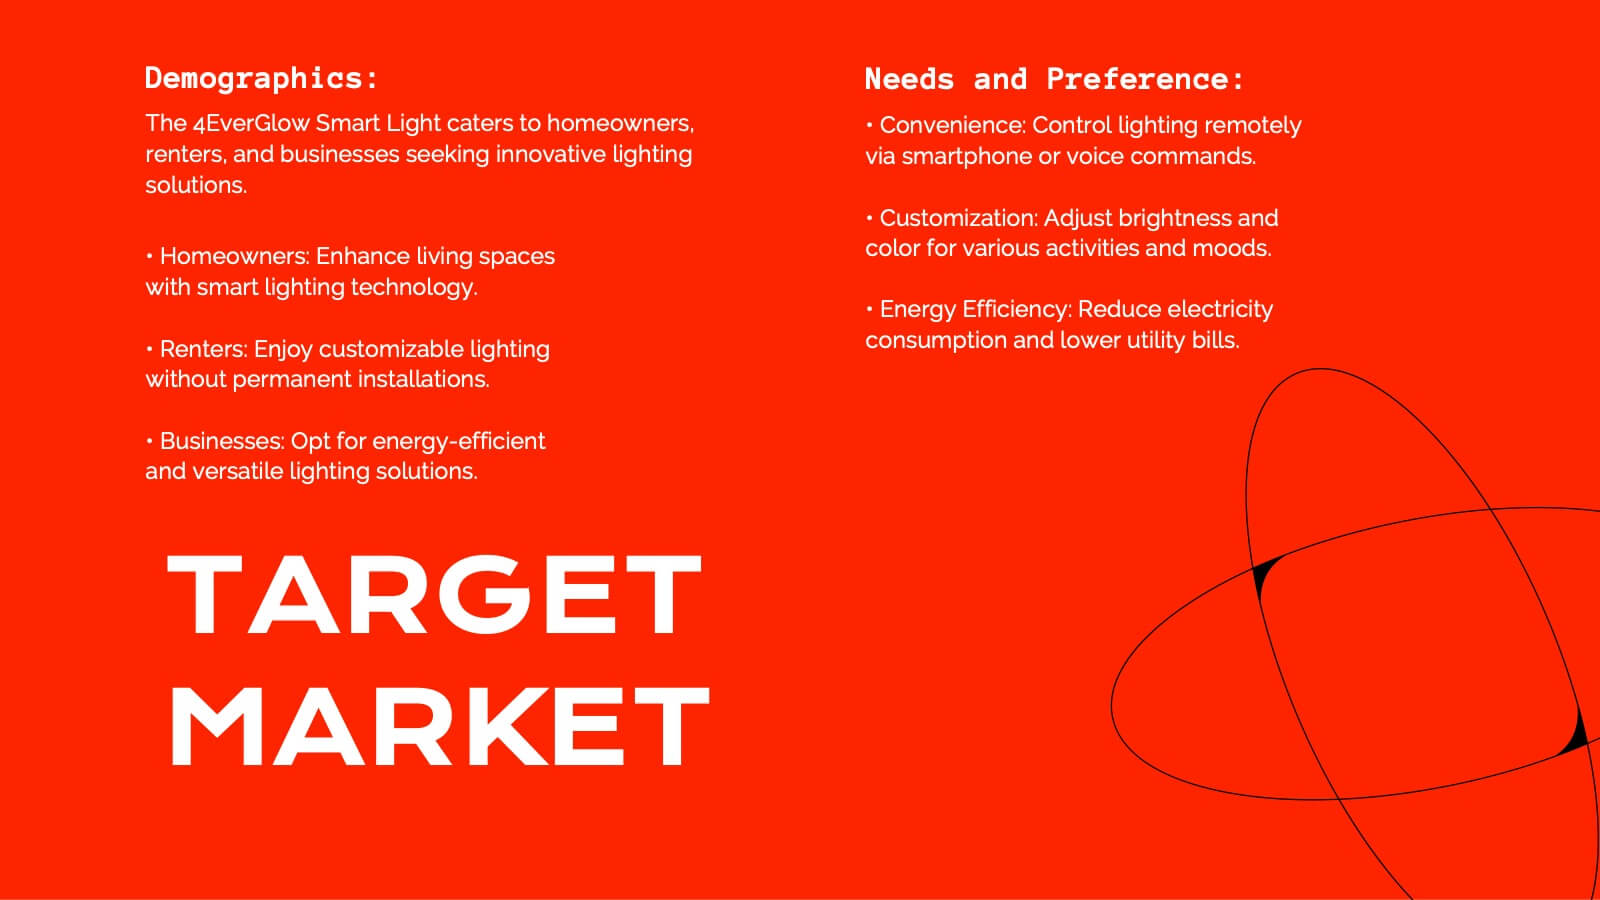
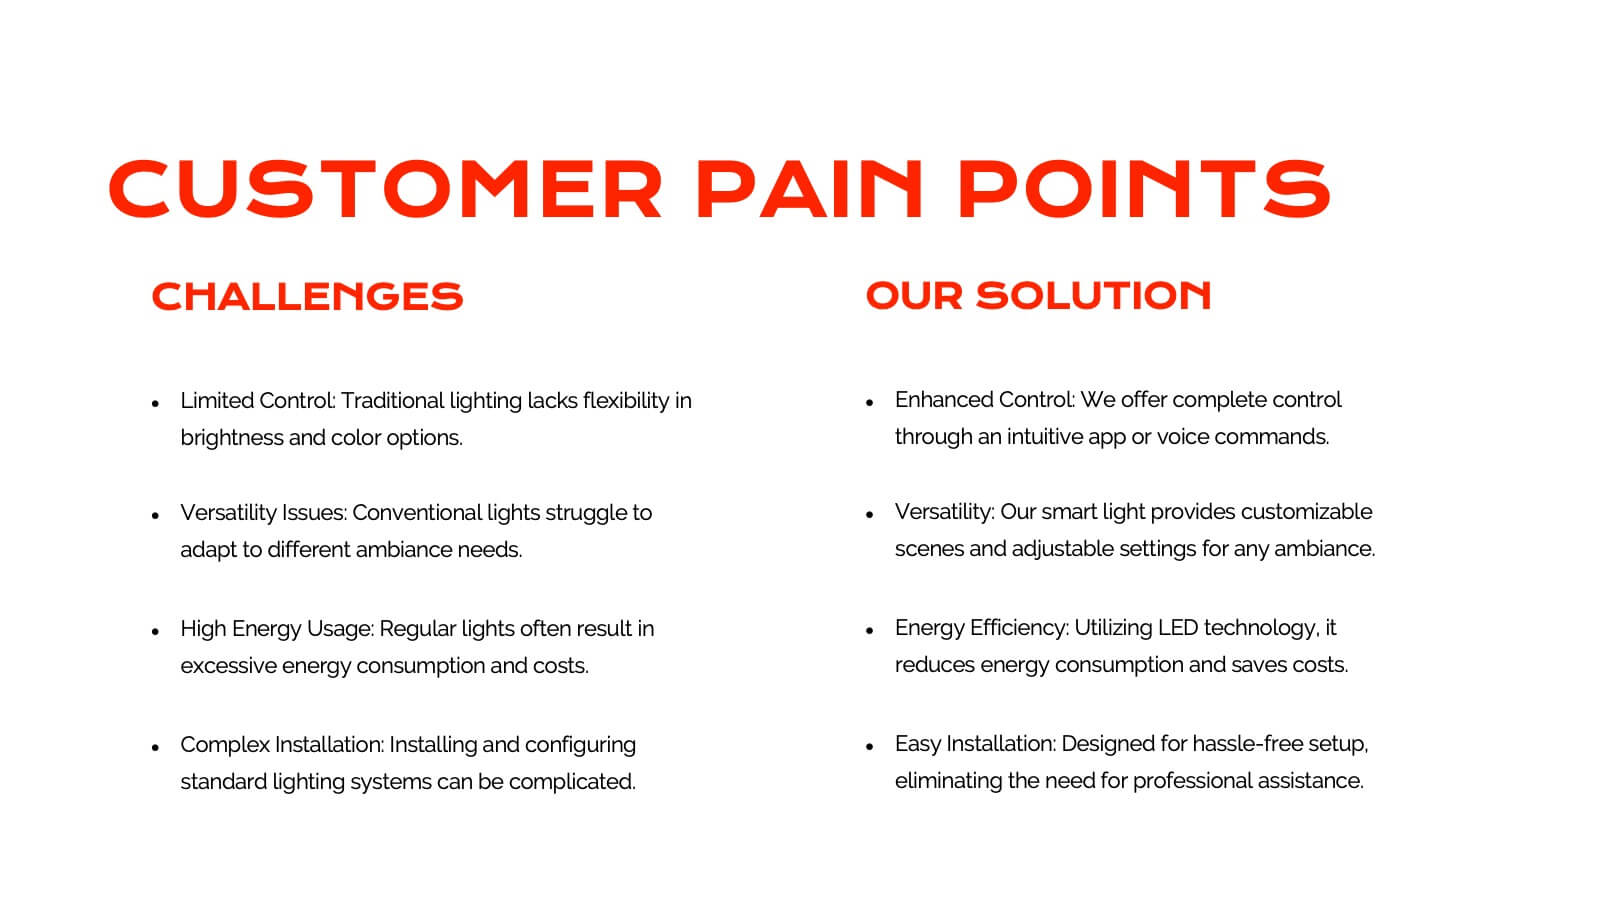
Get ready to dazzle your audience with a visually striking presentation that takes them through the entire product journey! This template covers essential areas such as product features, target market analysis, and competitive positioning. With its sleek, modern design, it's perfect for capturing attention and delivering clear information. Compatible with PowerPoint, Keynote, and Google Slides for effortless use across platforms.


5 slides
Human-Centered Design Thinking Strategy
Showcase empathy-driven innovation with the Human-Centered Design Thinking Strategy Presentation. This slide visually emphasizes user-focused thinking by combining a head silhouette with colorful puzzle icons representing each strategic step. Ideal for UX strategy meetings, product development pitches, and innovation workshops, it includes five editable segments labeled A to E, each with matching text fields to explain your core insights or process stages. Compatible with PowerPoint, Keynote, and Google Slides for seamless editing and presentation.


6 slides
Customer Targeting Strategy Overview Presentation
Present your customer approach clearly with this Customer Targeting Strategy Overview presentation. Featuring a central persona with speech bubble-style segments, this layout is perfect for showcasing targeting methods, segmentation insights, or buyer personas. Ideal for marketers and strategists. Fully editable in Canva, PowerPoint, and Google Slides for easy customization.


8 slides
Educational Learning and School Management Presentation
Enhance academic planning with the Educational Learning and School Management Diagram. This structured template visualizes key processes in education, ensuring a streamlined approach to school administration and curriculum development. Ideal for educators, administrators, and policymakers, it offers a clear, customizable layout to communicate strategies effectively. Fully compatible with PowerPoint, Keynote, and Google Slides.


6 slides
World Map Regions Infographic
The world can be divided into several regions based on various factors such as geography, culture, politics, and economics. This presentation template showcases different regions of the world. It provides an overview of the continents, countries, and key geographic features, allowing viewers to gain a better understanding of global geography and the distribution of regions. The visually appealing design and concise information make it easy for viewers to grasp the geographic layout of the world and appreciate the diversity of regions. Compatible with Powerpoint, Keynote, and Google Slides.


8 slides
Market Expansion Strategies in North America Map Presentation
Visualize your market growth plans with this strategic North America map slide. Highlight four regional expansion points with vibrant markers and customizable labels. Perfect for showcasing entry strategies, regional goals, or sales plans. Fully editable in PowerPoint, Keynote, and Google Slides—ideal for professional business and marketing presentations.


26 slides
Ethical Business Practices Presentation
Promote integrity with our Ethical Business Practices presentation template, suitable for PowerPoint, Keynote, and Google Slides. This essential tool is crafted for business leaders, compliance officers, and educators who aim to reinforce the importance of ethics in the corporate environment. Our template facilitates a clear understanding of ethical standards in business operations. It includes slides on ethical decision-making, corporate governance, social responsibility, and the long-term benefits of maintaining high ethical standards. With customizable layouts, you can present real-world scenarios, ethical frameworks, and company policies that illustrate your commitment to ethical conduct. This SEO-optimized template is key for reaching audiences interested in building trust and credibility through responsible business practices. Use this template to lead discussions on ethics, influence corporate culture positively, and showcase how ethical behavior is not just right but also beneficial for business success.


6 slides
Leadership Development Infographics
Foster leadership growth with our Leadership Development infographic template. This template is fully compatible with popular presentation software like PowerPoint, Keynote, and Google Slides, allowing you to easily customize it to illustrate and communicate various aspects of leadership development. The Leadership Development infographic template offers a visually engaging platform to explore and explain the principles, strategies, and practices related to nurturing leadership skills within individuals and organizations. Whether you're an HR professional, business leader, educator, or aspiring leader, this template provides a user-friendly canvas to create informative presentations and educational materials. Enhance your knowledge of Leadership Development with this SEO-optimized infographic template, thoughtfully designed for clarity and ease of use. Customize it to highlight key leadership competencies, training methods, coaching approaches, and the impact of effective leadership on organizational success. Ensure that your audience gains valuable insights into the world of leadership development. Start crafting your personalized infographic today to empower leadership growth.


26 slides
Branding Agency Company Profile Presentation
Branding for a digital agency is essential for creating a strong and memorable identity that sets it apart from competitors and resonates with its target audience. This presentation is a professional template, designed to showcase the expertise and capabilities of a branding agency. With its modern and sleek design, this presentation is perfect for introducing the agency's services, achievements, and client success stories to potential clients, partners, or investors. This template is perfect to showcase successful branding projects and campaigns, emphasizing the challenges faced, the creative solutions employed, and the results achieved for clients.


5 slides
Corporate Ethics and Legal Guidelines
Clearly outline company policies and ethical standards with this organized and professional slide. Featuring a checklist-style layout with customizable categories, it’s ideal for corporate trainings, compliance presentations, and HR onboarding. Fully editable and compatible with PowerPoint, Keynote, and Google Slides.


21 slides
Mythspire Market Research Presentation
This market research template offers a clean design for presenting objectives, data collection, analysis, and findings. Perfect for showcasing research methodologies, visualizations, and actionable recommendations. Fully customizable and ideal for business or academic presentations. Compatible with PowerPoint, Keynote, and Google Slides.