


Features
- 5 Unique slides
- Fully editable and easy to edit in Microsoft Powerpoint, Keynote and Google Slides
- 16:9 widescreen layout
- Clean and professional designs
- Export to JPG, PDF or send by email


Do you have any questions?
Recommend


5 slides
Cognitive Behavioral Therapy Overview Presentation
Help your audience connect the dots between thoughts, feelings, and behaviors with this clean, illustrated layout. Designed to simplify complex mental health concepts, this CBT infographic template is perfect for educators, coaches, or therapists. Fully editable and compatible with PowerPoint, Keynote, and Google Slides for effortless customization.


20 slides
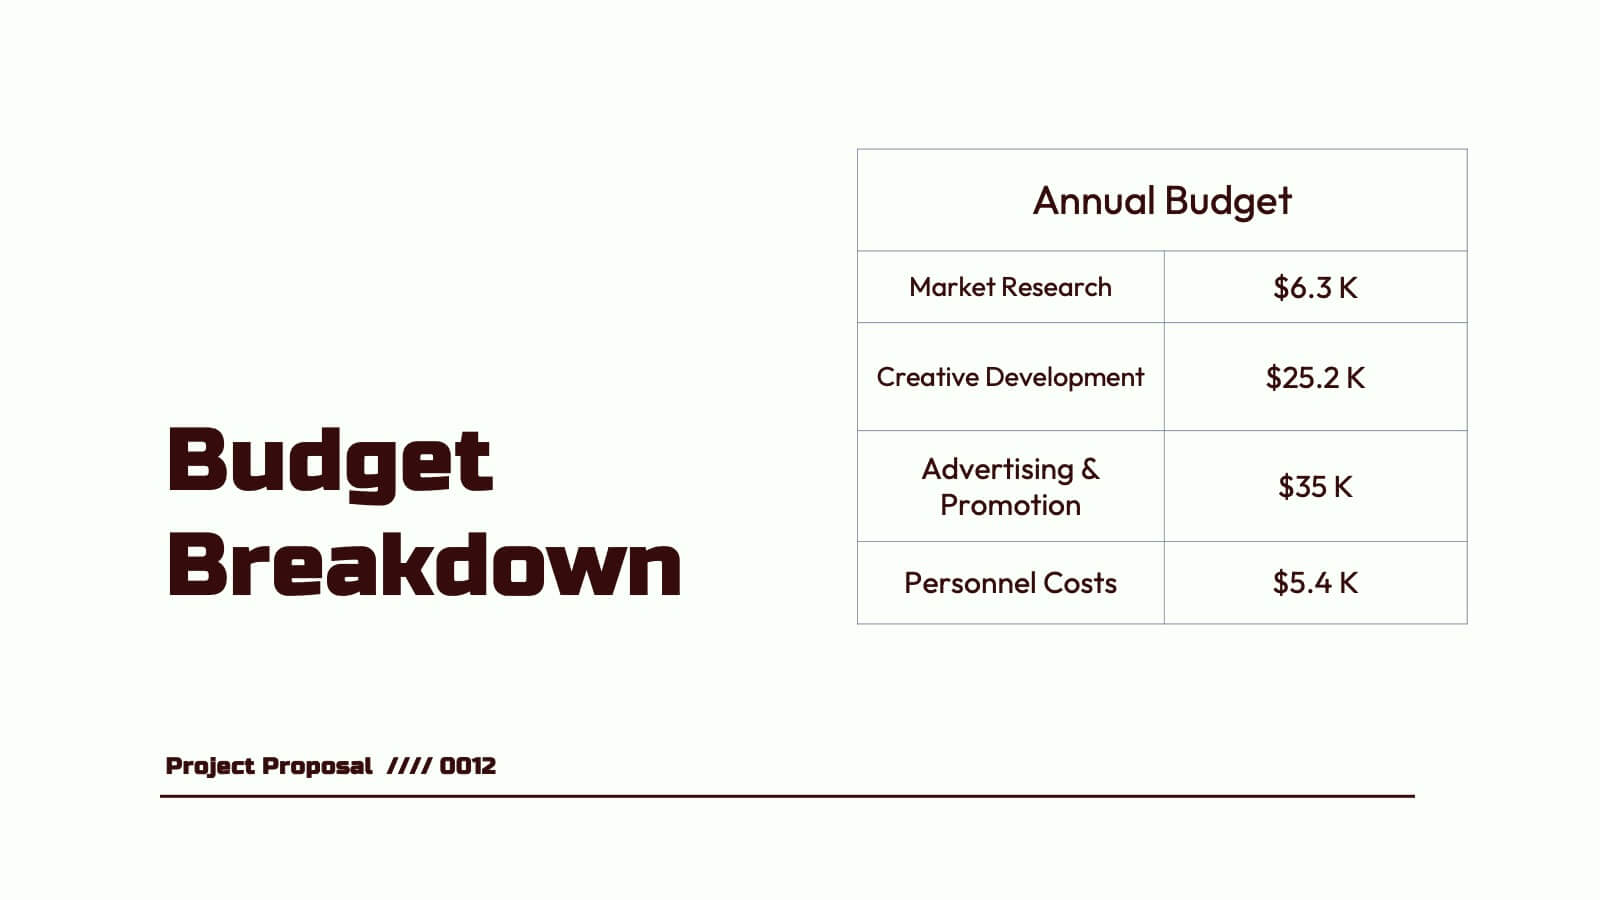
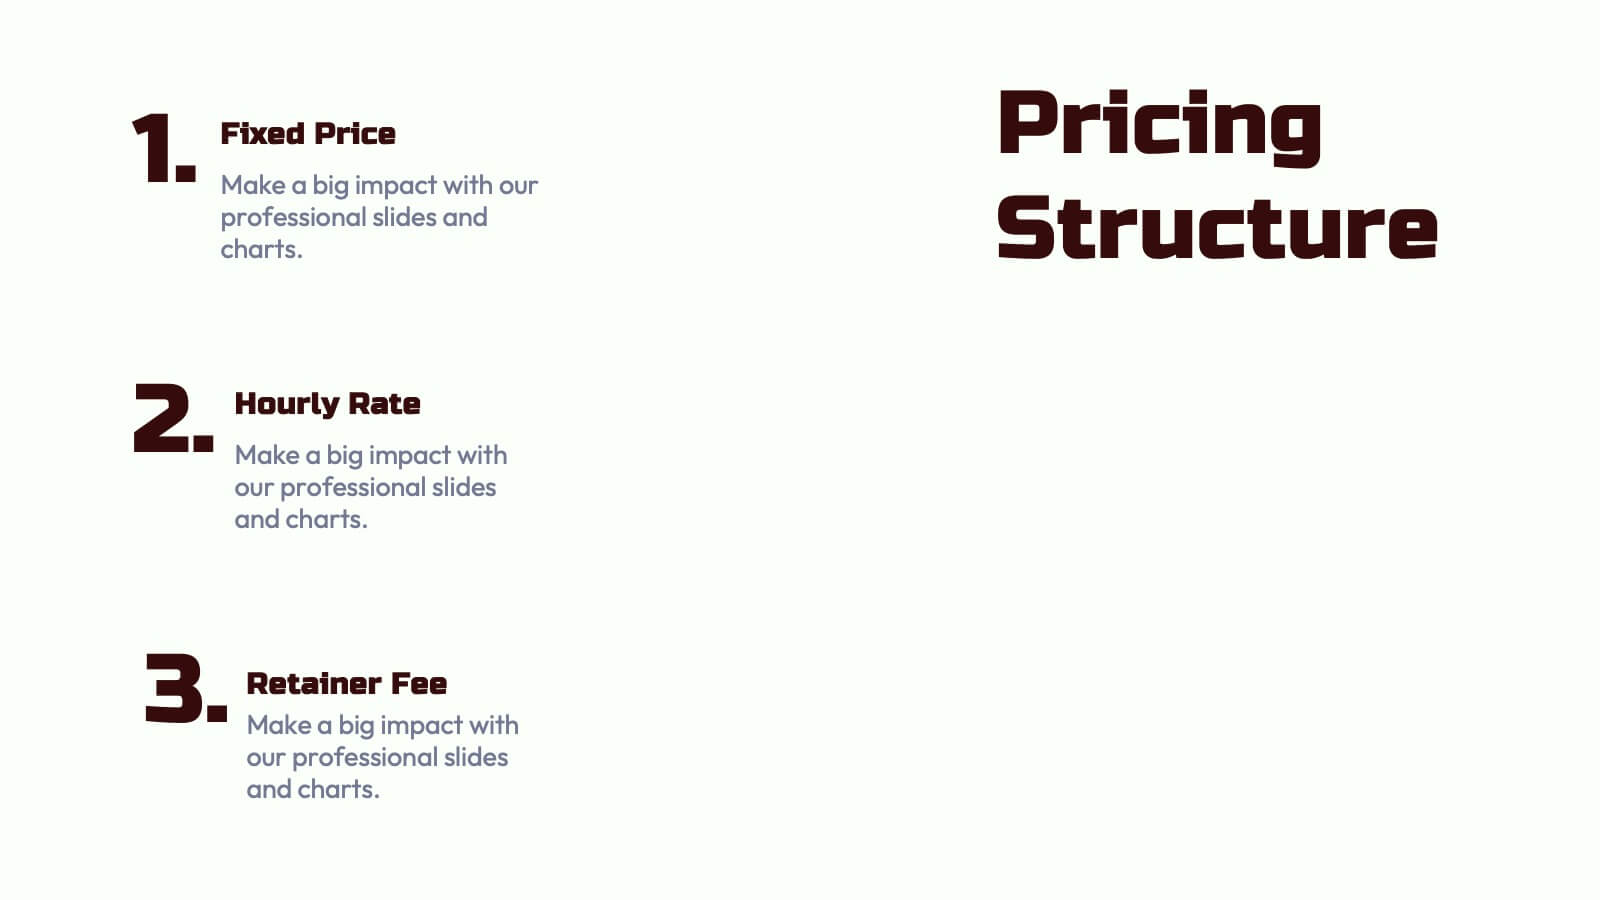
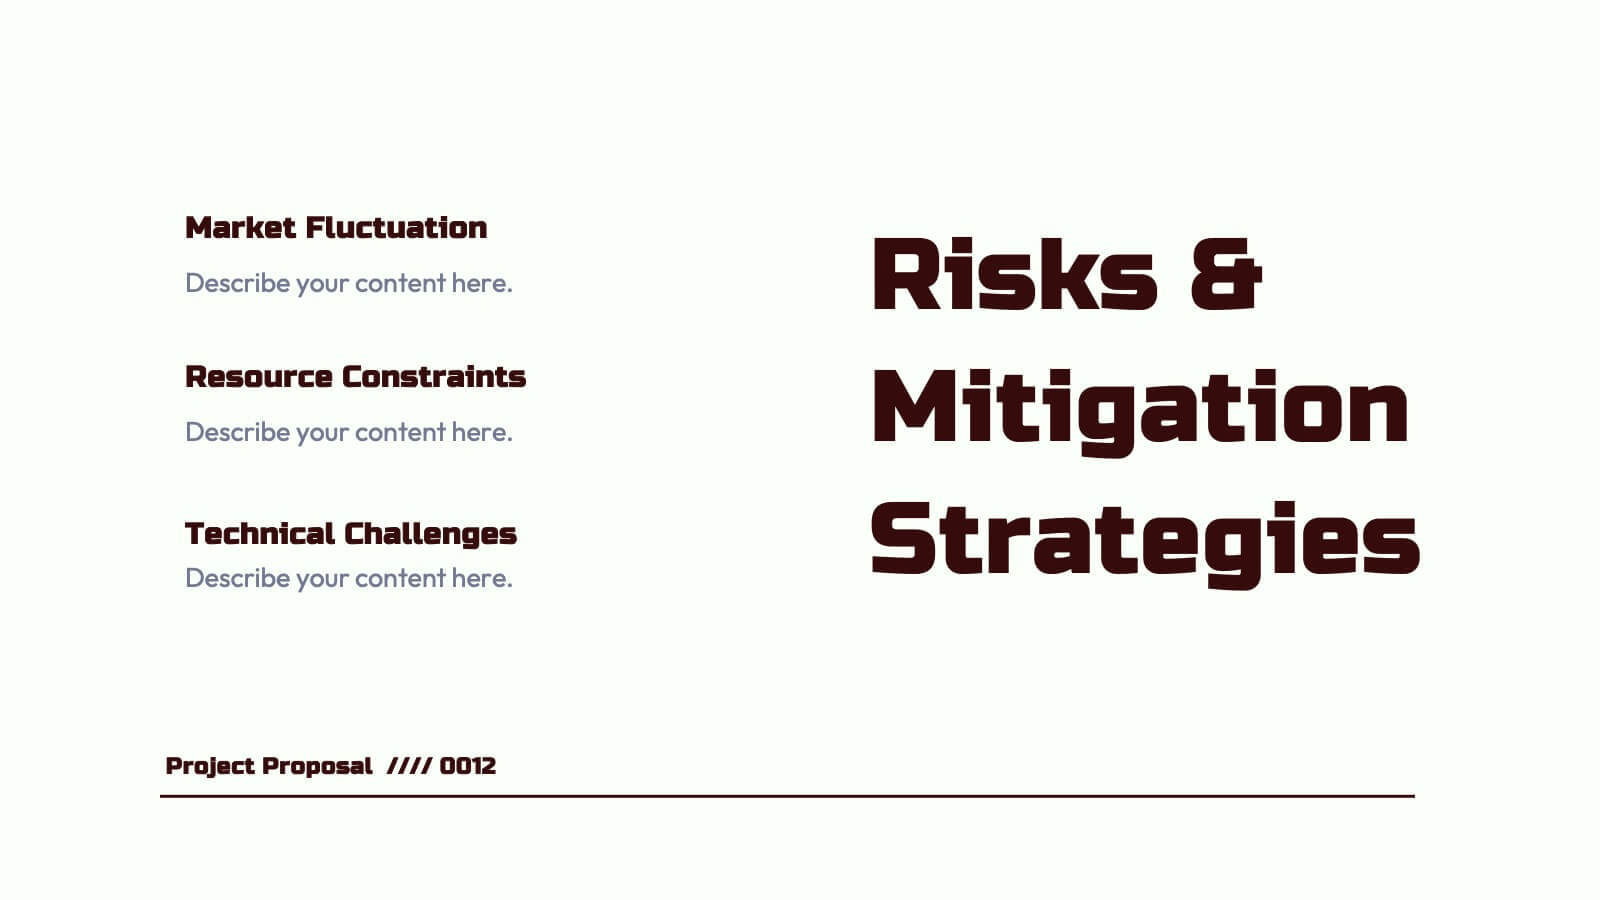
Nebula Project Proposal Presentation
Create a compelling project proposal with this structured, professional template! It includes sections for problem statements, proposed solutions, goals, timelines, and pricing. Perfect for organizing your ideas clearly and professionally, it's fully customizable and compatible with PowerPoint, Keynote, and Google Slides. This template makes it easy to present your proposals effectively and win clients.


22 slides
Tidal Research Findings Report Presentation
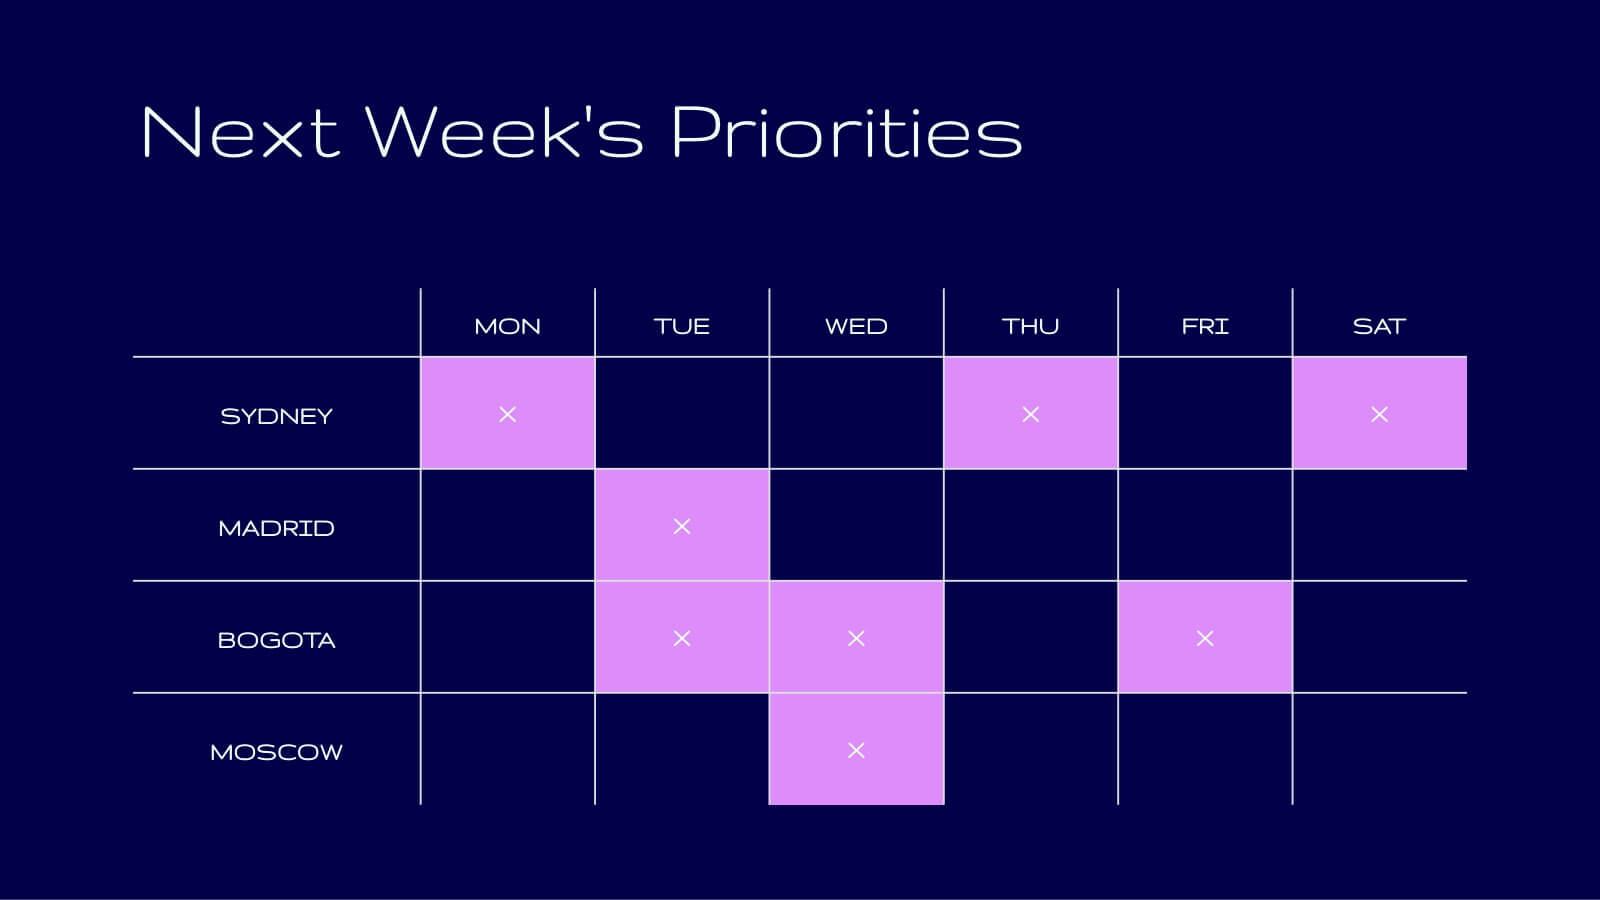
Deliver your research findings with impact using this sleek and modern report template! It covers key highlights, performance metrics, project progress, and competitor insights, making it ideal for clear, professional presentations. Perfect for summarizing challenges, solutions, and strategic initiatives. Compatible with PowerPoint, Keynote, and Google Slides for seamless reporting.


4 slides
HR Workflow and Policy Overview Presentation
Streamline organizational processes with the HR Workflow and Policy Overview template. Featuring a clear flowchart design, this layout is ideal for mapping HR procedures, compliance steps, and policy implementation. Fully customizable in Canva, PowerPoint, and Google Slides to align with your company’s branding and human resources management needs.


30 slides
Fusoria Brand Guidelines Proposal Presentation
Build a strong and cohesive brand identity with this sleek and professional brand guidelines proposal presentation. Covering essential topics like typography, color palettes, visual direction, and branding principles, this template helps you define and communicate your brand’s essence. Fully customizable and compatible with PowerPoint, Keynote, and Google Slides for a seamless presentation experience.


7 slides
KPI Sales Dashboard Infographic
A KPI (Key Performance Indicator) Dashboard is a visual tool or interface that provides a real-time snapshot of an organization's or a specific department's key performance indicators. Empower your sales team with our KPI sales dashboard infographic template. This visually striking and insightful template allows you to present key performance indicators and metrics in an easily understandable and engaging format. Compatible with Powerpoint, Keynote, and Google Slides. This template will transform your sales data into a dynamic, easy-to-understand dashboard, helping your team stay informed, motivated, and focused on achieving sales targets.


7 slides
Real Estate Infographic Presentation Template
Real estate is a form of property that can be used for residential, commercial or industrial purposes, and typically includes any resources on the land such as water or minerals. This template is especially useful for real estate agents and brokers who can use it to better understand the real estate industry. This template comes with Infographics that are a great way to explain complex ideas and trends in a simple, easy-to-understand way, and can help your clients better understand as well. This template displays data visually, which will allow your audience to grasp complex ideas quickly.


6 slides
McKinsey Model for Business Optimization Presentation
Illustrate business alignment with the McKinsey Model for Business Optimization Presentation. This hexagonal diagram clearly maps out the seven interdependent elements of the 7S Framework—Structure, Strategy, Systems, Skills, Staff, Style, and Shared Values—at the core. Ideal for strategy consultants, executive teams, and transformation leaders. Editable in PowerPoint, Keynote, Canva, and Google Slides.


4 slides
Market Expansion Planning with Blue Ocean Presentation
Visualize your growth journey with this two-step strategic layout. Ideal for presenting current positioning and future market opportunities using Blue Ocean thinking. Each step is illustrated with bold icons and color-coded nodes. Fully editable in PowerPoint, Keynote, and Google Slides—perfect for business development, strategy sessions, and executive presentations.


5 slides
Meet the Team Layout Presentation
Meet the team with a layout that feels fresh, upbeat, and effortlessly clear. This presentation helps you introduce key members, highlight roles, and showcase expertise in a clean, engaging format perfect for leadership updates or project kickoffs. Fully editable and compatible with PowerPoint, Keynote, and Google Slides.


5 slides
Analytical Chimestry Infographics
Analytical Chimestry Infographics is a bold, colorful, and modern presentation


6 slides
Numeric Data Slide Layout Presentation
Bring your numbers to life with a clean, flowing visual that turns data into an easy-to-follow story. This presentation guides viewers through each step of your process, helping them understand key insights without overwhelm. Ideal for analytics, reporting, and planning. Fully compatible with PowerPoint, Keynote, and Google Slides.


4 slides
Corporate Growth and Strategy Map Presentation
Visualize your business development path with this layered strategy map. Ideal for showcasing organizational goals, strategic initiatives, and cascading growth stages. Each level is clearly structured for easy customization, making it perfect for leadership planning, corporate roadmaps, or strategic reviews in PowerPoint, Keynote, or Google Slides.


4 slides
Insurance Business Overview Presentation
Bring clarity and professionalism to your financial presentations with this sleek and modern design. Ideal for outlining key insights, policies, or service breakdowns, it visually communicates business protection and stability. Fully customizable and compatible with PowerPoint, Keynote, and Google Slides for an engaging and polished presentation experience.


8 slides
Political, Economic, Social Analysis Presentation
Highlight key external influences with the Political, Economic, Social Analysis Presentation. This clean, hexagon-based layout offers a simple yet impactful way to break down PEST factors for strategy planning, market entry, or business reports. Fully editable in PowerPoint, Canva, and Google Slides for fast, polished presentations.


6 slides
Consumer Psychology in Marketing Presentation
Unlock the secrets of customer behavior with our 'Consumer Psychology in Marketing' presentation template. Tailored for marketing professionals, this template allows you to visually dissect and present consumer insights and behaviors. Engage your audience with compelling content that's perfect for workshops or client presentations, compatible with PowerPoint, Keynote, and Google Slides.


6 slides
Branching Structure Tree Chart Presentation
Visualize ideas, processes, or team structures with the Branching Structure Tree Chart Presentation. This elegant tree diagram layout allows you to display six key points or stages branching out naturally from a central concept. Ideal for organizational charts, decision flows, or brainstorming visuals. Fully editable in PowerPoint, Keynote, and Google Slides.