


Features
- 23 Unique Slides
- Fully editable and easy to edit in Microsoft Powerpoint, Keynote and Google Slides
- 16:9 widescreen layout
- Clean and professional designs
- Export to JPG, PDF or send by email


Do you have any questions?
Recommend


10 slides
Adapting to Business Transformation Presentation
Guide your audience through change with this dynamic, step-by-step layout tailored for showcasing transformation journeys. The slide features a curved flow design with five customizable stages, perfect for visualizing digital shifts, organizational restructuring, or innovation roadmaps. Best for corporate strategists, consultants, and change managers. Fully editable in PowerPoint, Keynote, and Google Slides.


20 slides
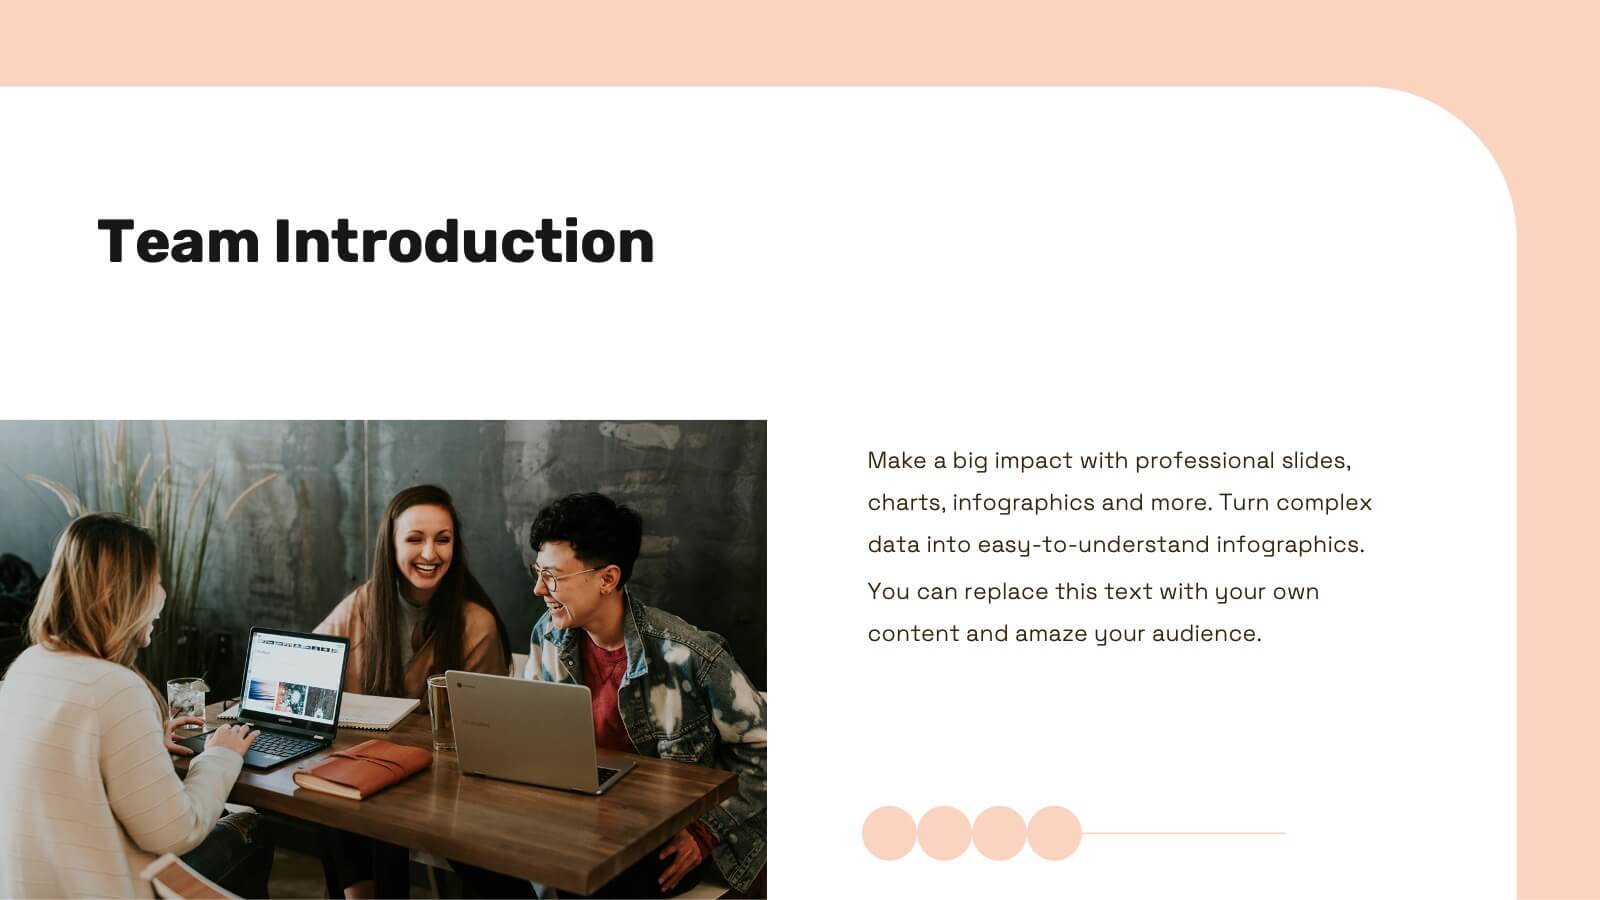
Creative Agency Presentation
Showcase your agency’s capabilities with the Magic Coat Creative Agency template. It features slides detailing team introductions, service overviews, case studies, and more. Ideal for creative agencies aiming to impress potential clients, this template supports PowerPoint, Keynote, and Google Slides, enhancing your presentation's professional appeal.


6 slides
Data Table Format Presentation
Bring clarity to your data with a clean, modern layout that helps your audience compare details at a glance. This presentation is perfect for pricing, feature breakdowns, or structured business insights, keeping information organized and easy to read. Fully compatible with PowerPoint, Keynote, and Google Slides.


26 slides
Strategic Partnership Building Presentation
Forge ahead into the world of collaboration with a presentation template designed to underscore the power of strategic partnerships. This suite of slides is the perfect toolkit for professionals seeking to illustrate the synergy between entities and the innovative outcomes of such alliances. The design is both sleek and inviting, with soft curves and a cool color palette that conveys a sense of harmony and cooperation. Highlight your organization's leaders with personalized bio slides, and utilize a range of charts and graphs to demonstrate the mutual benefits and shared objectives of your partnerships. Whether mapping out the journey of a collaboration, detailing the process of integration, or sharing success stories, these slides are created to facilitate clear and impactful communication. The template is thoughtfully adaptable to Keynote, Google Slides, and PowerPoint, ensuring your message of unity and cooperative success resonates across any platform.


6 slides
Data-Driven Decision Making with Numbers Presentation
Turn insights into action with this segmented visual template, perfect for showcasing analytics, KPIs, or data-backed strategies. The semi-pie layout organizes information into six labeled sections, making it easy to interpret at a glance. Great for business reports, research summaries, or executive dashboards. Fully editable in PowerPoint, Keynote, and Google Slides.


5 slides
Meeting Minutes and Notes Presentation
Keep every discussion organized and every detail accounted for with this clean and structured layout. Perfect for summarizing key decisions, attendees, and next steps, it helps teams capture essential meeting insights efficiently. This easy-to-edit template works flawlessly with PowerPoint, Keynote, and Google Slides for a polished professional presentation.


8 slides
Data Analytics Dashboard Slide Presentation
Turn raw data into visual insights with this clean and modern layout designed to simplify analytics reporting. Perfect for tracking performance metrics, KPIs, and progress updates, it helps make numbers easy to understand at a glance. Fully customizable and compatible with PowerPoint, Keynote, and Google Slides for effortless editing.


26 slides
Creative Programming Presentation
The process of Developing Software involves the development of everything from a simple application or web page to complex enterprise systems. Software development is a collaborative effort between developers, designers, and other stakeholders. This Creative Template is perfect for delivering presentations about the latest projects, apps and ideas. The simple layout allows you to focus on what matters most, your idea. Make your most important presentation spectacular with this template. With high-powered visual content and a smooth flow, you’ll keep your audience engaged from beginning to end!


6 slides
Search Engine Optimization Campaign Overview Presentation
Kick off your digital strategy with a clean, modern layout that makes every key insight feel connected and actionable. This presentation helps you explain campaign goals, highlight SEO priorities, and break down essential tasks in a structured, visual flow. Fully compatible with PowerPoint, Keynote, and Google Slides.


5 slides
Corporate Goal Alignment and Execution Presentation
Drive strategic clarity with this streamlined Corporate Goal Alignment and Execution slide. This template visually connects key initiatives with execution pathways and end goals, using a funnel-style layout that highlights the flow from strategic inputs to measurable outcomes. Perfect for aligning teams, reporting progress, or visualizing OKRs. Fully customizable in PowerPoint, Keynote, and Google Slides.


25 slides
Zephyrion Brand Guidelines Proposal Presentation
Build and communicate your brand effectively with this comprehensive brand strategy presentation! It features sections like brand voice, positioning, competitive landscape, and performance metrics, helping you align your messaging and identity. Ideal for internal brand workshops or client presentations, this template works seamlessly with PowerPoint, Keynote, and Google Slides.
22 slides
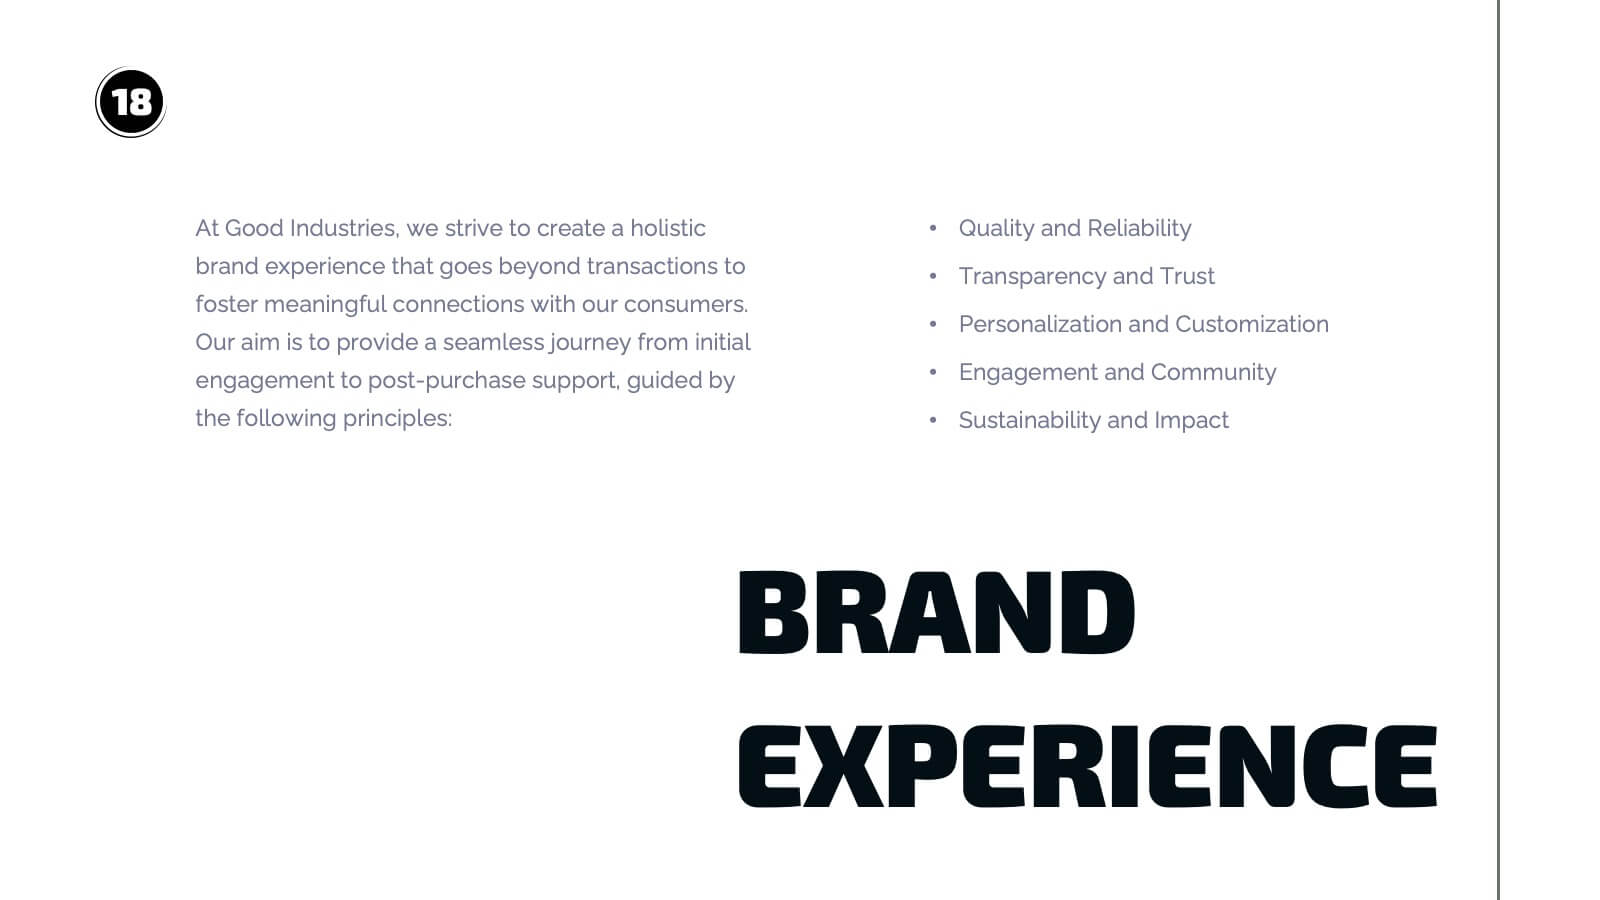
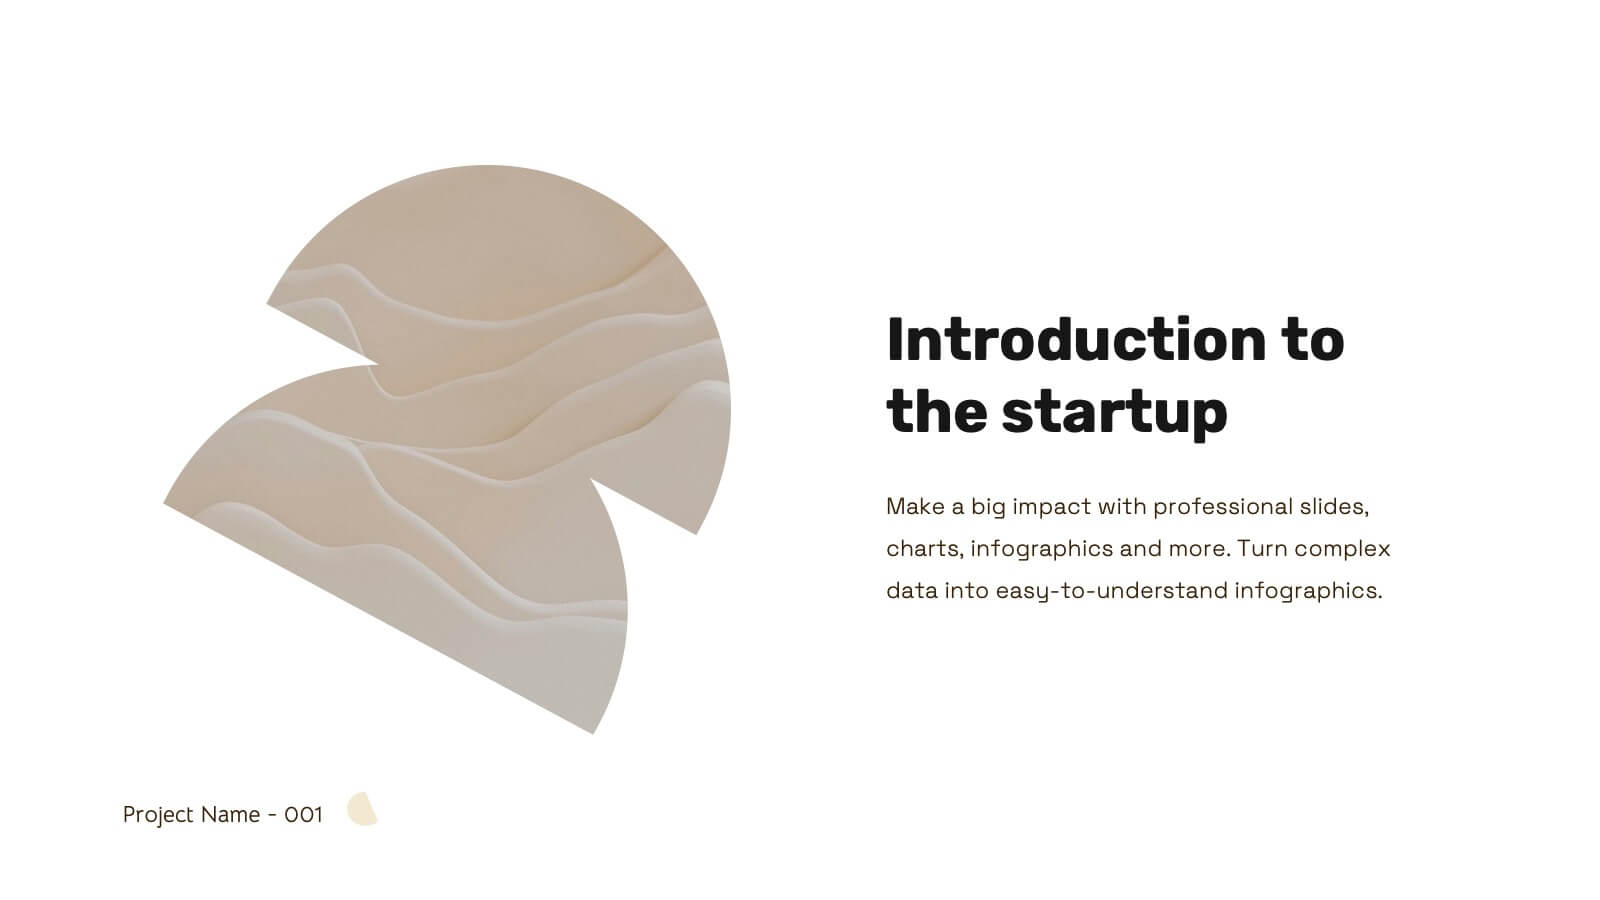
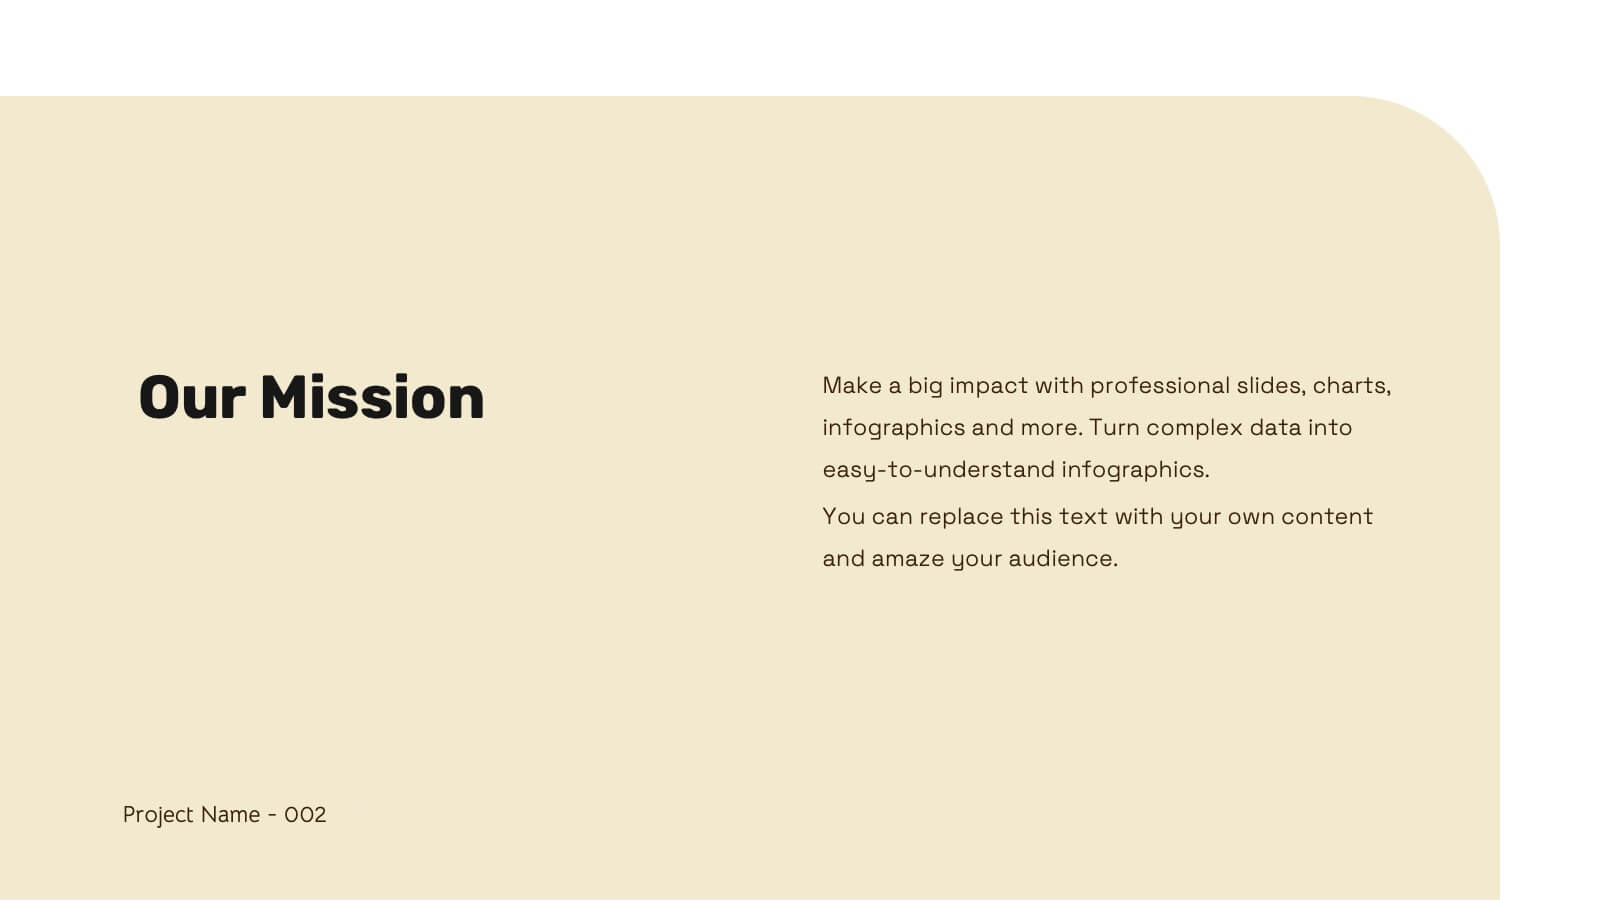
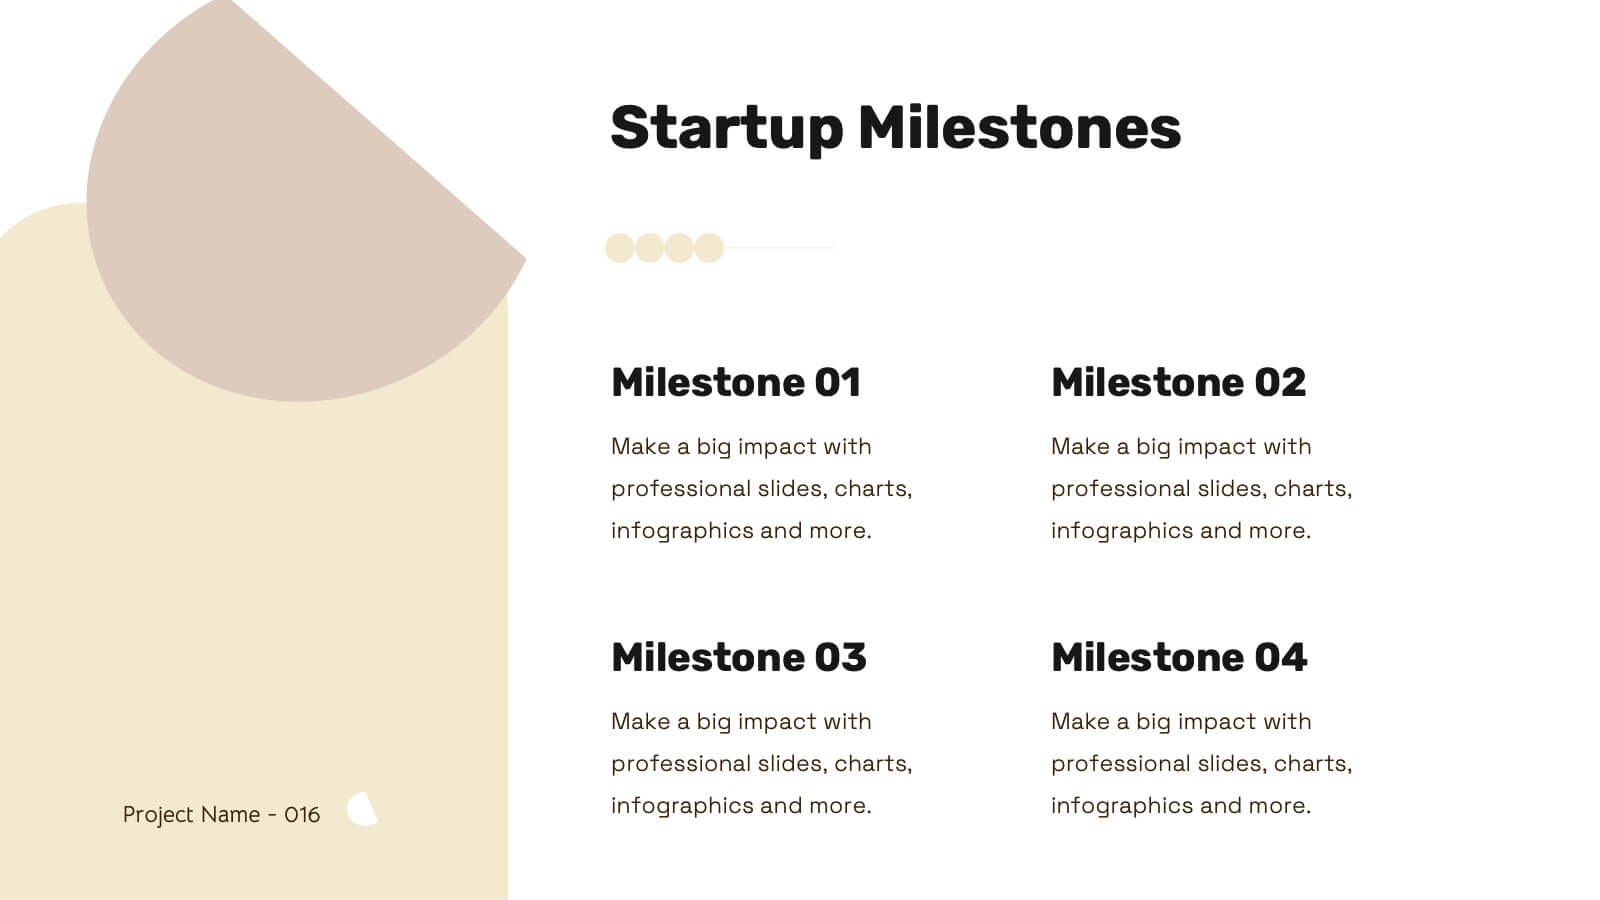
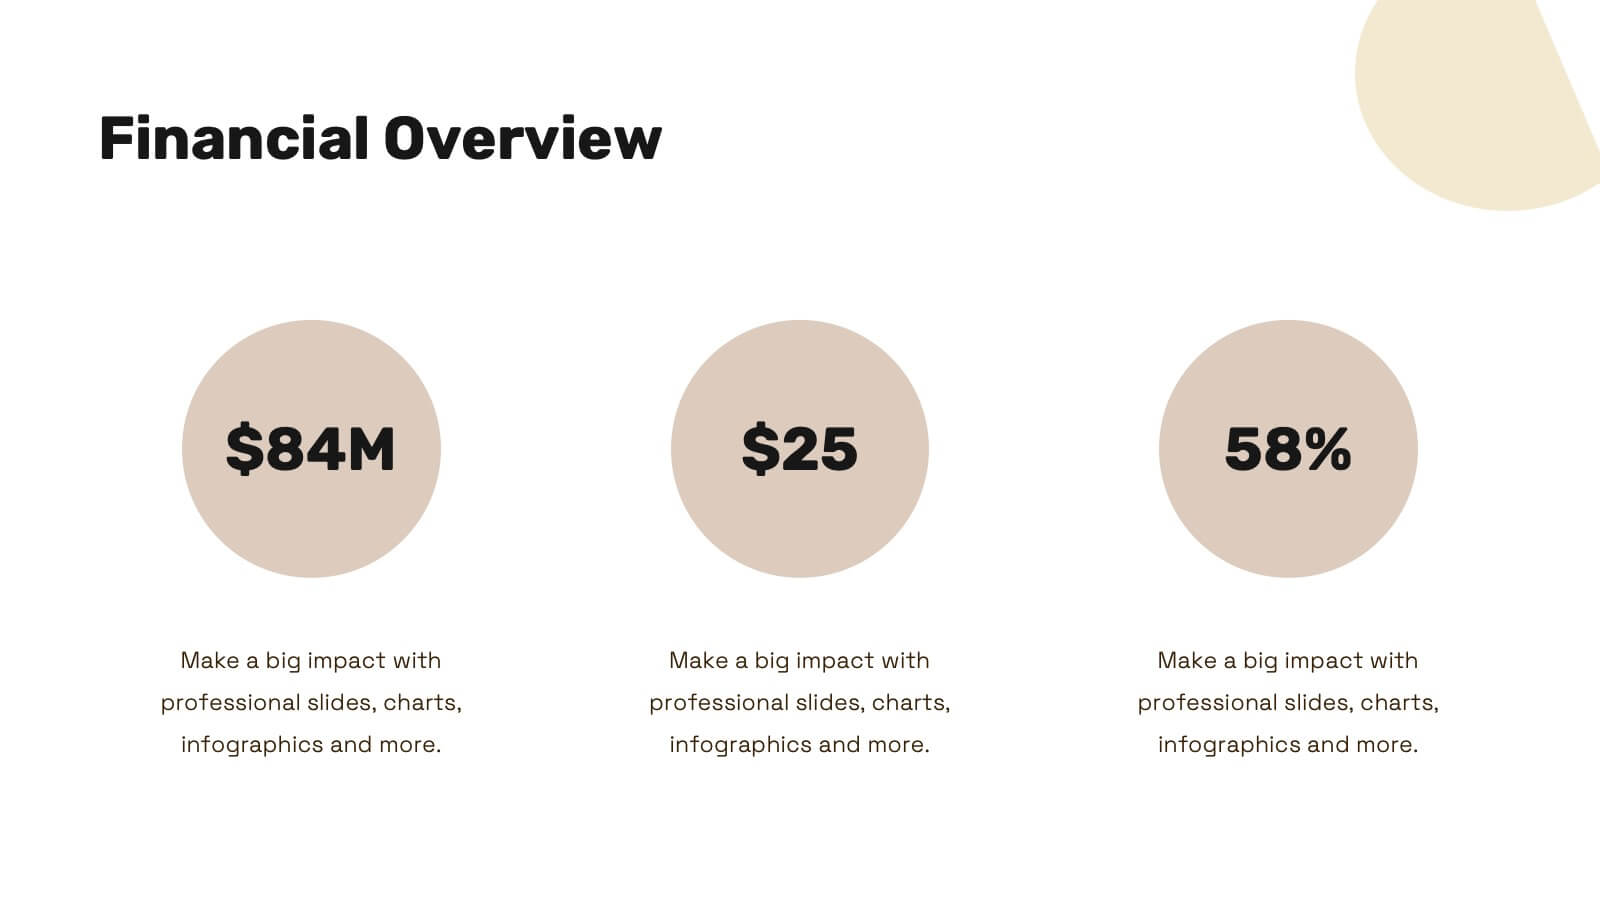
Nova Startup Funding Proposal Presentation
Craft an impressive startup funding proposal with this elegant template. It includes sections for mission, vision, market analysis, business model, and financial overview. Ideal for clear and professional presentations. Fully compatible with PowerPoint, Keynote, and Google Slides for easy customization.


20 slides
Kirin Artist Portfolio Template Presentation
Showcase your creative work with style and flair using this sleek portfolio presentation! It covers key sections like featured projects, creative process, collaborations, and client testimonials, ensuring your expertise is communicated effectively. Ideal for freelancers, designers, or agencies, this template is fully compatible with PowerPoint, Keynote, and Google Slides.


3 slides
Workflow Improvement and Progress Chart Presentation
Folders aren't just for files—they’re perfect for ideas too. This visual chart maps out streamlined processes, making it easier to track progress and improve internal workflow. Great for managers and teams, this infographic presentation template is fully compatible with PowerPoint, Keynote, and Google Slides for effortless editing and sharing.


5 slides
Business Ethics and Governance
Illustrate ethical processes and compliance values with this curved roadmap presentation. Designed around five connected stages—Process, Compliance, Technology, Oversight, and People—this layout helps visualize corporate governance and operational integrity. Each segment is color-coded and paired with icons for easy comprehension. Fully editable in PowerPoint, Keynote, and Google Slides.


8 slides
Cost Analysis and Budgeting Presentation
Easily assess financial performance with the Cost Analysis and Budgeting Presentation template. This visually engaging slide helps break down cost structures, budget allocation, and financial comparisons in a clear and professional manner. Ideal for financial analysts, business strategists, and project managers presenting financial data. Fully editable in PowerPoint, Keynote, and Google Slides for effortless customization.


5 slides
Strategic Framework Slide Presentation
Turn your strategy into a story that flows with clarity and precision using this clean, timeline-based presentation design. Ideal for illustrating project phases, corporate planning, or growth roadmaps, it keeps information structured and engaging. Fully editable and compatible with PowerPoint, Keynote, and Google Slides for seamless customization.