


Features
- 6 Unique slides
- Fully editable and easy to edit in Microsoft Powerpoint, Keynote and Google Slides
- 16:9 widescreen layout
- Clean and professional designs
- Export to JPG, PDF or send by email


Do you have any questions?
Recommend


6 slides
Business Process Checklist Overview Presentation
Simplify your workflow presentations with the Business Process Checklist Overview Presentation. This circular layout is ideal for outlining five sequential or cyclical steps in a business process, featuring icon-labeled checkpoints and editable titles. Each step is visually marked with subtle checkmarks, making it perfect for status tracking, task progression, or implementation plans. Clean, professional, and fully customizable in PowerPoint, Keynote, and Google Slides.


7 slides
Pillar Distribution Infographic
Discover a striking visual representation of data with the pillar distribution Infographic. Bathed in shades of blue, white, and green, this template masterfully showcases the core foundations of any topic in a 'pillar' format. Specifically tailored for business analysts, educators, and marketers, the infographic aids in simplifying dense information. With its crisp graphics, bespoke icons, and dedicated image placeholders, conveying your insights becomes an engaging narrative experience. Its versatility ensures smooth integration with PowerPoint, Keynote, and Google Slides, transforming any presentation into a captivating visual story.


4 slides
Workflow Bottleneck Fishbone Analysis
Identify slowdowns and streamline performance with the Workflow Bottleneck Fishbone Analysis Presentation. This diagram features a horizontally aligned fishbone structure with segmented semicircles, ideal for pinpointing process inefficiencies across stages. Fully customizable in PowerPoint, Keynote, and Google Slides for professional workflow diagnostics.


8 slides
Product Development and Innovation
Break down your product journey with this modern step-by-step infographic. Ideal for startups, product managers, and innovation teams, this slide illustrates four stages—perfect for visualizing design thinking, MVP rollouts, or feature planning. Easily editable in PowerPoint, Keynote, and Google Slides.


6 slides
SEO Strategy and Keyword Mapping Presentation
Streamline your digital strategy with this SEO mapping layout that blends structure and simplicity. Designed to help visualize keyword clusters, content priorities, and search intent stages, this infographic makes complex strategies feel approachable. It’s easy to edit and perfect for presentations in PowerPoint, Keynote, or Google Slides.


6 slides
Fishbone Diagram
A fishbone diagram, also known as a cause-and-effect diagram or an Ishikawa diagram, is a visual tool used to identify and analyze the potential causes of a problem or an effect. This infographic template is designed to help you explore and understand the root causes of an issue by visually mapping out various contributing factors. This cause-and-effect diagram, provides a structured approach to identify and categorize the various factors contributing to a specific outcome. This template is fully customizable and compatible with Powerpoint, Keynote, and Google Slides making it easy to input your information.


5 slides
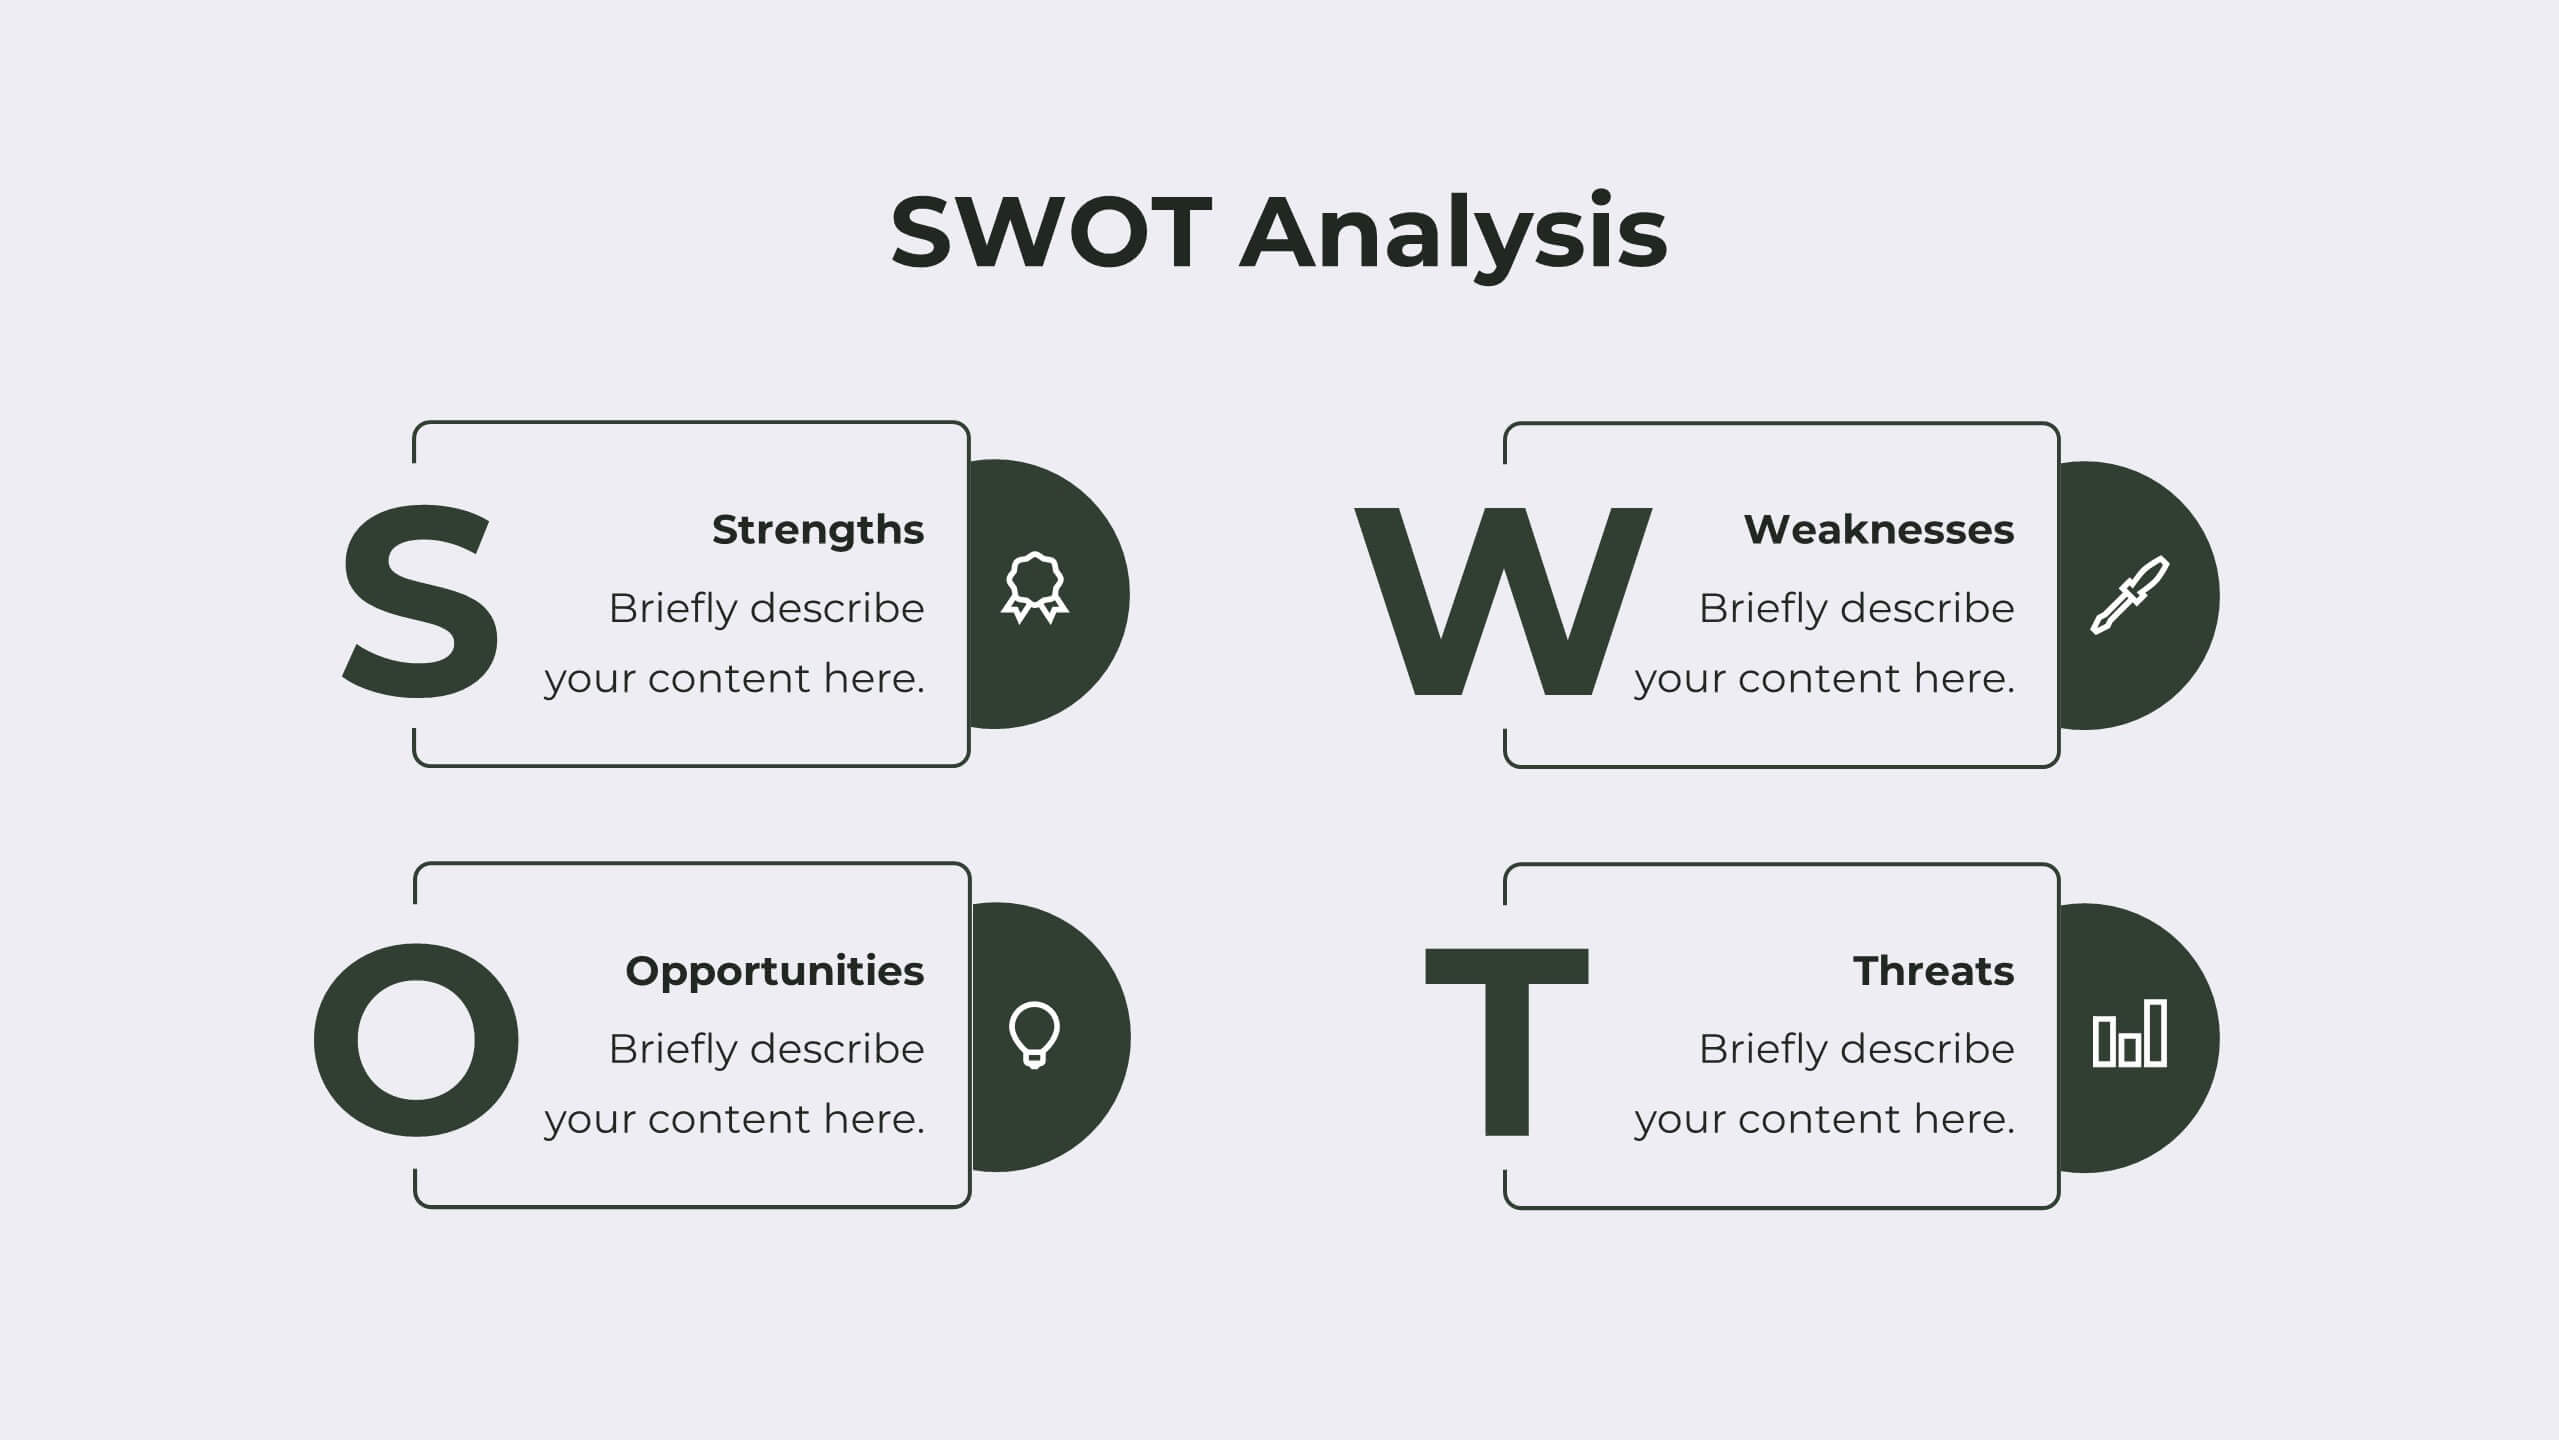
Innovative Strategic SWOT Layout
Visualize your strategic edge with the Innovative Strategic SWOT Layout Presentation. This clean, overlapping-circle design brings attention to the interconnection between Strengths, Weaknesses, Opportunities, and Threats while maintaining a minimal, modern look. Each element is paired with space for concise insights, making it perfect for leadership briefings, planning sessions, or team reviews. Fully editable in PowerPoint, Keynote, and Google Slides.


7 slides
Network Marketing Infographic
Network marketing, is a business strategy where salespersons earn income through both direct sales of products or services and by recruiting new salespeople. This infographic template serves as a compass, guiding you through the intricate pathways of this business model and shedding light on the strategies and dynamics that lead to success. Compatible with Powerpoint, Keynote, and Google Slides. Illustrate a network of interconnected nodes to visualize the structure and growth potential of network marketing, demonstrating how each node represents a potential customer or distributor.


6 slides
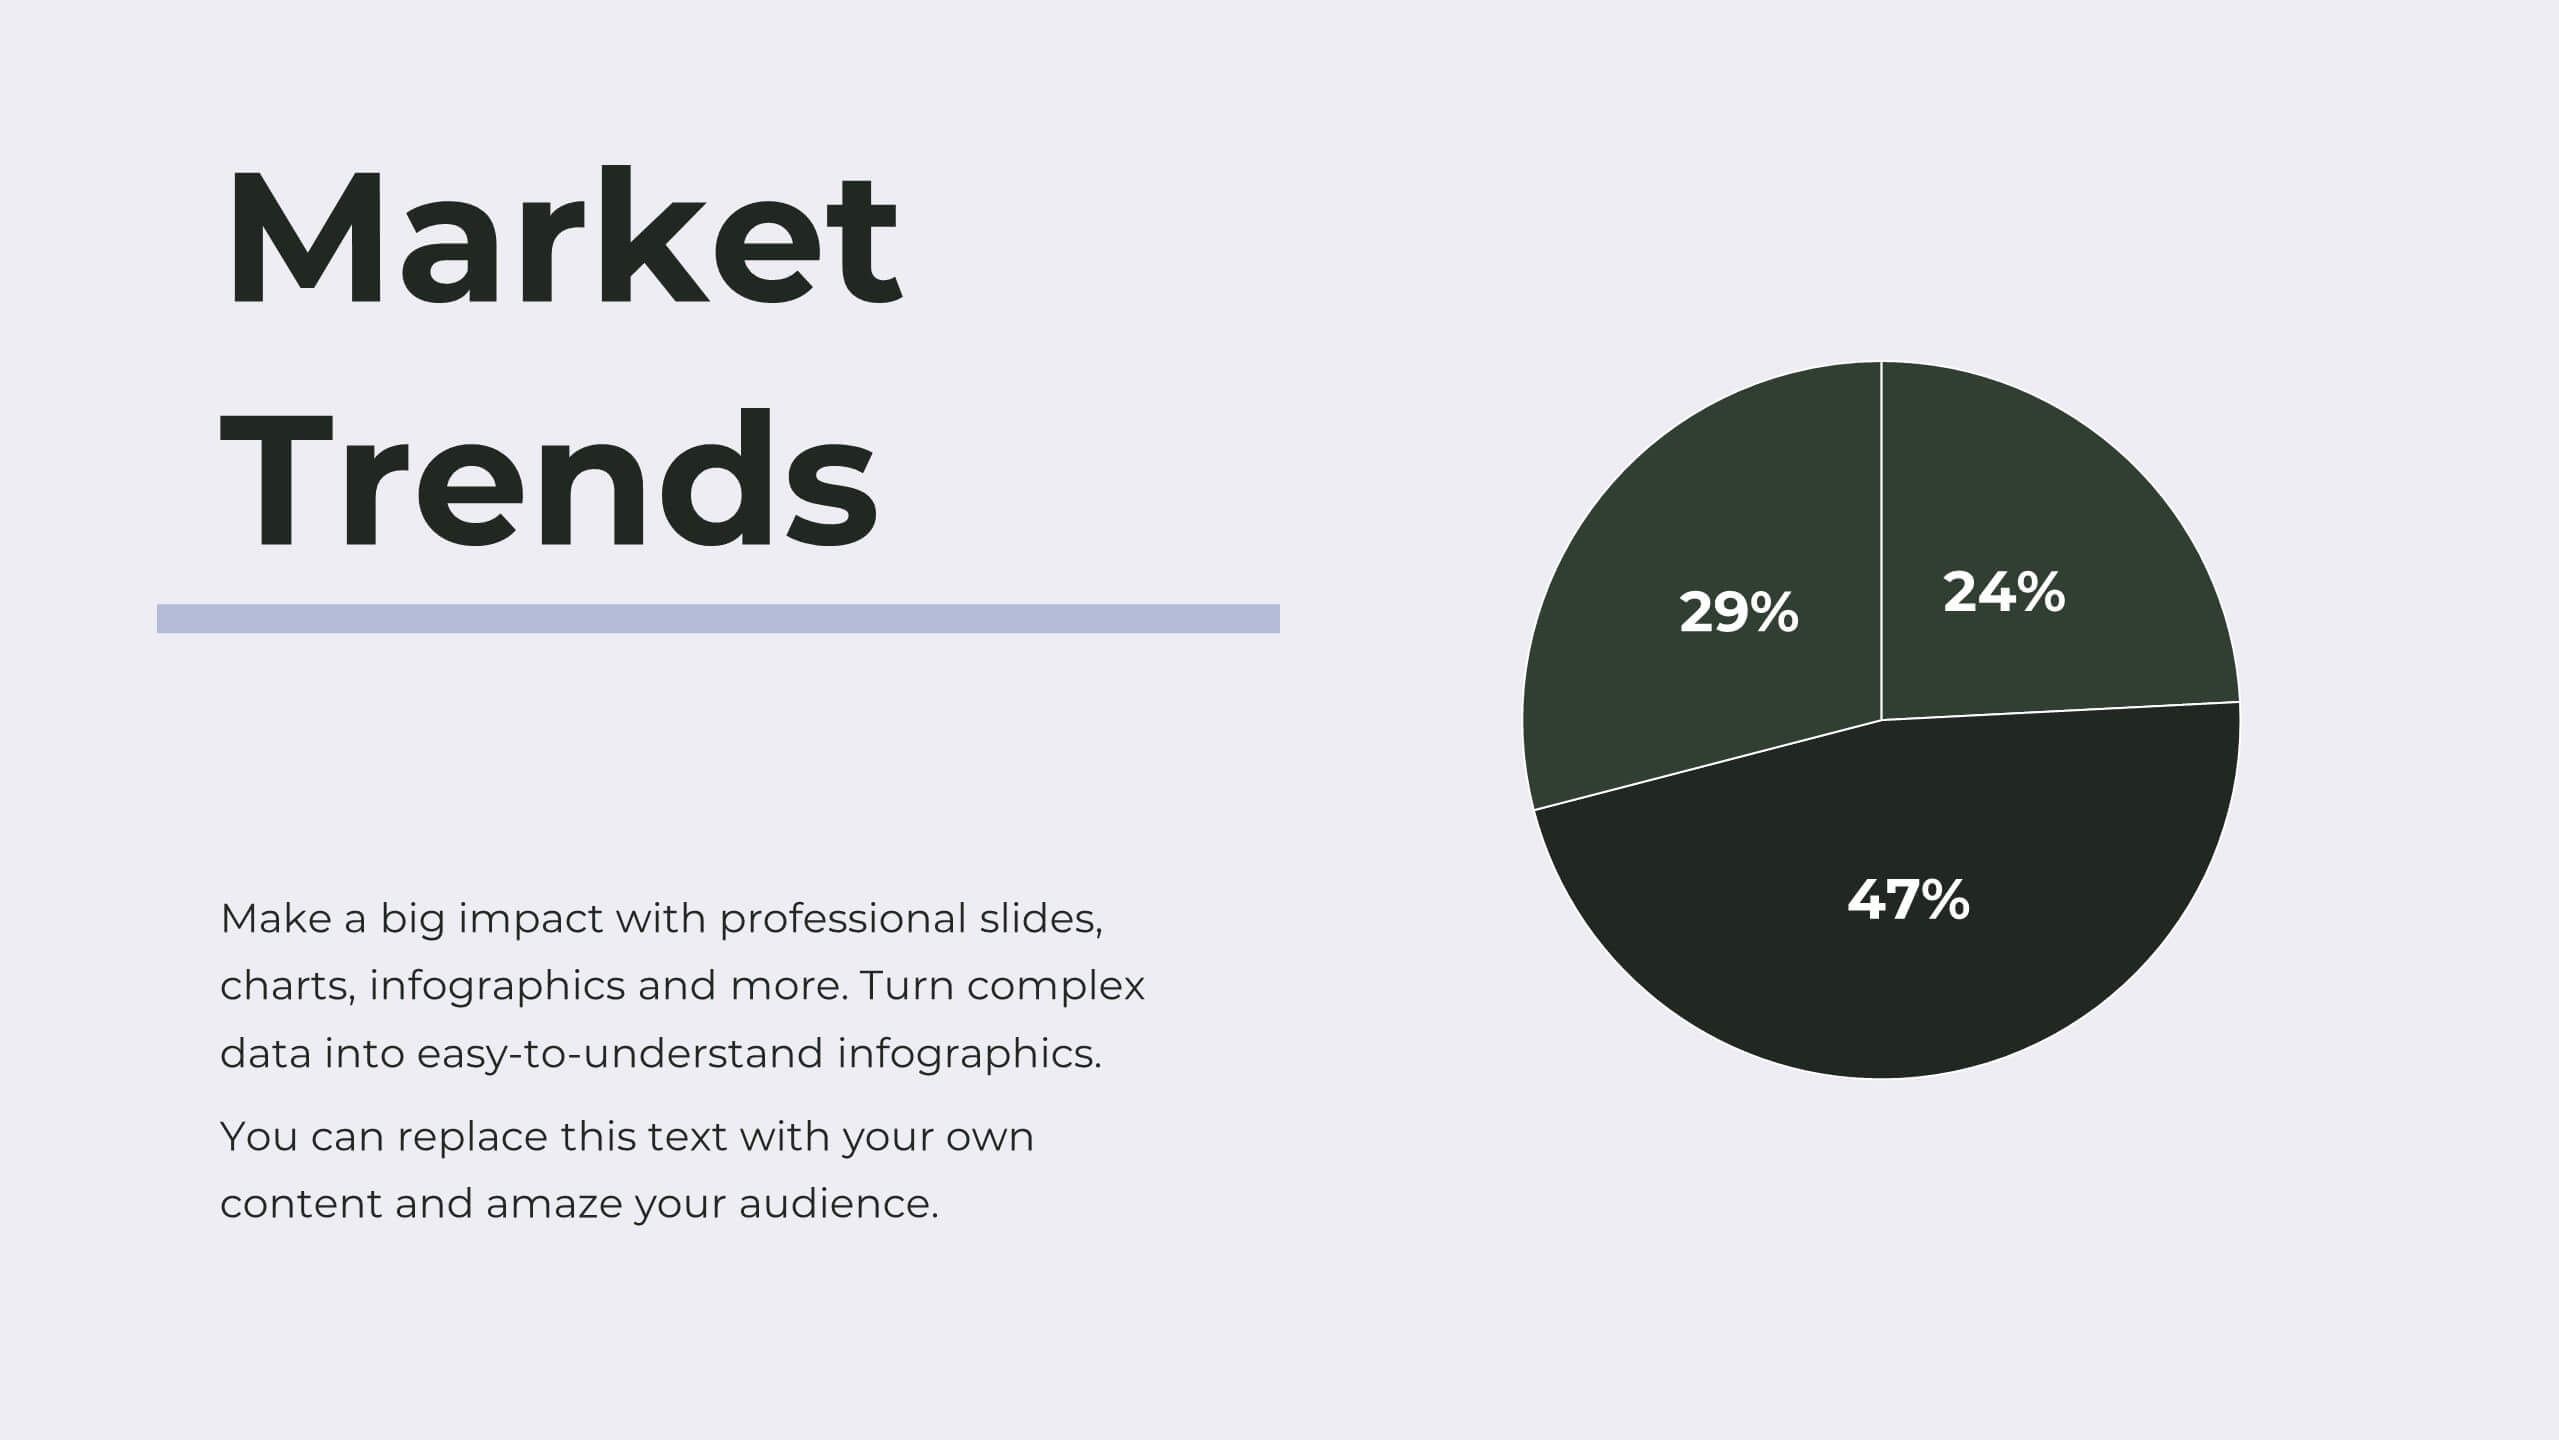
Big Data Insights Visual Presentation
Transform complex analytics into clear, engaging visuals that tell a compelling story. This modern layout is perfect for showcasing data connections, performance metrics, and analytical insights in a visually balanced way. Fully editable and compatible with PowerPoint, Keynote, and Google Slides for seamless customization and professional presentations.


8 slides
Market Expansion Strategies in North America Map Presentation
Visualize your market growth plans with this strategic North America map slide. Highlight four regional expansion points with vibrant markers and customizable labels. Perfect for showcasing entry strategies, regional goals, or sales plans. Fully editable in PowerPoint, Keynote, and Google Slides—ideal for professional business and marketing presentations.


23 slides
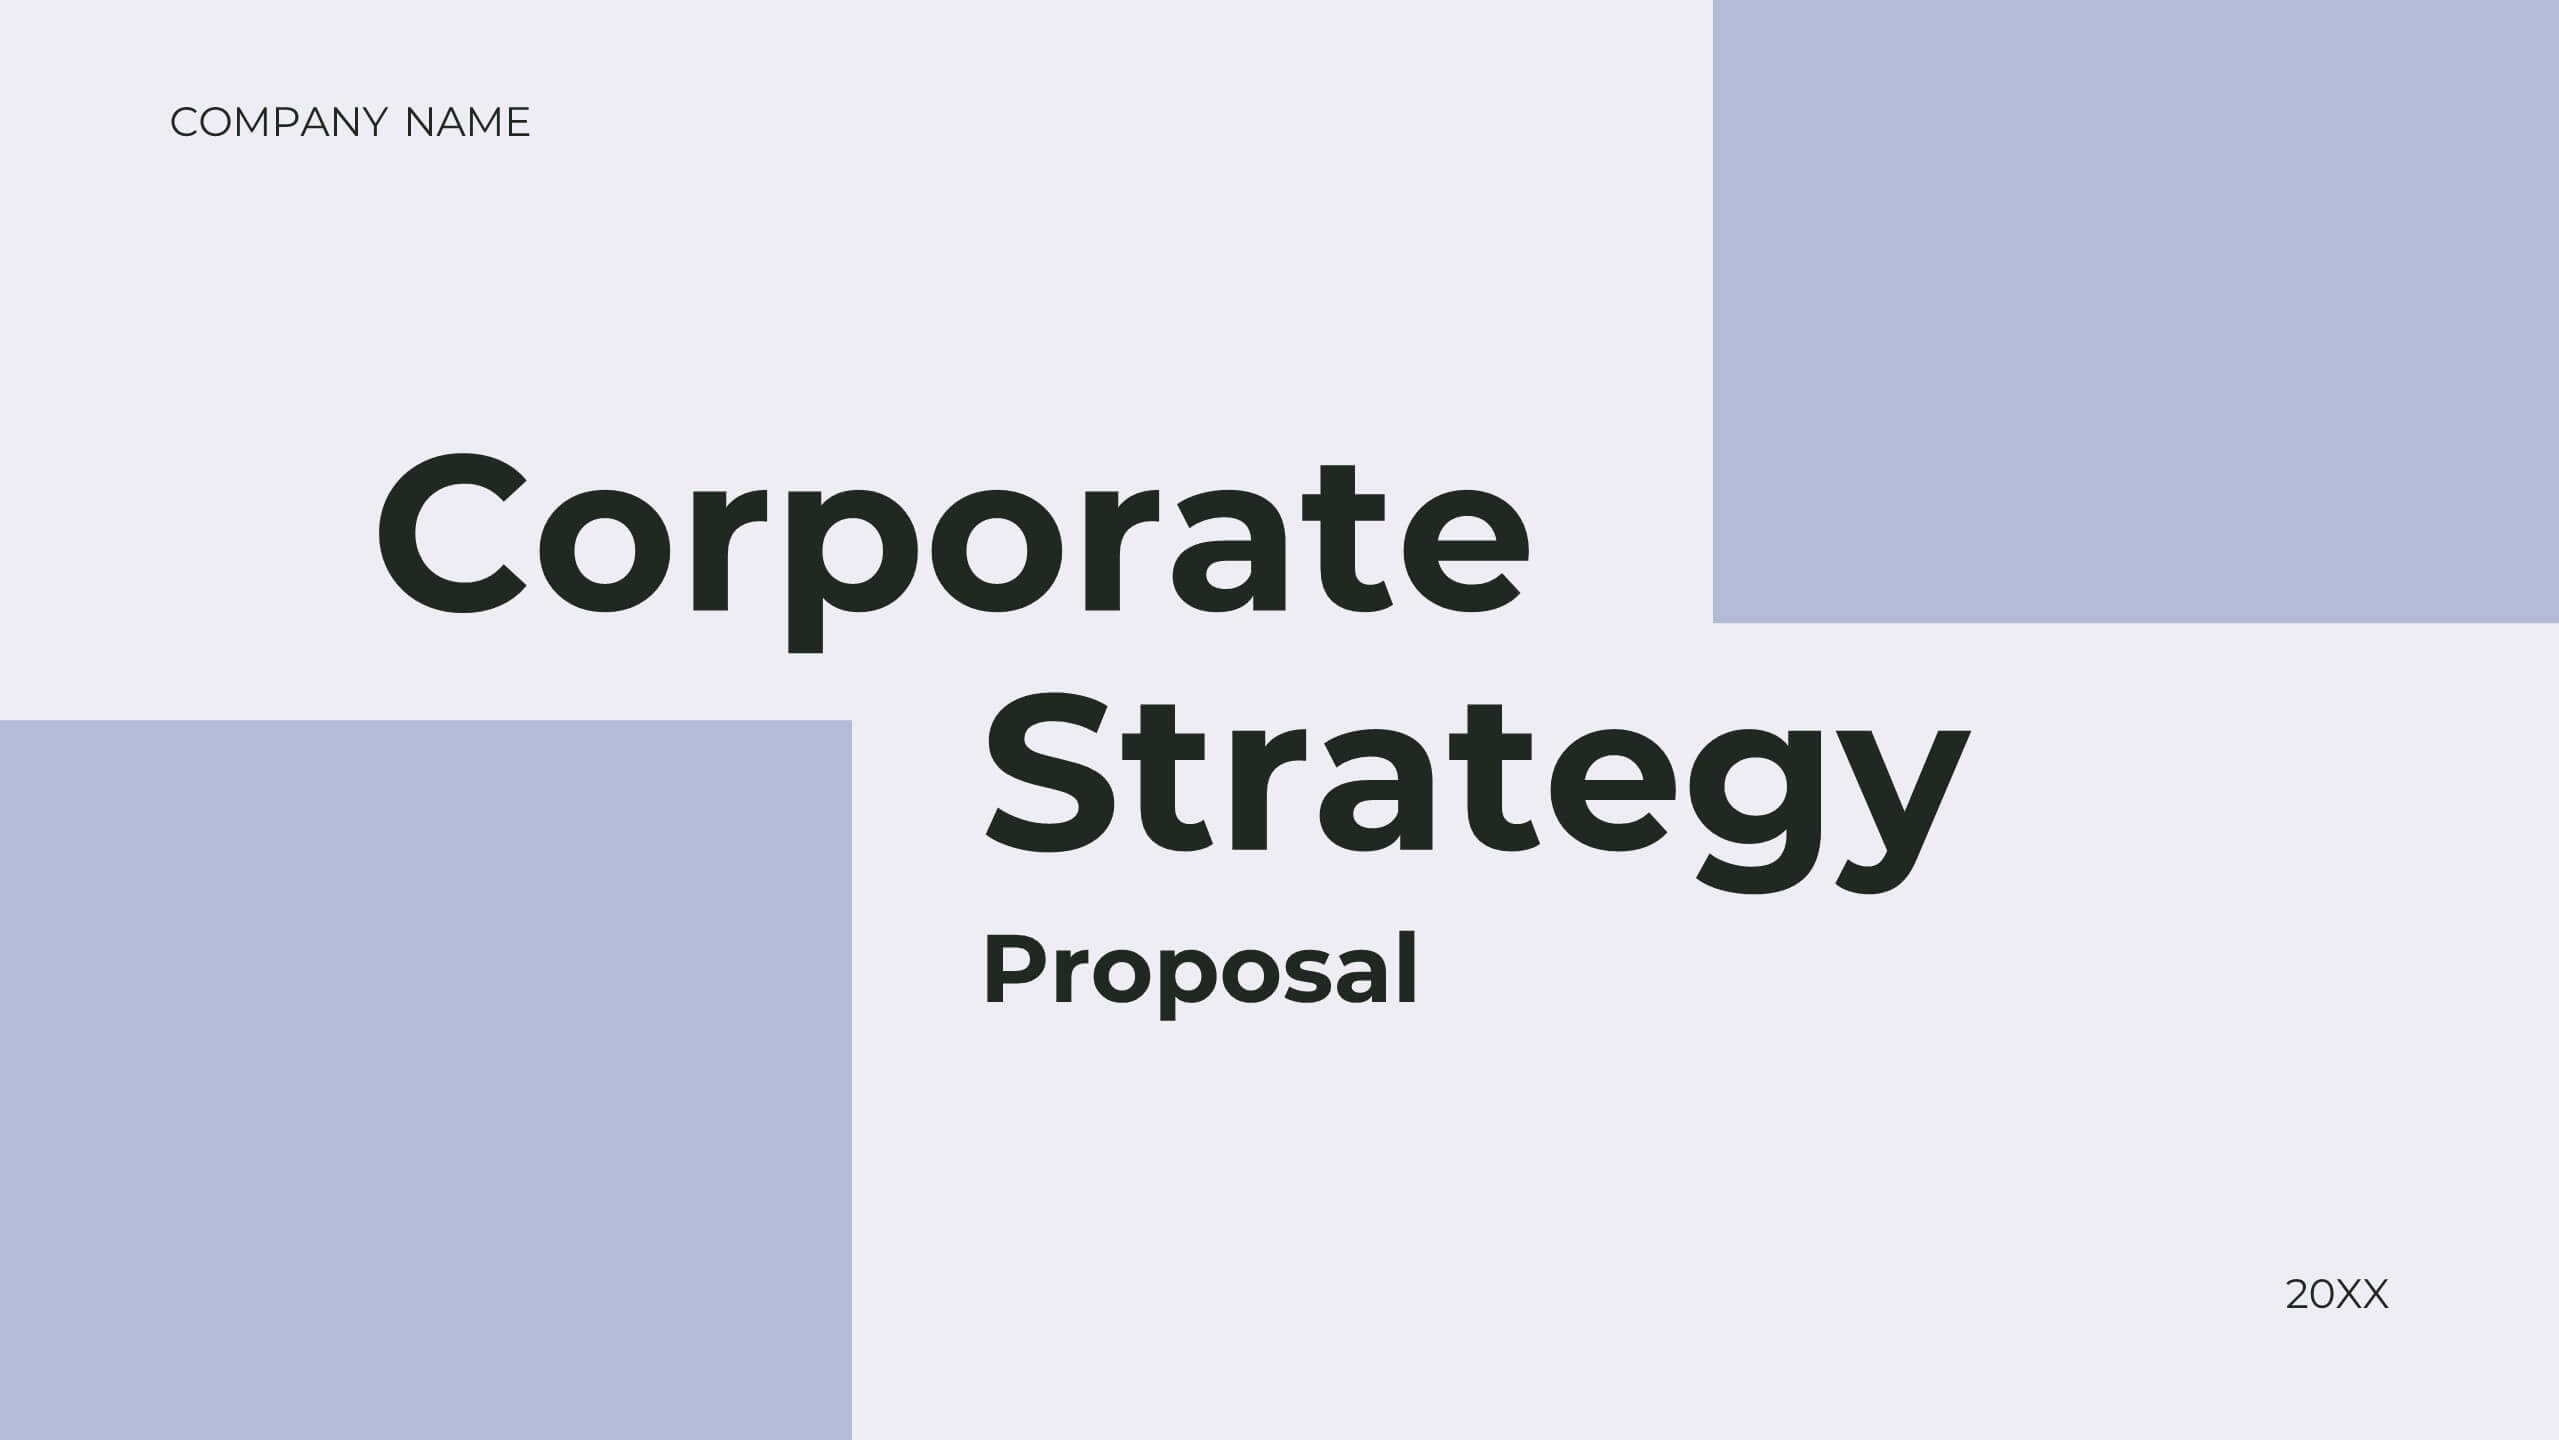
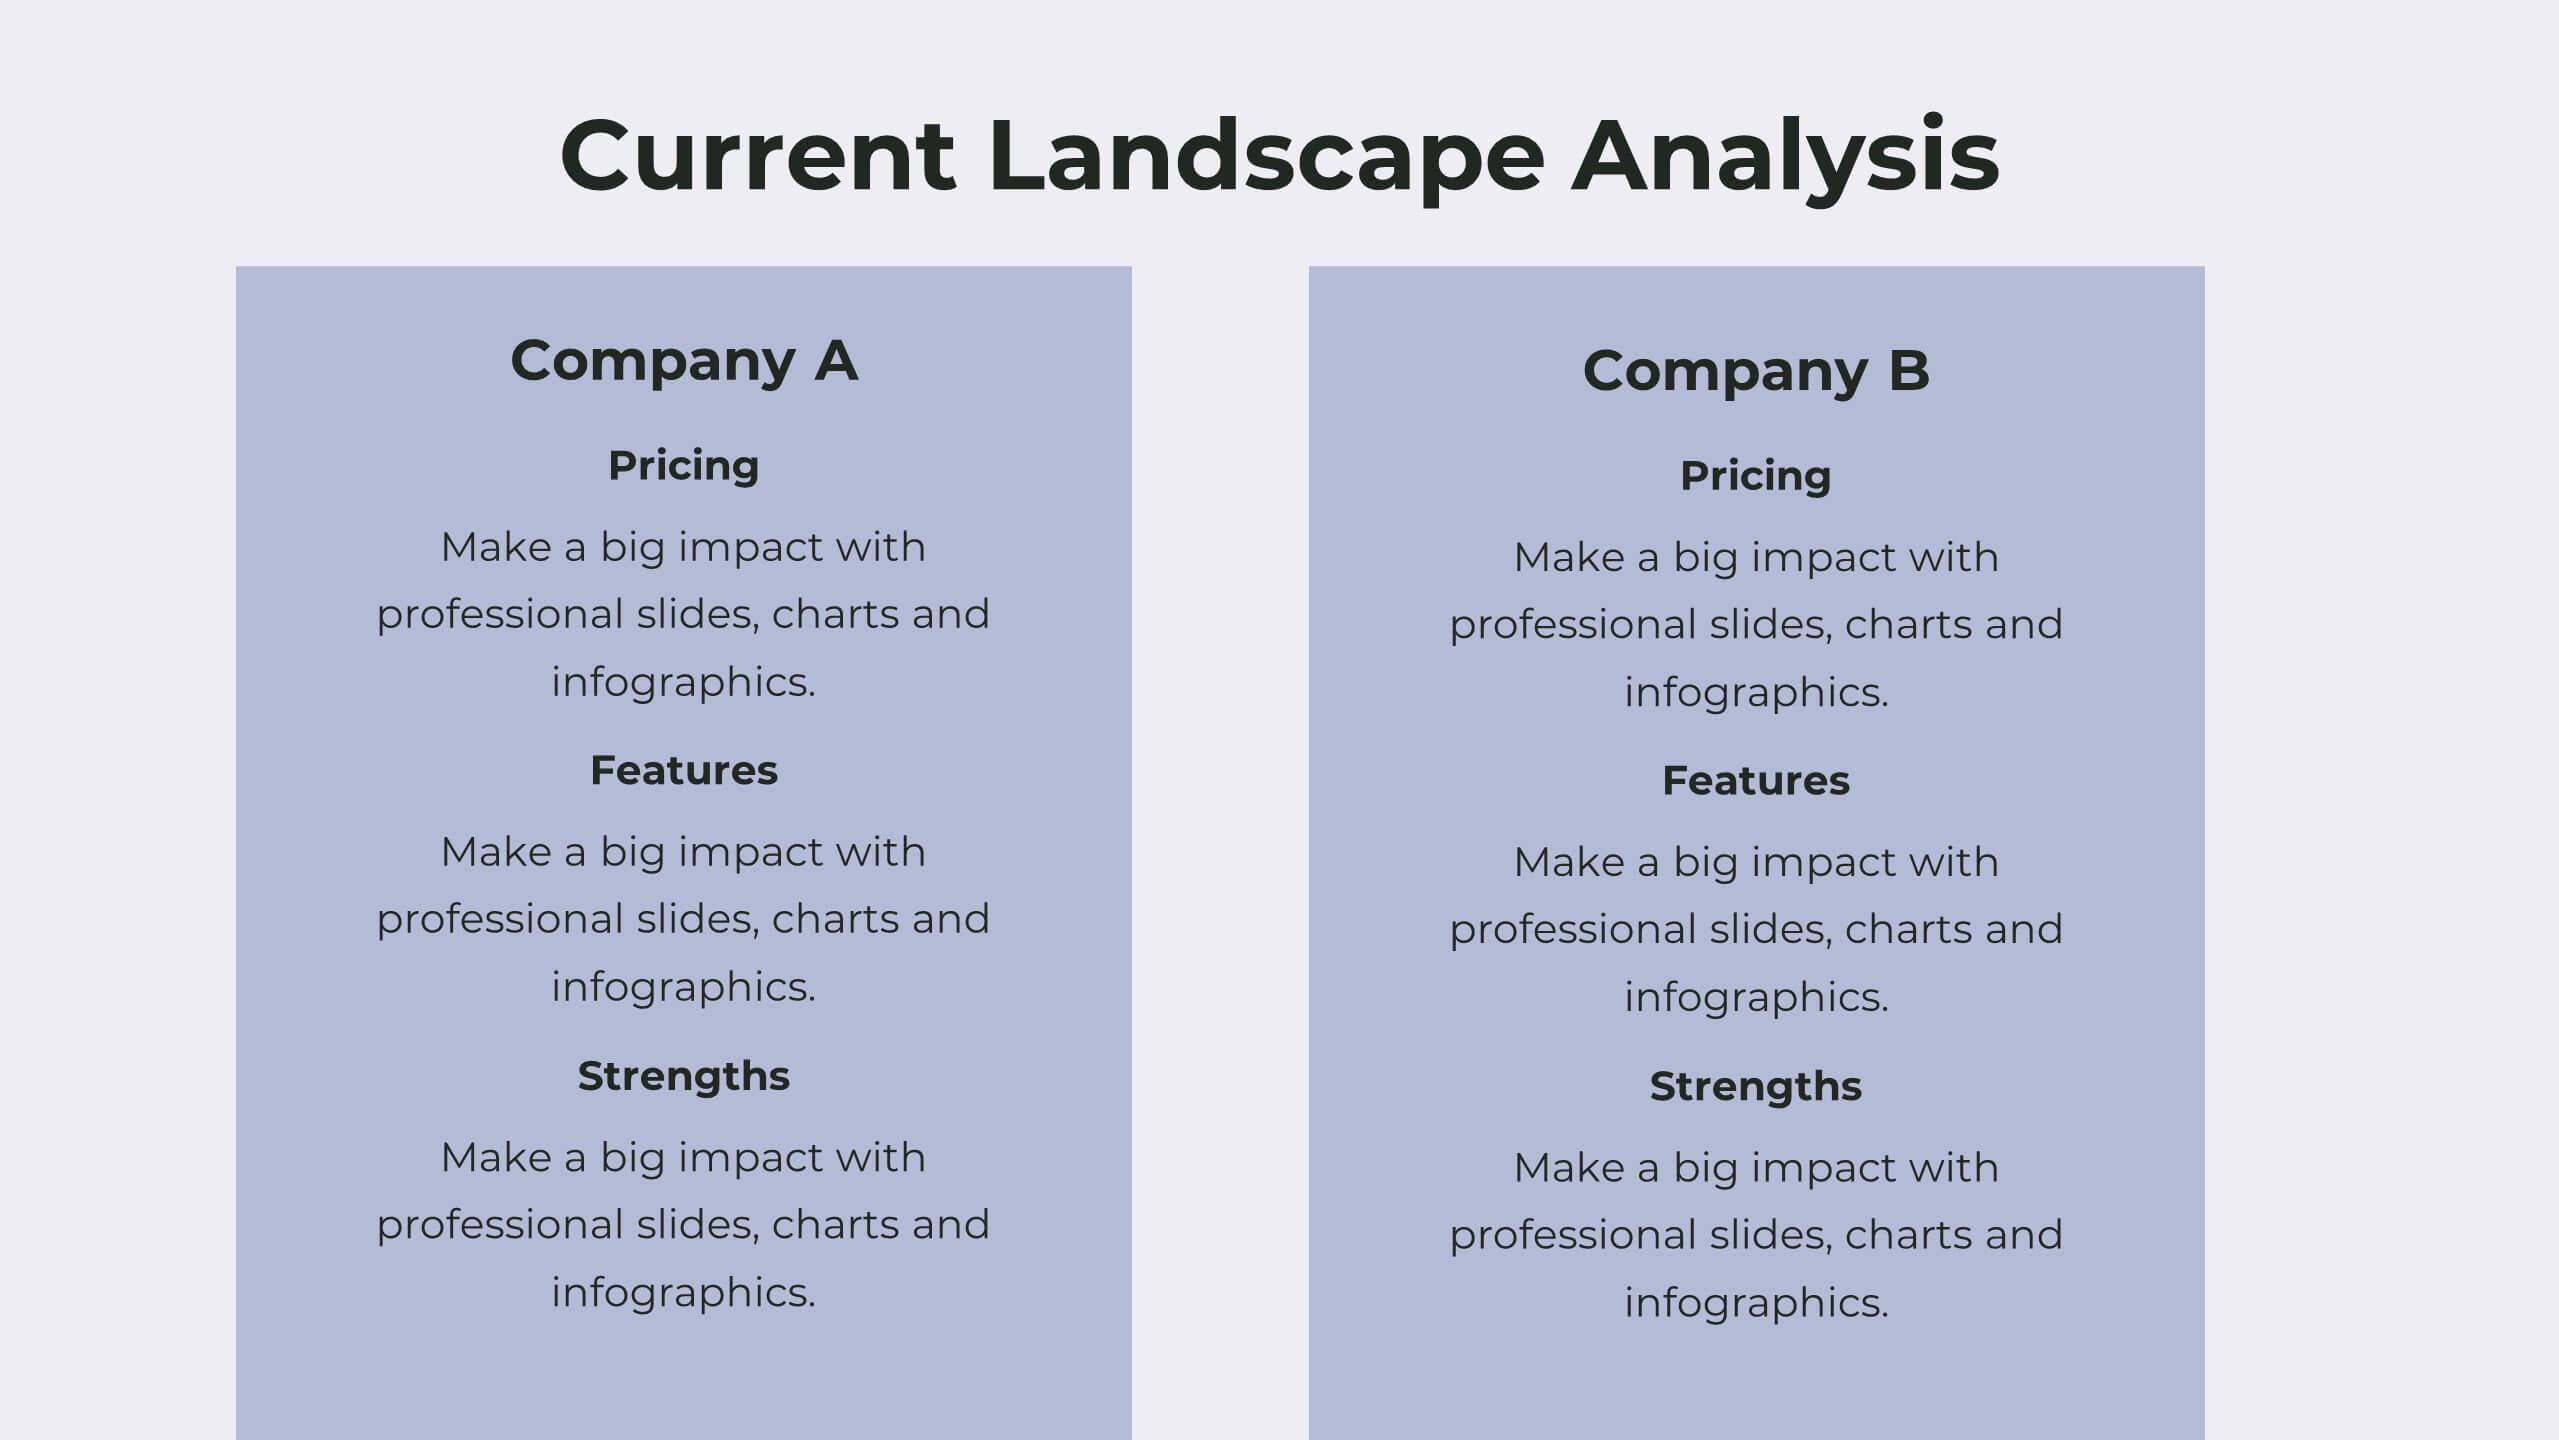
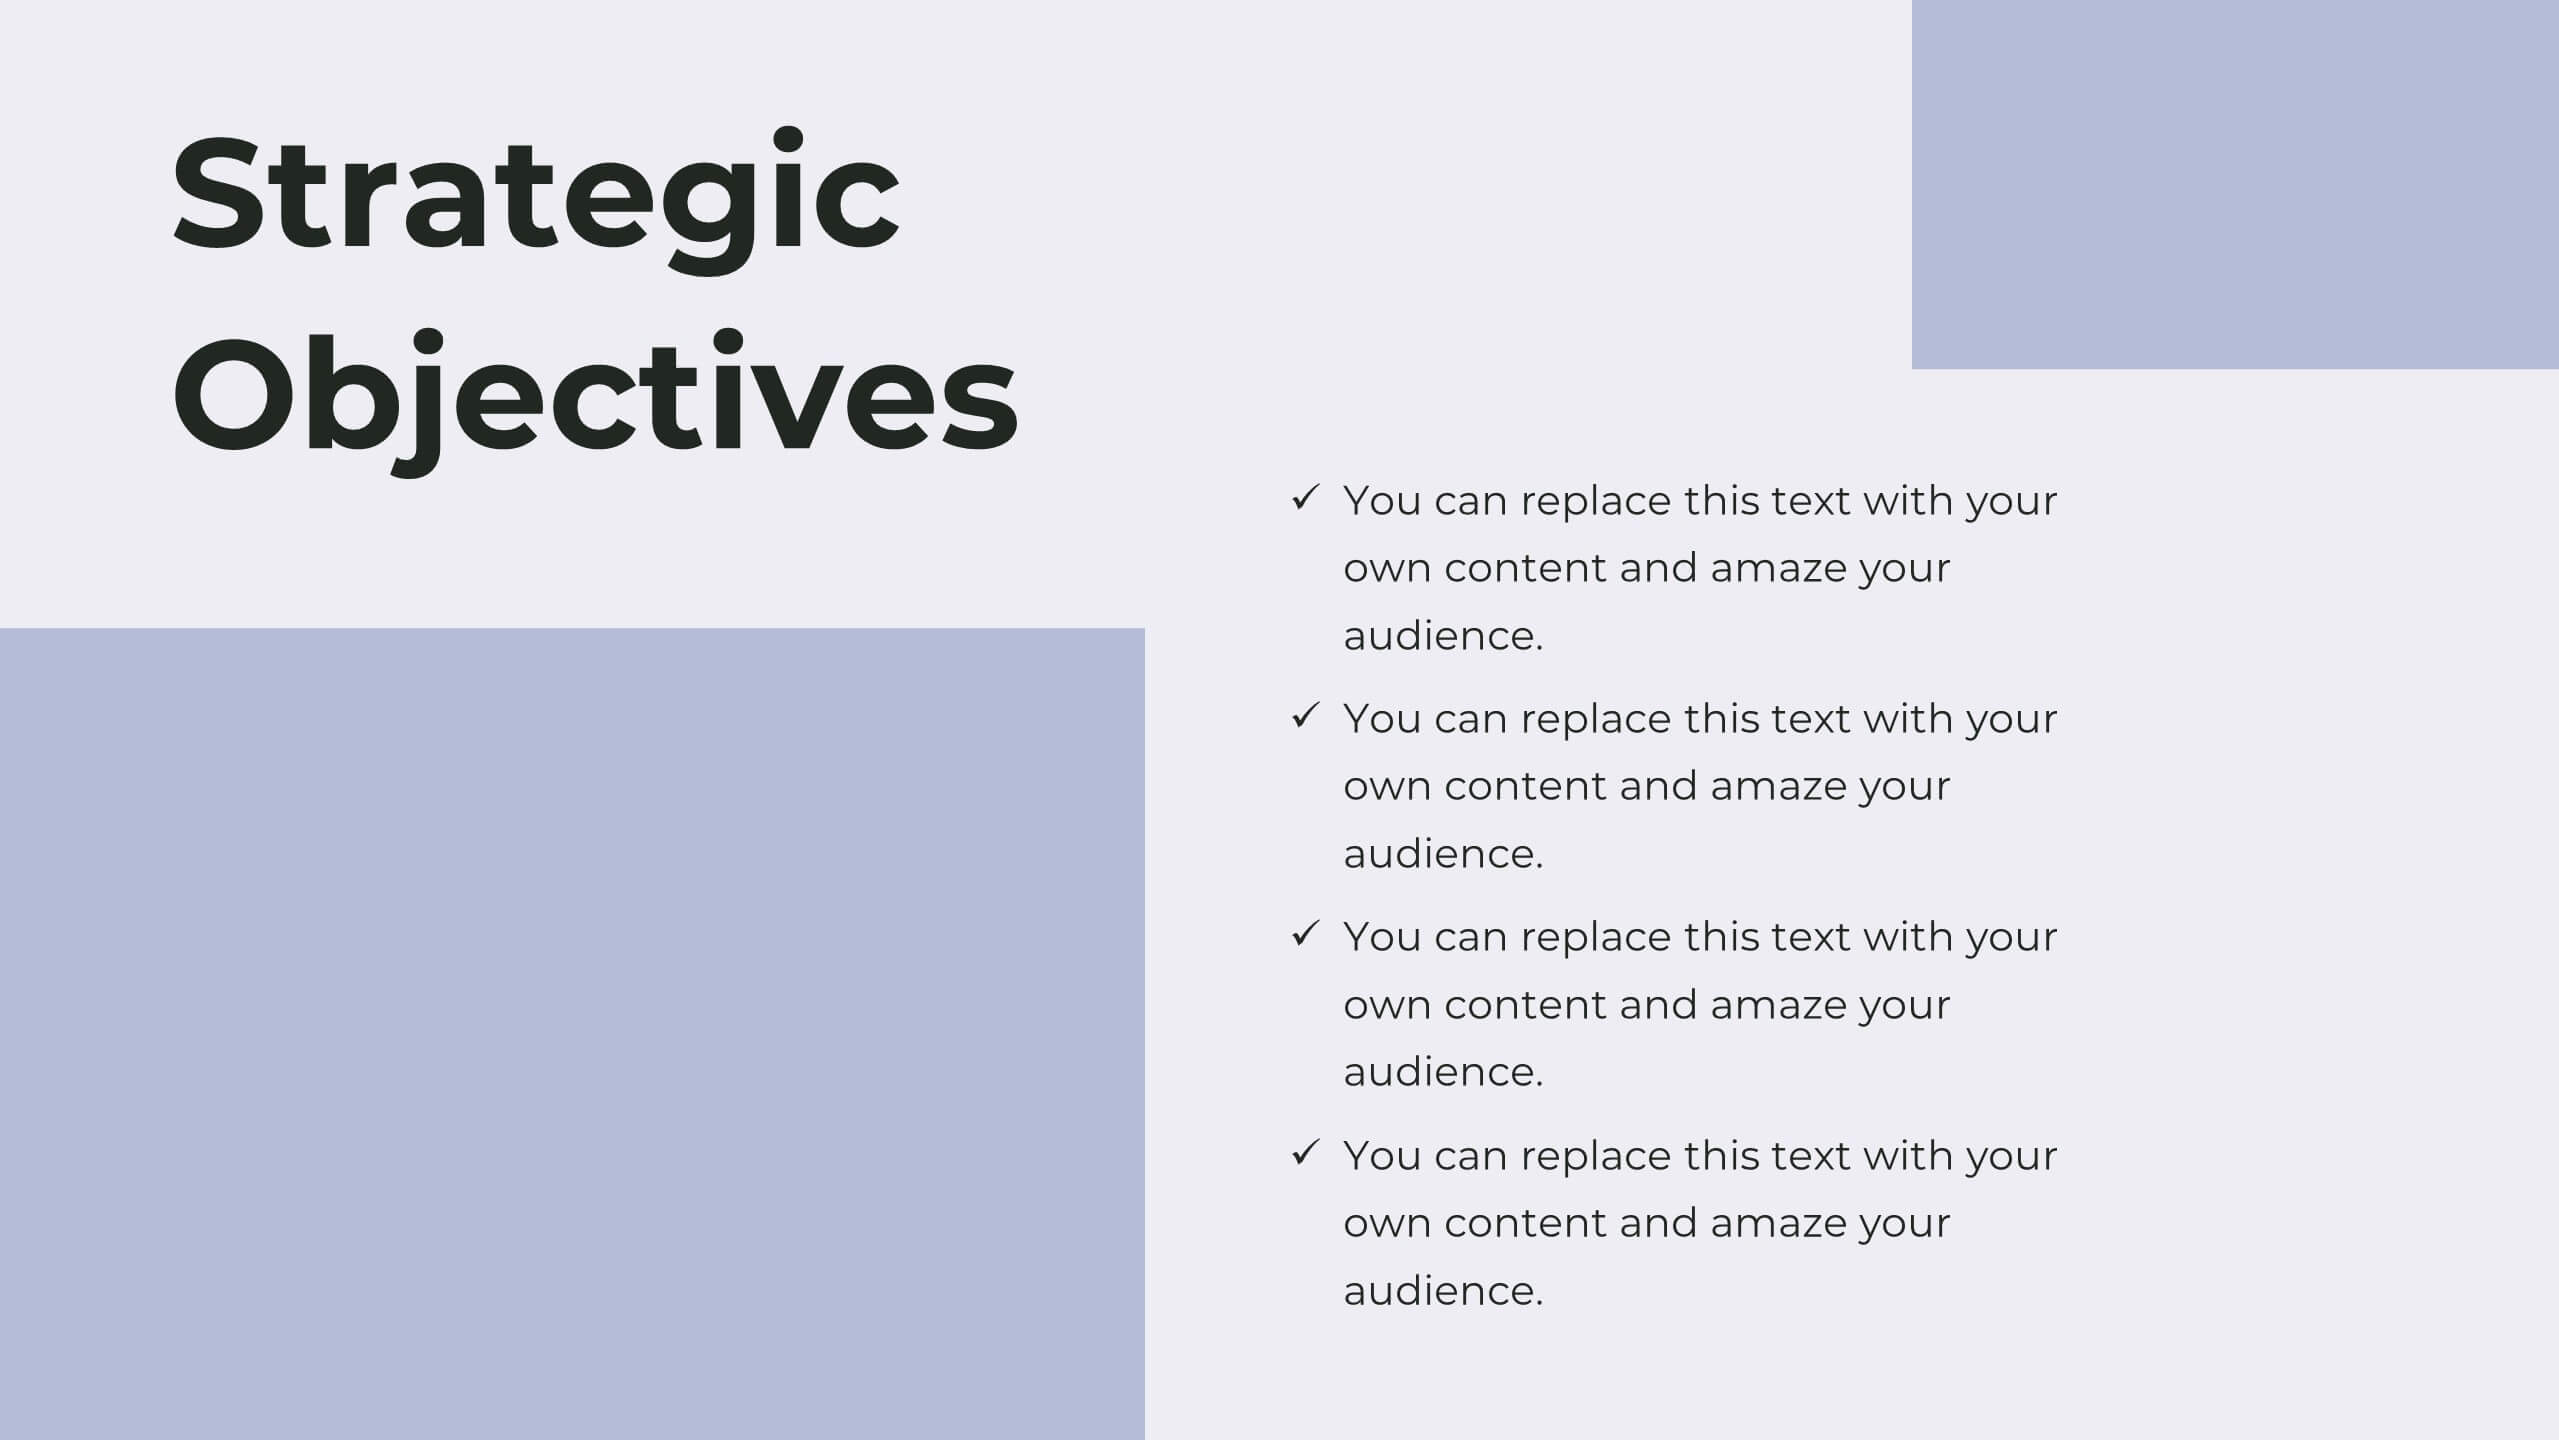
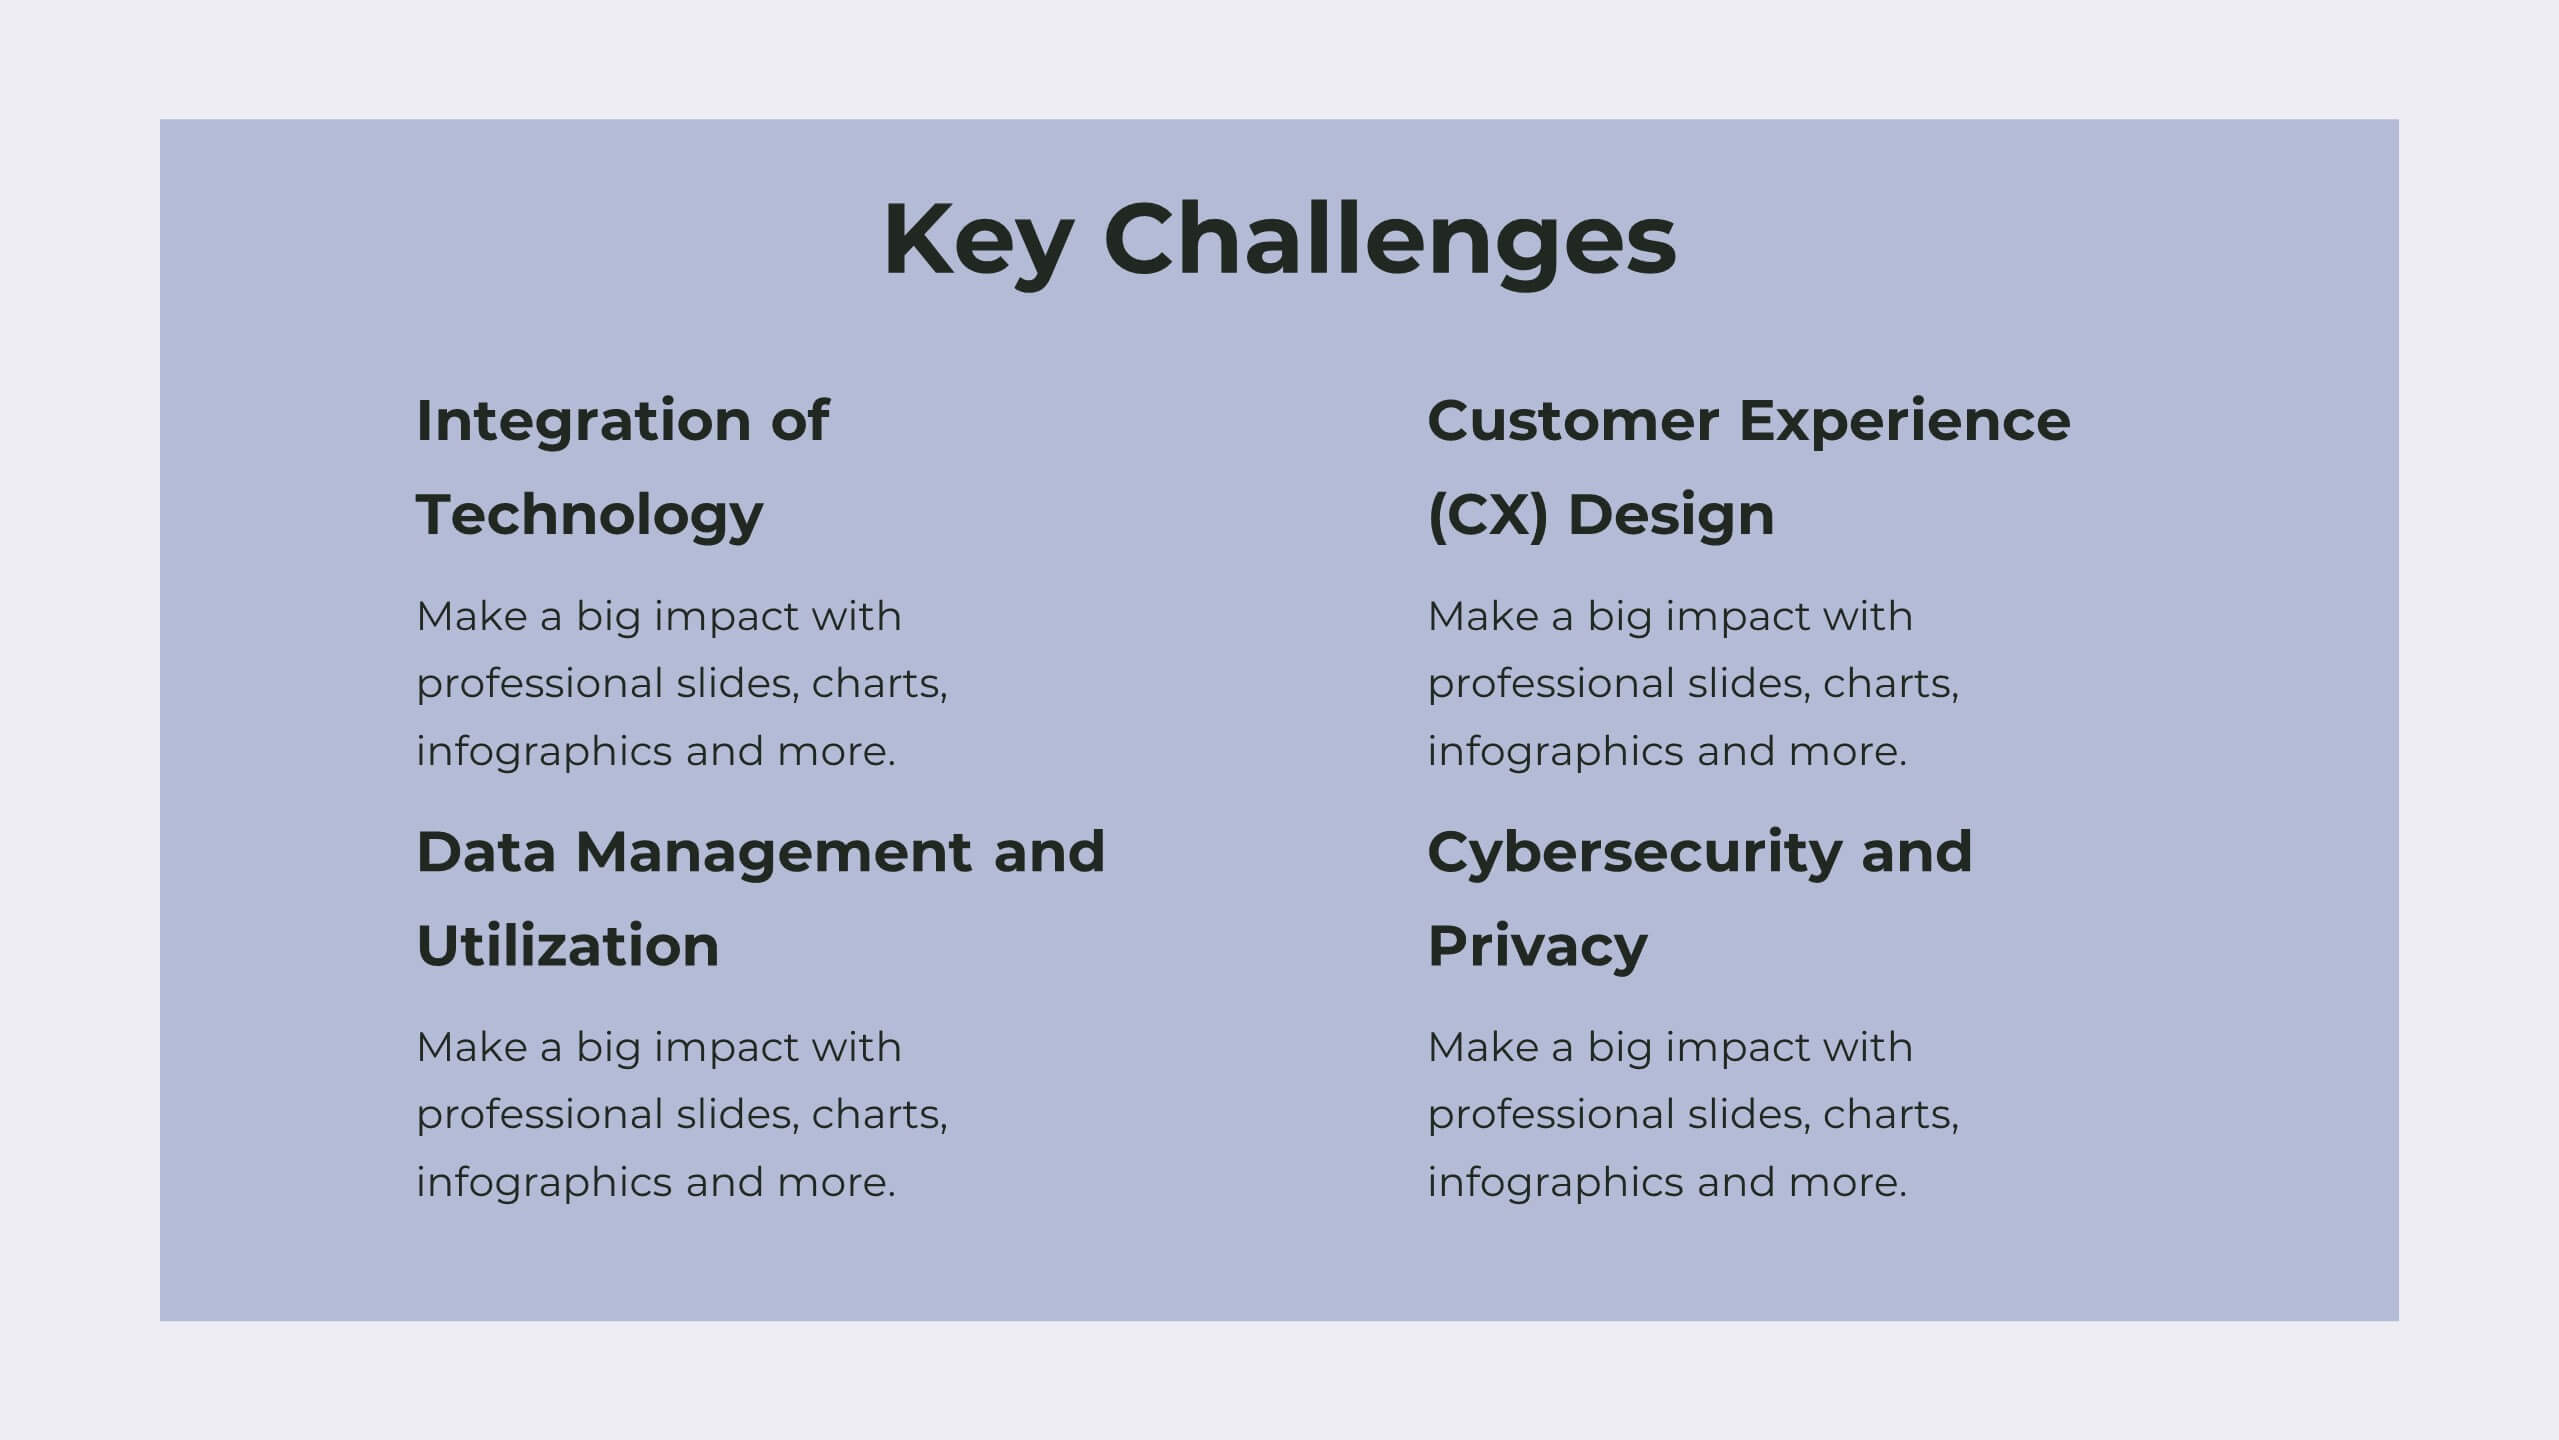
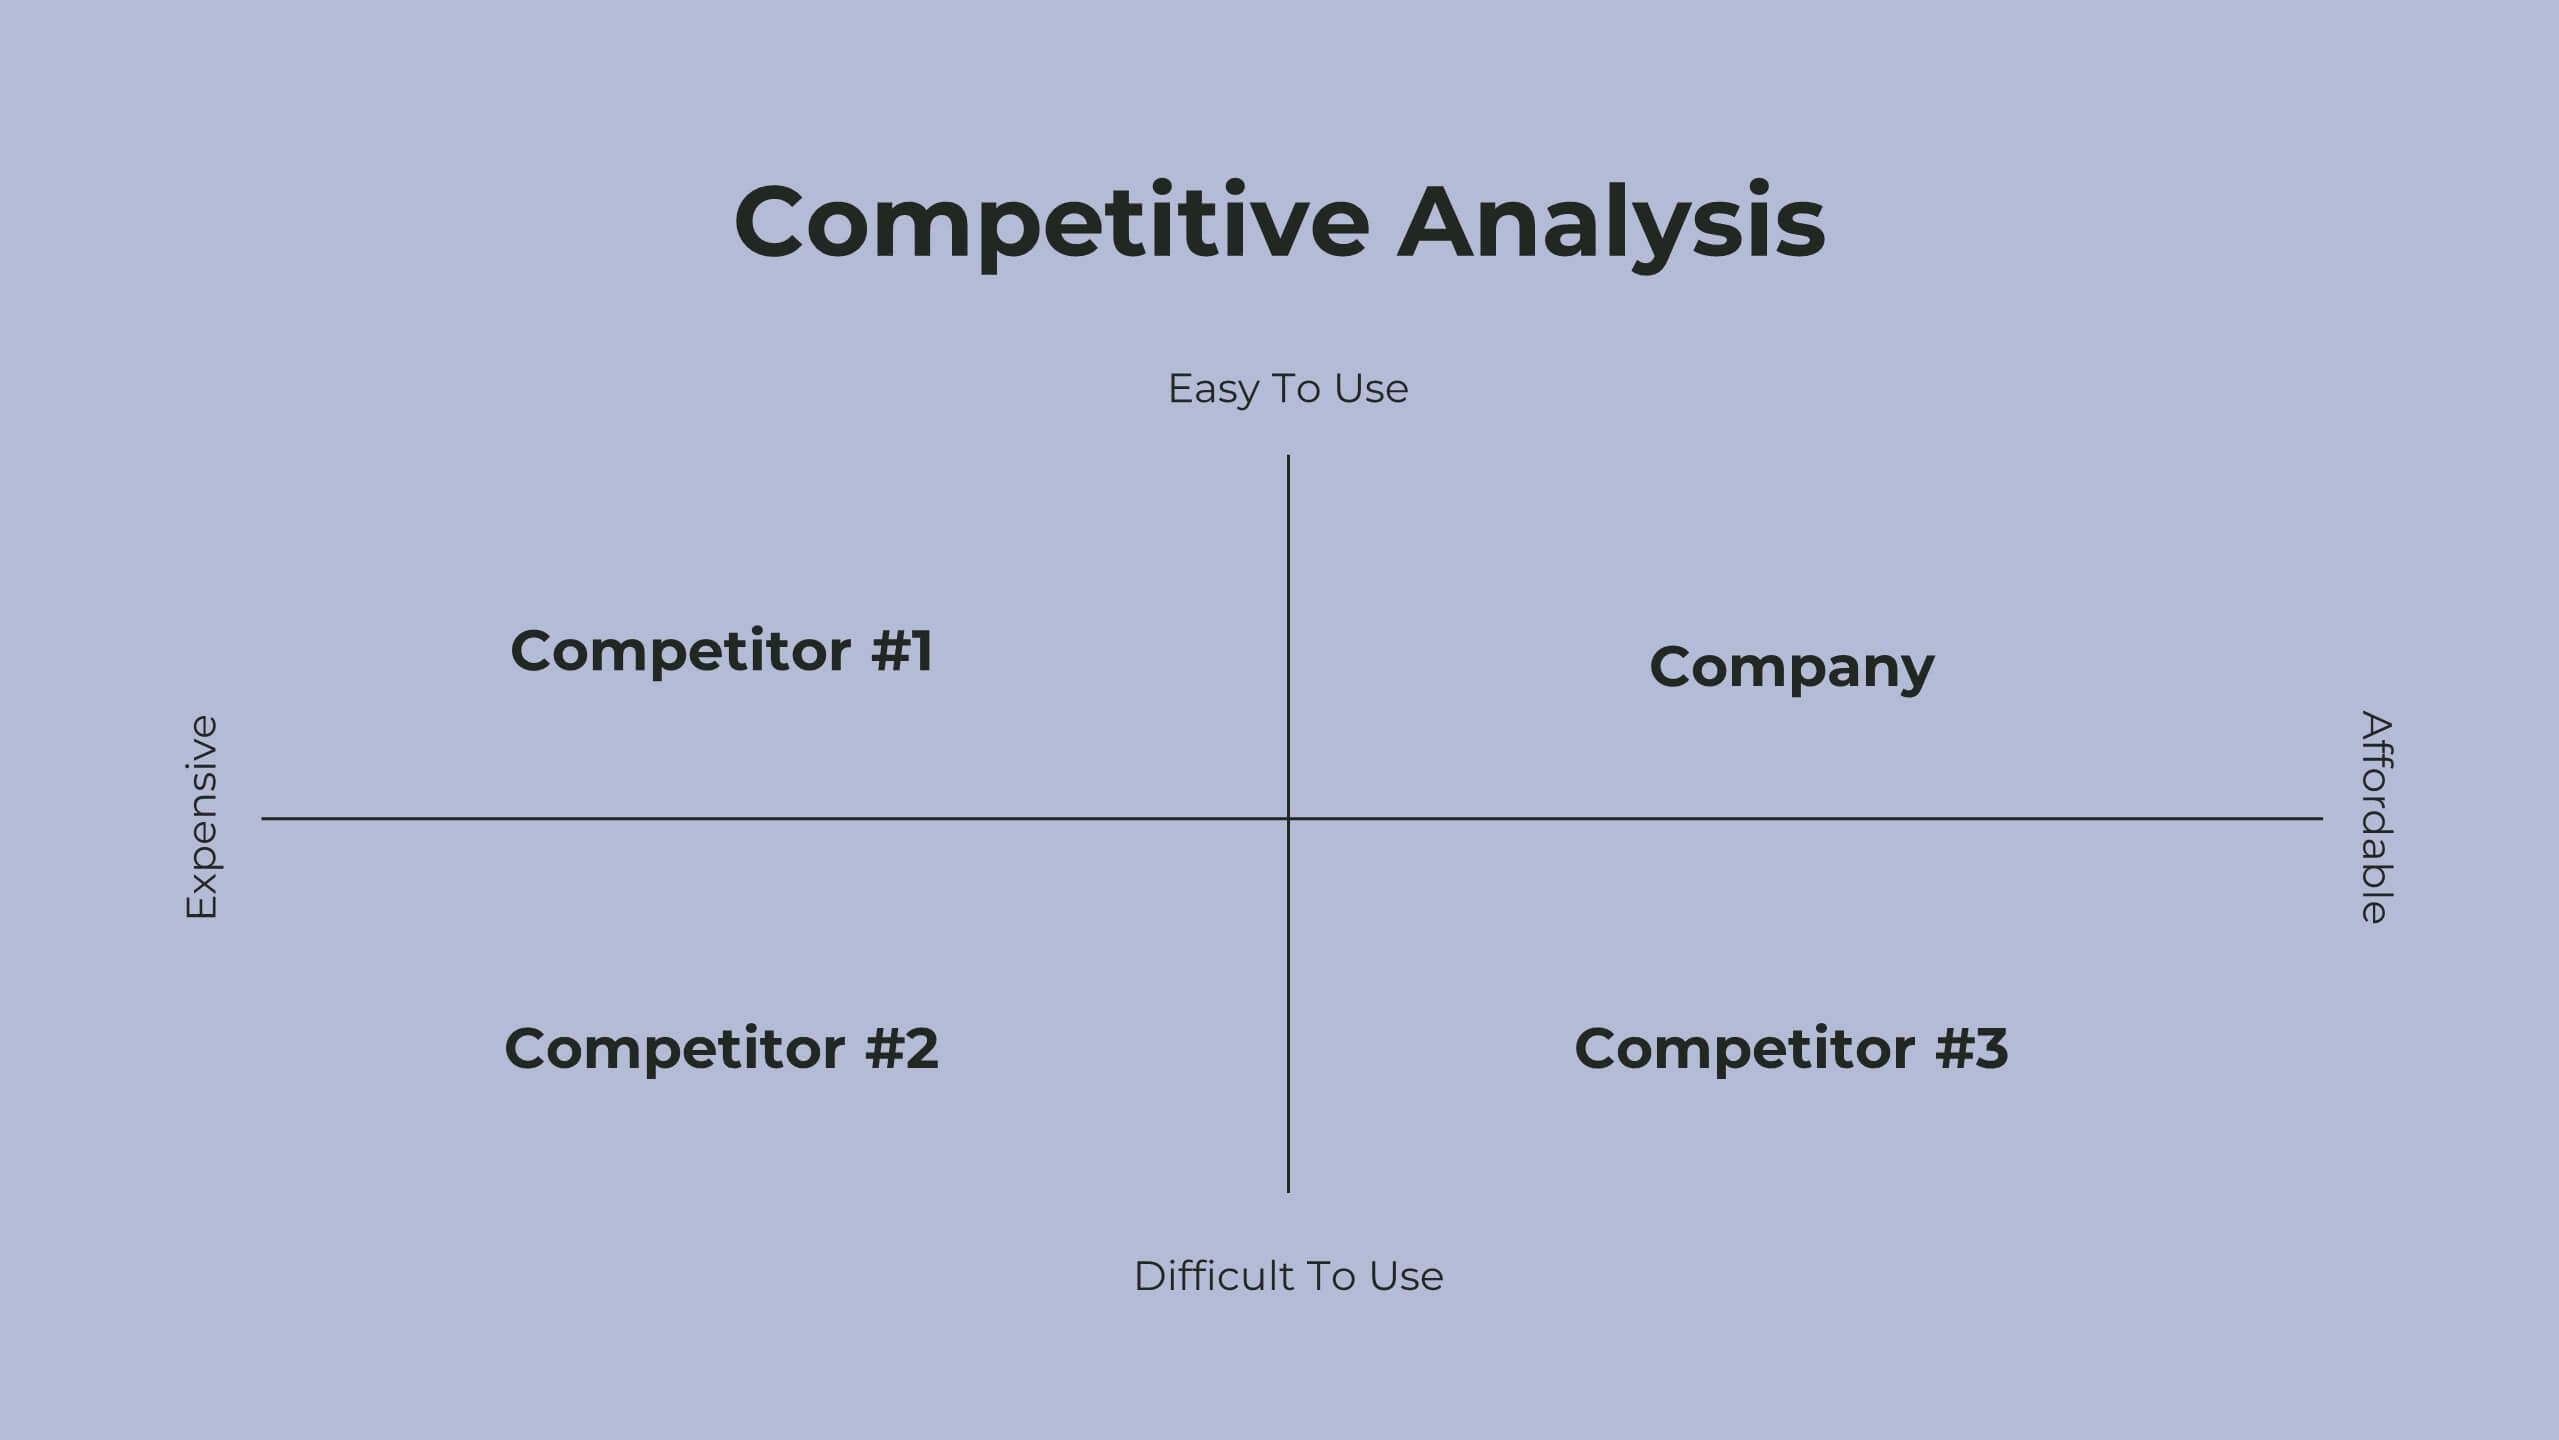
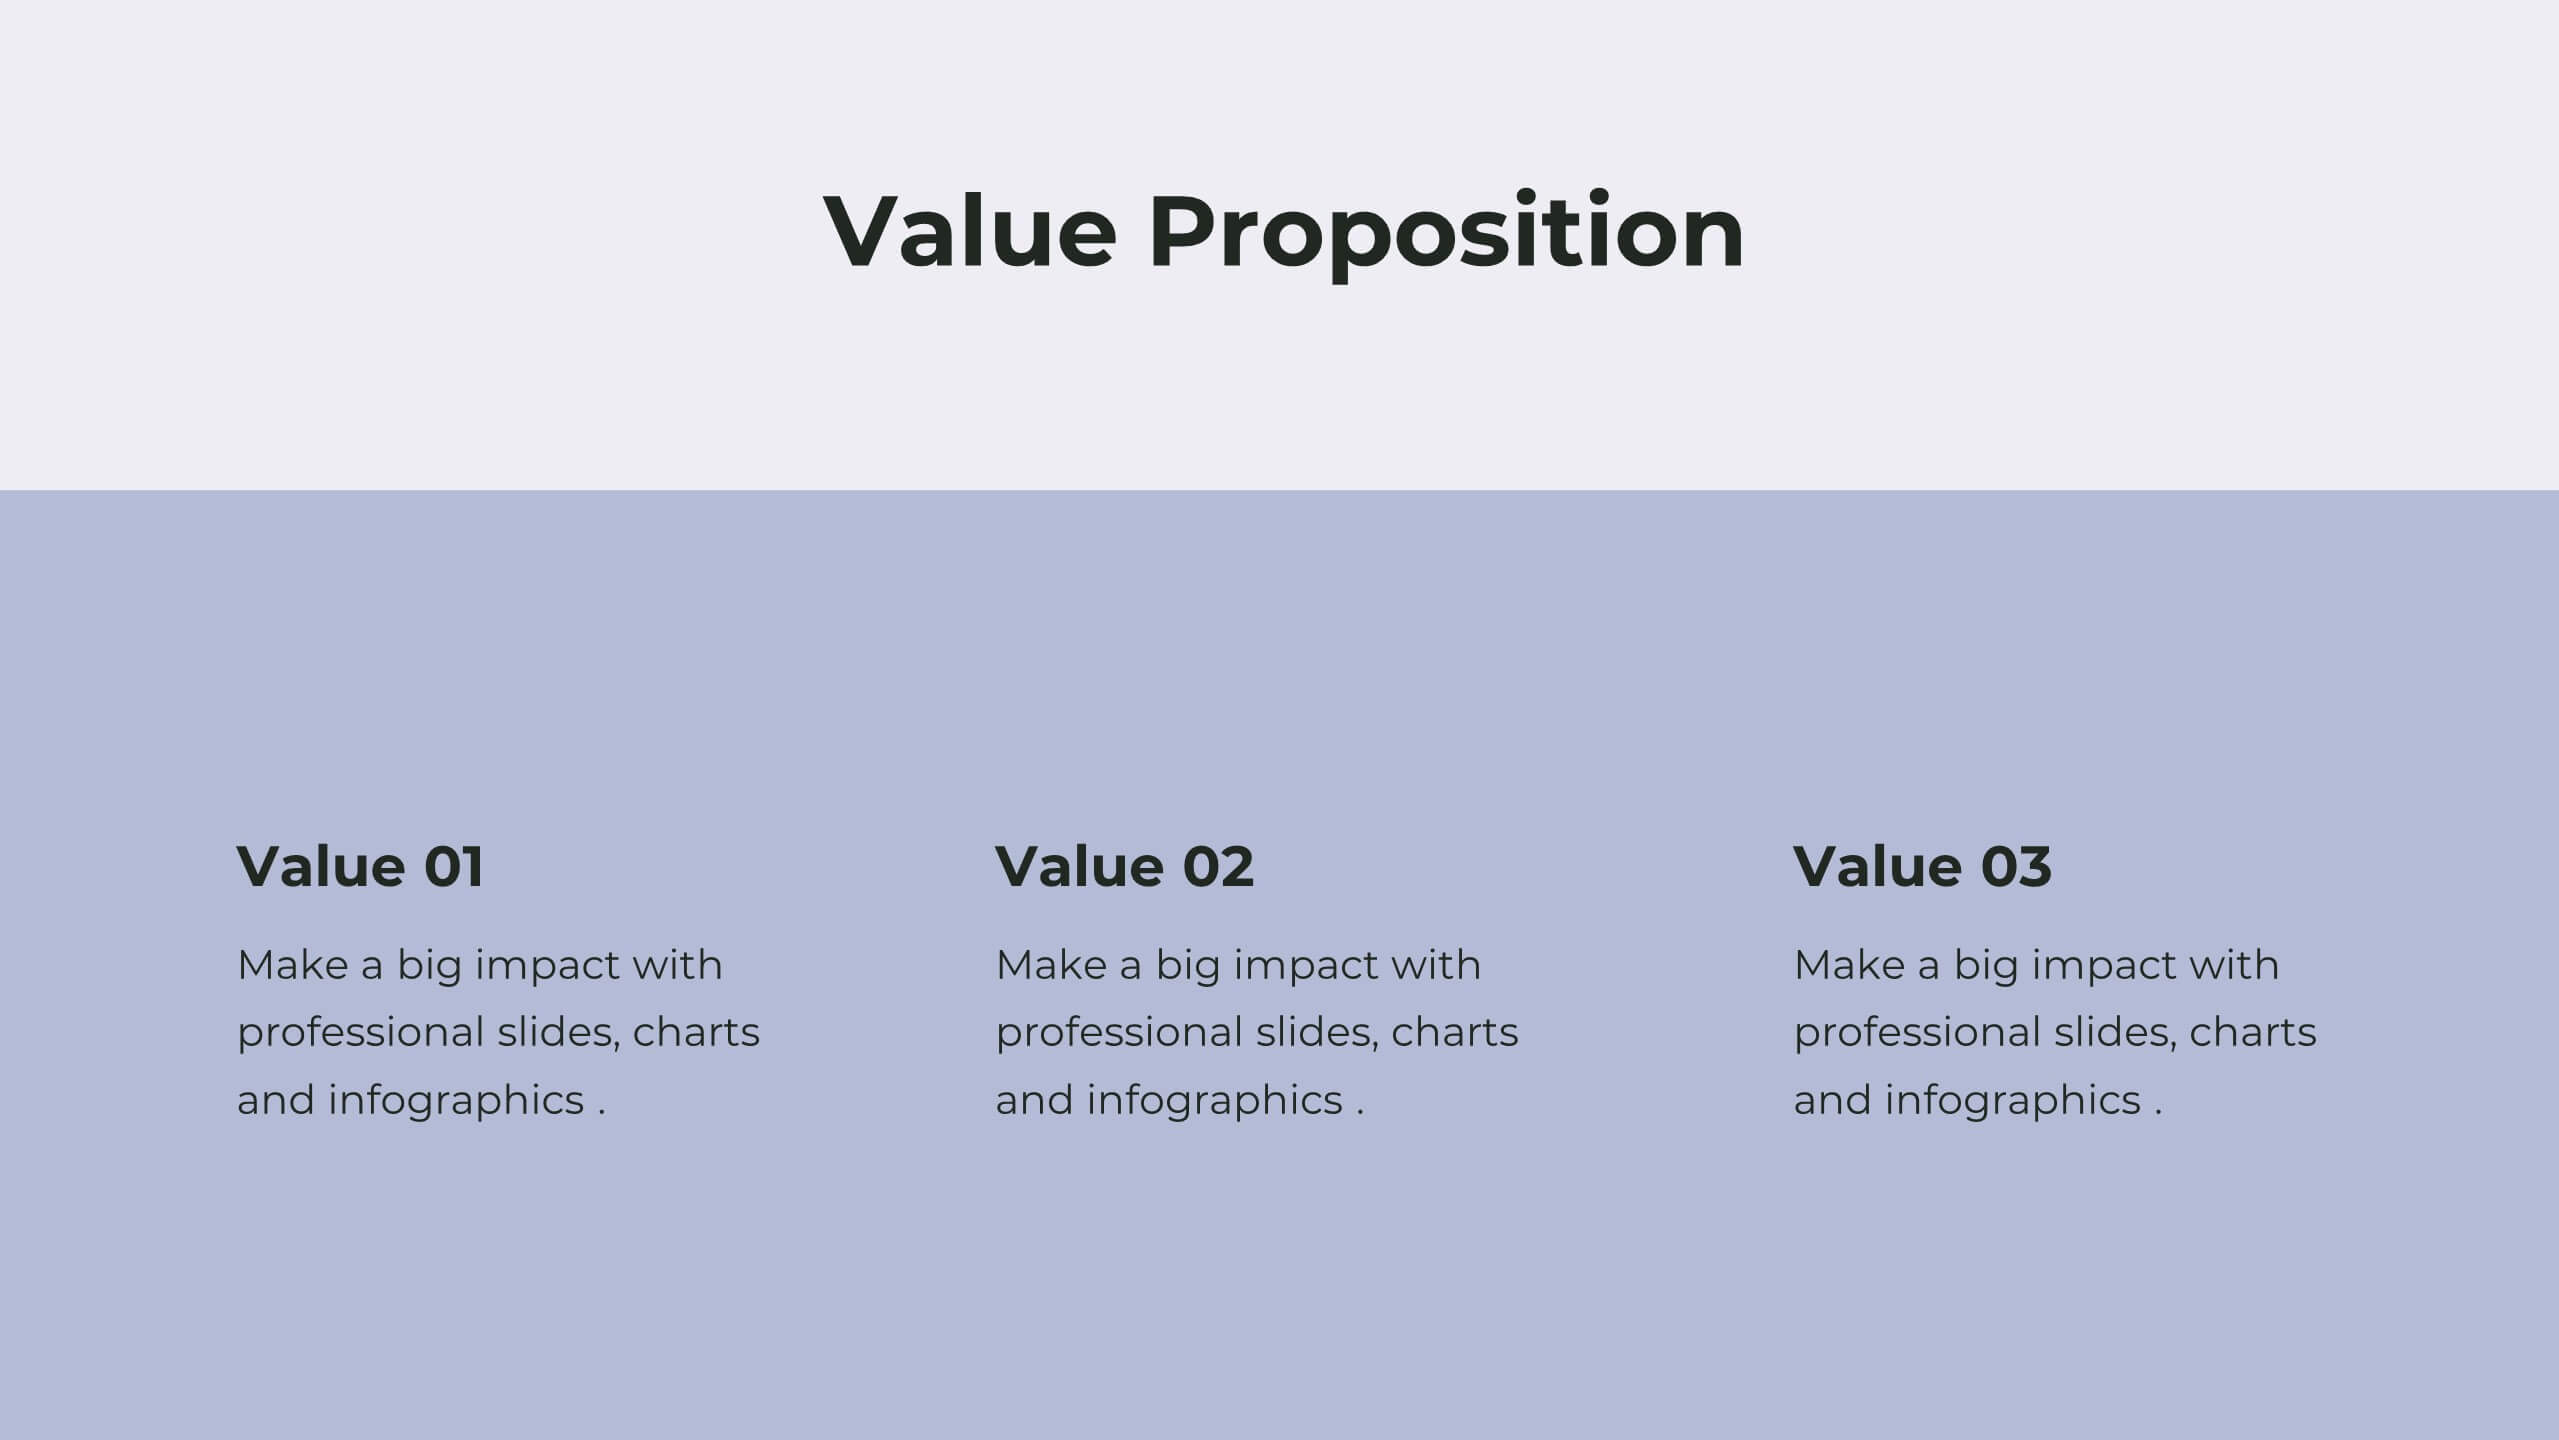
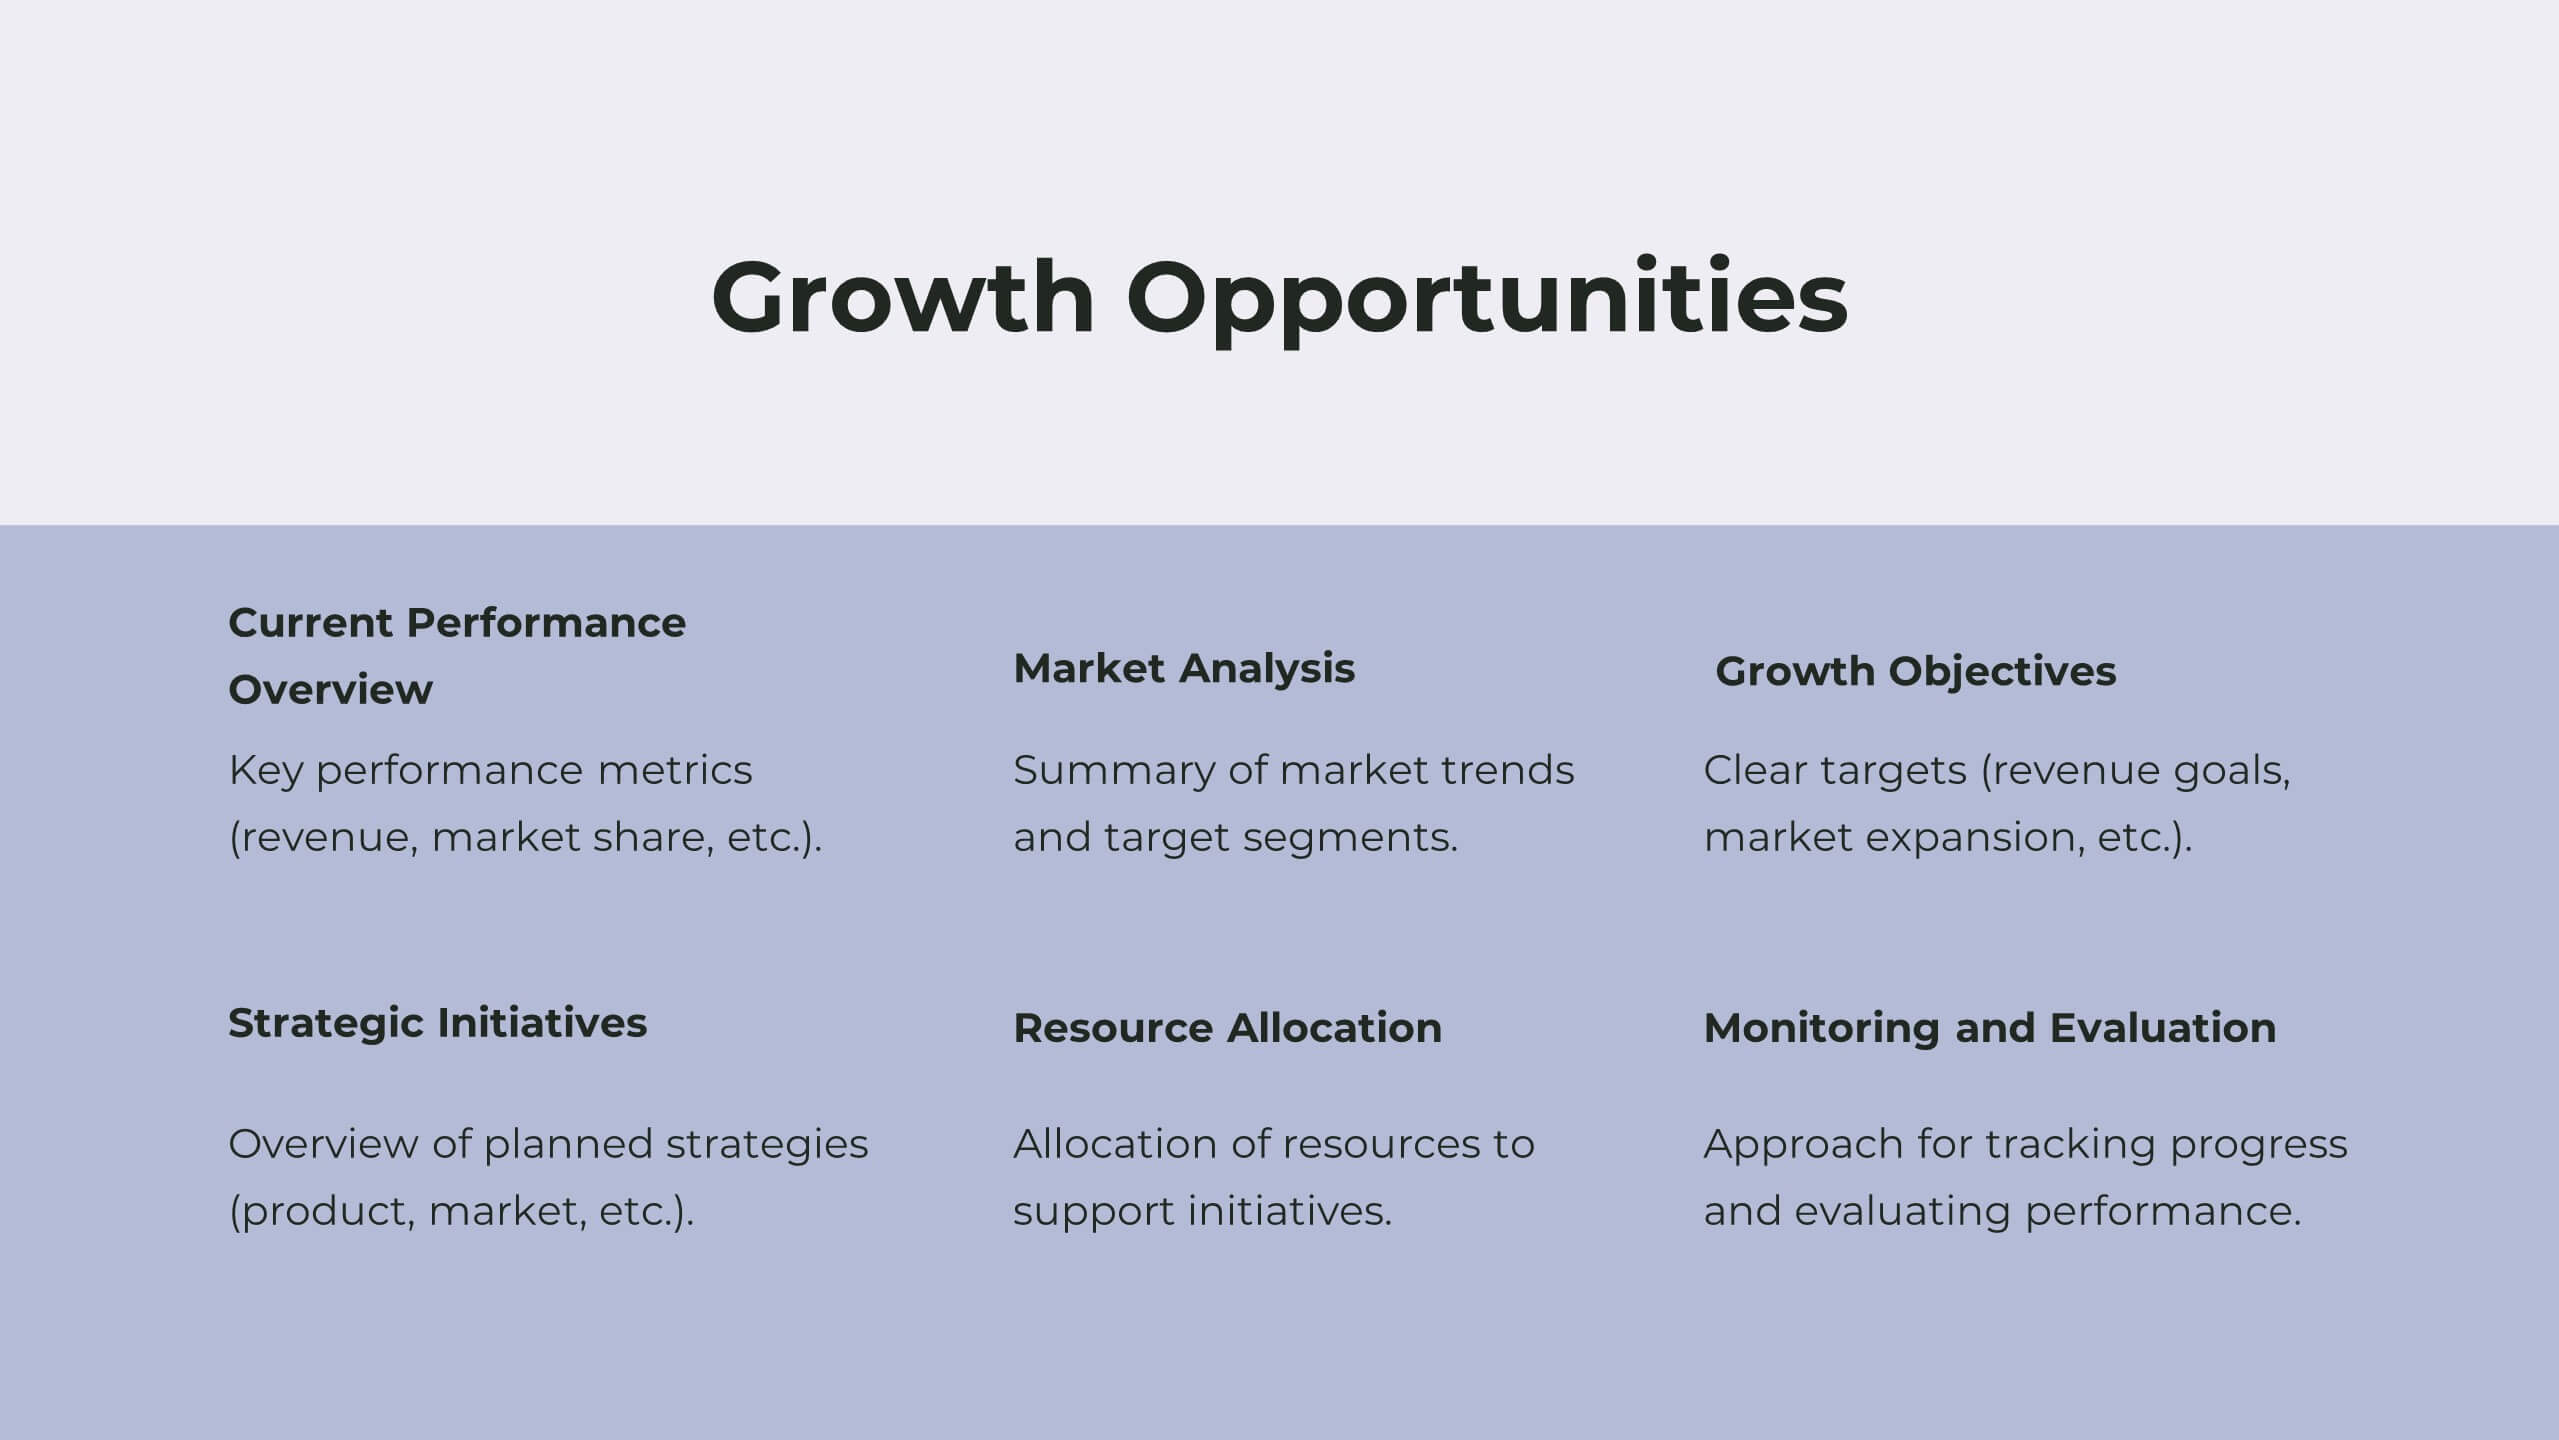
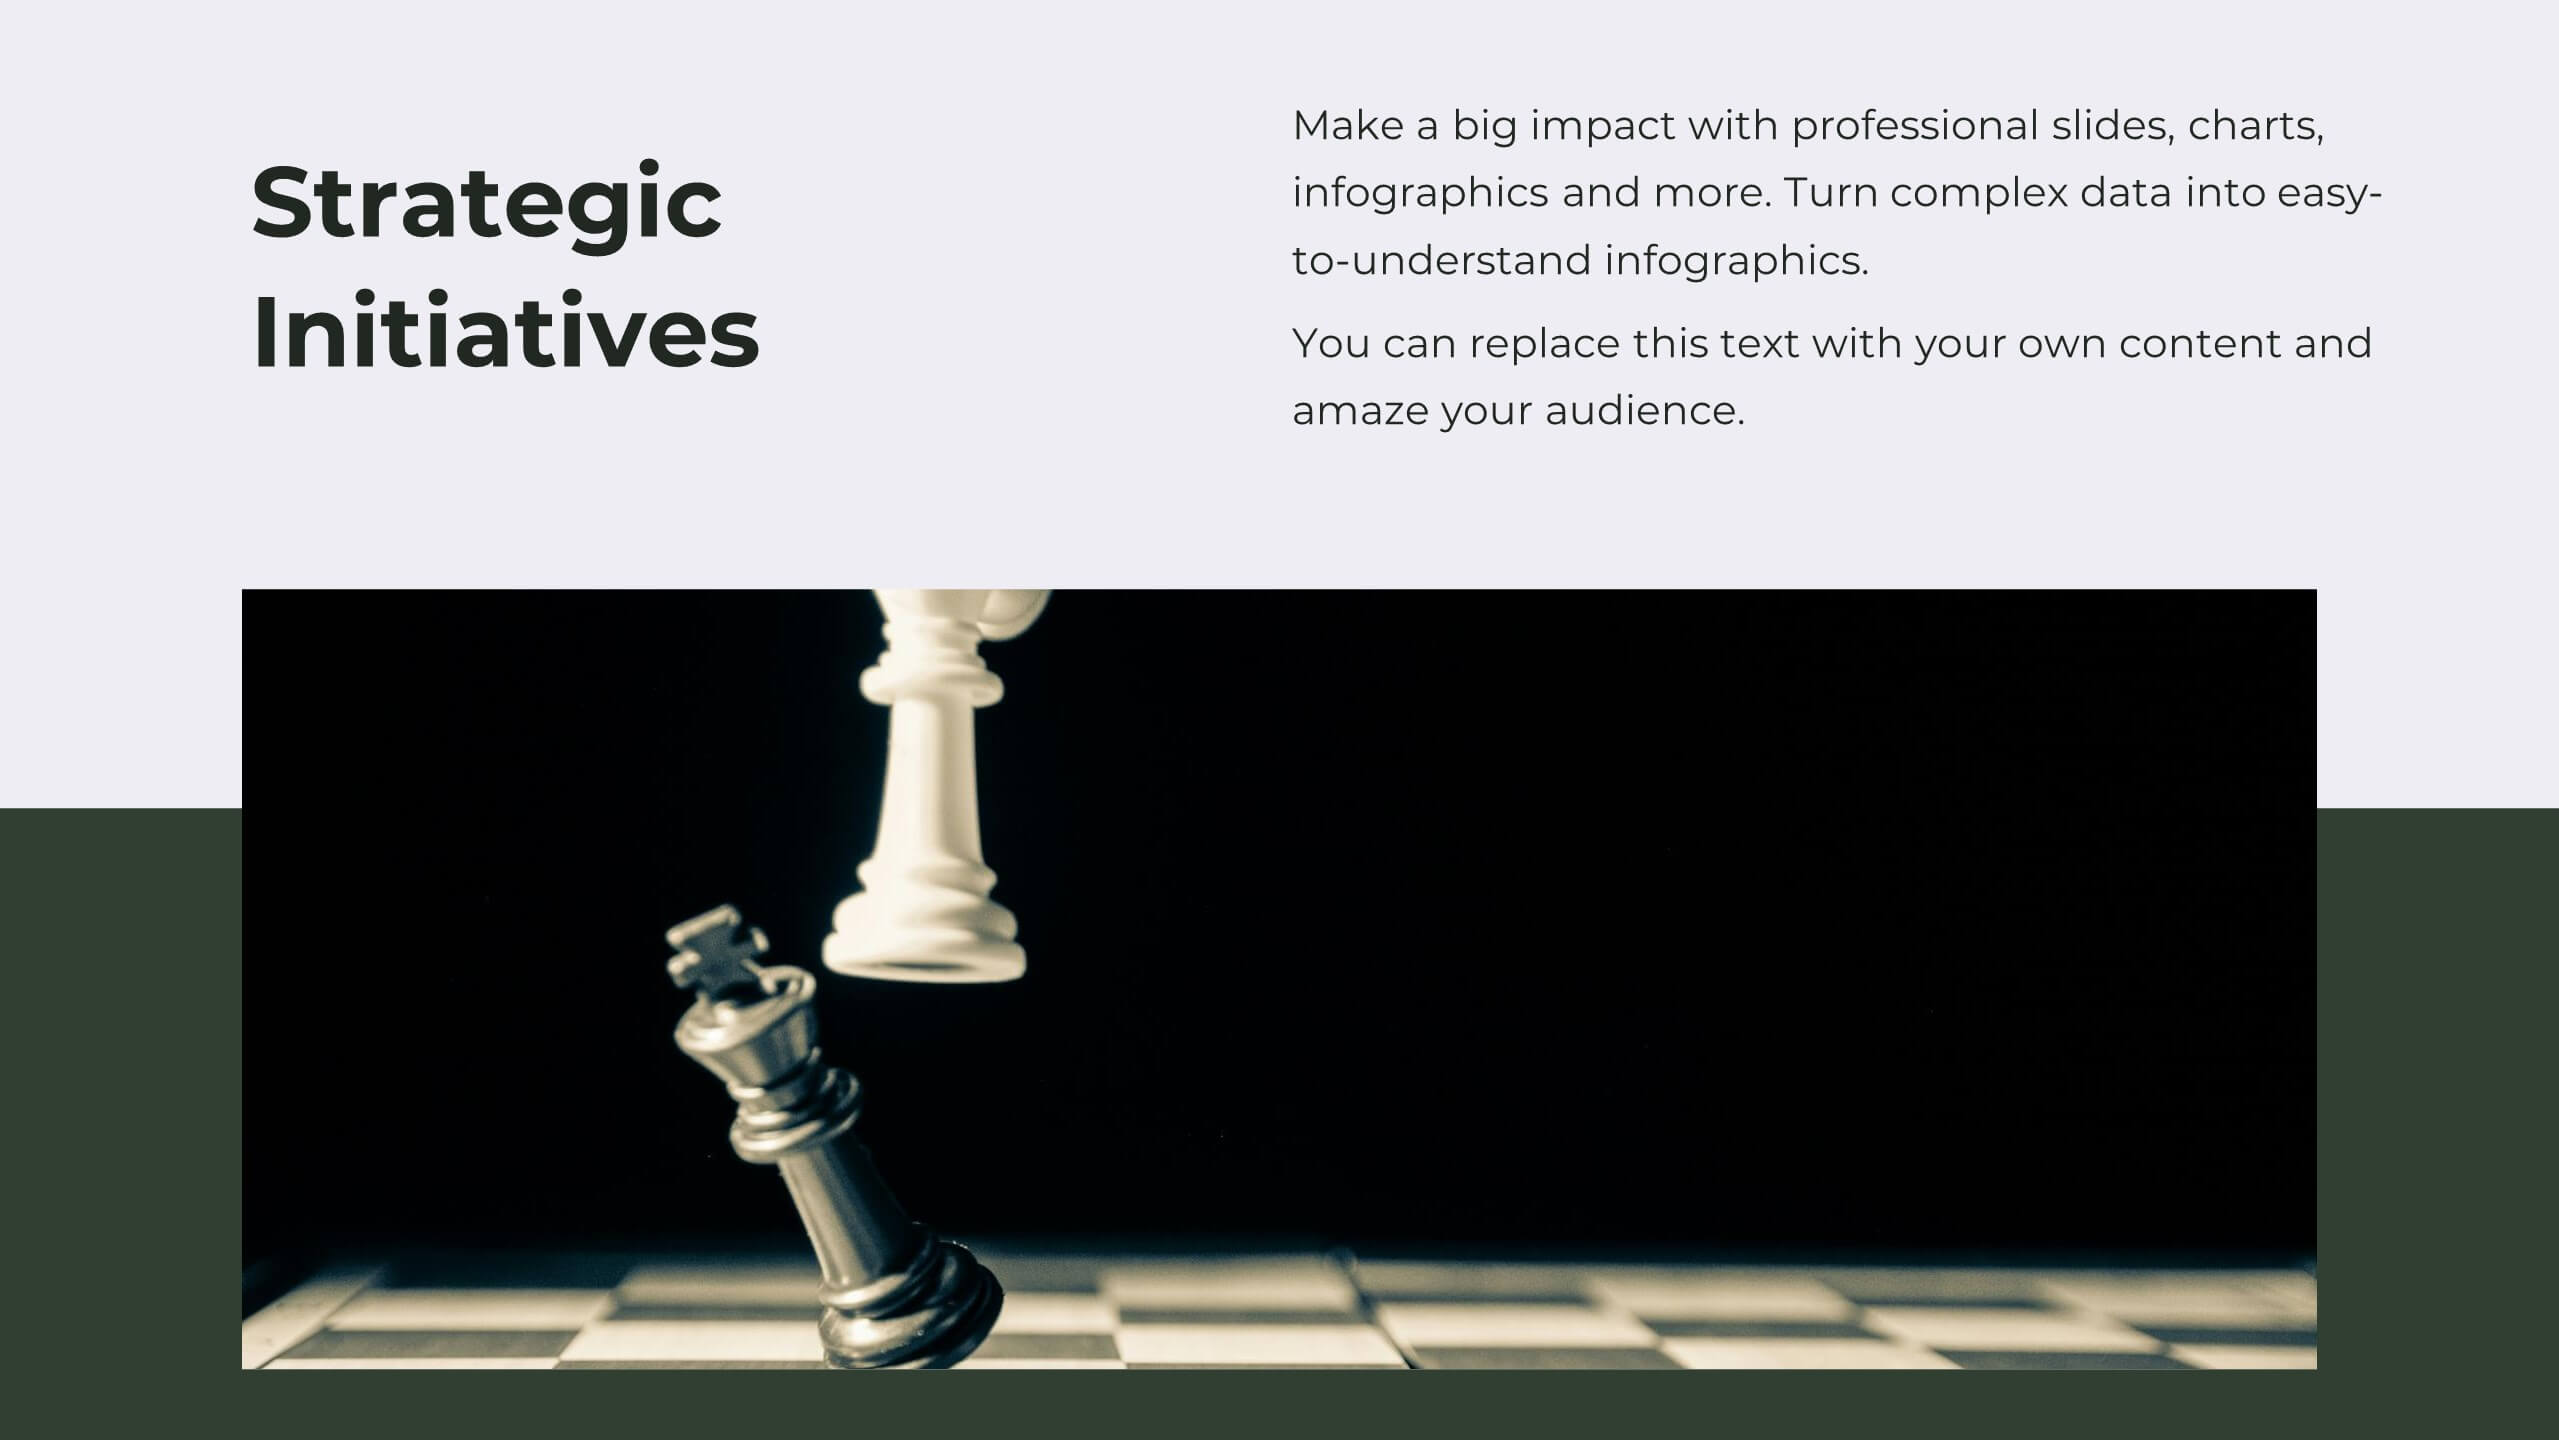
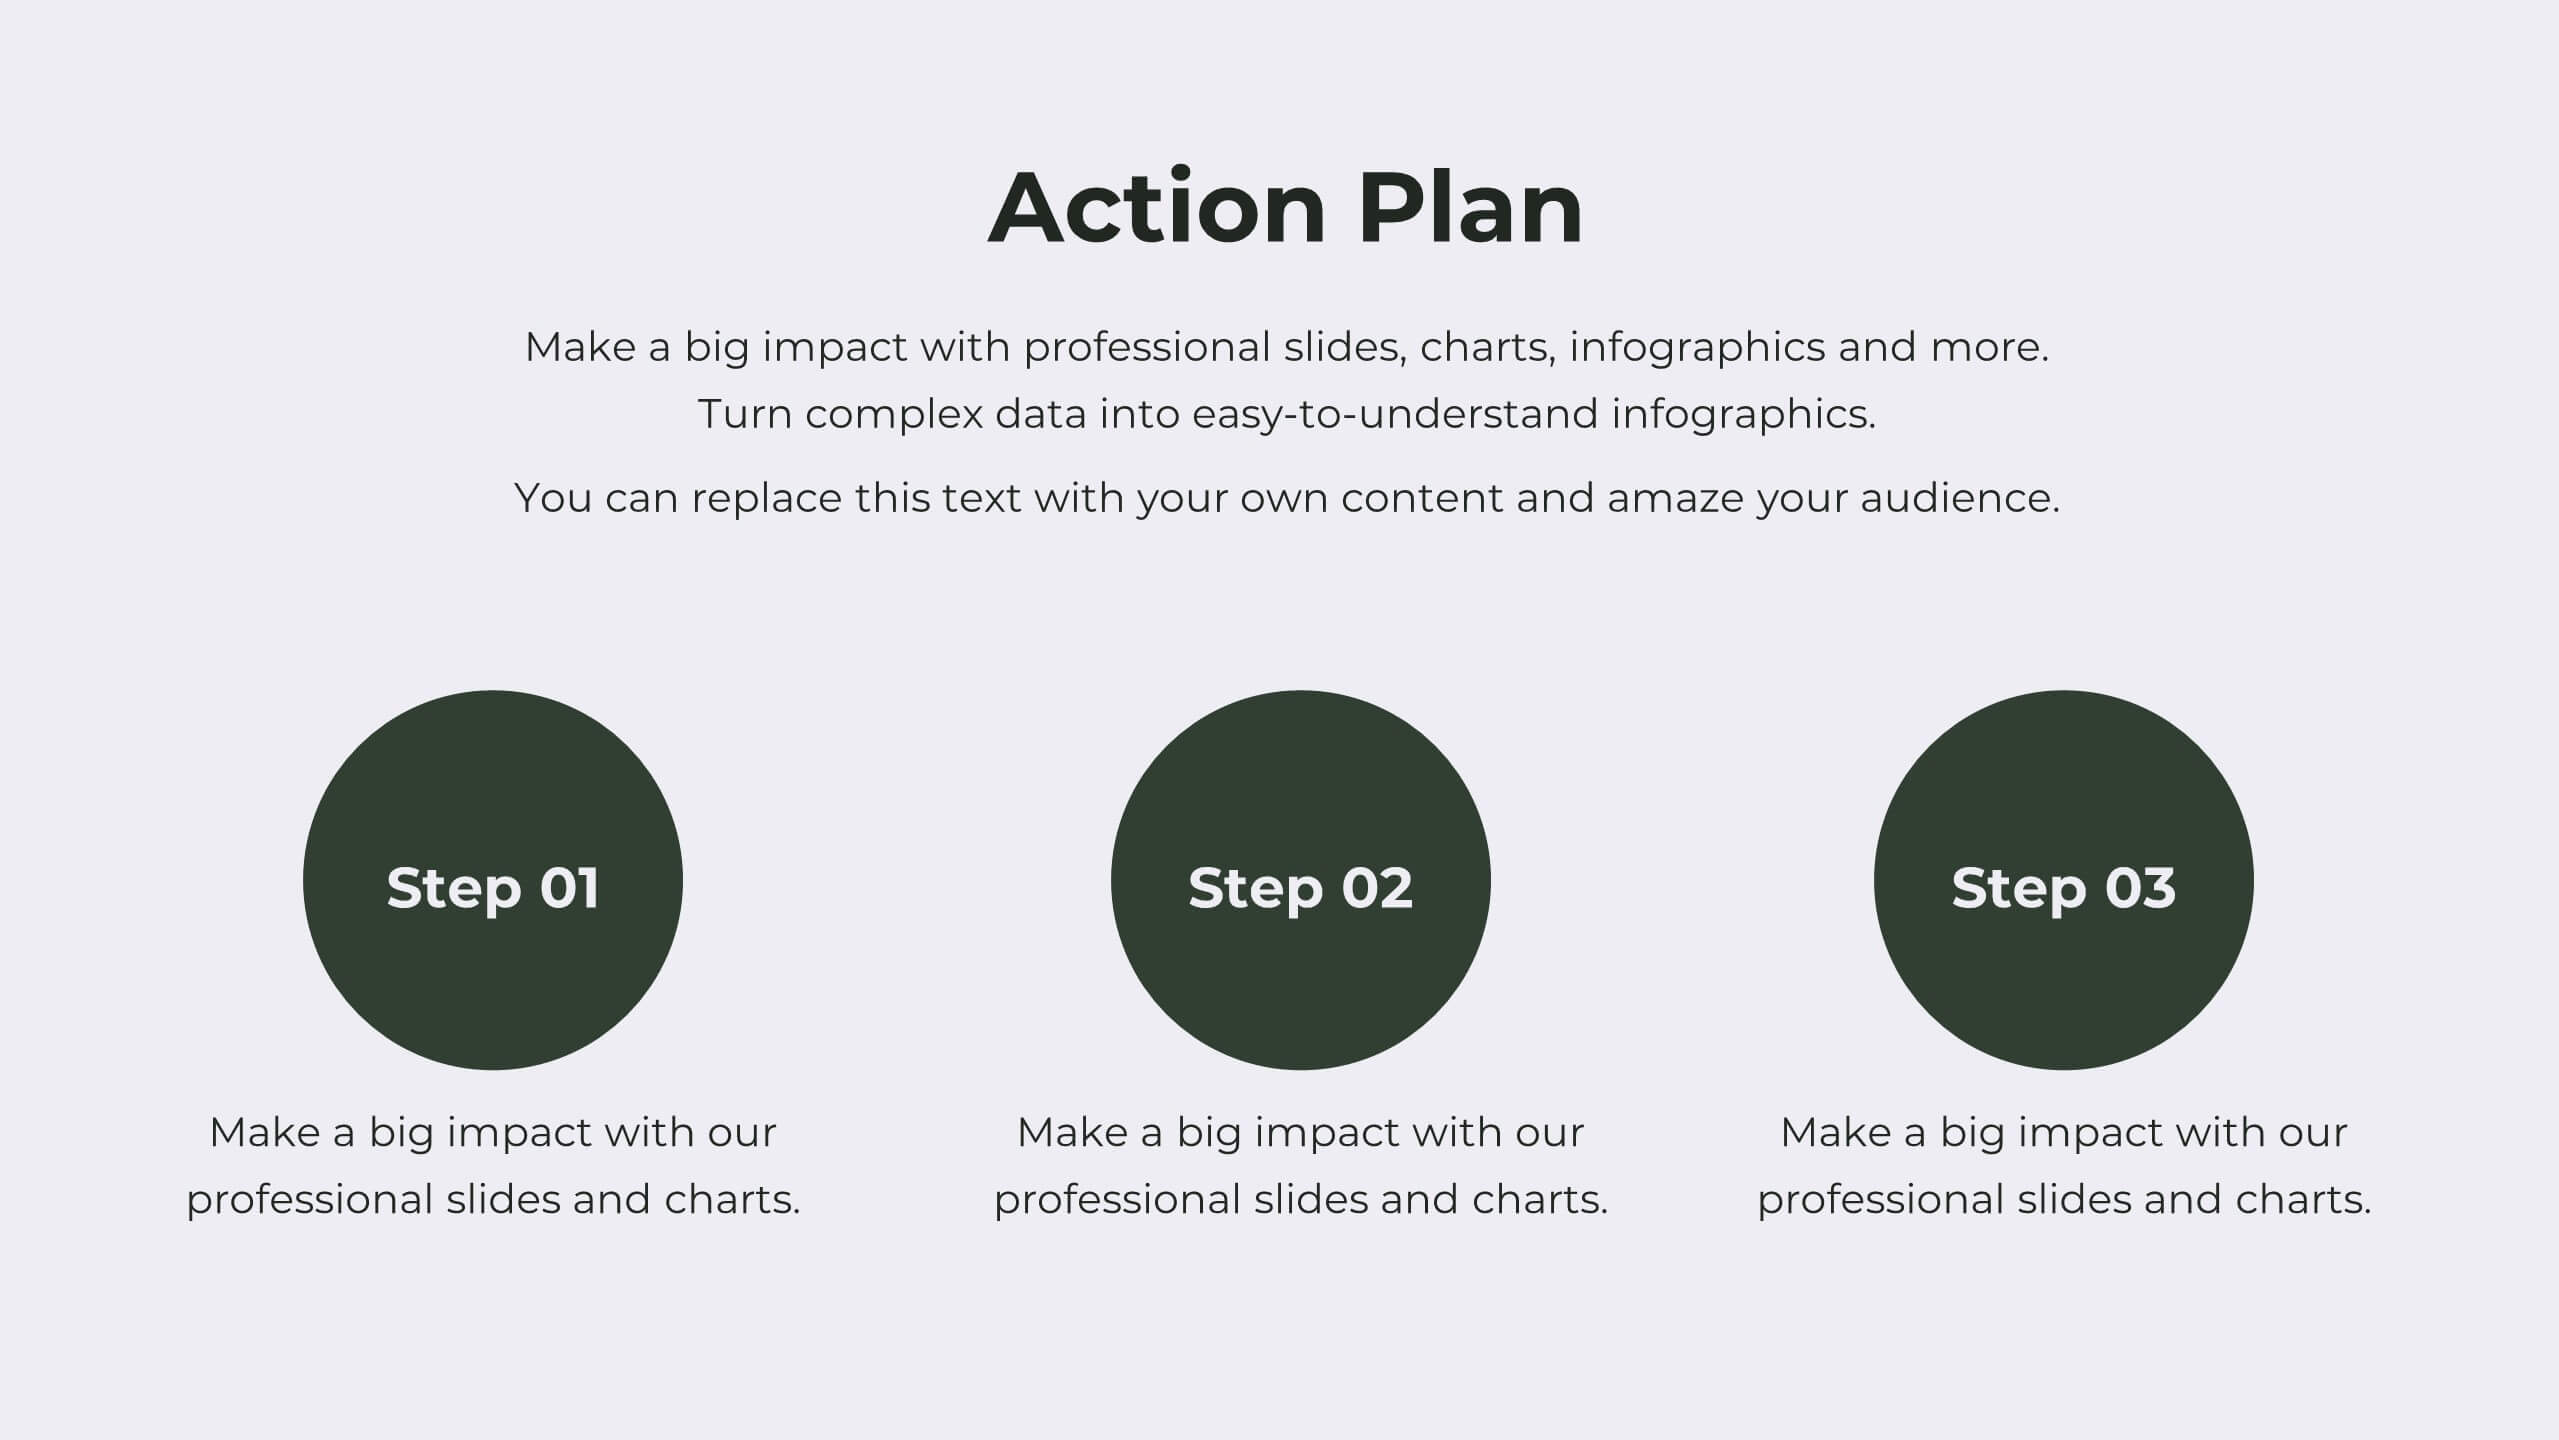
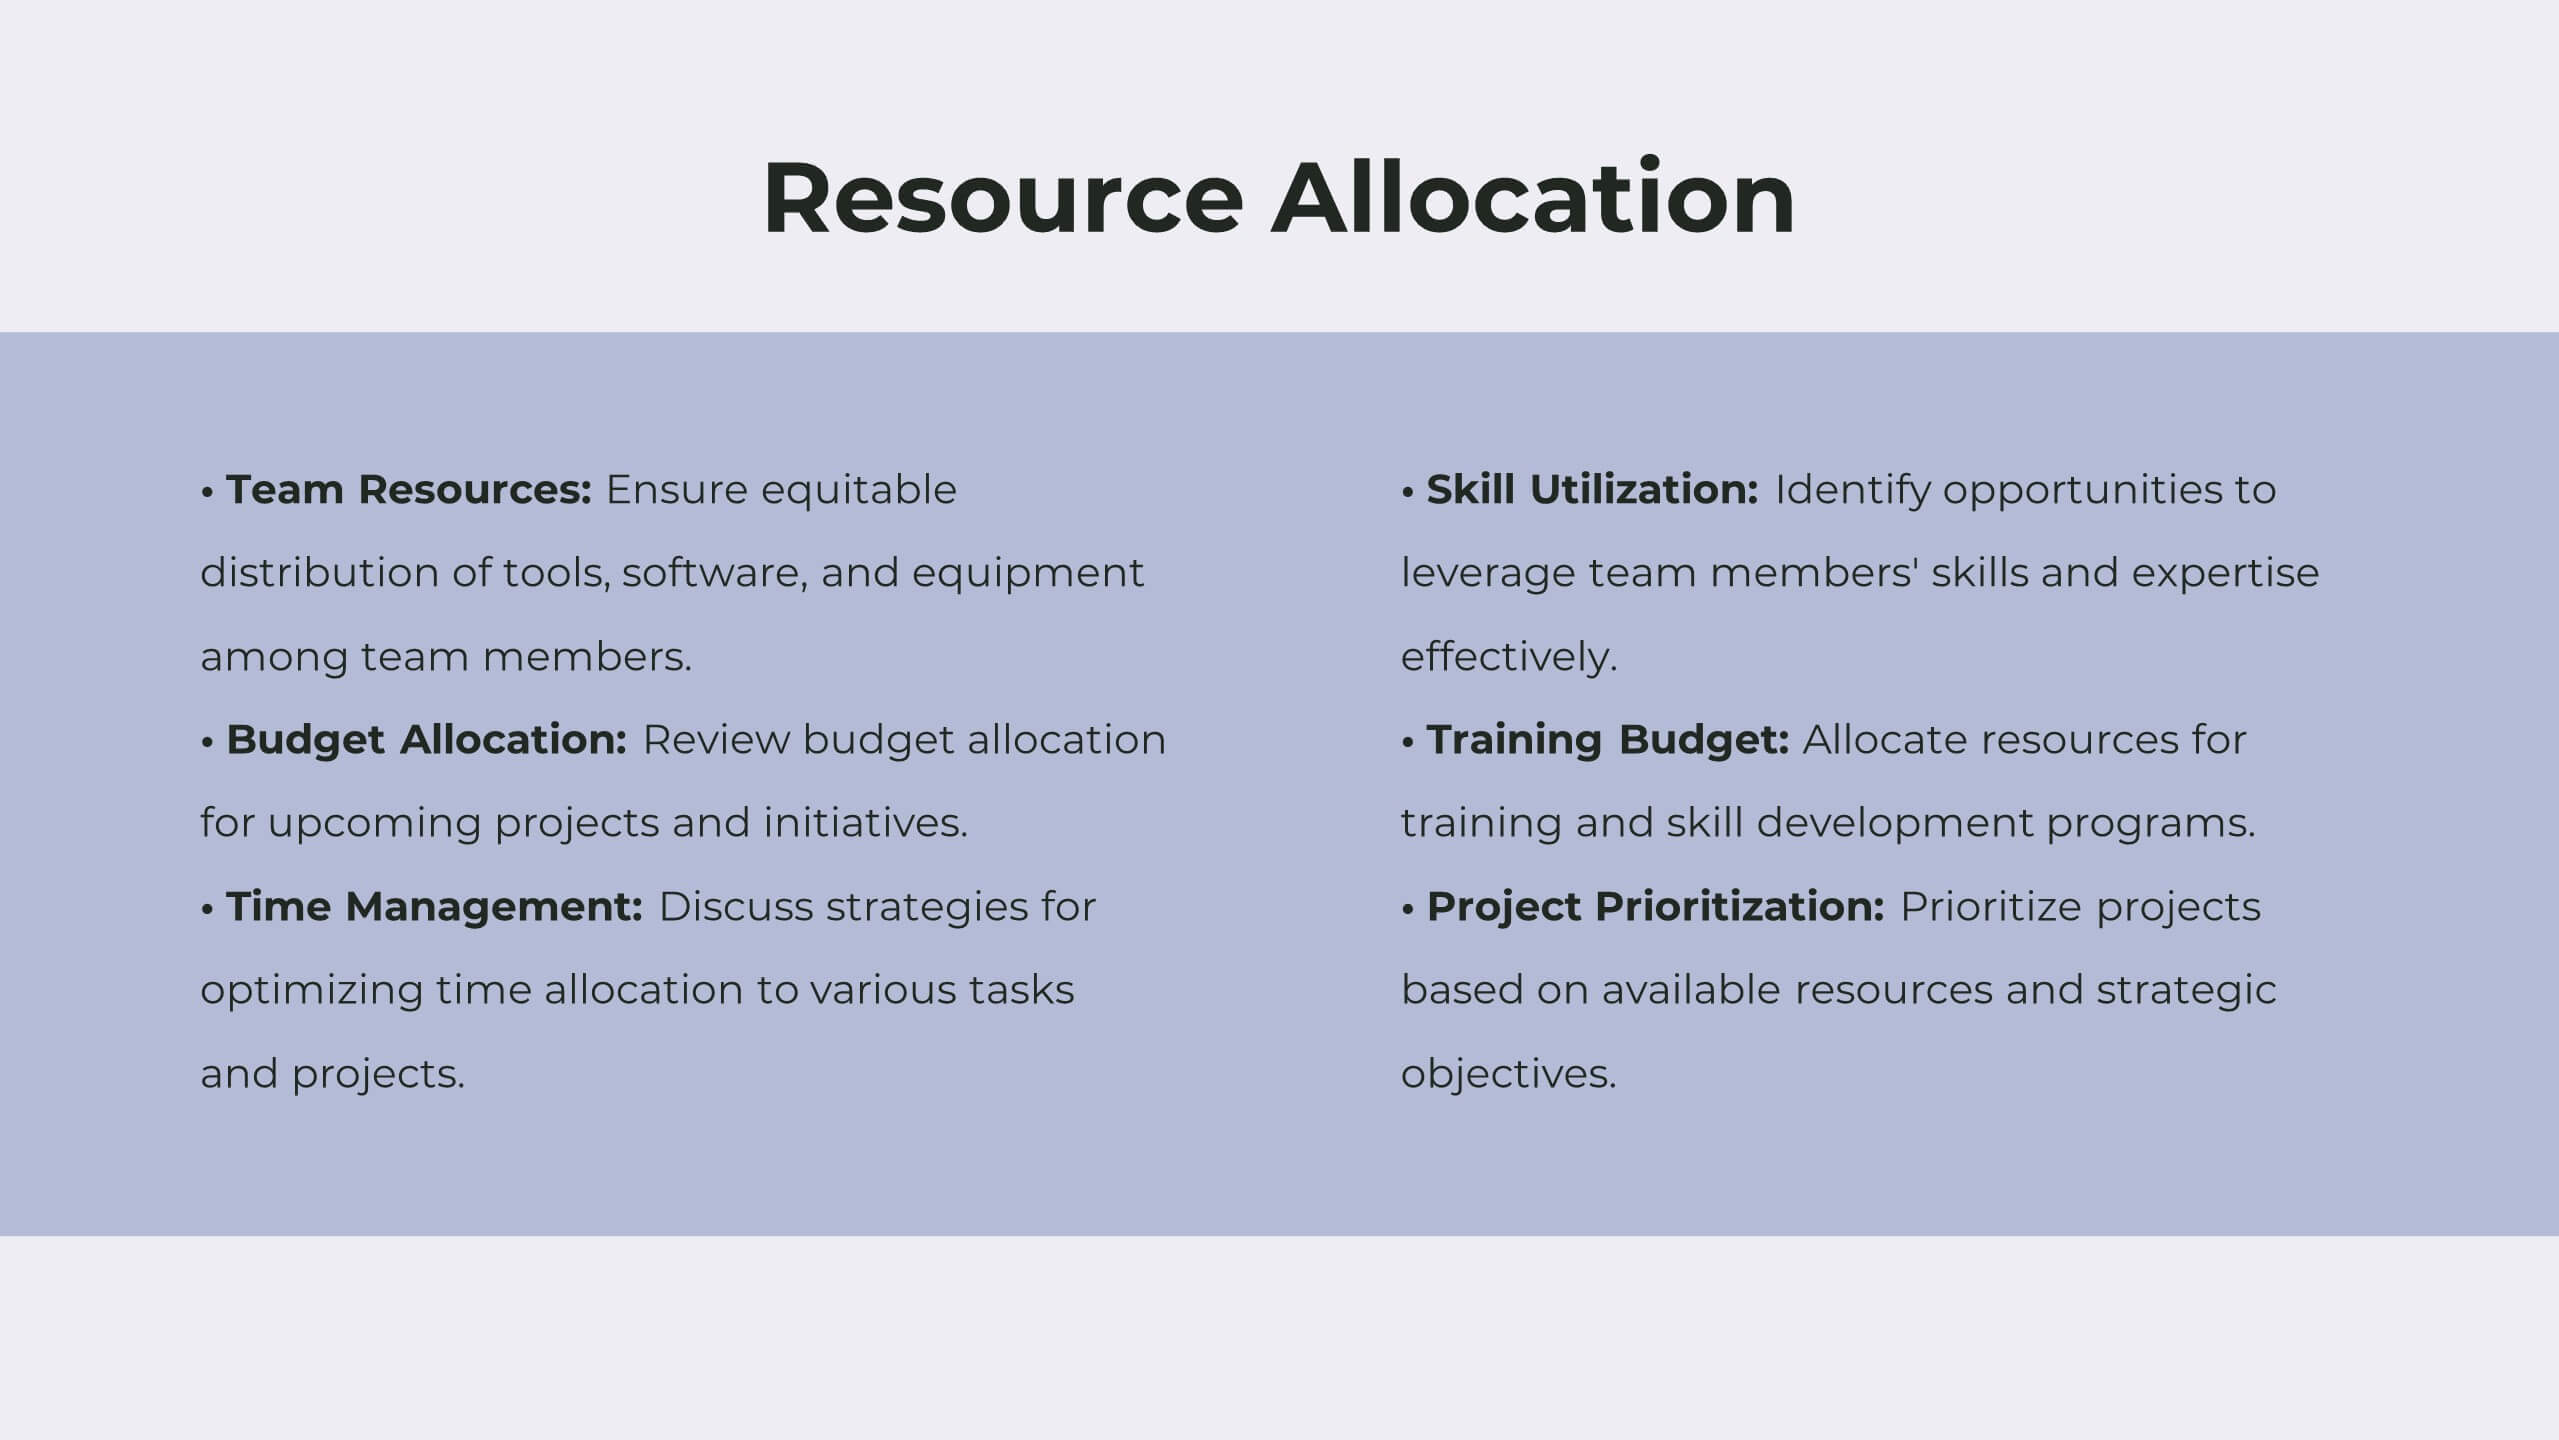
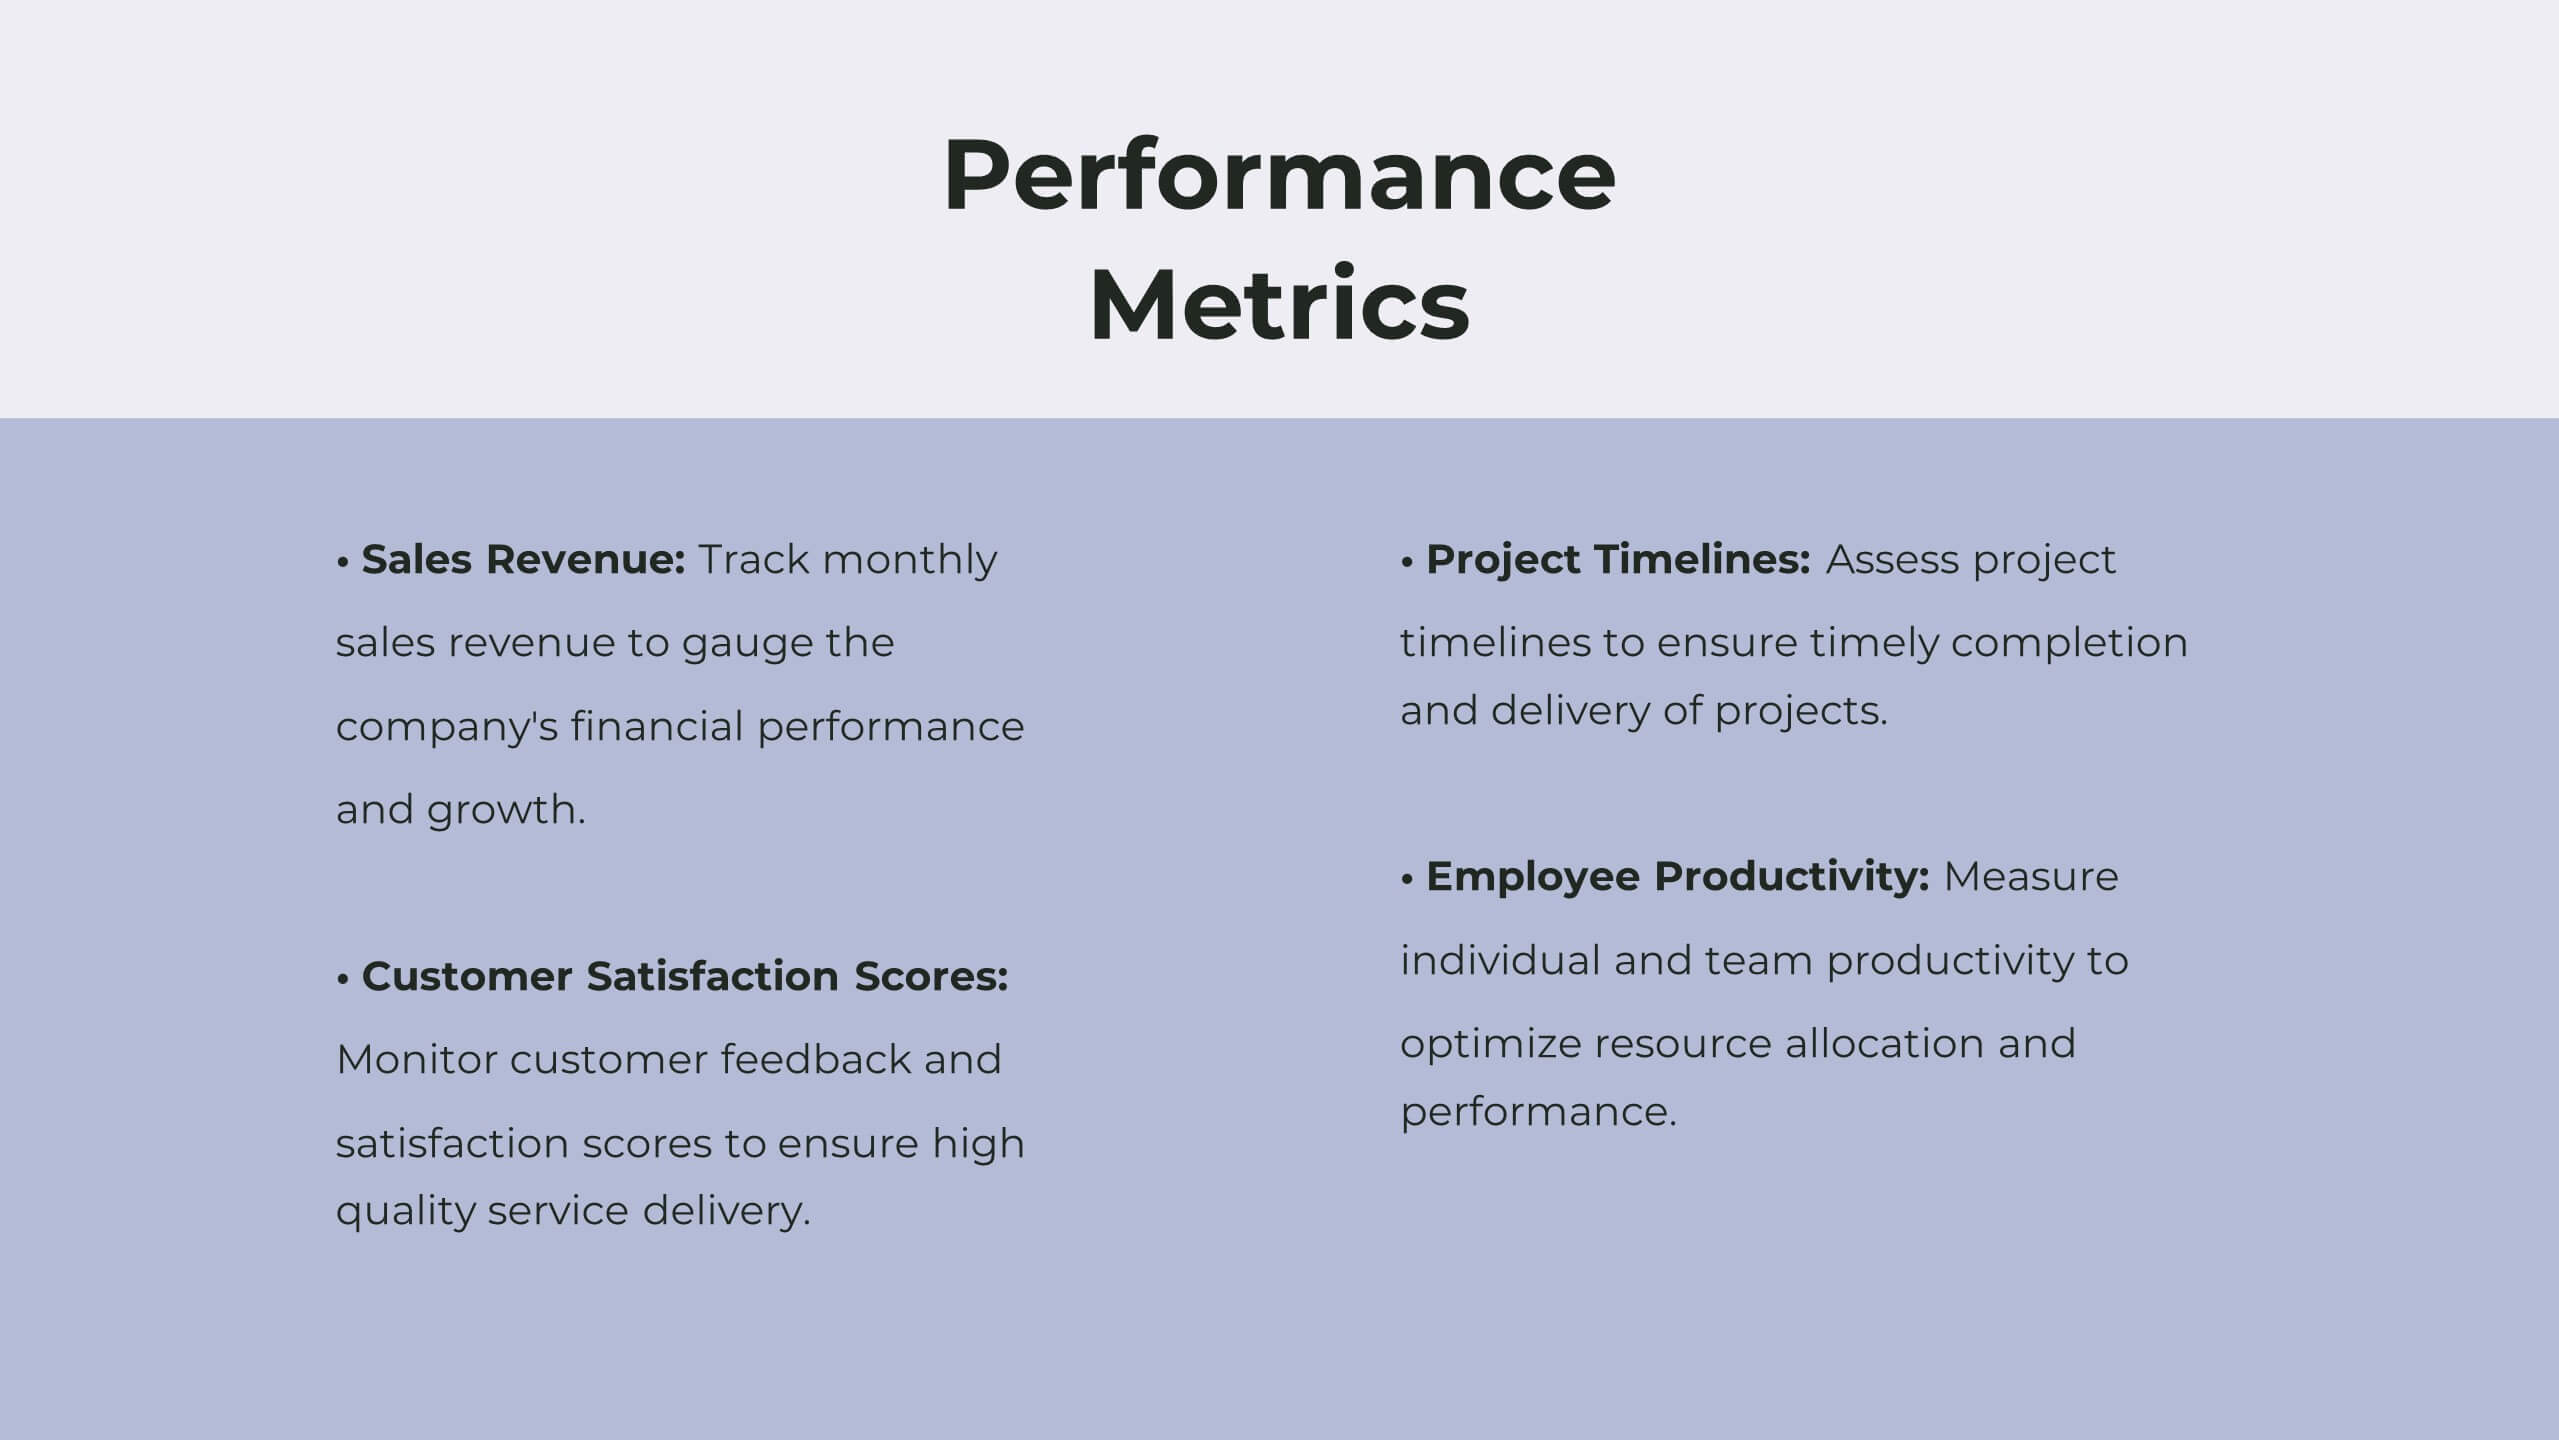
Tranquil Corporate Strategy Proposal Presentation
Drive your business forward with this elegant corporate strategy proposal template! Ideal for outlining strategic objectives, competitive analysis, and growth opportunities, it includes slides for SWOT analysis, resource allocation, and performance metrics. Impress stakeholders with clear visuals and structured content. Compatible with PowerPoint, Keynote, and Google Slides for seamless presentations on any platform.


5 slides
Pet Care Infographics
Pet care refers to the practices and actions taken to ensure the well-being, health, and happiness of pets. These vertical infographic templates are perfect for providing essential information and tips for pet owners to ensure the well-being and proper care of their furry companions. This infographic is designed to present key aspects of pet care in a concise and engaging manner, making it a valuable resource for pet owners, veterinarians, pet stores, or any organization related to pet care. Compatible with Powerpoint, Keynote, and Google Slides. Use the text boxes and graphs to promote responsible pet ownership and provide valuable information about pet care.


5 slides
Business KPI Performance Presentation
Bring your business results to life with a clear, modern layout designed to showcase key metrics and performance goals. Perfect for tracking growth, progress, and success indicators, this visual design helps make data easy to understand and engaging. Fully editable in PowerPoint, Keynote, and Google Slides.


6 slides
Effective Leadership Decision-Making Presentation
Enhance decision-making clarity with this Effective Leadership Decision-Making template. Designed for managers, executives, and strategists, this slide visually represents decision paths, prioritization, and leadership impact. Featuring color-coded options and engaging graphics, it helps illustrate the influence of choices on business outcomes. Fully compatible with PowerPoint, Keynote, and Google Slides, making it a seamless addition to your presentations.


5 slides
Economy Resumption Infographics
Economy Resumption refers to the process of restarting or restoring economic activity following a period of disruption or decline. This Infographic is a visual representations of information and data related to the economy after a disruption. They are designed to provide insights into the current state of the economy, the factors affecting its recovery, and the measures being taken to stimulate growth. This template can provide valuable insights into the state of the economy by presenting data and information in an accessible and visually engaging way. This can help decision-making and drive positive economic outcomes.


21 slides
Stellara Content Marketing Pitch Deck Presentation
This Marketing Pitch Deck Presentation is designed to showcase your business strategies with clarity and style. Featuring slides for company history, market presence, financial highlights, and growth plans, it's perfect for startups and agencies. Fully editable and compatible with PowerPoint, Keynote, and Google Slides.


10 slides
Six Sigma Process Improvement
Visualize each stage of the Six Sigma DMAIC methodology—Define, Measure, Analyze, Improve, and Control—with this circular diagram layout. Perfect for quality control meetings, workflow optimization, and training sessions. Fully customizable in PowerPoint, Keynote, and Google Slides.