


Features
- 6 Unique slides
- Fully editable and easy to edit in Microsoft Powerpoint, Keynote and Google Slides
- 16:9 widescreen layout
- Clean and professional designs
- Export to JPG, PDF or send by email


Do you have any questions?
Recommend


2 slides
Creative Gratitude Slide
Wrap up your presentation with impact using this clean, modern “Thank You” slide. Featuring space for a photo, contact details, and playful design elements, it's perfect for leaving a lasting impression. Ideal for business proposals, pitch decks, and educational slide decks. Fully editable in PowerPoint, Keynote, and Google Slides.


6 slides
Artificial Intelligence Stocks Infographics
Our "Artificial Intelligence Stocks" infographic template, ideal for PowerPoint, Keynote, and Google Slides, is tailored for financial analysts, investors, and tech enthusiasts. This template seamlessly blends technology and finance, focusing on AI stocks and investment trends. This futuristic design includes elements such as AI technology trends, stock market performance, and investment opportunities. It’s an invaluable tool for presenting complex financial and technological data in a clear and visually appealing manner. The template is perfect for conveying intricate investment strategies and market insights related to the burgeoning AI sector. The template features a cutting-edge design with a color scheme that blends shades of blue and gray, symbolizing innovation and financial growth. It’s designed to make your presentation not only informative but also visually engaging. Whether used in investor meetings, tech conferences, or educational seminars, this template ensures your insights on AI stocks are presented with clarity and sophistication.


6 slides
Machine Learning Systems Overview
Get ready to light up your next tech talk with a bold, clean layout that simplifies even the most complex systems. This infographic presentation template is designed to break down how intelligent algorithms function, analyze data, and learn patterns—perfect for explaining how machine learning fits into real-world applications. Each slide uses smart visuals and icons to guide viewers through each system stage with clarity. Ideal for educators, developers, or startups pitching AI-powered solutions, it’s a creative and professional way to keep your audience engaged. Fully compatible with PowerPoint, Keynote, and Google Slides.


25 slides
Company Profile Presentation
Embark on a corporate expedition with a comprehensive view into the essence of our company, where every segment unfolds our identity, goals, and the values that steer our journey. Meet the dynamic team at the helm, diverse minds and talents crafting the future with innovation and dedication. Navigate through our strategic roadmap, from humble beginnings to ambitious horizons, spotlighting our customer-centric approach that underpins every achievement. Witness our milestones arrayed in a timeline that speaks volumes of progress and resilience, punctuated by major leaps and bounds in our industry. Grasp our ethos, 'Customer Satisfaction is our Top Priority,' a mantra evident in each service we render and product we craft. Within these slides lies a story of growth, learning, and unyielding commitment to excellence. As we project the chart of our achievements, a pattern of steady ascension emerges, painting a picture of a company that not only dreams big but also acts with precision to materialize those dreams. This profile is more than a showcase—it's an invitation to explore the depths of our corporate narrative, and a thank you to all who join us on this remarkable venture.


22 slides
Ember Full-Service Agency Project Plan Presentation
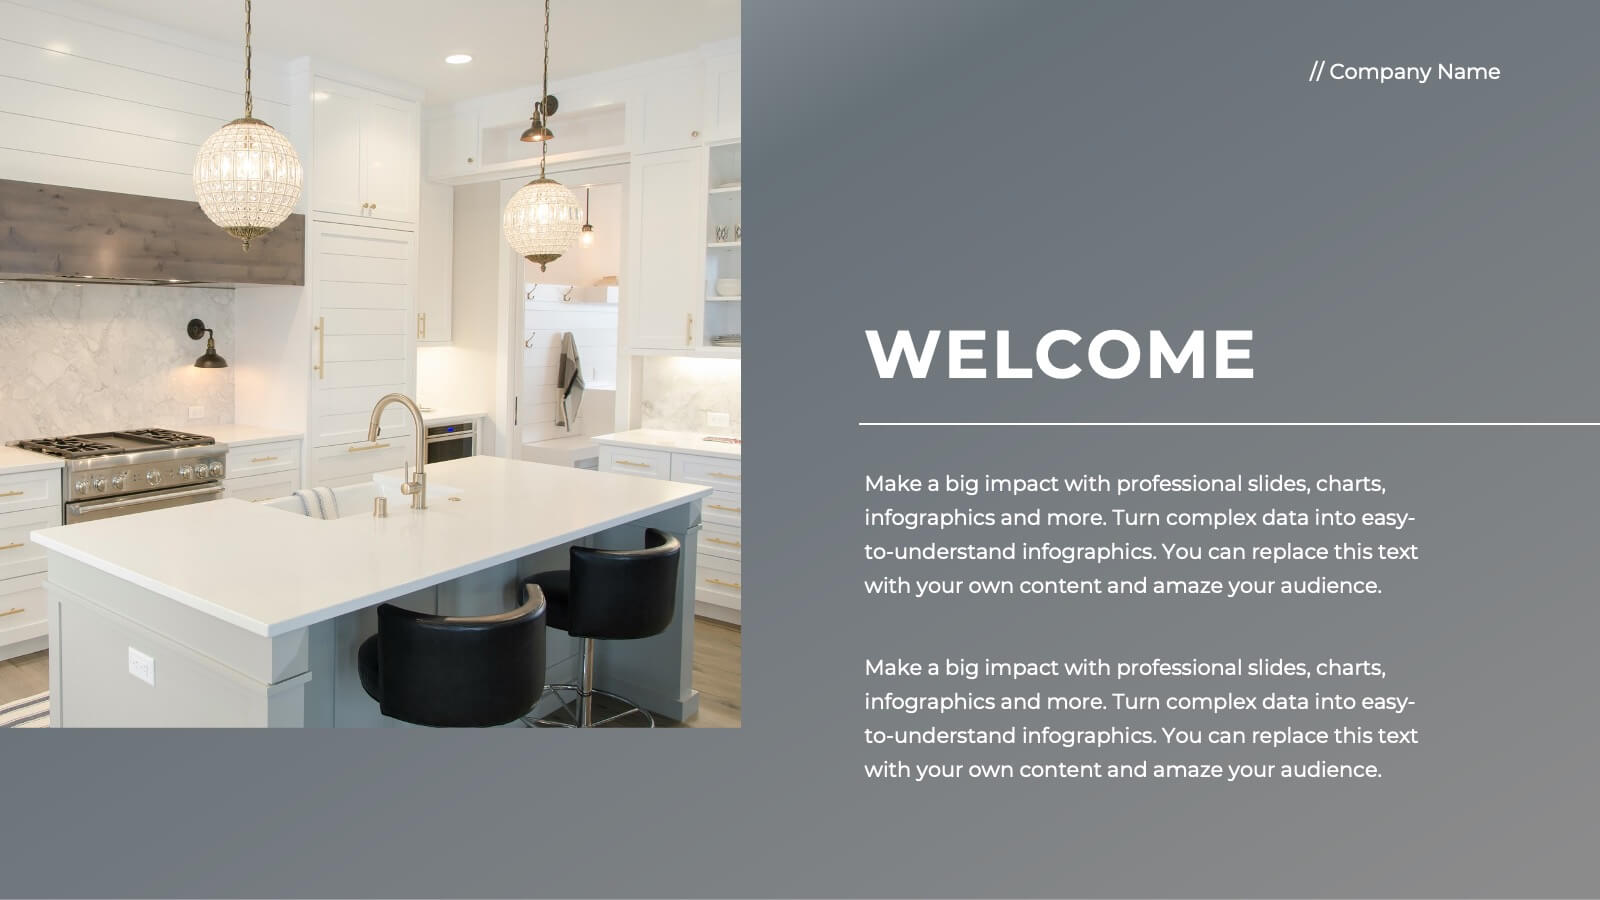
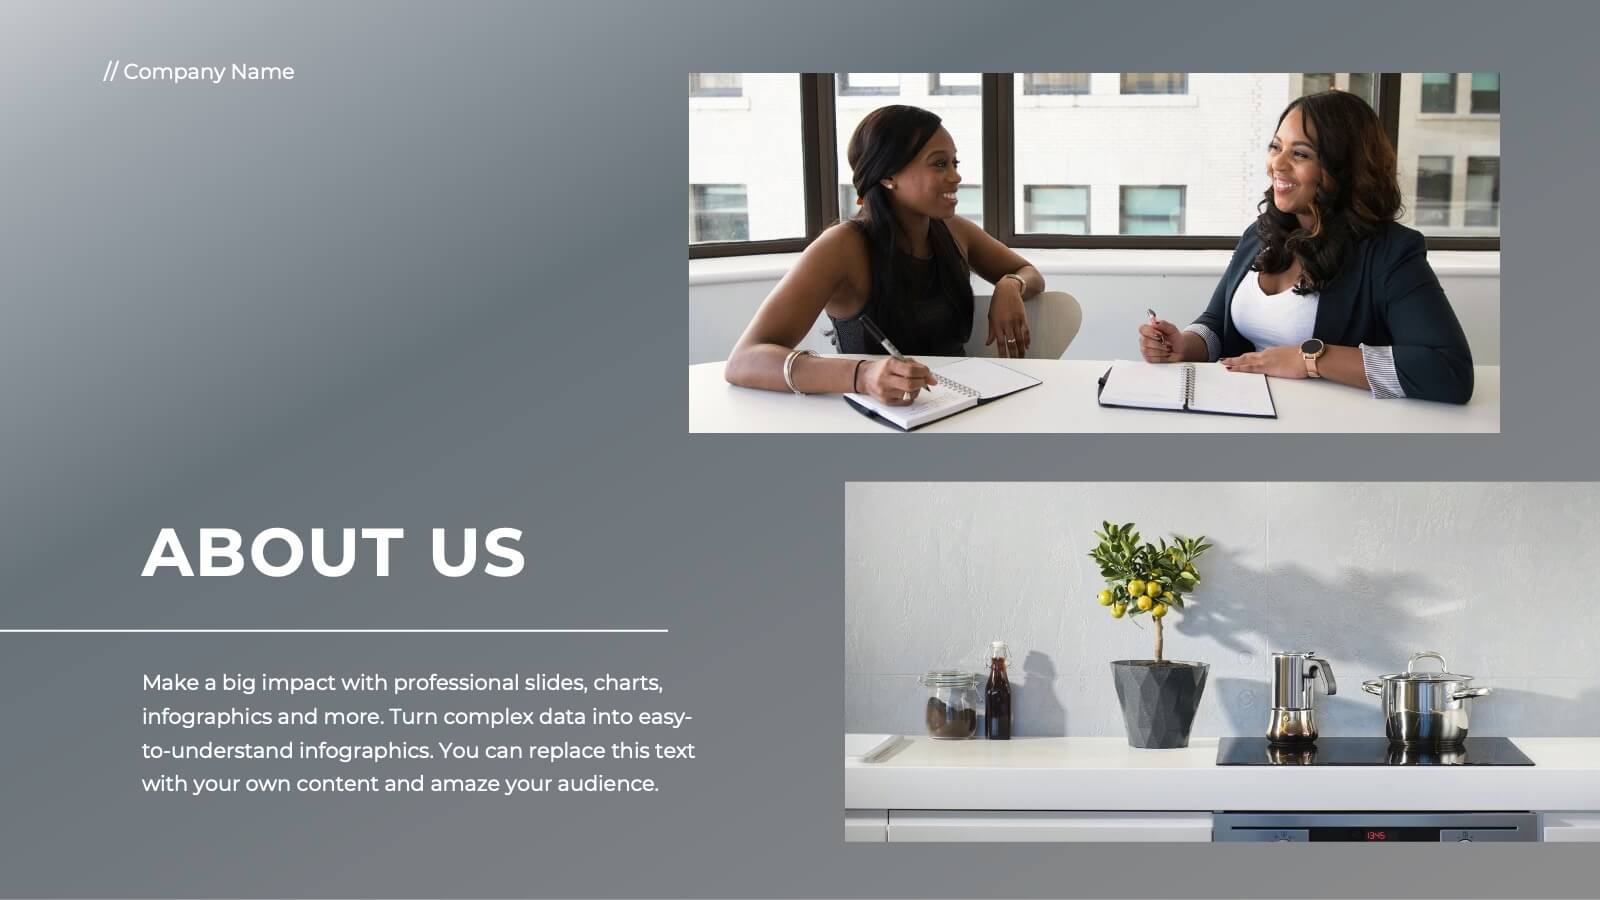
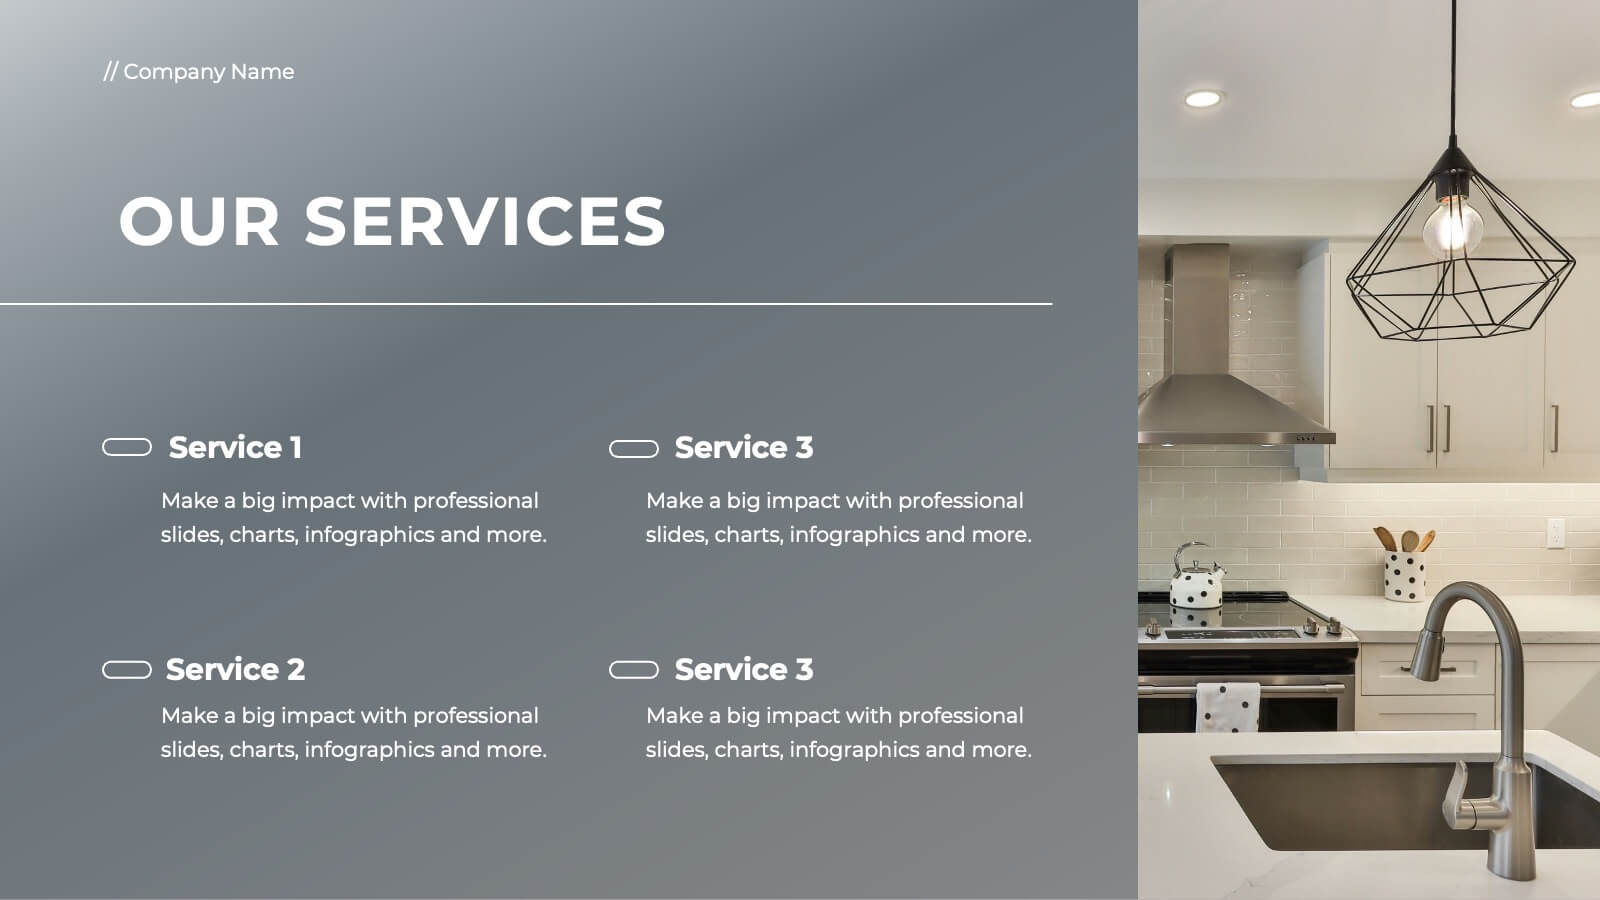
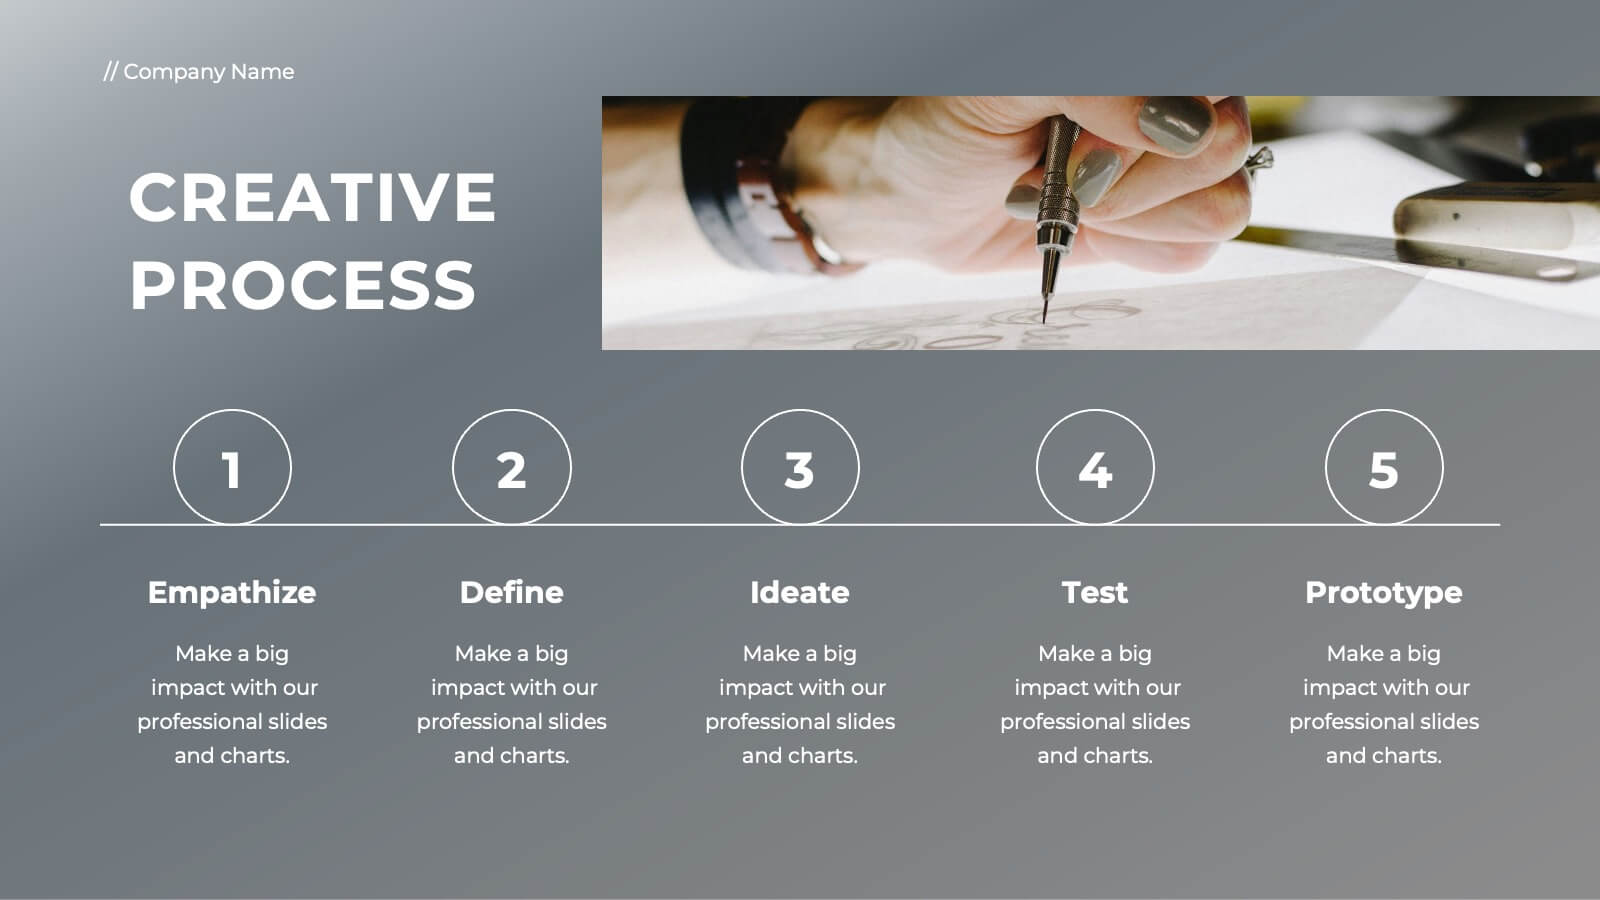
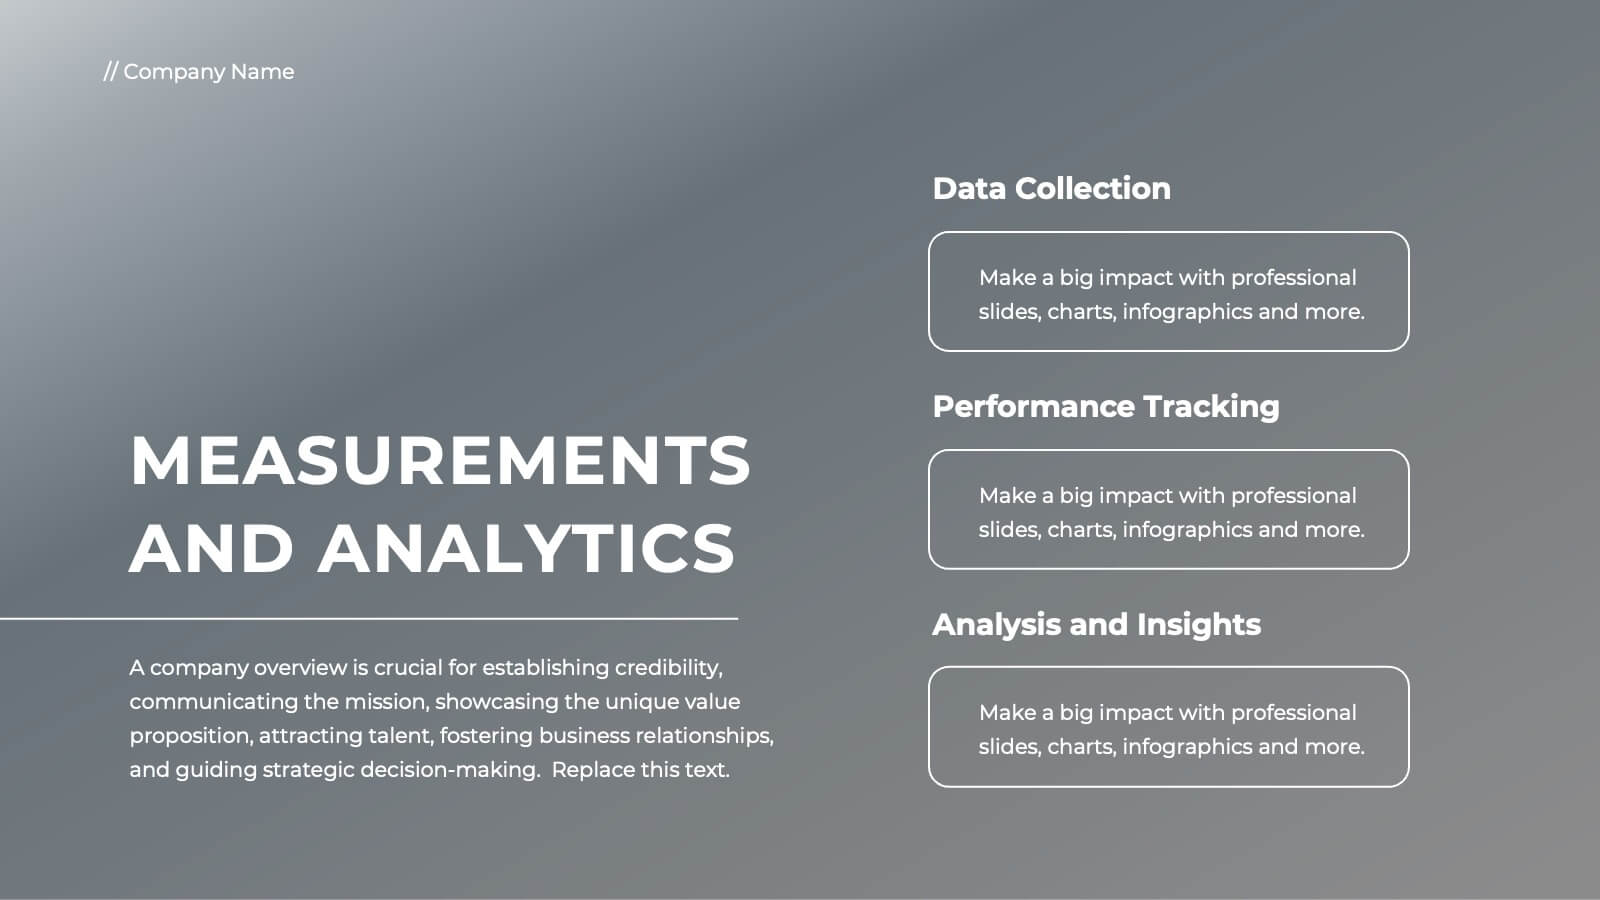
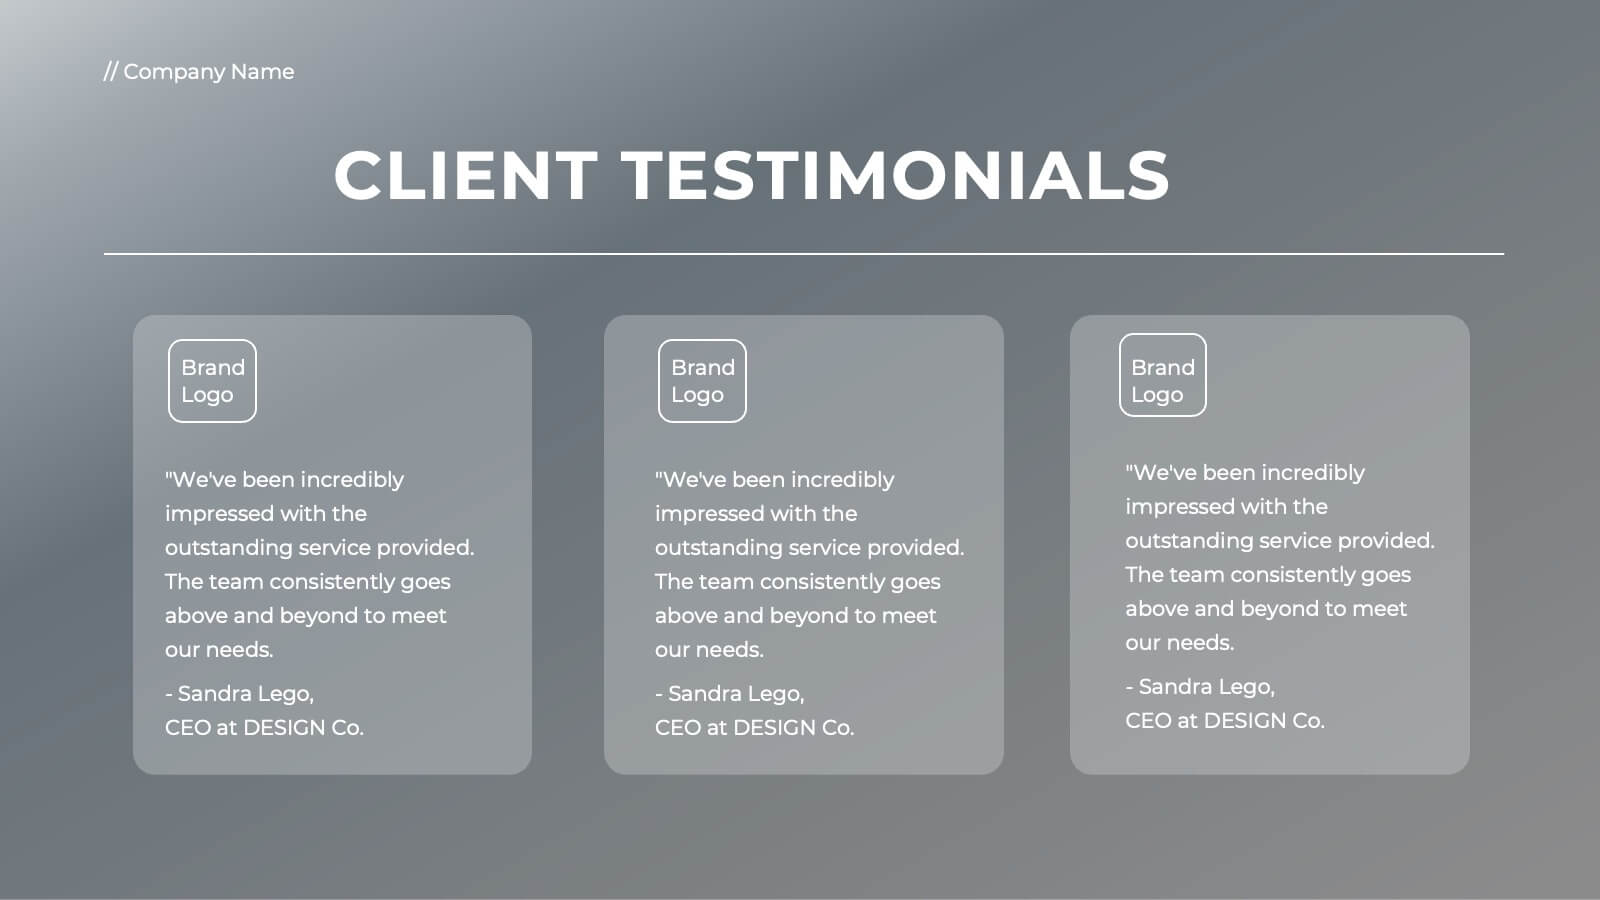
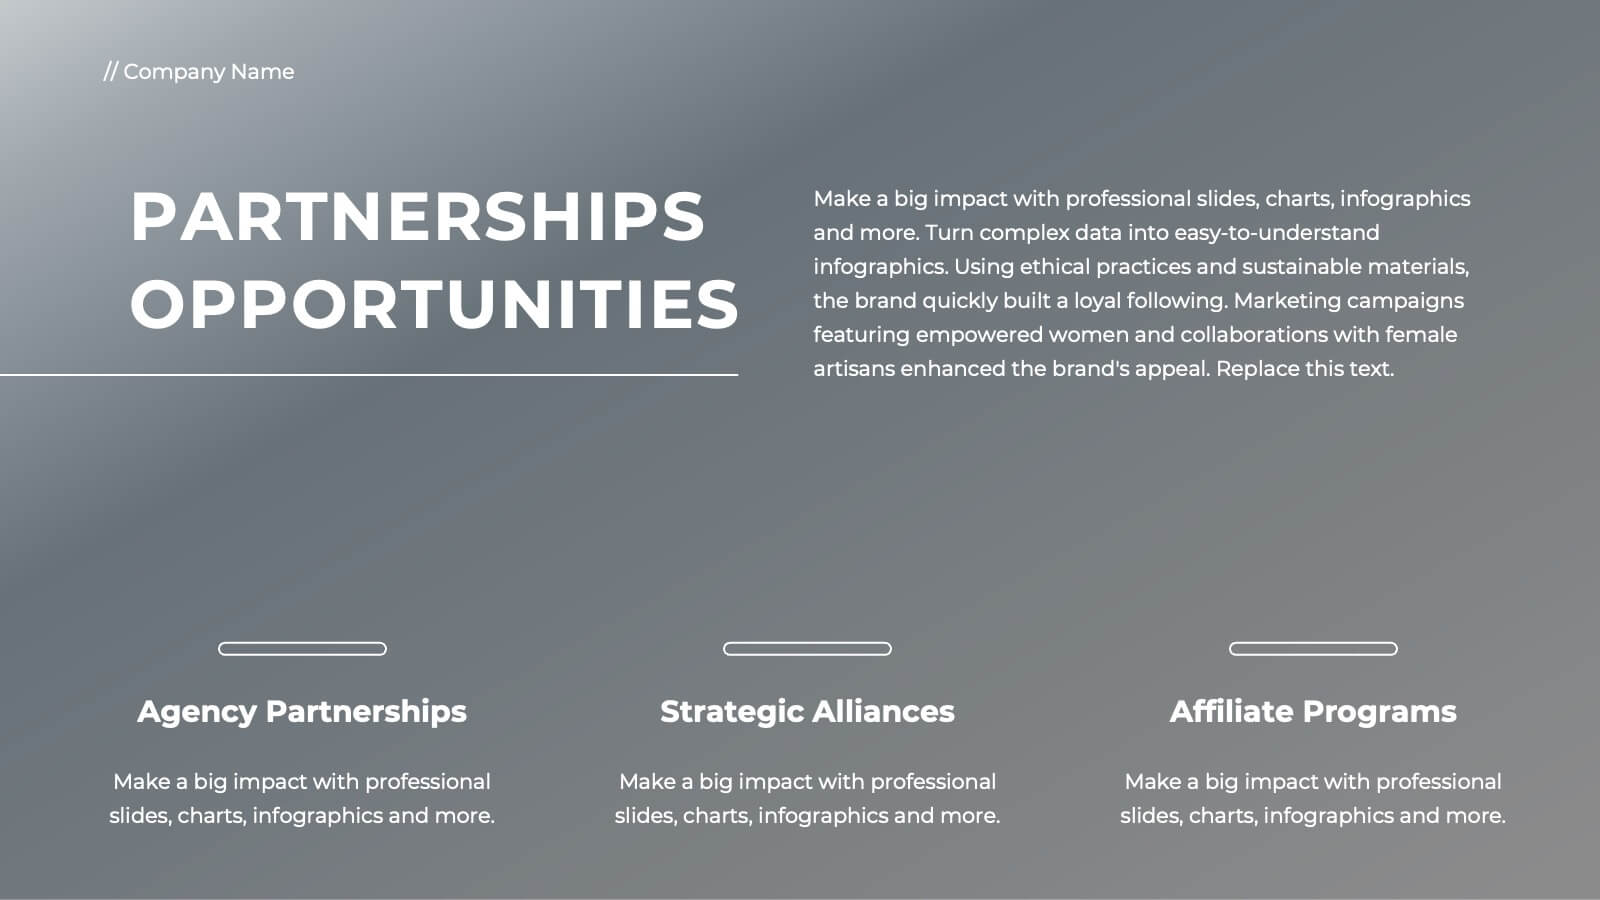
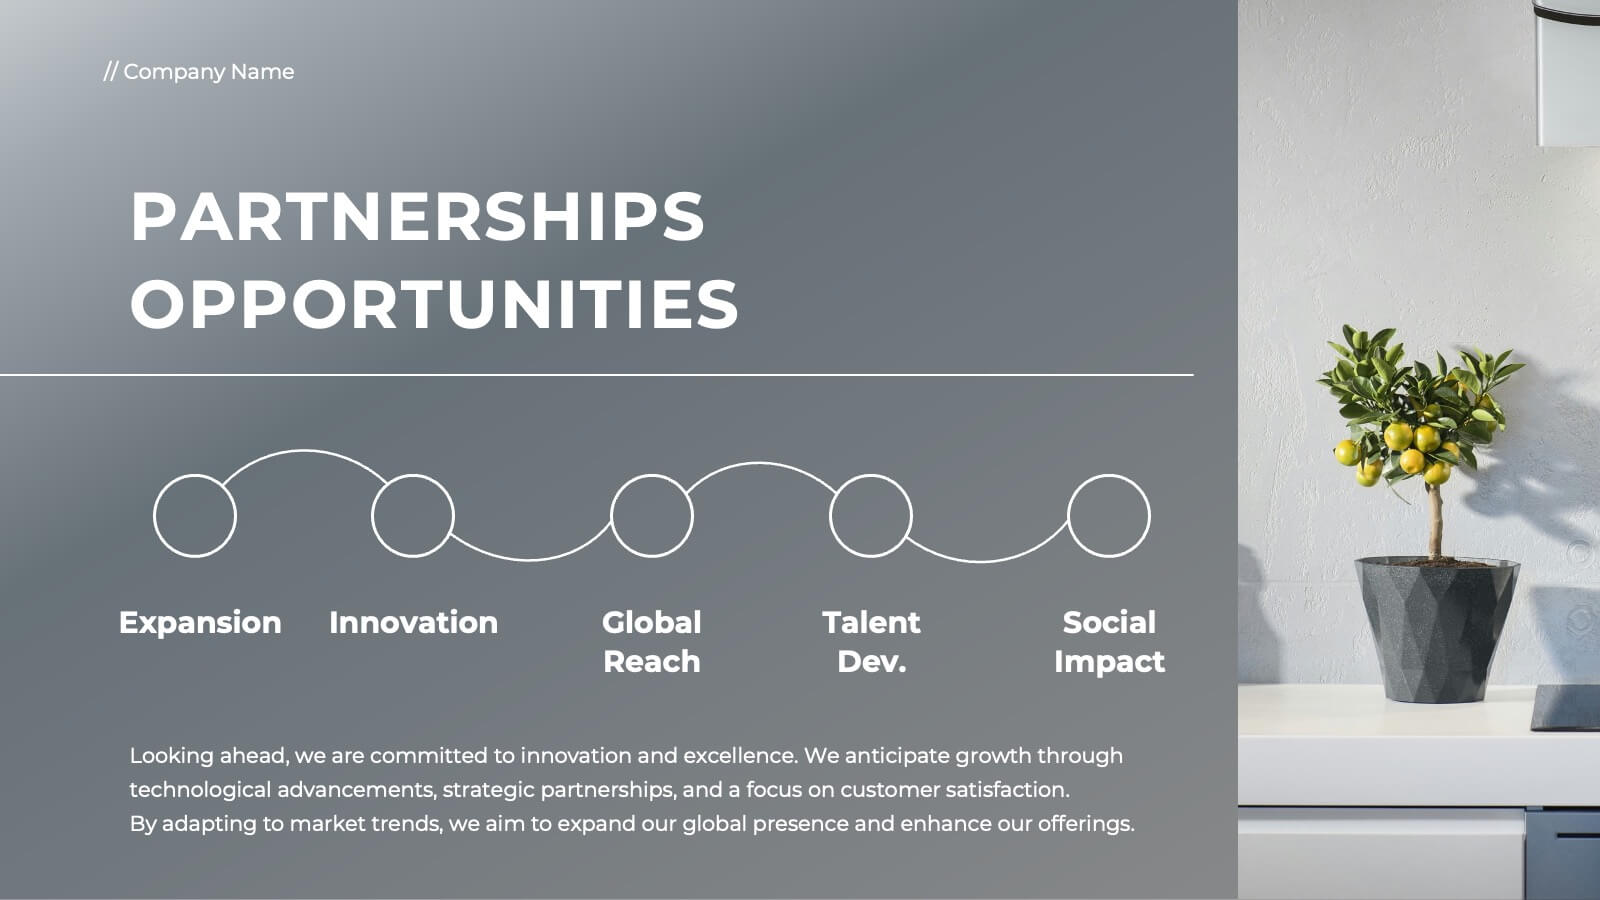
Elevate your agency's presentation with this sleek project plan template! Ideal for showcasing your team's vision, market analysis, and client success stories, it includes slides for strategic development, campaign execution, and partnerships. Impress clients and stakeholders with professional visuals and detailed content. Compatible with PowerPoint, Keynote, and Google Slides for seamless presentations on any platform.


8 slides
Virtual Team Collaboration Presentation
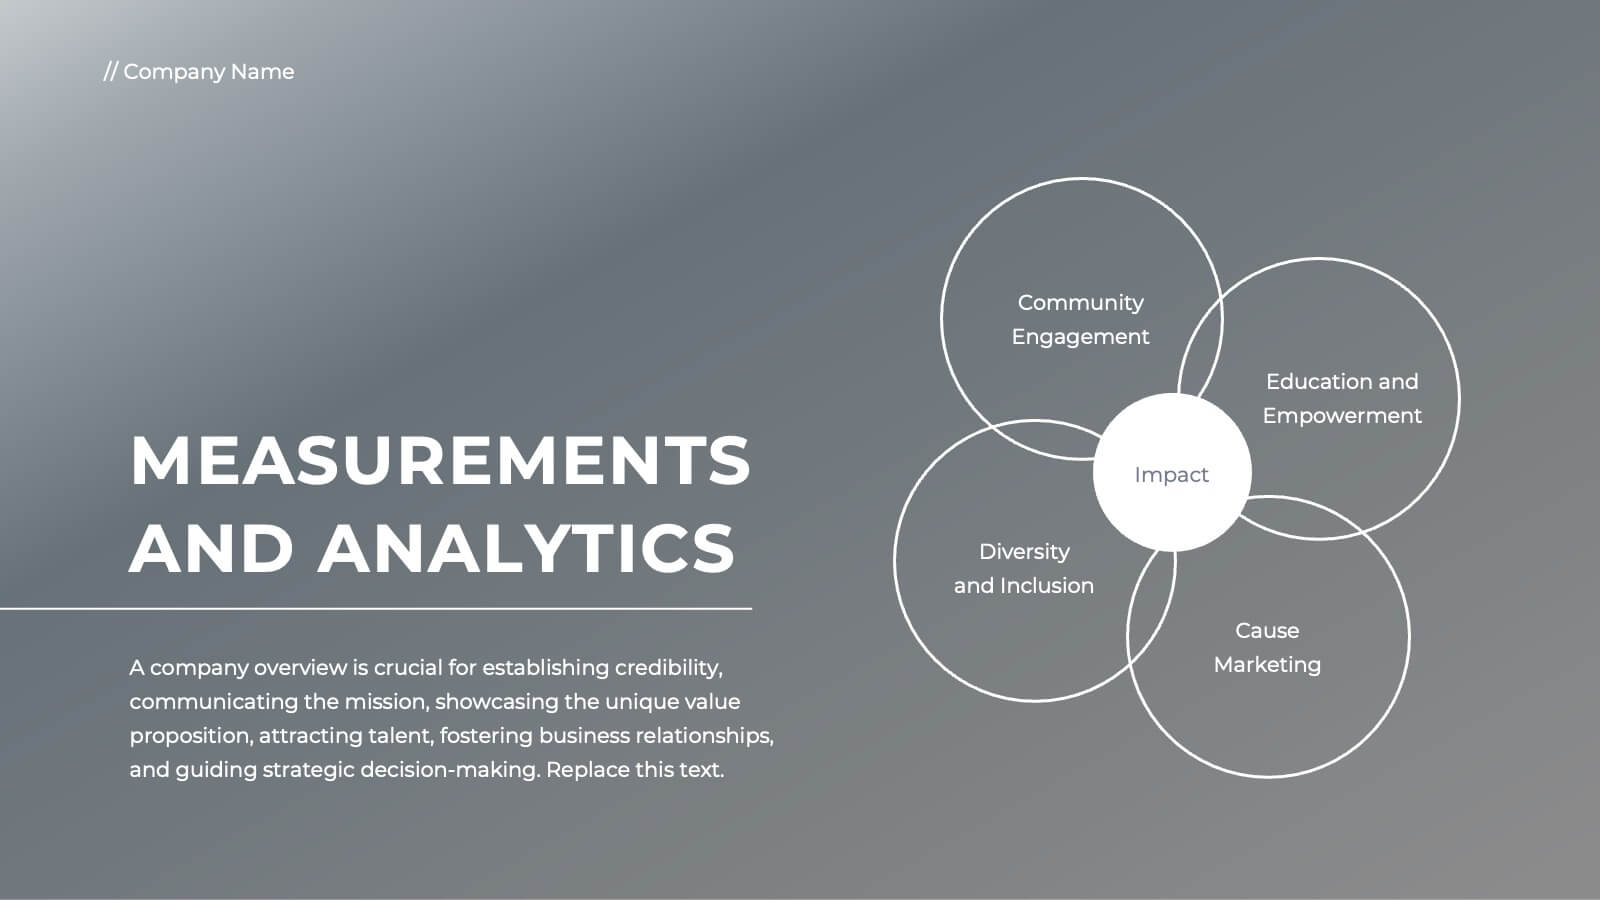
The "Virtual Team Collaboration" presentation template is designed to highlight different facets of teamwork in a remote setting. Each slide features a central visual metaphor illustrated by connected circles, symbolizing the interconnected nature of virtual team activities and communication. The layout provides placeholders for titles and descriptive text, making it suitable for detailing various aspects of virtual collaboration such as project management, communication protocols, and role assignments. The design encourages a clear and organized presentation of information, facilitating discussions on best practices and strategies for effective remote teamwork.


5 slides
Easy Homemade Recipes Infographics
Introducing our Easy Homemade Recipes Infographics, these are graphic representations of simple and delicious recipes that can be made at home. These vibrant vertical infographics provide a step-by-step guide to creating tasty meals and snacks using ingredients that are readily available. This template includes detailed instructions for preparing the dishes, as well as the ingredients needed and the cooking time required. They are designed to be visually appealing, with colorful illustrations and fully editable easy-to-read text. These are perfect for anyone looking to learn new recipes or expand their culinary skills!


6 slides
PESTEL Framework Breakdown Presentation
Kickstart your strategic thinking with a bold, colorful layout that makes external business factors easy to understand at a glance. This presentation breaks complex influences into clear, structured sections, helping teams analyze trends and plan with confidence. Fully editable and compatible with PowerPoint, Keynote, and Google Slides.


21 slides
Aetherion New Product Proposal Presentation
This Product Presentation Template is designed to effectively showcase your product's features, target market, and competitive advantages. It includes sections for customer pain points, pricing strategy, technical specifications, and marketing plans. Fully customizable for PowerPoint, Keynote, and Google Slides, it's perfect for product launches and investor pitches.


8 slides
Statistical Data Visualization Presentation
Bring Your Data to Life! The Statistical Data Visualization Presentation transforms complex information into clear, engaging visuals. Designed for professionals who need to showcase trends and insights, this template uses dynamic graphs and color-coded sections for clarity. Fully editable and compatible with PowerPoint, Keynote, and Google Slides for effortless customization.


6 slides
Market Challenges and Competitive Solutions Presentation
Visually map out business hurdles and strategic responses with this sleek 6-step infographic layout. Perfect for showcasing pain points on one side and proposed solutions on the other, it's ideal for sales decks, strategy reports, or competitor analysis. Customize each icon, title, and section easily in PowerPoint, Keynote, or Google Slides.


6 slides
Project Overview and Key Takeaways Presentation
Summarize your project outcomes with clarity and impact using this Project Overview and Key Takeaways slide. Featuring a clean layout with a dedicated section for a brief overview and key metrics, plus four hexagonal milestones for your main insights. Perfect for wrap-up reports, client updates, or stakeholder reviews. Fully editable in PowerPoint, Keynote, and Google Slides.


26 slides
Simplified Home Decor Presentation
Bring a breath of fresh air to interior design with this elegant presentation template, perfect for unveiling the beauty of simplified home decor. The template's clean lines and soft color palette evoke the minimalist charm and serene ambiance of modern living spaces. Each slide offers a harmonious blend of imagery and text, showcasing tranquil interiors that speak volumes about the less-is-more philosophy. From showcasing key principles of minimalist design to offering tips on decluttering and organizing, this template guides viewers through the transformative process of creating a peaceful home environment. Infographics lend themselves to discussing color schemes, space functionality, and the impact of natural light, making this a comprehensive tool for interior designers, home organizers, or decor enthusiasts. Fully compatible with PowerPoint, Keynote, and Google Slides, this template is a canvas for creativity, ready to inspire and engage audiences in the art of living simply and stylishly.


12 slides
Customer Demographics Map Presentation
Showcase customer demographics effectively with our "Customer Demographics Map Presentation" template. This infographic is crafted to display the geographical distribution of customer data across the United States, using a color-coded map for clarity. Each state is marked to represent varying metrics like age, income, or product preference, facilitating easy visual comparisons and insights into market trends. Ideal for marketers, business analysts, and data scientists, this template simplifies complex demographic data for strategic presentations. It enhances understanding of customer bases and market segmentation. Compatible with PowerPoint, Keynote, and Google Slides, it's essential for detailed demographic analysis in any professional presentation.


24 slides
Minerva UX Design Presentation
Elevate your UX design presentations with this comprehensive template, featuring sections for project overview, user research, wireframes, prototyping, and usability testing. Showcase design systems, branding guidelines, and accessibility considerations with ease. Perfect for demonstrating a user-centered approach. Compatible with PowerPoint, Keynote, and Google Slides for seamless customization.


5 slides
Step-by-Step Planning Roadmap Presentation
Clarify each phase of your strategy with the Step-by-Step Planning Roadmap Presentation. This engaging slide design uses a staircase-style layout with labeled checkpoints (A–E) and matching text boxes to clearly communicate sequential goals or stages. Great for project roadmaps, implementation plans, or business timelines. Fully customizable in PowerPoint, Keynote, and Google Slides.


7 slides
Tables of Content Infographic Presentation Template
A table of contents infographic can serve as a visual representation of the content outline and help to convey the overall structure and organization of the information. This template displays the headings and subheadings of the document, along with the page numbers or slide numbers, in an easy-to-follow format. The purpose of our table of contents infographic template is to provide an overview of the content and help you navigate the presentation more efficiently. It is often used in academic papers, reports, magazines, and books, and can also be used in digital documents and presentations.