


Features
- 26 Unique slides
- Fully editable and easy to edit in Microsoft Powerpoint, Keynote and Google Slides
- 16:9 widescreen layout
- Clean and professional designs
- Export to JPG, PDF or send by email


Do you have any questions?
Recommend


7 slides
Organizational Change with 7S Framework Presentation
Visualize organizational transformation with the Organizational Change with 7S Framework Presentation. This slide highlights each element of the McKinsey 7S model—Structure, Strategy, Systems, Shared Values, Skills, Style, and Staff—along an S-shaped flow. Ideal for consulting, internal alignment, and strategic planning discussions. Fully editable in Canva, PowerPoint, Keynote, and Google Slides.


4 slides
Construction Project Planning
Streamline your workflow and improve clarity with this vibrant project planning wheel designed for construction professionals. This slide helps visualize key phases—such as planning, team coordination, and logistics—using color-coded segments and editable icons. Perfect for architects, contractors, and project managers. Fully customizable in PowerPoint, Keynote, and Google Slides.


22 slides
Sublimix Business Operations Plan Presentation
Streamline your company’s workflow with this bold and modern business operations plan presentation. Covering key areas like performance metrics, resource allocation, process improvements, and collaboration opportunities, this template helps you optimize efficiency and strategy. Fully customizable and compatible with PowerPoint, Keynote, and Google Slides for a seamless, professional presentation experience.
5 slides
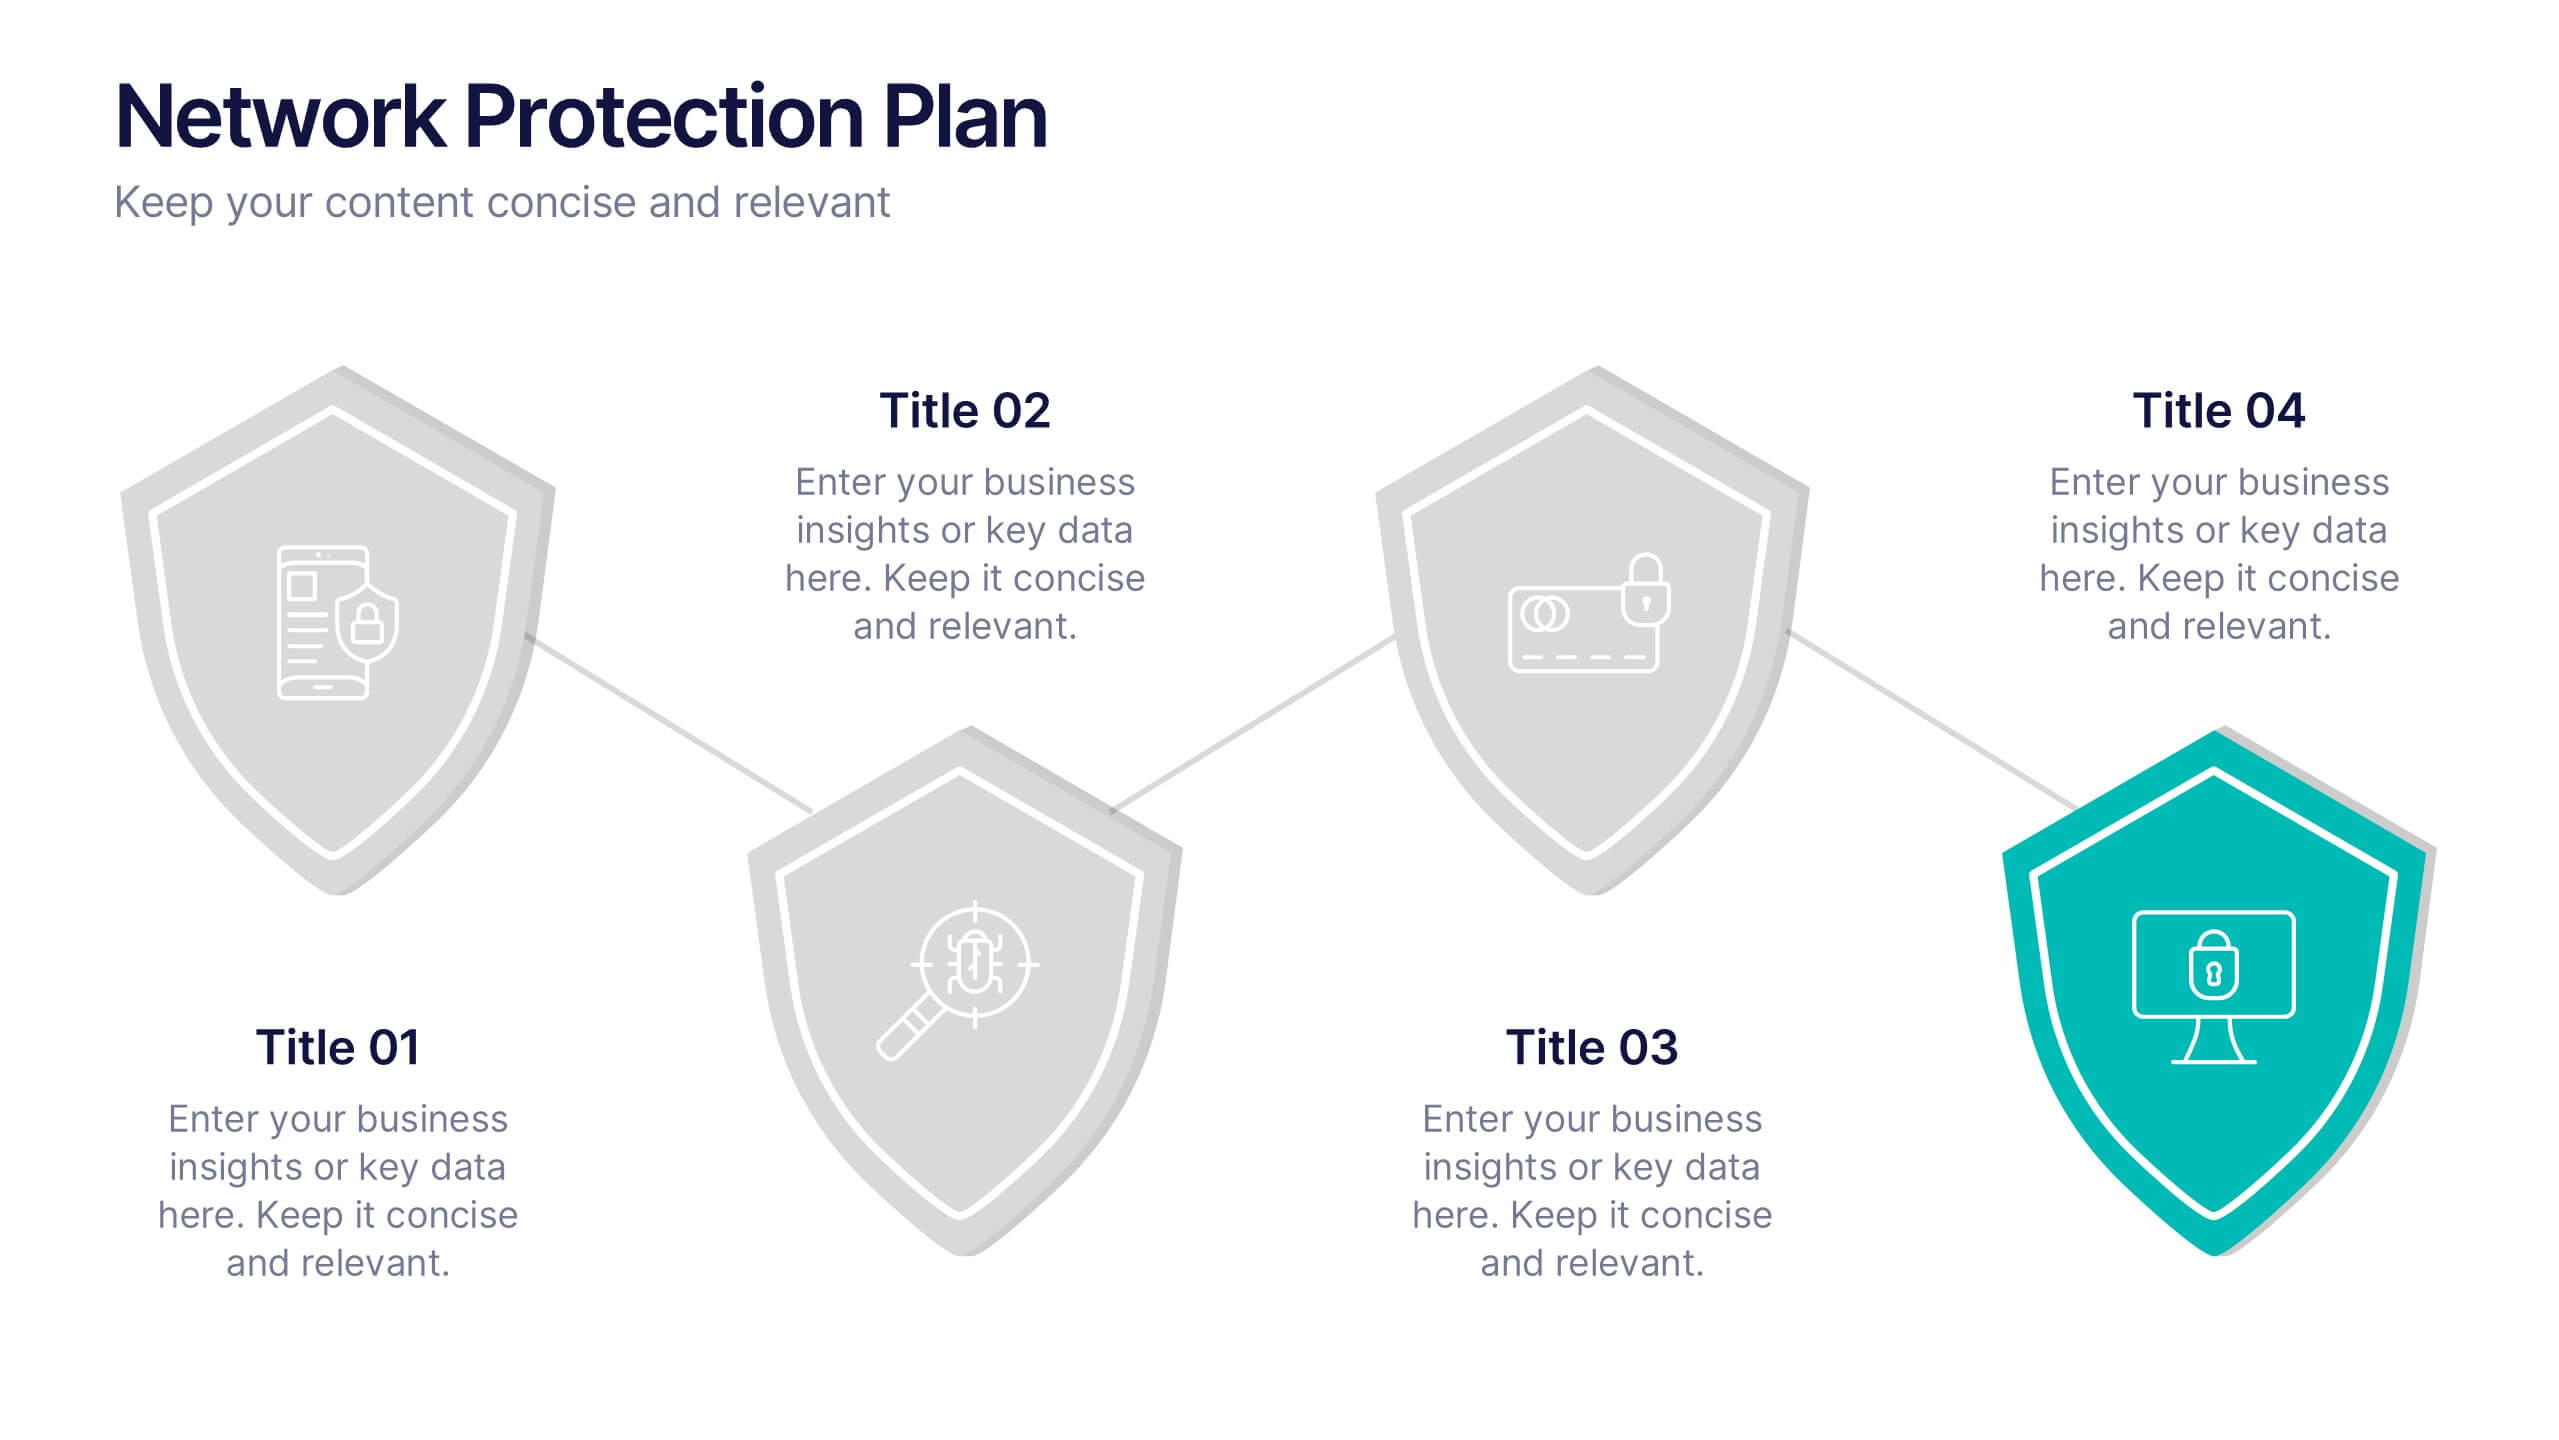
Network Protection Plan Presentation
Bold visuals and clean structure make this presentation a powerful way to communicate your protection strategy with clarity and confidence. It helps you break down key security stages, outline responsibilities, and show how each layer strengthens overall network resilience. Fully compatible with PowerPoint, Keynote, and Google Slides.


4 slides
Remote Learning Classroom Engagement Presentation
Make virtual classrooms more engaging with this clear, conversation-inspired visual. Designed for educators, trainers, and e-learning professionals, this infographic helps highlight interaction points, participation levels, or communication flows in remote learning. Easy to customize and fully compatible with PowerPoint, Keynote, and Google Slides.


22 slides
Galileo Advertising Agency Proposal Presentation
Present your advertising agency’s capabilities with a proposal template designed to captivate and convince. This sleek and professional layout is perfect for agencies looking to showcase their services, team expertise, and strategic approach to clients. Highlight key sections such as your mission, client success stories, market analysis, and creative process, ensuring every detail is covered. Dive into campaign execution plans, resource allocation, and testimonials to build trust and credibility. Visualize your strategy development with data-driven slides and impactful case study layouts. Fully customizable in PowerPoint, Google Slides, and Keynote, this template is tailored for seamless editing to reflect your agency’s branding. The clean design, bold accents, and structured content make it ideal for pitches, client proposals, or business development meetings. Take your presentations to the next level and leave a lasting impression on potential clients.


5 slides
Layered Business Pyramid Framework
Visualize business hierarchy and strategic layers with the Layered Business Pyramid Framework Presentation. This editable slide features a five-tier pyramid diagram aligned with corresponding text sections, ideal for showcasing organizational structures, workflow levels, or growth stages. Each layer is color-coded for clarity and impact, making your insights easy to digest. Fully compatible with PowerPoint, Keynote, and Google Slides.


5 slides
SaaS Pricing Model
Present your pricing plans with confidence using this clear and structured SaaS pricing model template. Perfect for showcasing tiered options like Free, Basic, Medium, and Premium, this design makes feature comparisons easy for your audience to grasp. Fully compatible with PowerPoint, Keynote, and Google Slides for effortless editing and presentation.


7 slides
Strategic Alignment Using McKinsey 7S Presentation
Showcase organizational effectiveness with this Strategic Alignment Using McKinsey 7S Presentation. This diagram template visually maps all seven interconnected elements—Strategy, Structure, Systems, Shared Values, Skills, Style, and Staff—making it easy to communicate business alignment and transformation goals. Perfect for consultants, team leaders, and strategy professionals. Fully customizable in PowerPoint, Keynote, and Google Slides.


4 slides
IT Strategy and Transformation Roadmap Presentation
Navigate your digital journey with the IT Strategy and Transformation Roadmap Presentation. This visual layout uses an ascending arrow format to highlight four key initiatives, milestones, or phases in your technology strategy. Ideal for CIOs, IT leaders, or consultants communicating digital transformation plans. Compatible with PowerPoint, Google Slides, Keynote, and Canva.


21 slides
Sonicwave Market Analysis Report Presentation
A vibrant, modern template designed for market analysis presentations. Covers agenda, key highlights, metrics, financial summaries, competitor insights, and strategic initiatives. Ideal for professionals presenting data-driven insights on trends and performance. Fully customizable in PowerPoint, Keynote, and Google Slides for business, marketing, and analytical reporting needs.


5 slides
Infographic Business Charts Presentation
Bring your data to life with a bold, visual storytelling layout designed to make insights instantly clear and impossible to ignore. This presentation highlights key metrics using clean, modern business charts that simplify comparisons and trends for any audience. Fully compatible with PowerPoint, Keynote, and Google Slides.


6 slides
Decision-Making Using Tree Diagrams Presentation
Clarify complex decisions with the Decision-Making Using Tree Diagrams Presentation. This slide design features a clear, hierarchical structure that helps visualize choices, outcomes, and decision paths step by step. Perfect for business strategy, risk analysis, or logic-based planning. Fully editable in PowerPoint, Keynote, and Google Slides.


5 slides
North America Business Landscape Map Presentation
Explore the business terrain with the "North America Business Landscape Map" template, which delivers a comprehensive visualization of business data across various regions. Designed for strategic presentations, it enables clear communication of market insights and data points, crucial for decision-making. This template is compatible with PowerPoint, Keynote, and Google Slides, enhancing its utility for professionals in diverse fields.


21 slides
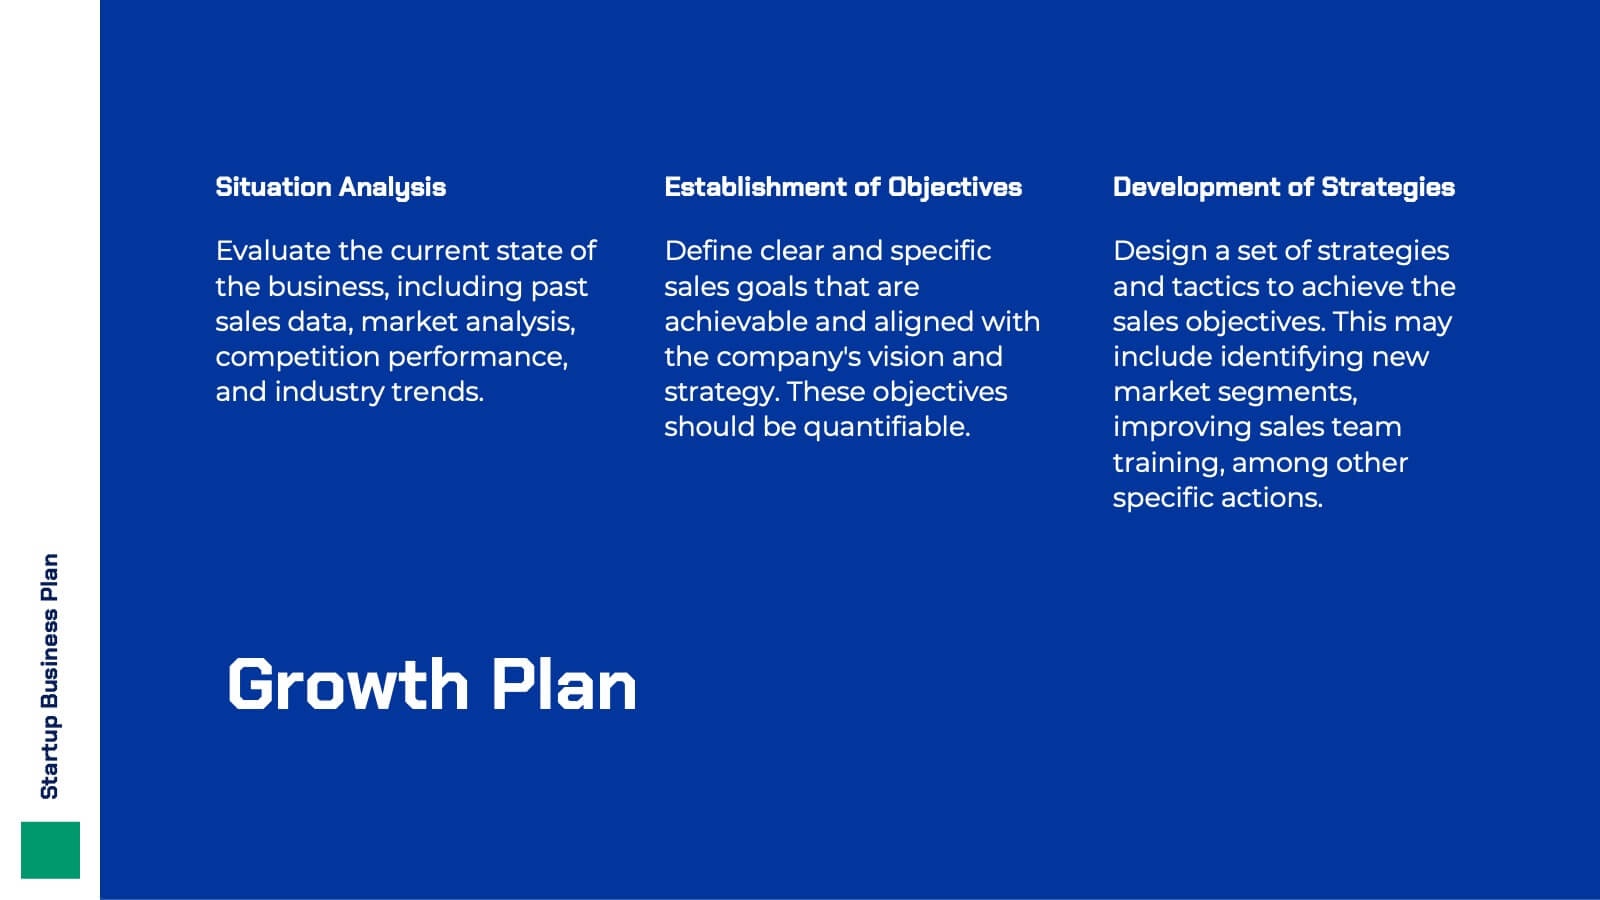
Hyperluma Startup Business Plan Presentation
Launch your vision with this startup business plan template, crafted to communicate your mission, market potential, and growth strategy with clarity and impact. Covering customer needs, unique value propositions, and financial projections, it’s ideal for entrepreneurs and founders. This template is compatible with PowerPoint, Keynote, and Google Slides, ready to fuel your startup’s journey.
5 slides
Business Strategy Arrow Presentation
Enhance your strategic planning with the Business Strategy Arrow Presentation. This visually structured template guides your audience through a step-by-step progression, making it ideal for business roadmaps, strategic plans, and goal-oriented workflows. Easily customize the colors, text, and icons to align with your brand. Fully compatible with PowerPoint, Keynote, and Google Slides for effortless editing and professional presentations.


22 slides
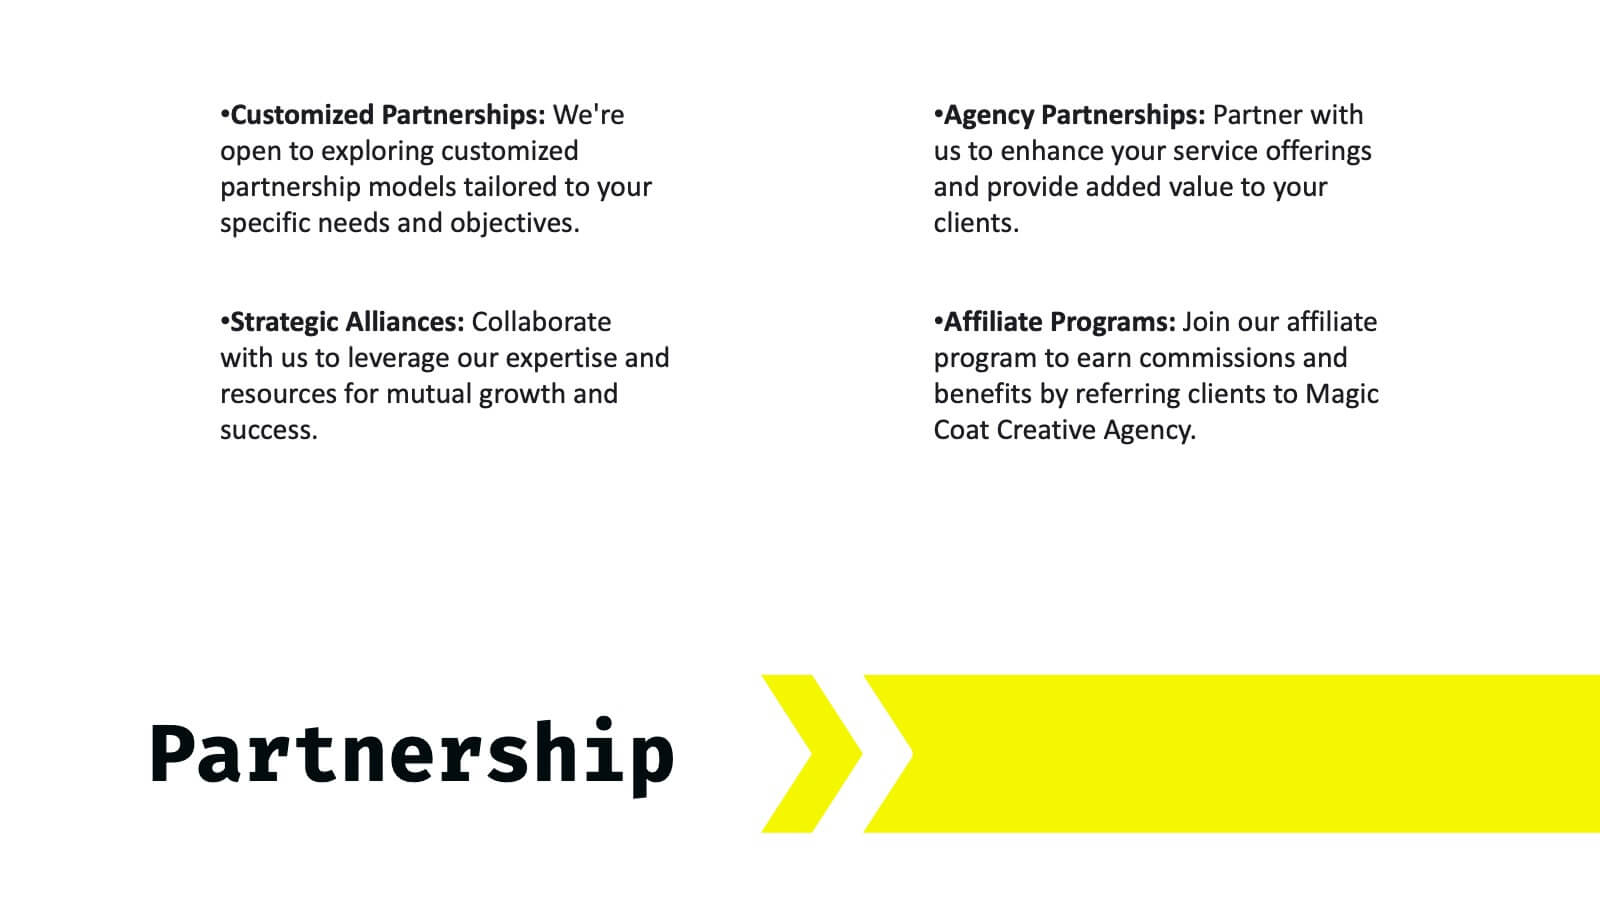
Amberwood Advertising Agency Proposal Presentation
This Agency Presentation Template provides a professional layout to showcase your company's mission, services, and success stories. It covers key areas such as market analysis, strategy development, campaign execution, and future outlook. Ideal for creative agencies, it is fully customizable and compatible with PowerPoint, Keynote, and Google Slides.