


Features
- 26 Unique Slides
- Fully editable and easy to edit in Microsoft Powerpoint, Keynote and Google Slides
- 16:9 widescreen layout
- Clean and professional designs
- Export to JPG, PDF or send by email


Do you have any questions?
Recommend


5 slides
Quarterly Sales Funnel Overview Presentation
Visualize conversion performance with clarity using the Quarterly Sales Funnel Overview Presentation. This sleek funnel chart design breaks down each sales stage—from lead generation to closing—helping you present key percentages and insights effectively. Perfect for marketing reports, sales updates, and business reviews. Fully editable in Canva, PowerPoint, Keynote, and Google Slides.


4 slides
Team and Department Setup Structure Presentation
Organize your team with clarity using the Team and Department Setup Structure Presentation. This template is perfect for showcasing internal team hierarchies, departmental layouts, or functional groupings in a clean and professional layout. Each slide is fully customizable, allowing you to edit icons, titles, and structure to suit your organization. Compatible with Canva, PowerPoint, Keynote, and Google Slides.


6 slides
Network Security and Compliance Presentation
Safeguard your data with clarity and precision using these dynamic visuals. This presentation simplifies network security concepts, showcasing compliance checkpoints, threat zones, and secure access protocols. Ideal for audits, training, or executive briefings. Fully customizable and compatible with PowerPoint, Keynote, and Google Slides—perfect for your next cybersecurity presentation.


28 slides
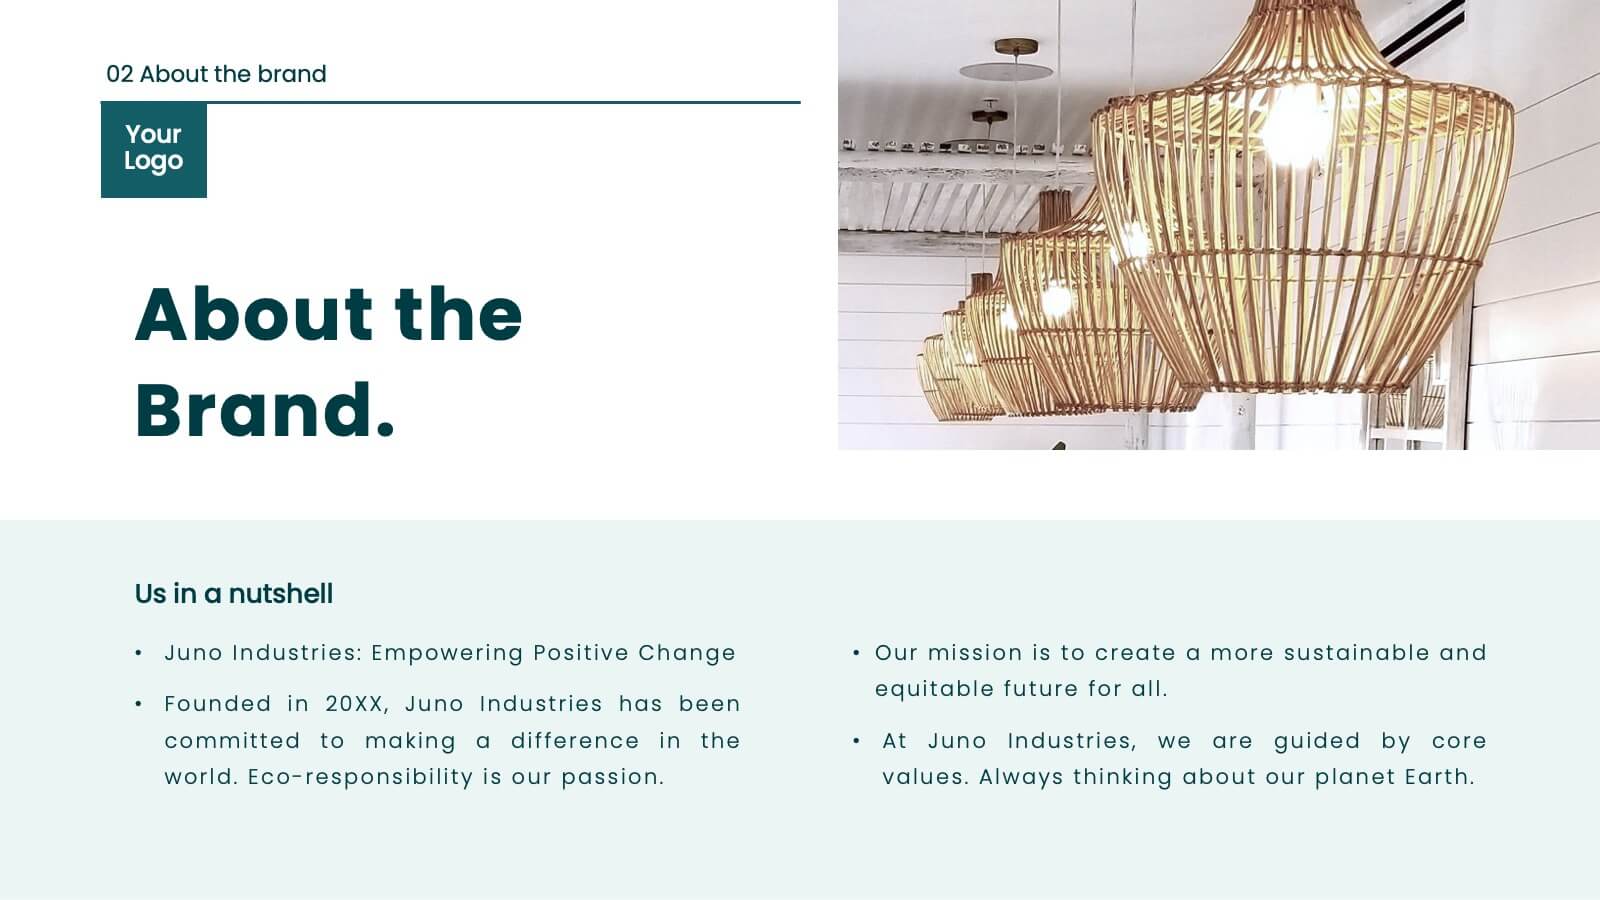
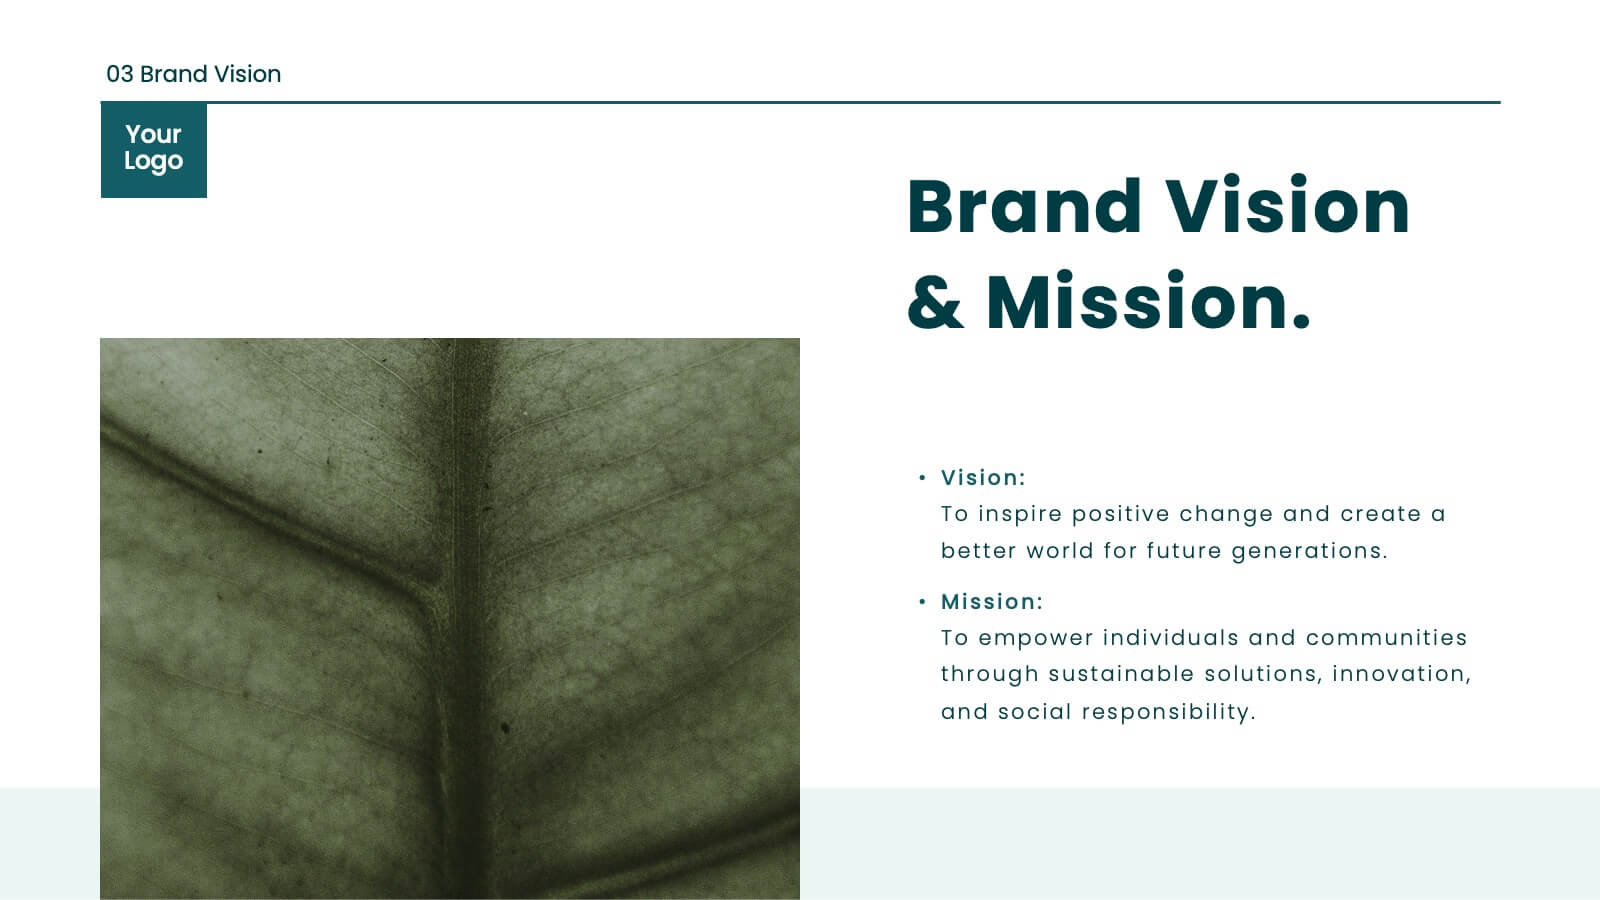
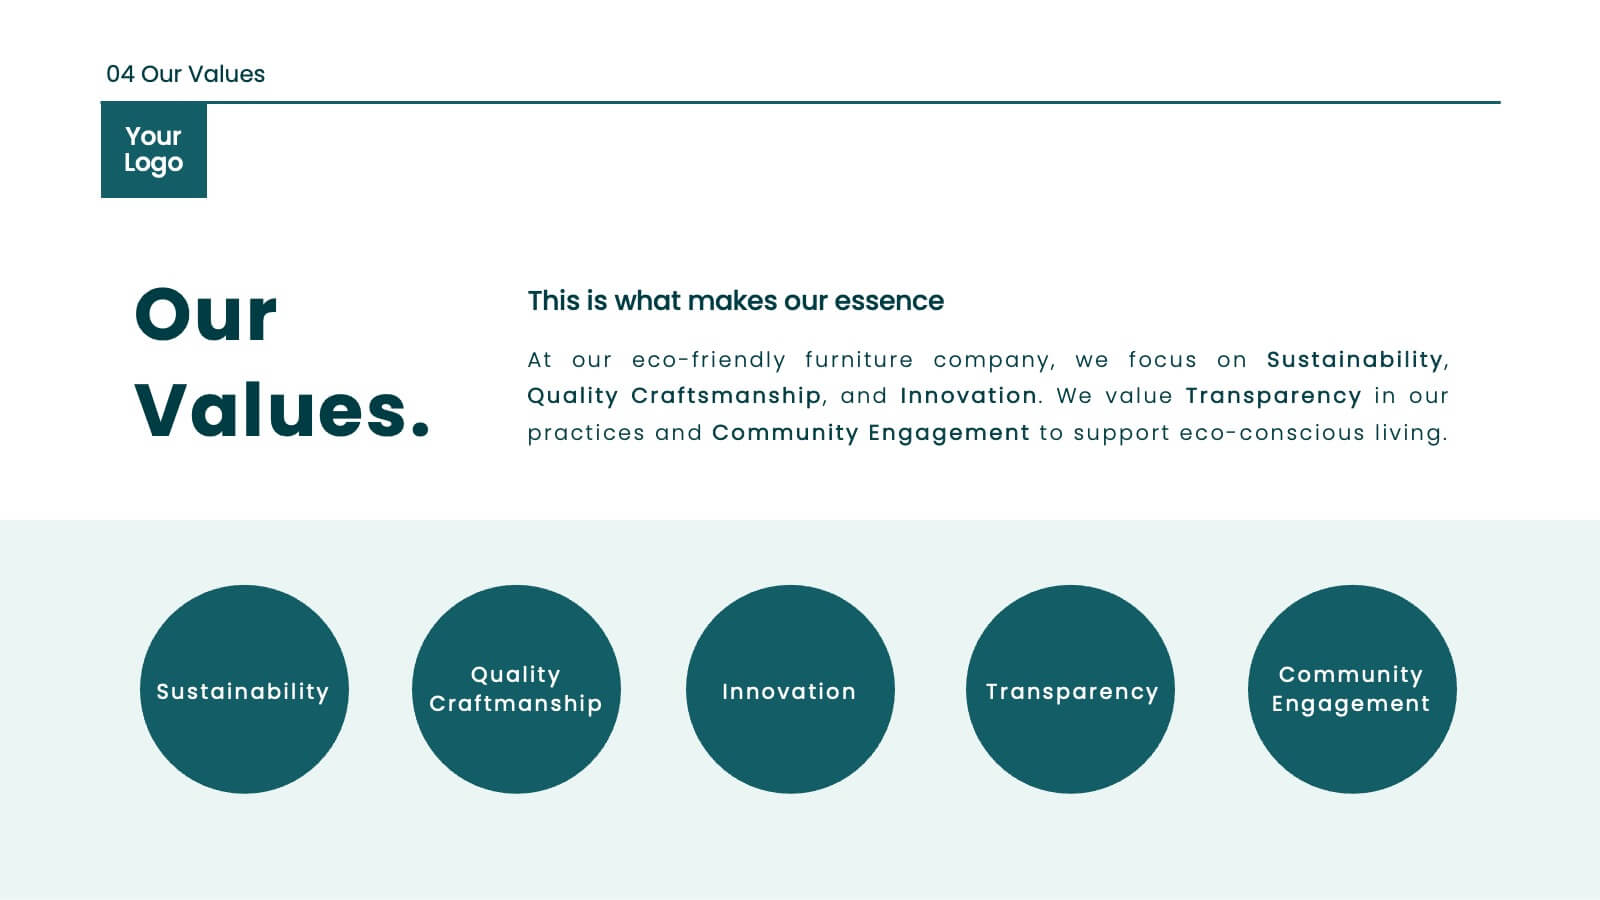
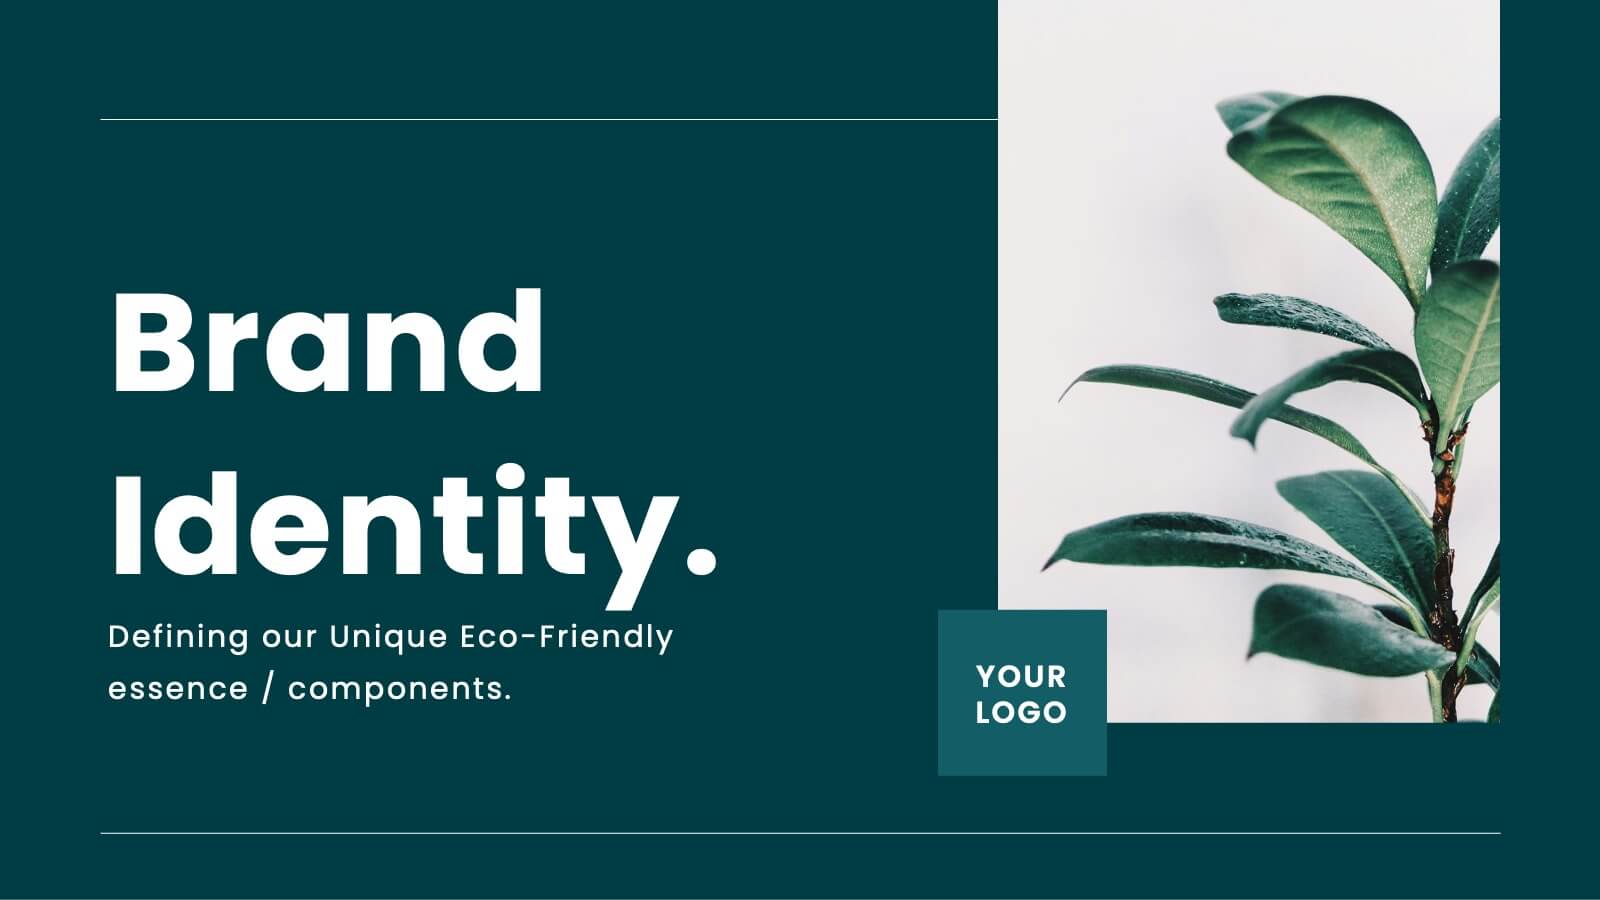
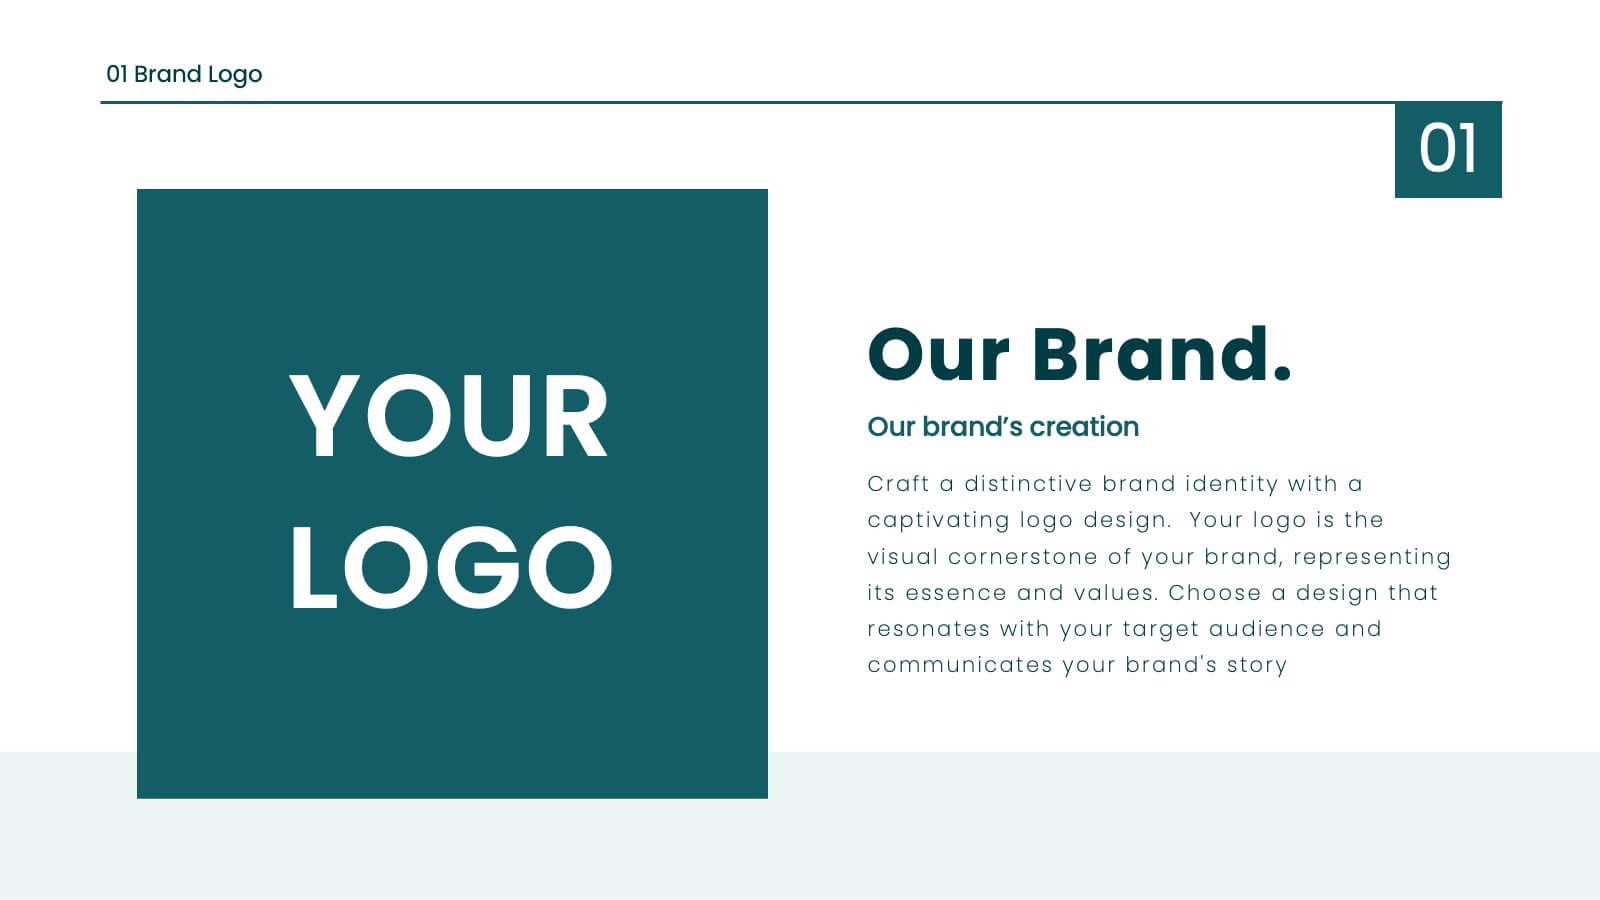
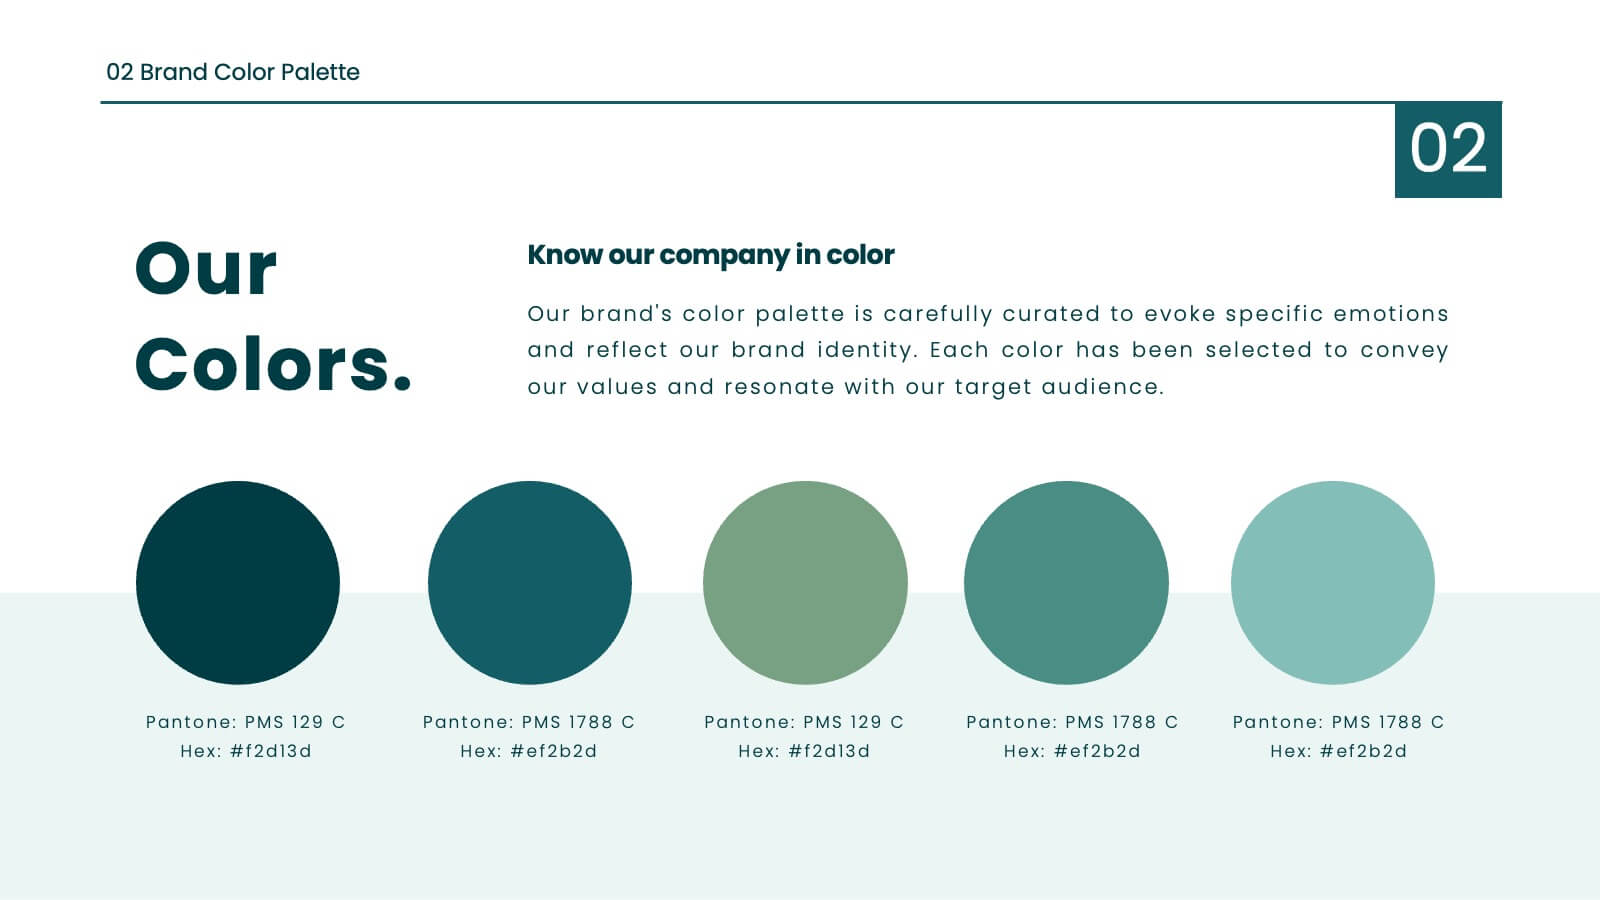
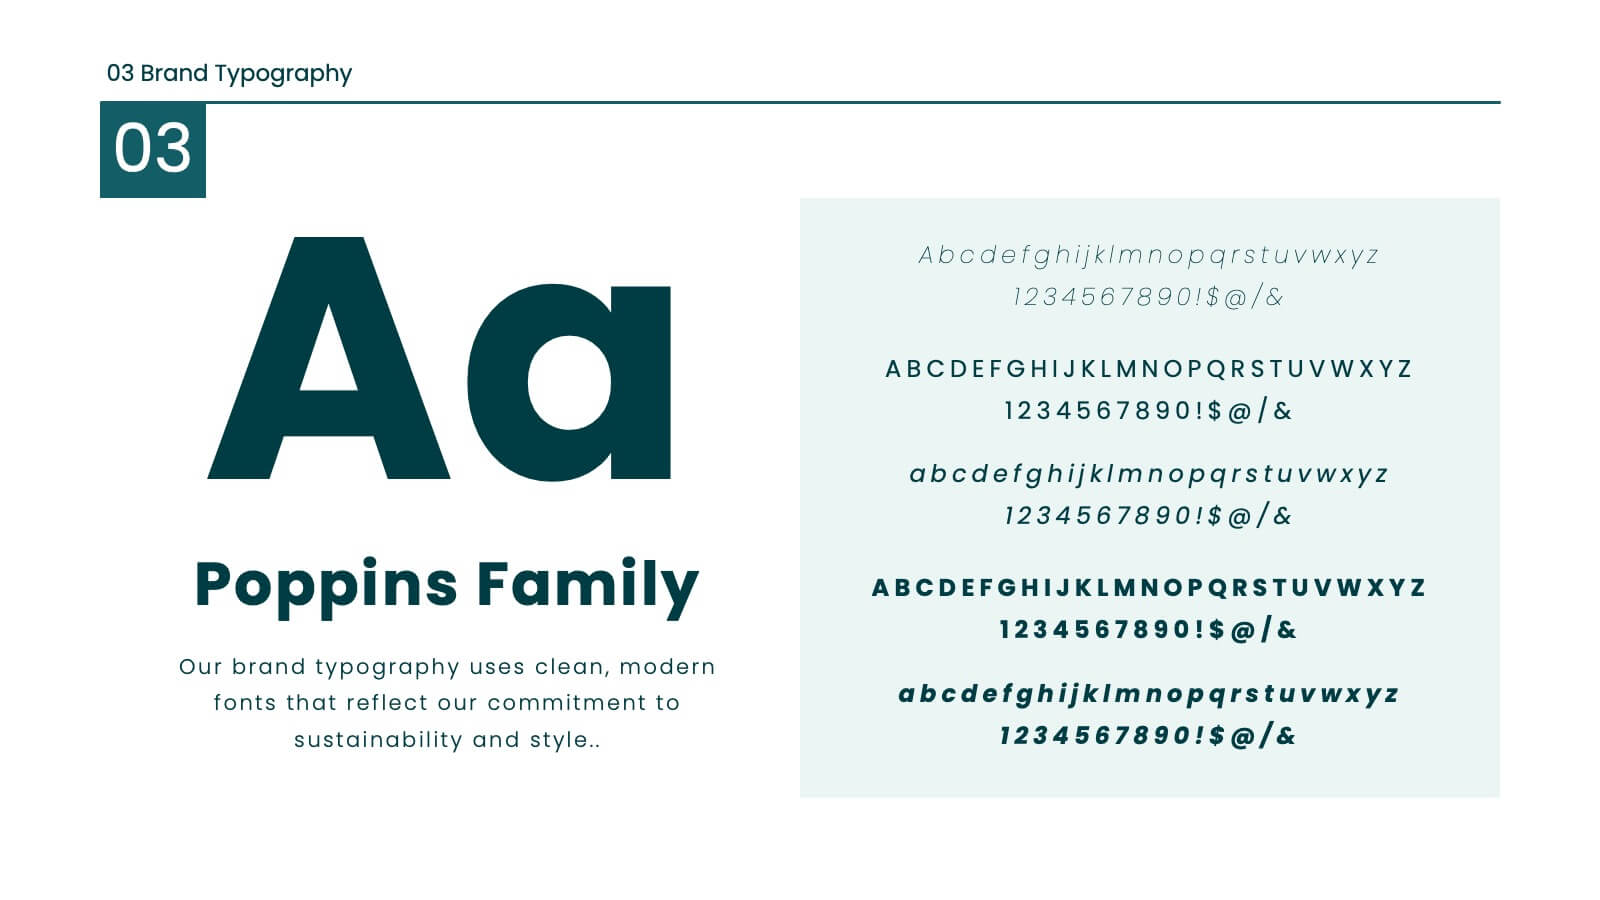
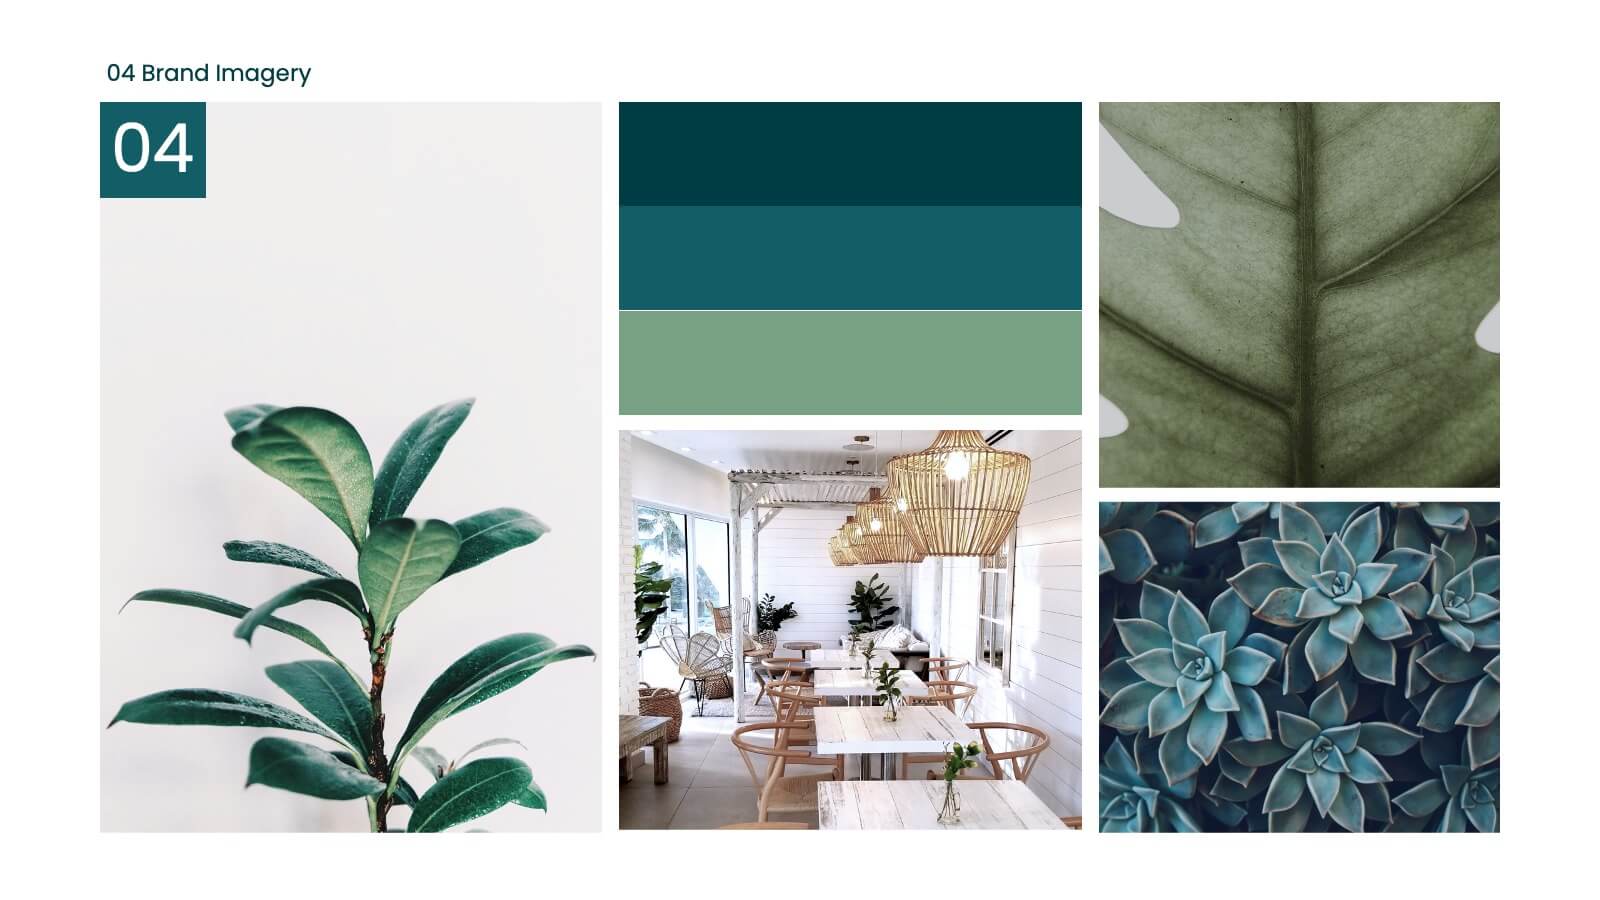
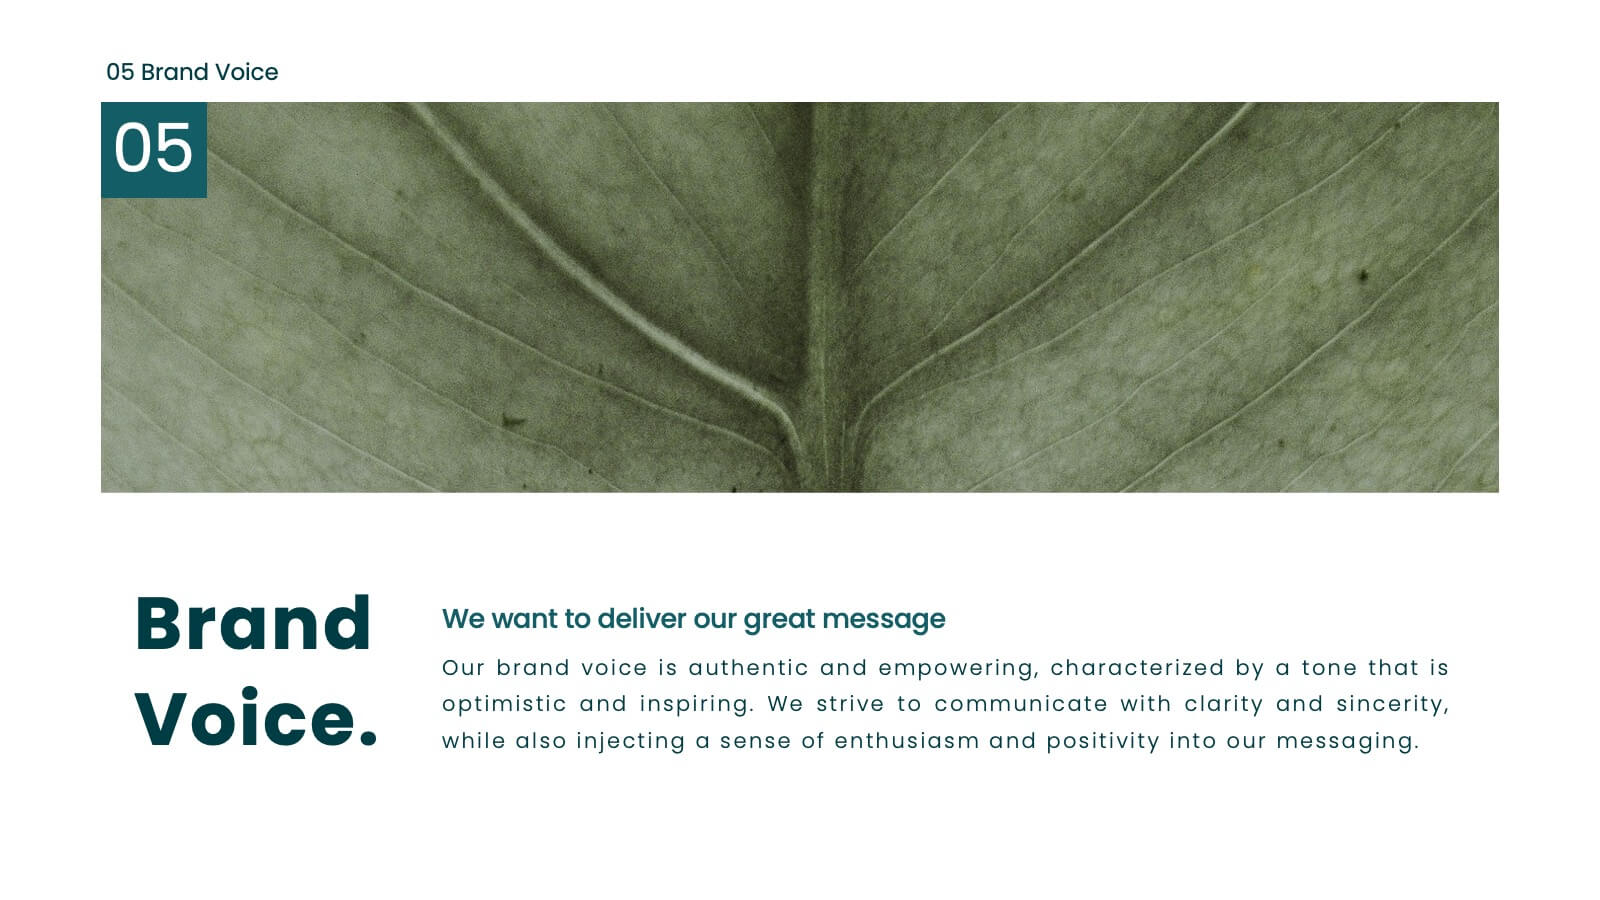
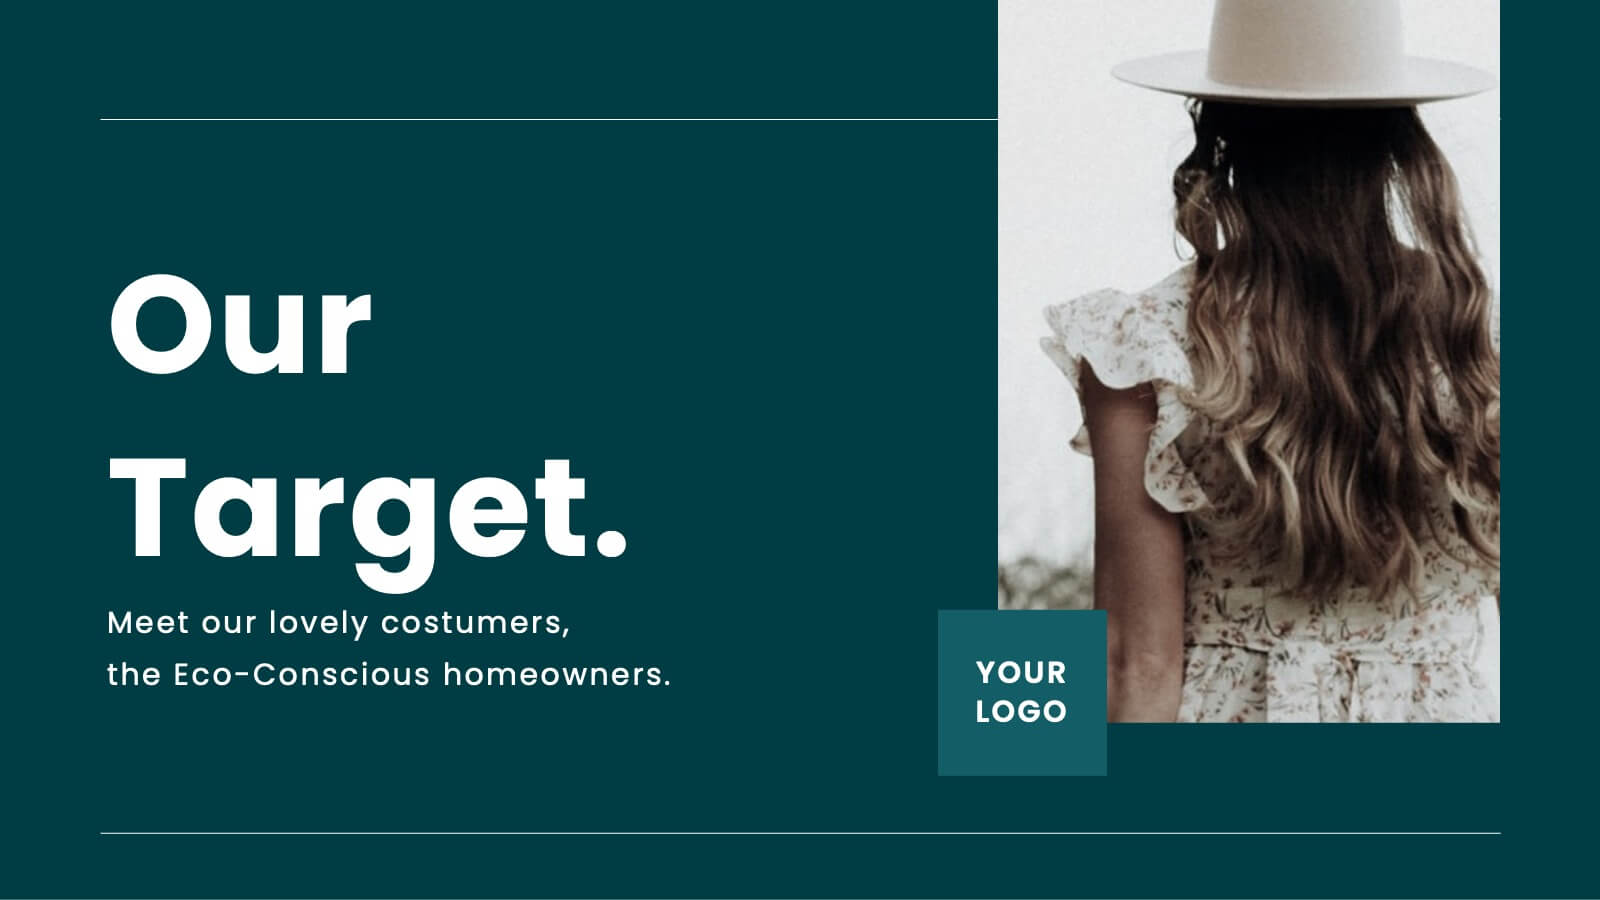
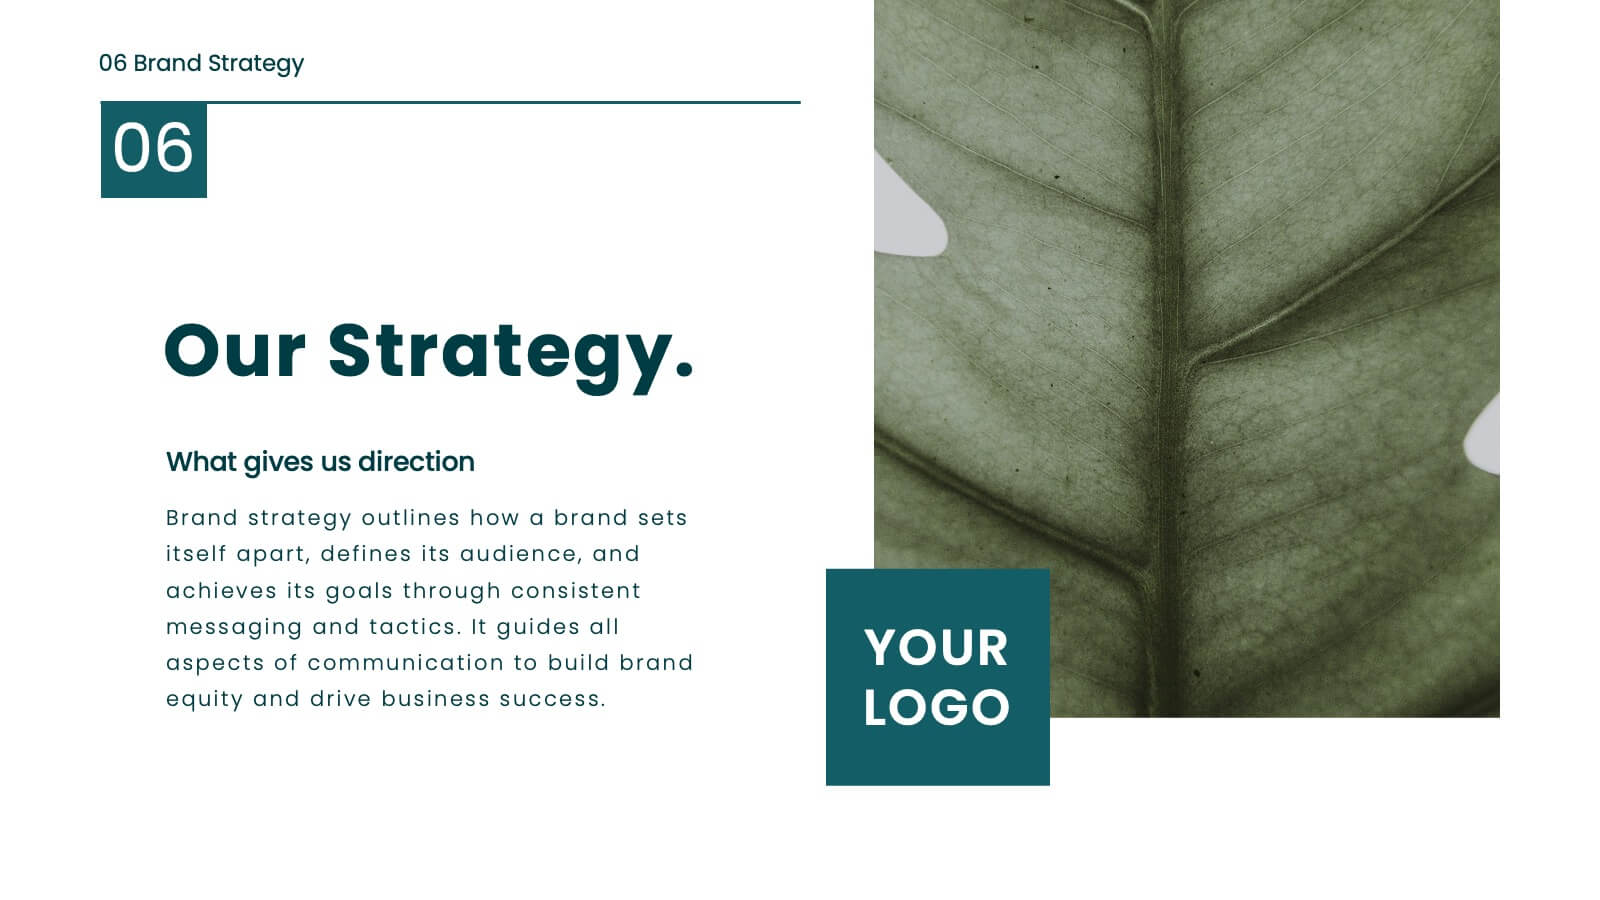
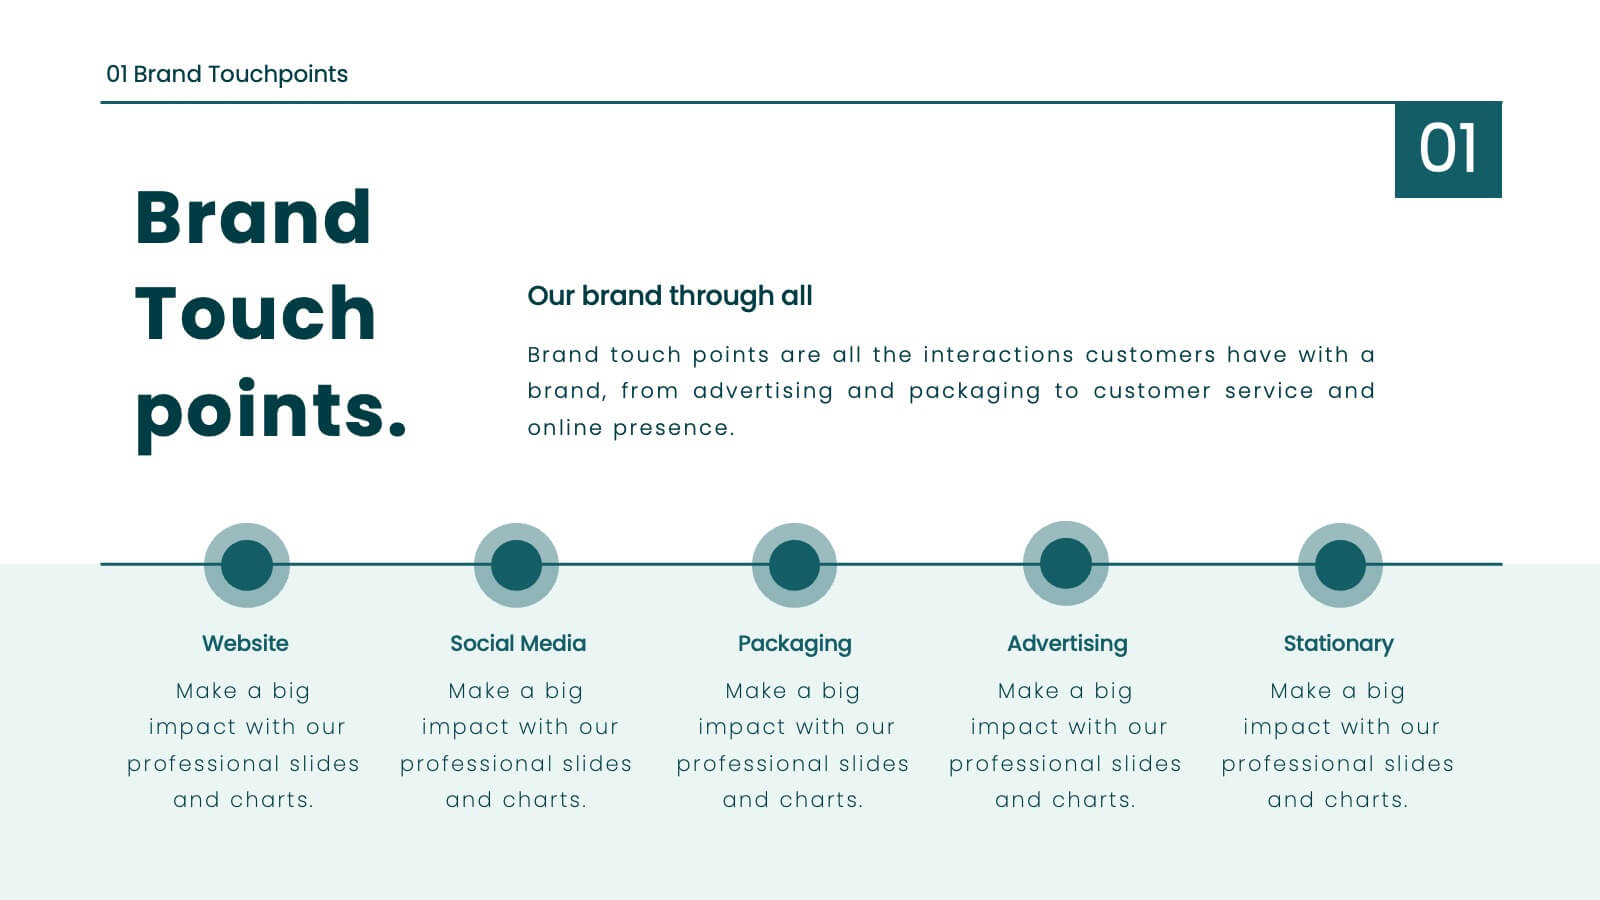
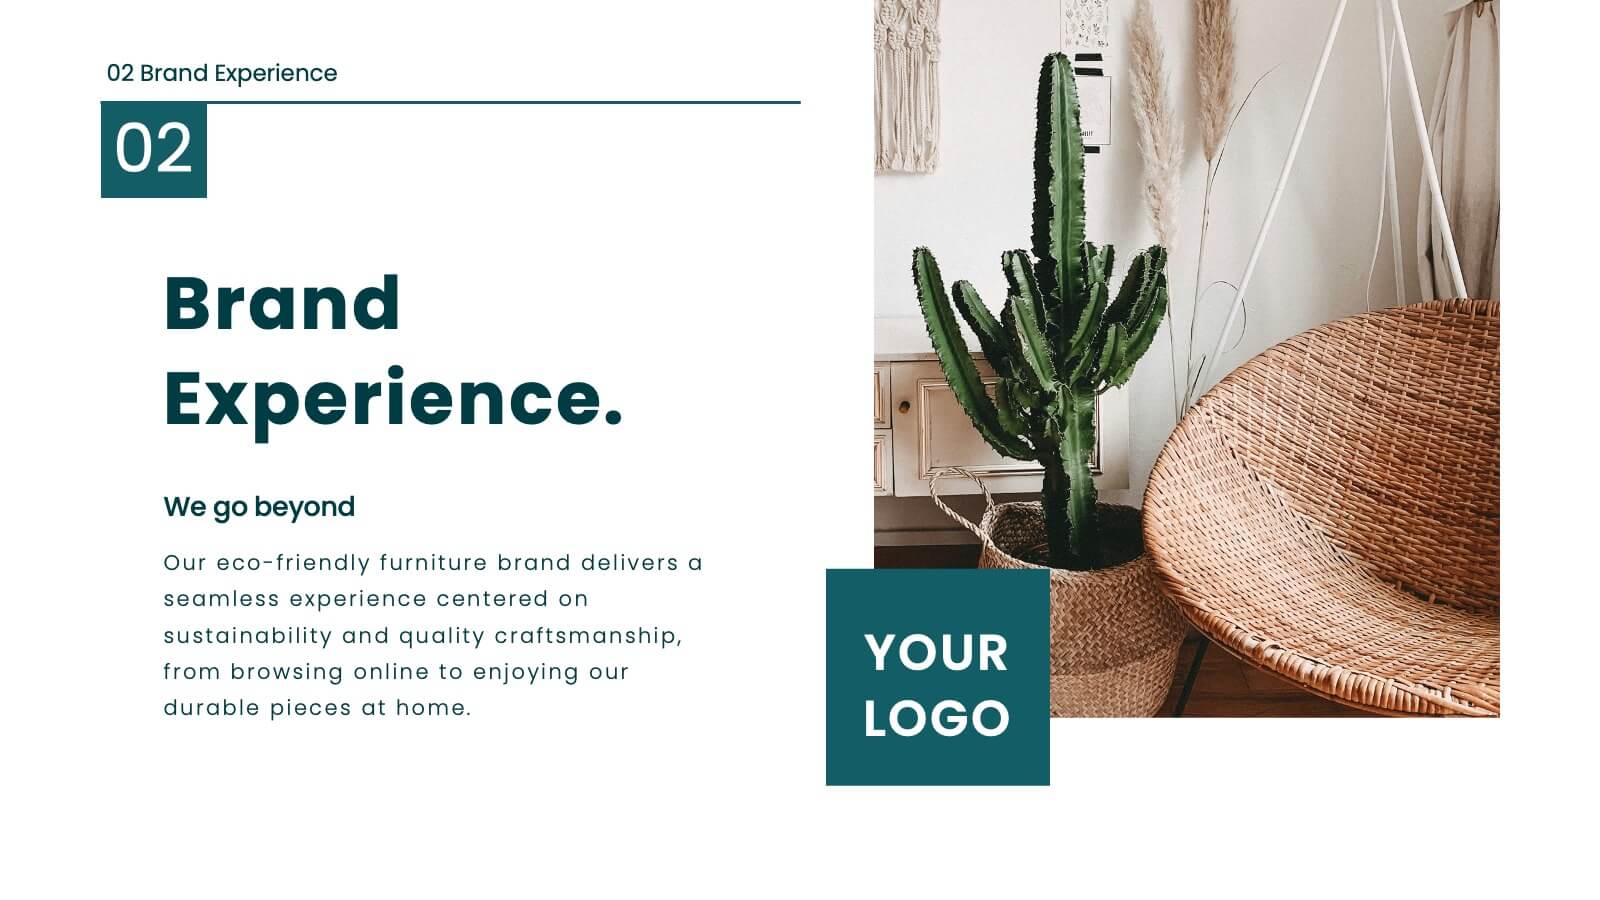
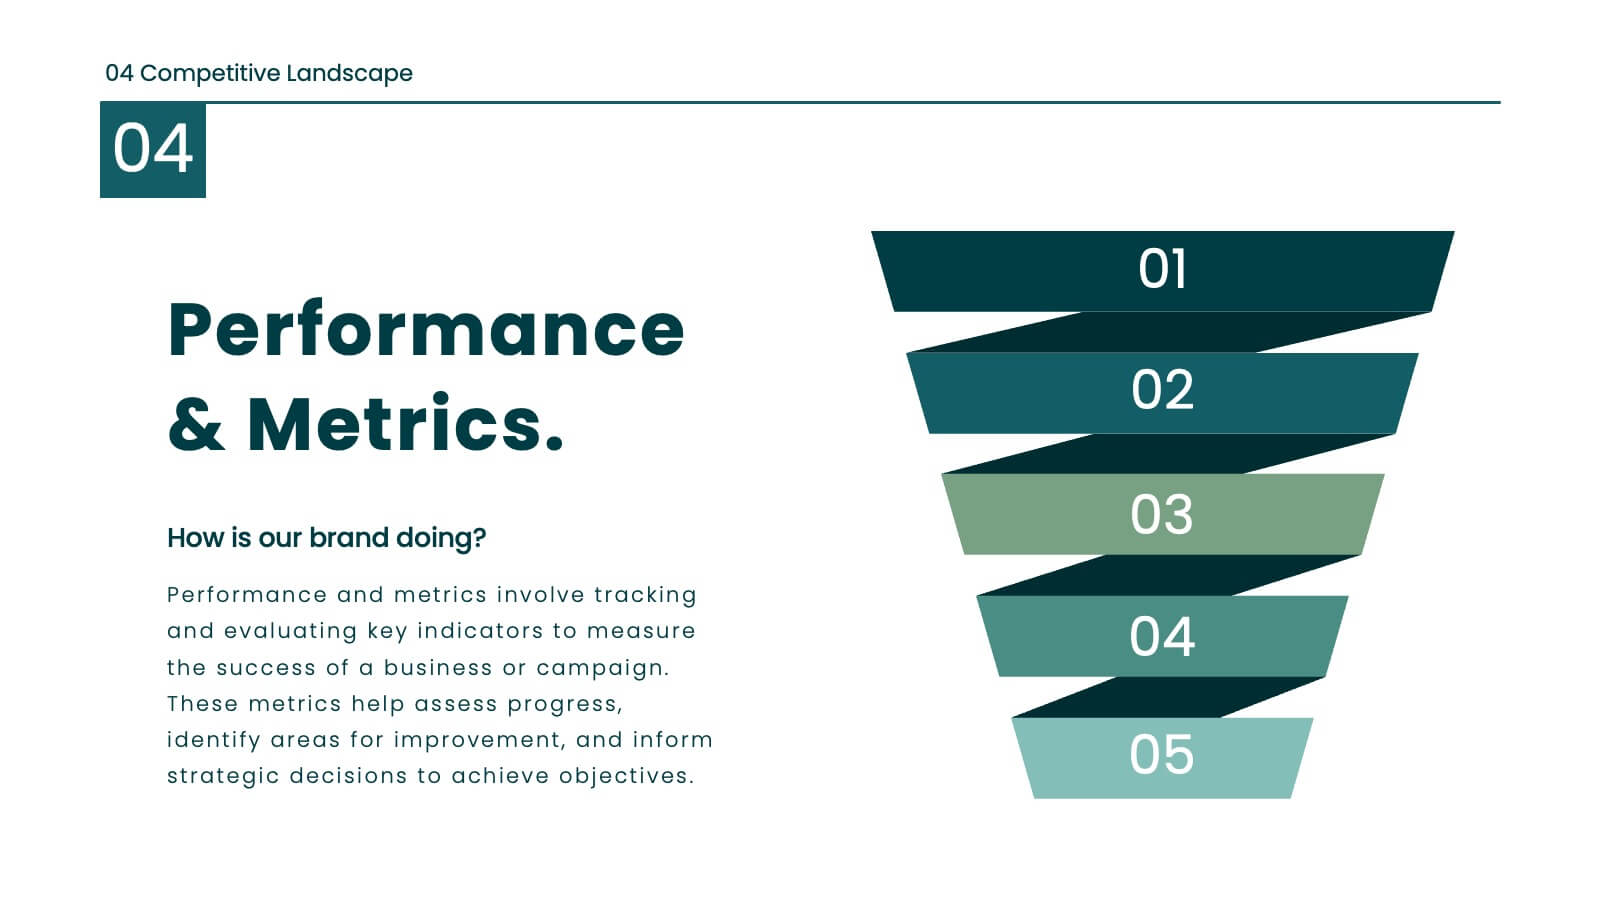
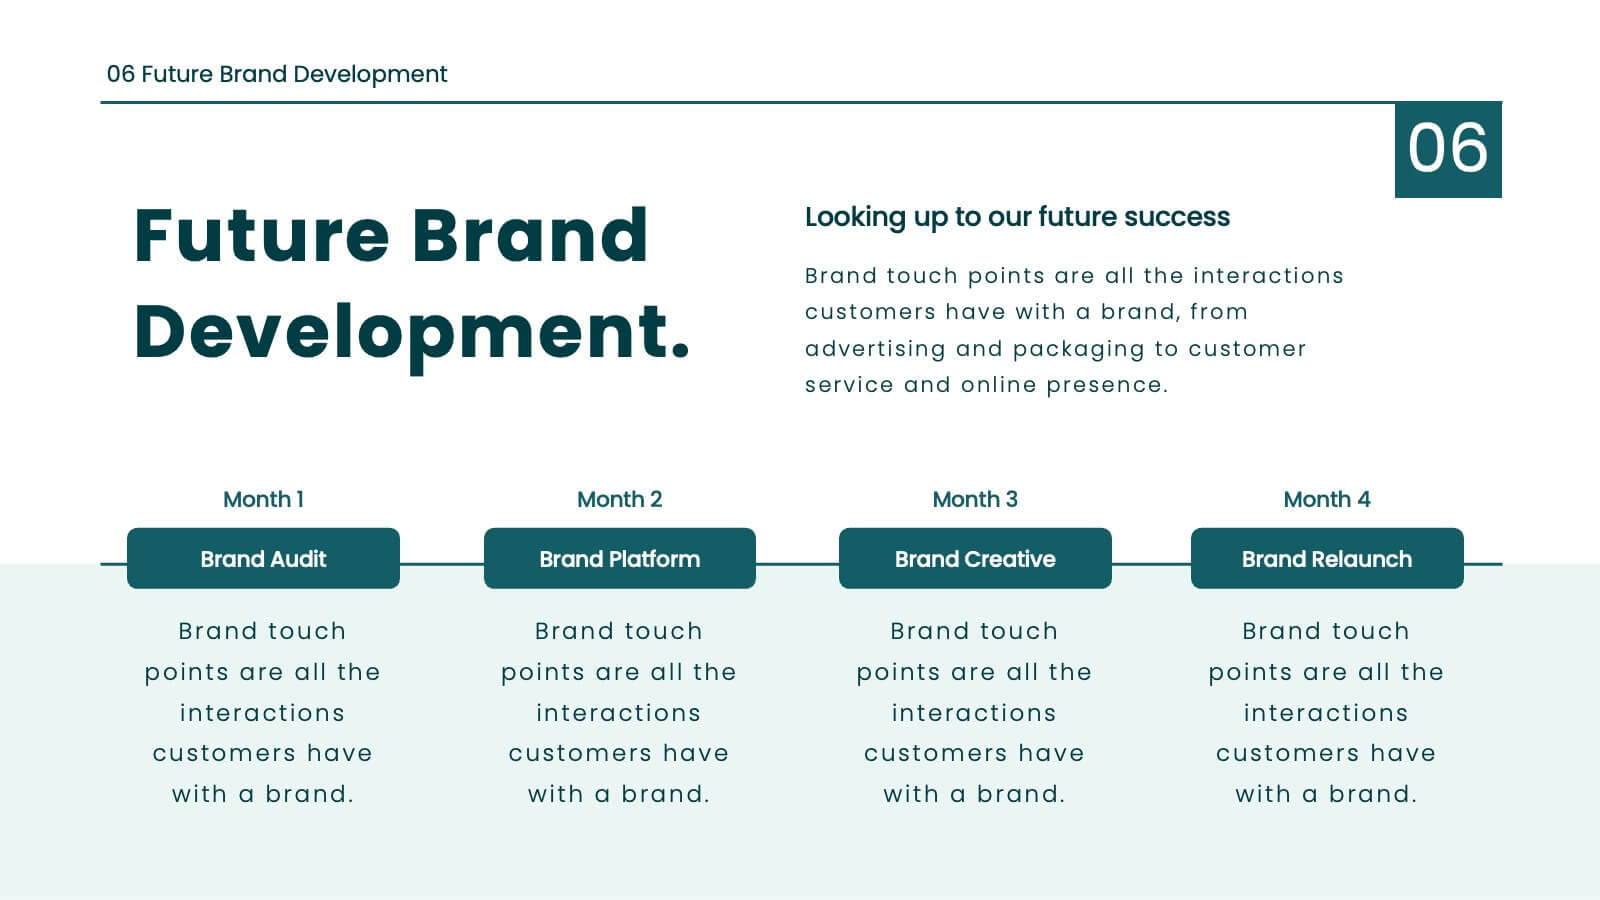
Juno Brand Guidelines Proposal Presentation
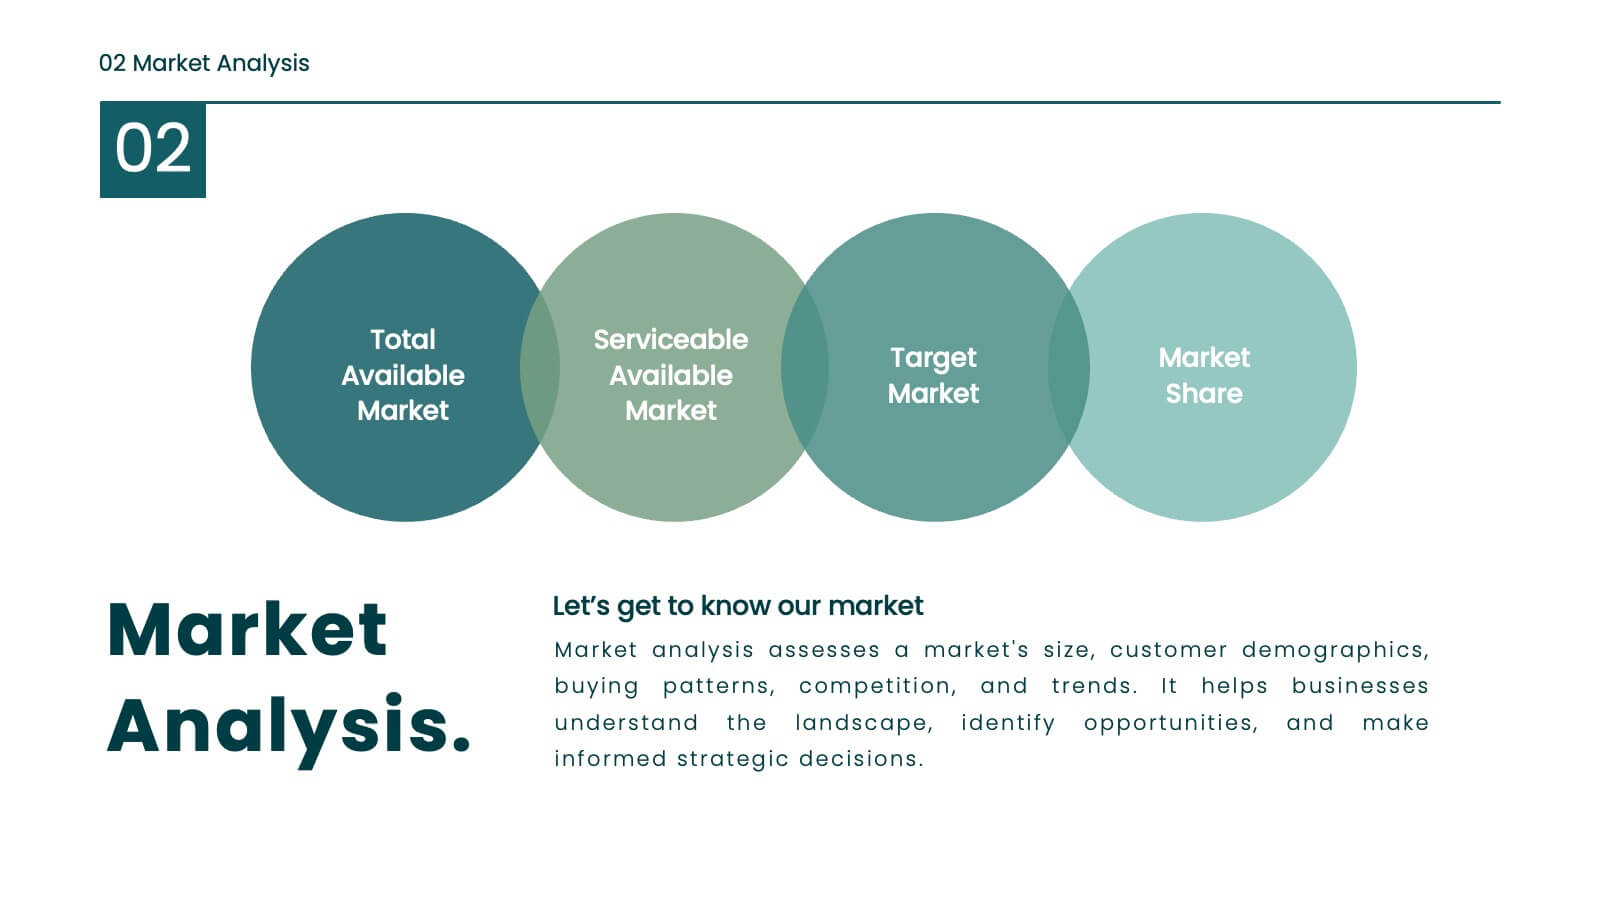
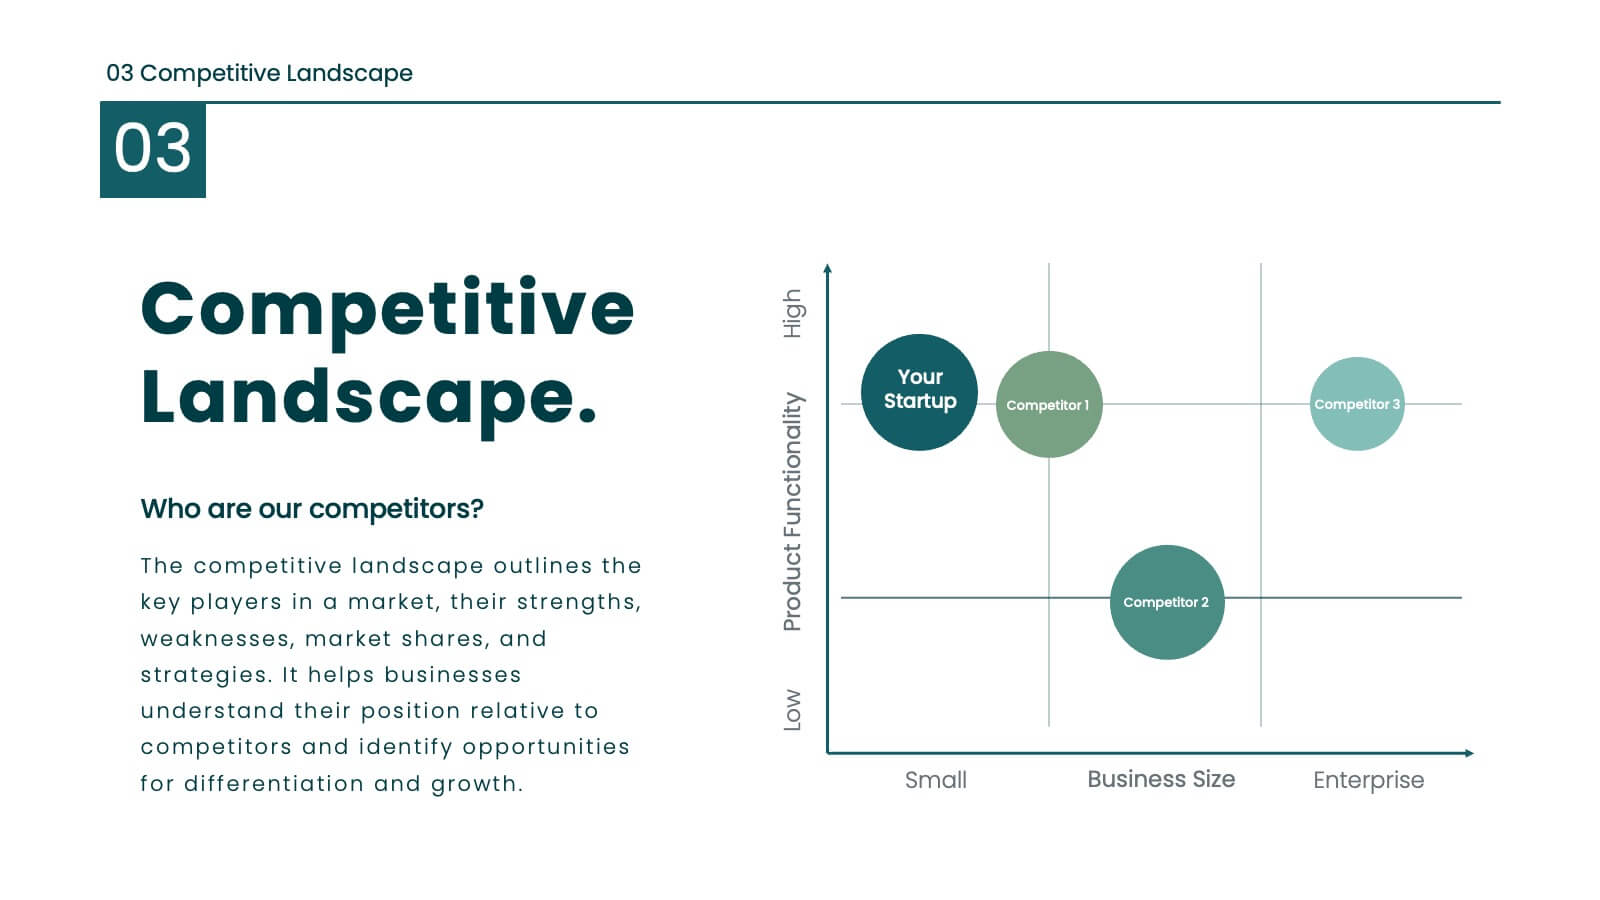
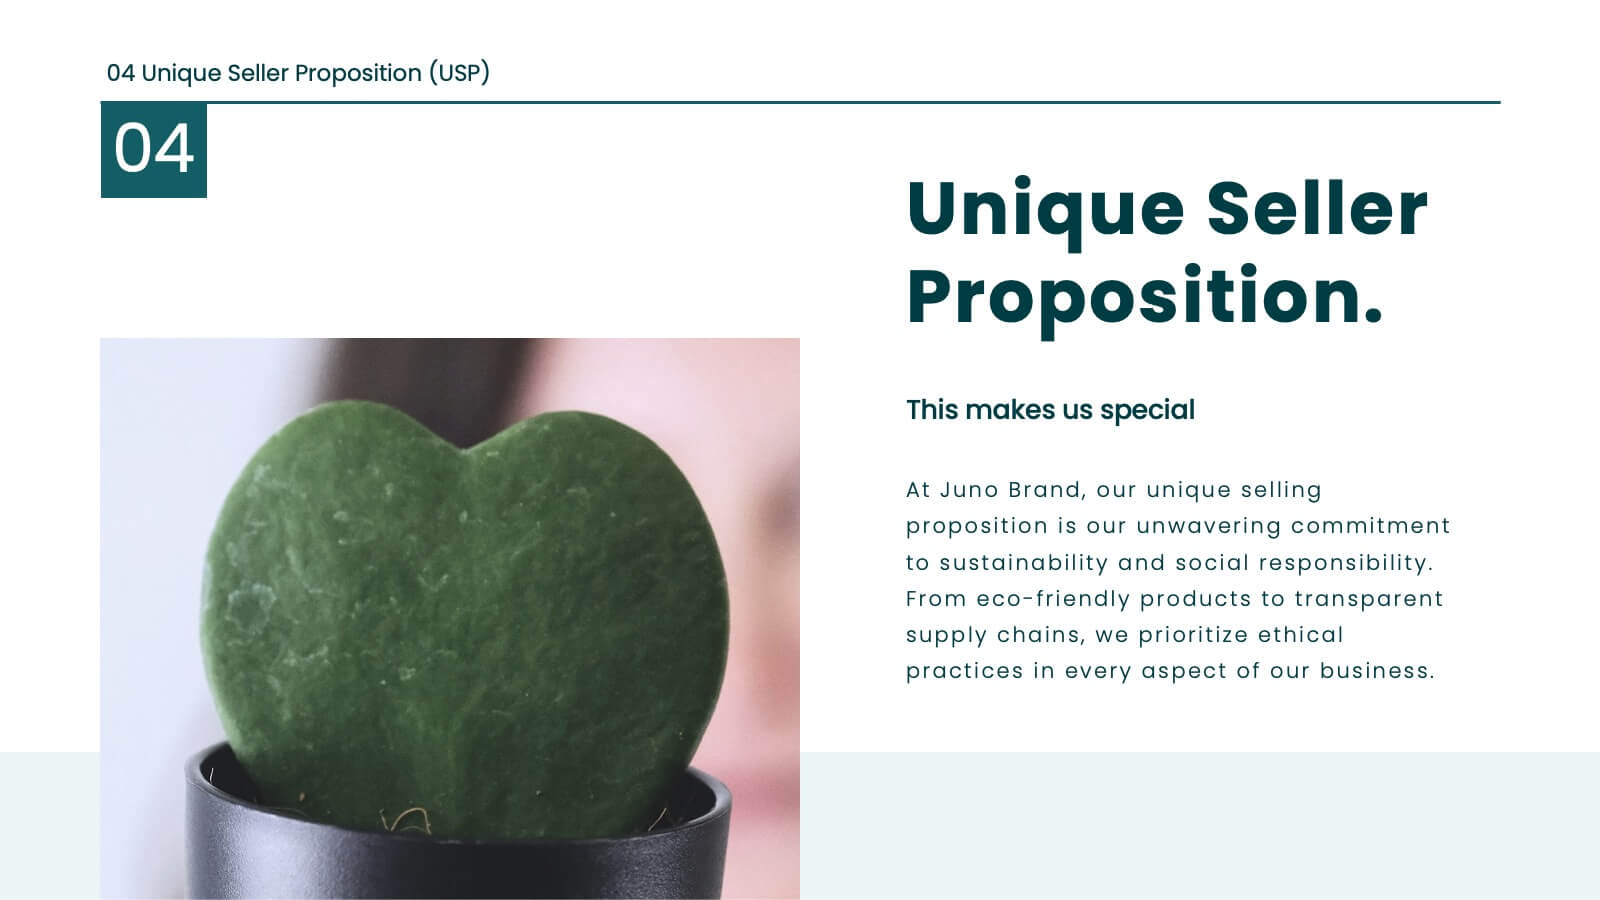
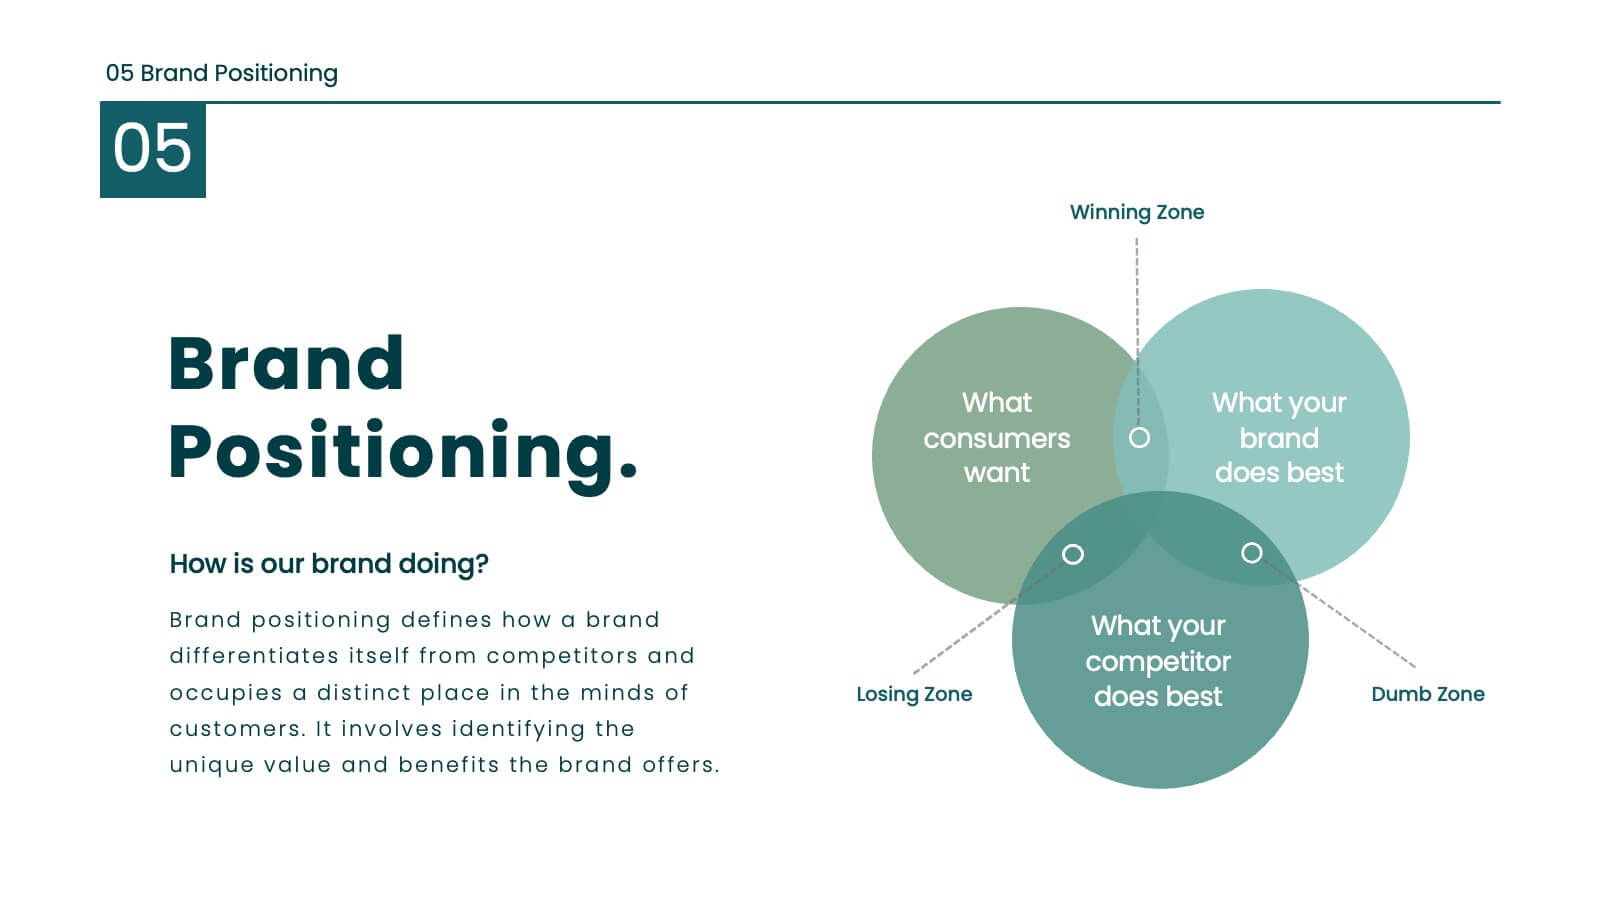
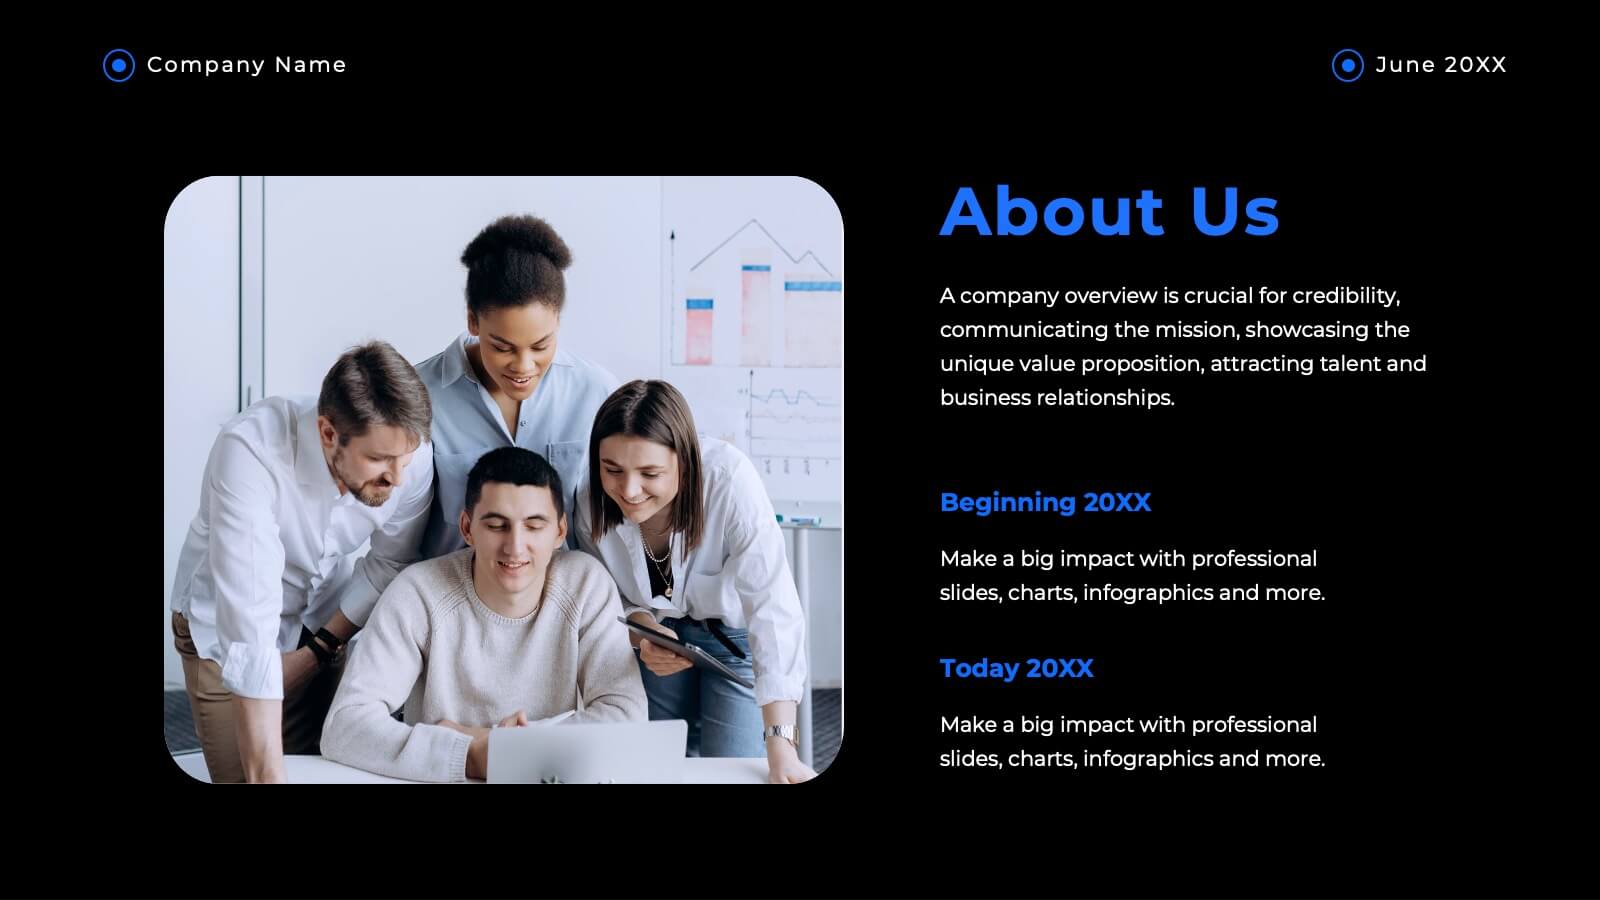
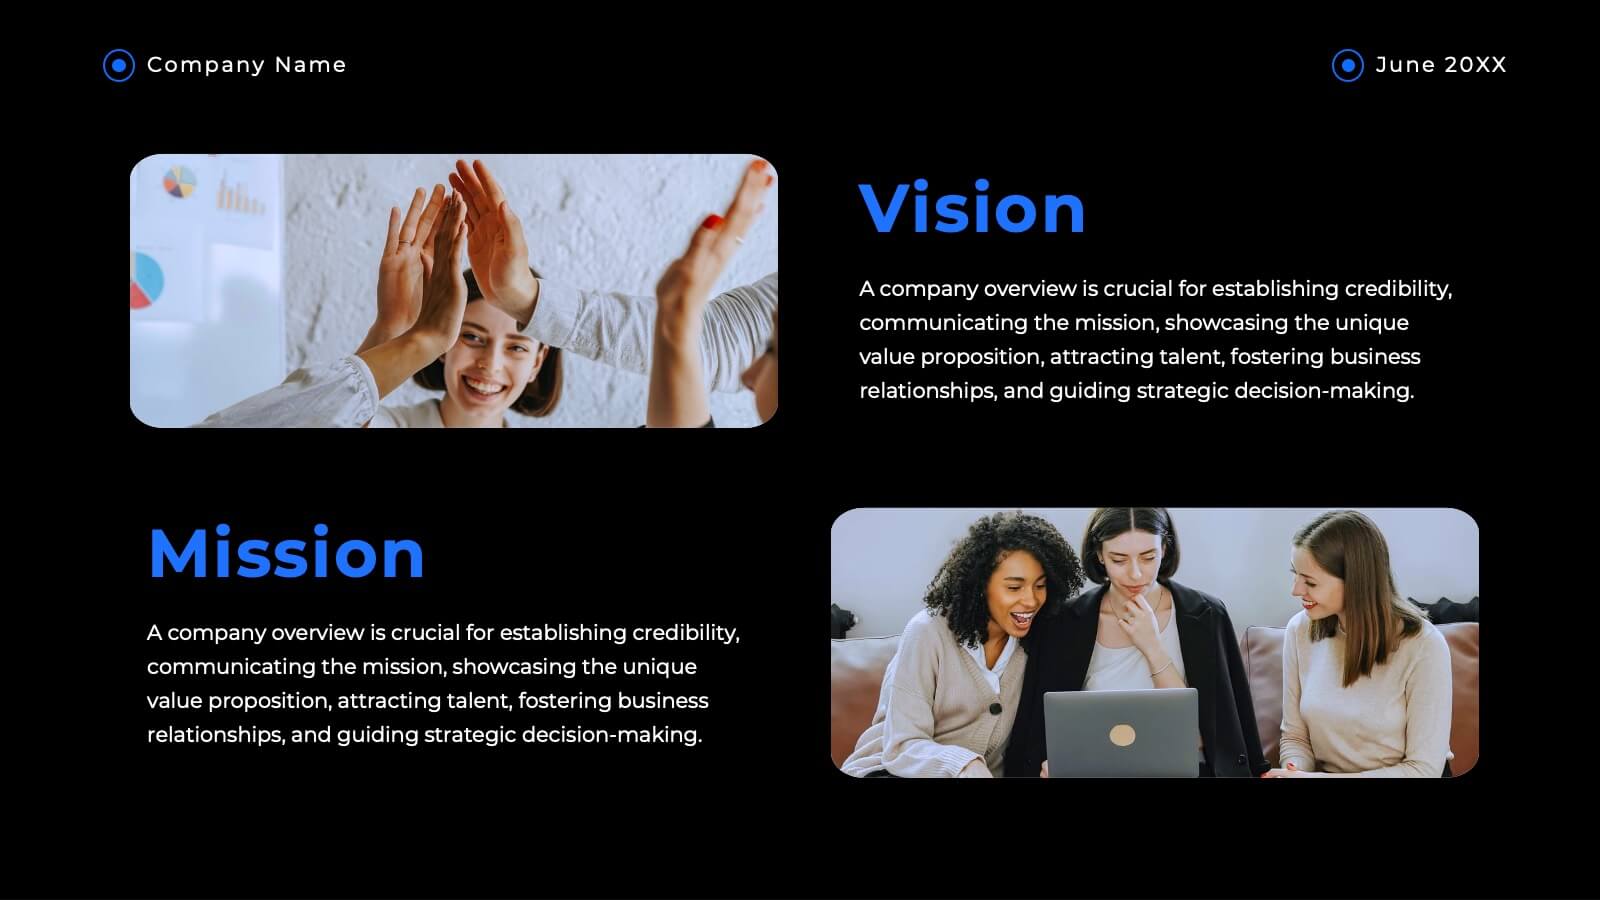
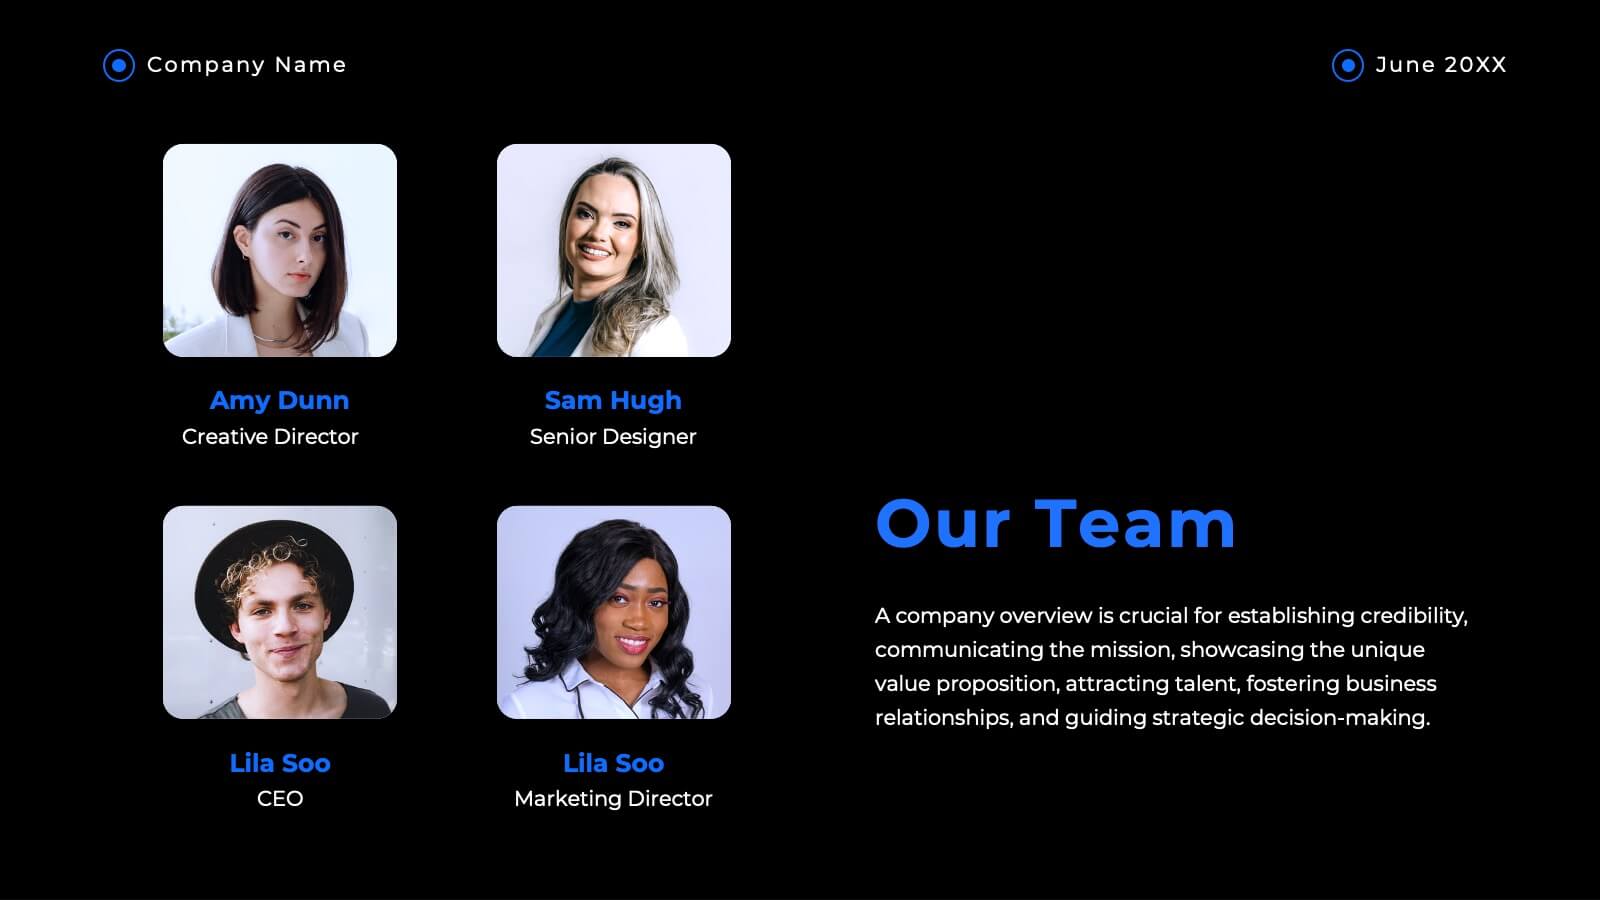
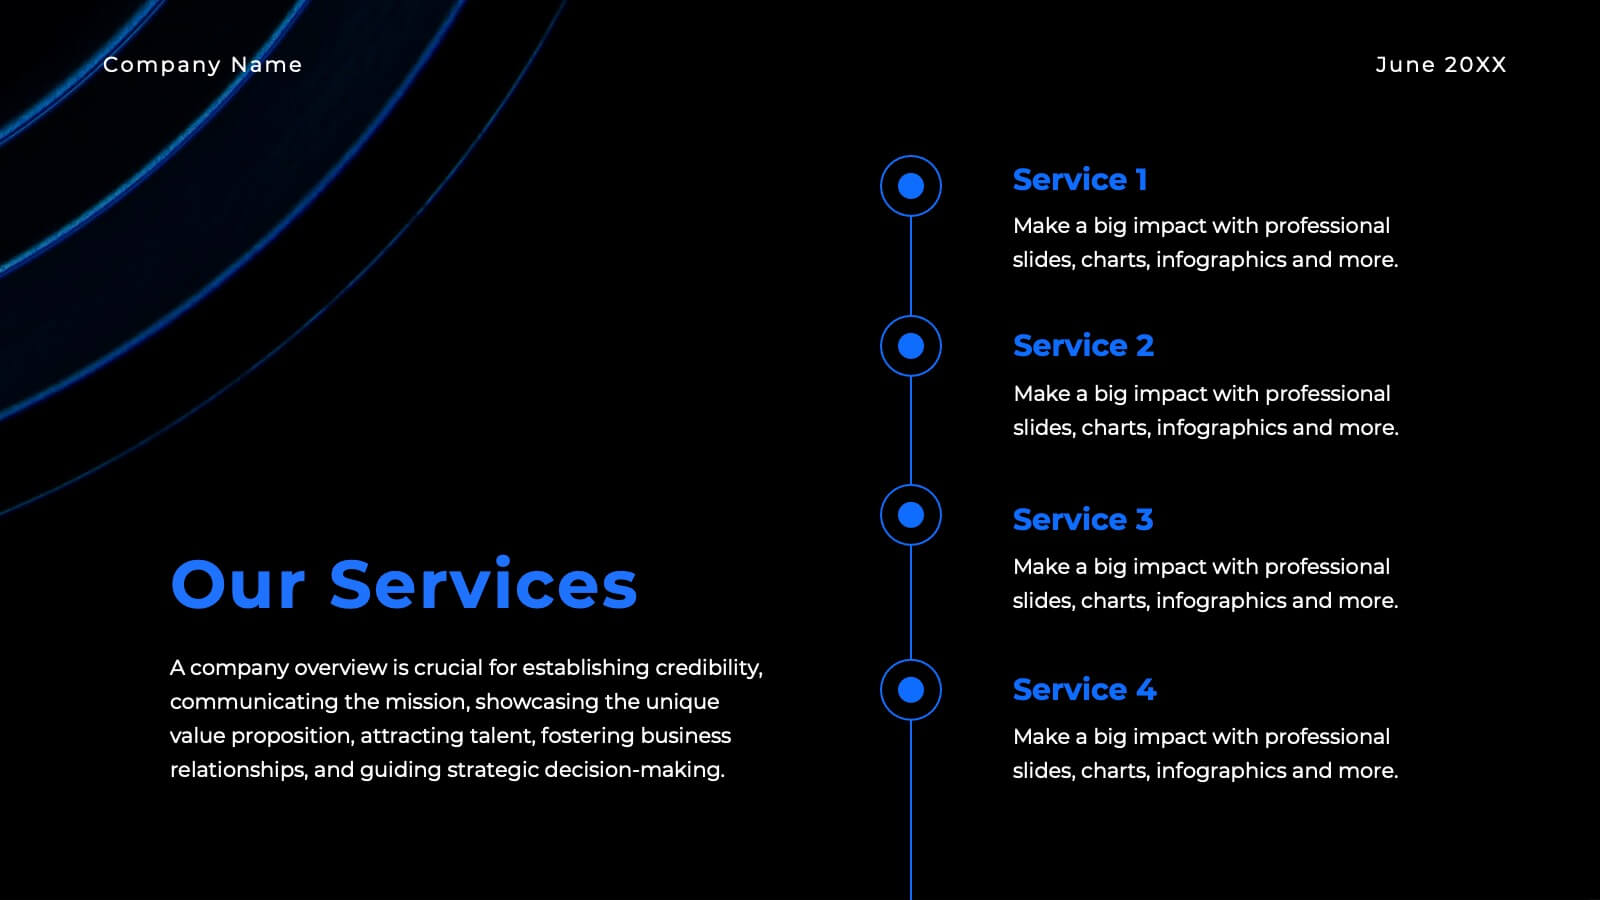
Define your brand's identity with this comprehensive, stylish presentation template. Perfect for detailing brand guidelines, vision, mission, and market analysis, it features a clean design with a professional layout. Highlight key elements like color palettes, typography, and unique selling propositions to ensure consistency and clarity. Compatible with PowerPoint, Keynote, and Google Slides, it’s ideal for any platform.


5 slides
Problem Framing and Opportunity Identification Presentation
Spot challenges and uncover growth potential with this Problem Framing and Opportunity Identification presentation. Ideal for strategy sessions, this layered pyramid layout helps you organize problems from surface-level to root causes while aligning them with strategic opportunities. Fully editable in Canva, PowerPoint, or Google Slides for seamless customization.


22 slides
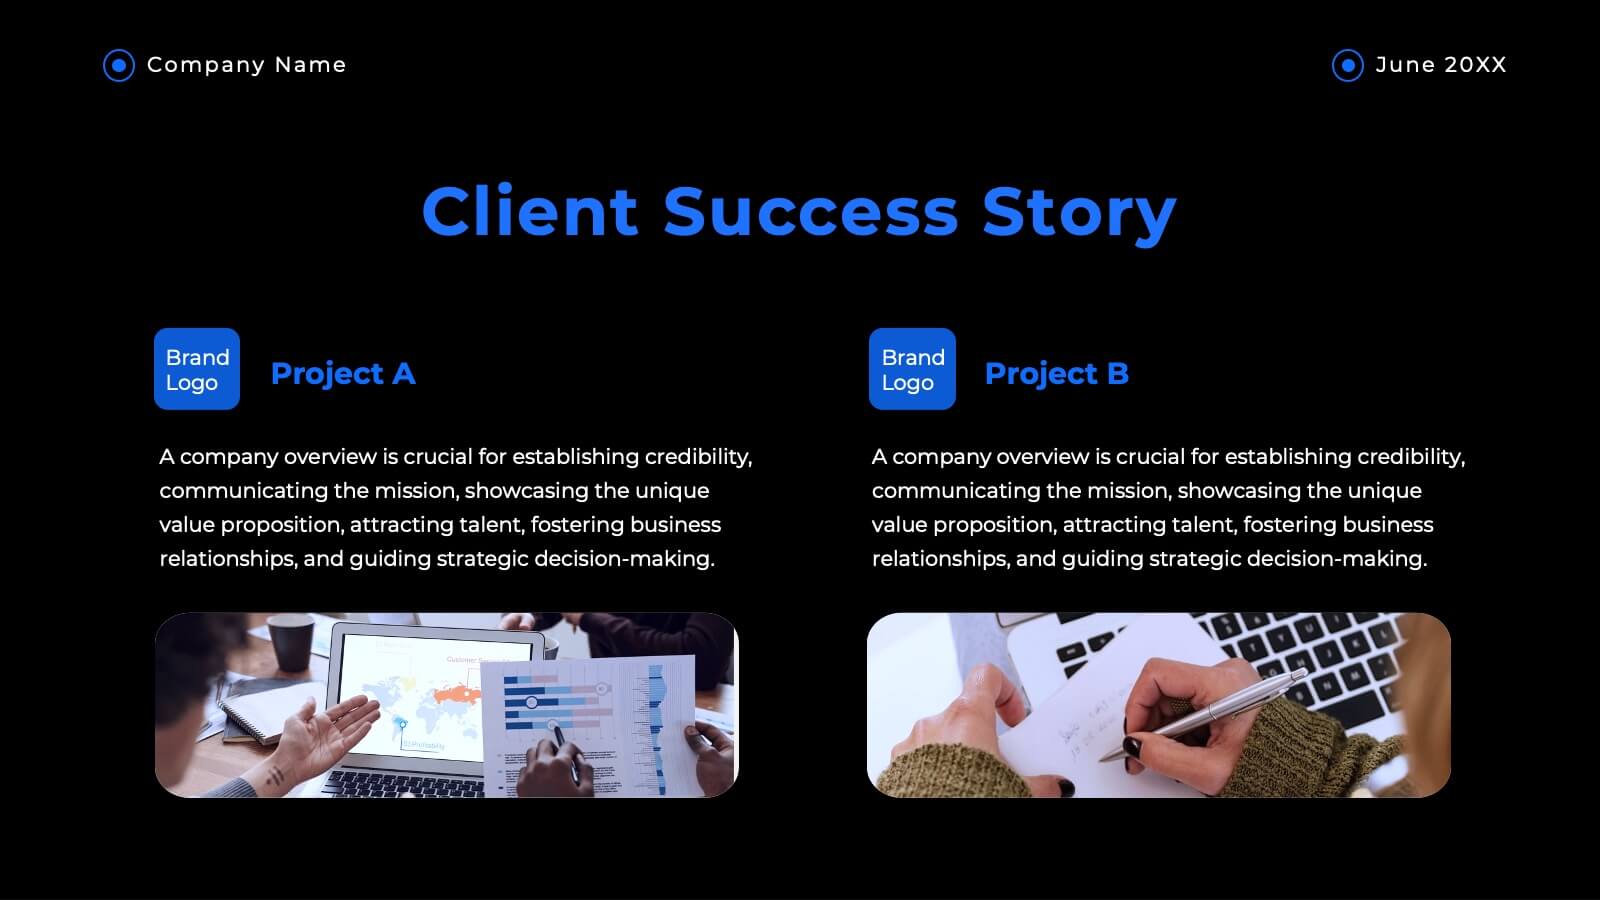
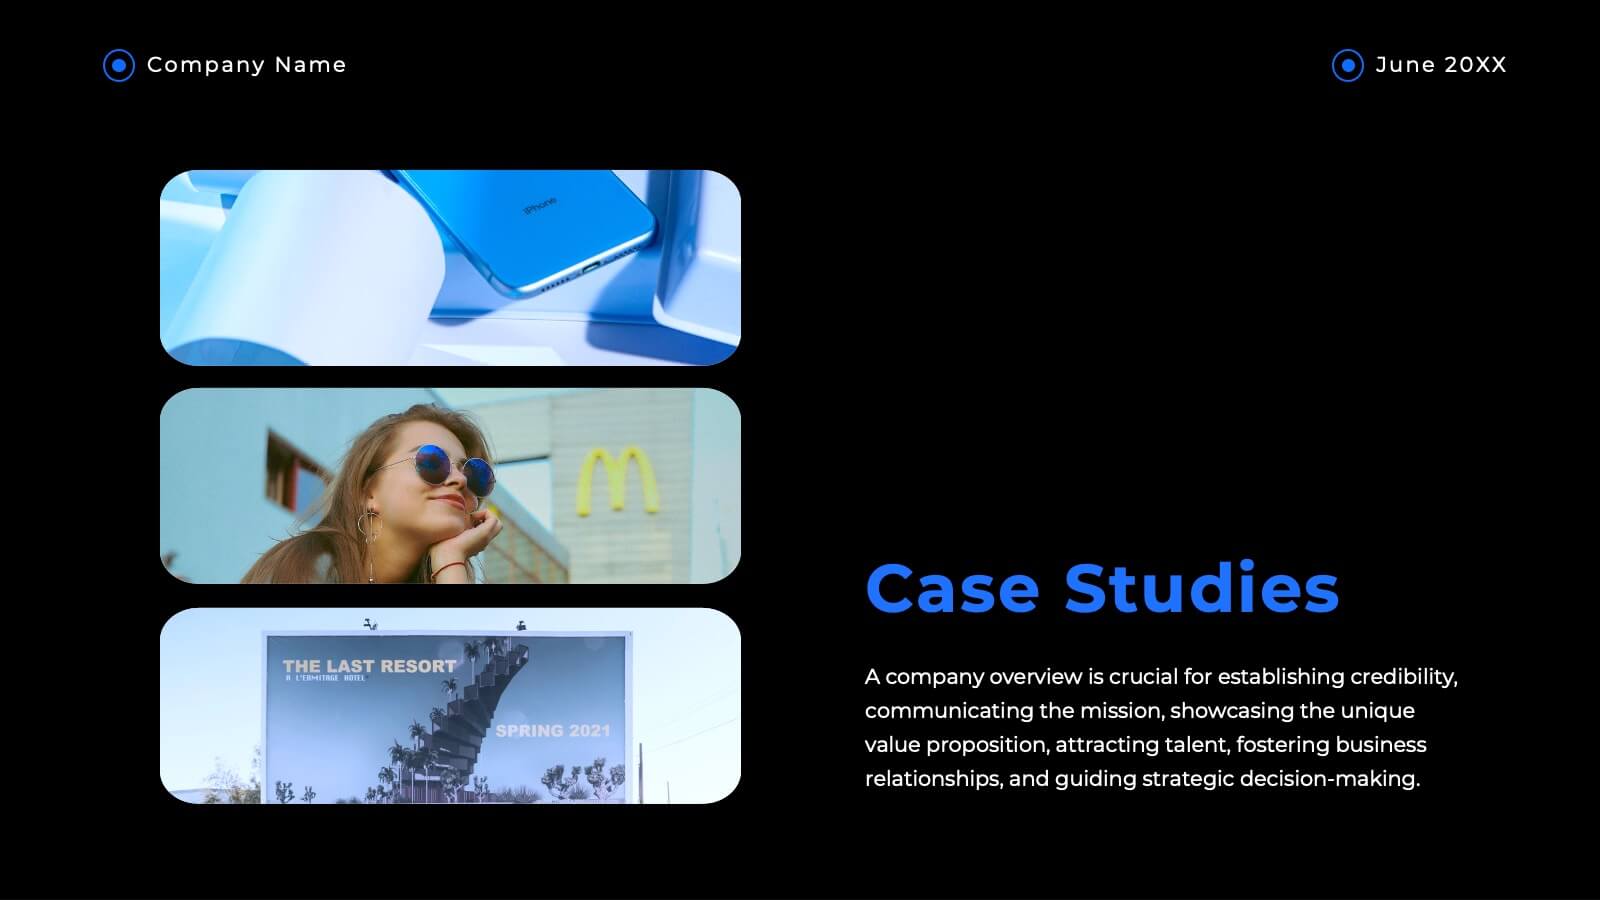
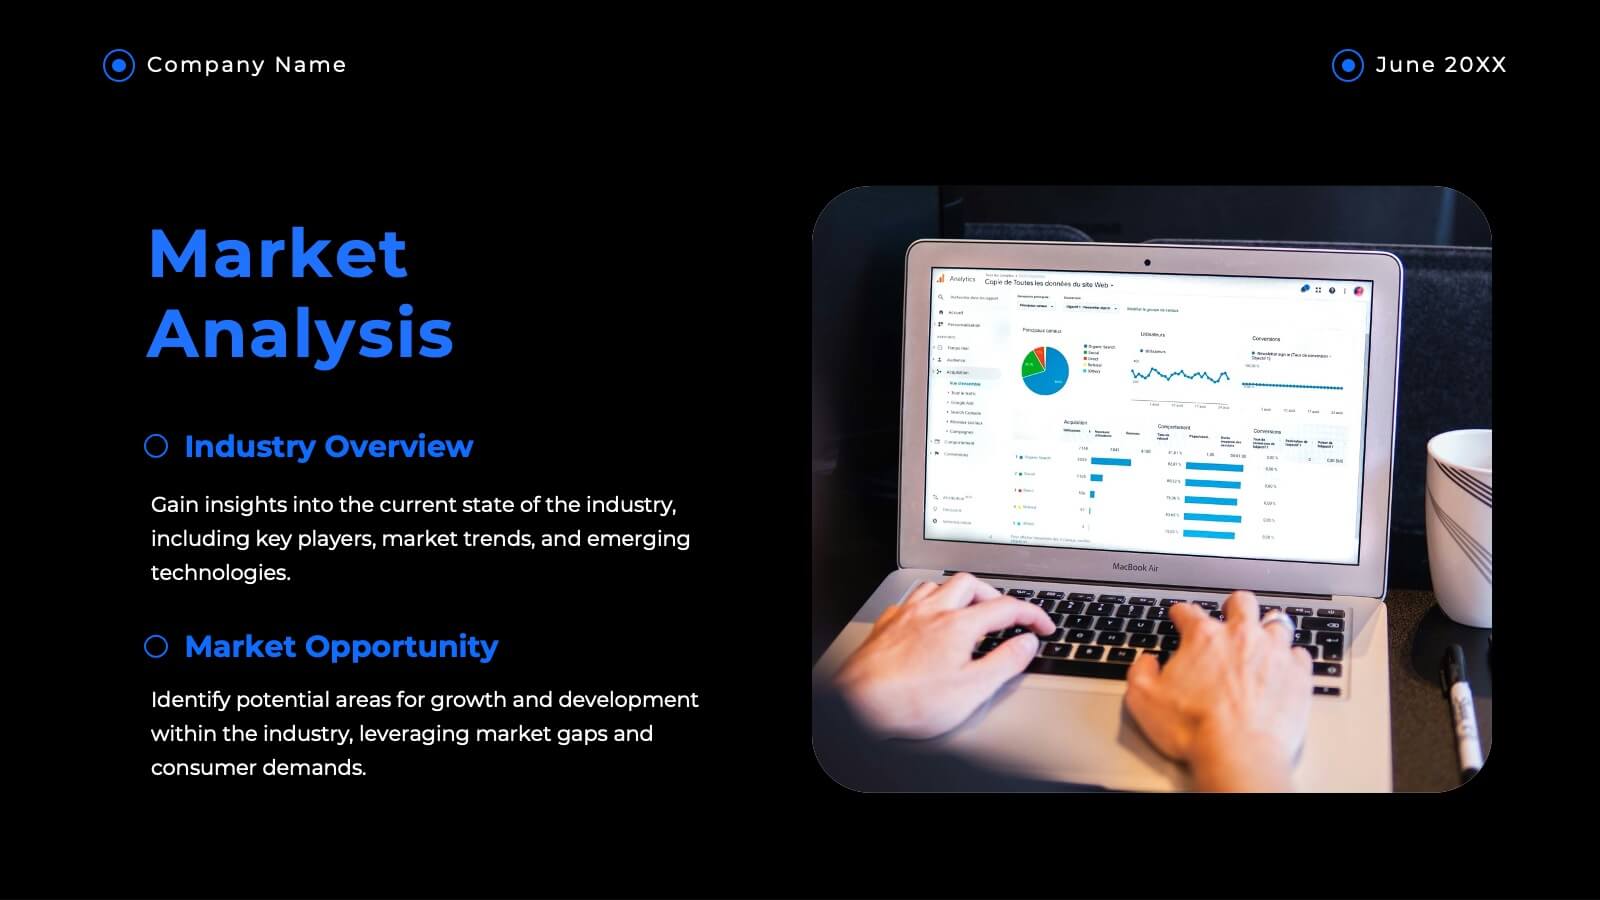
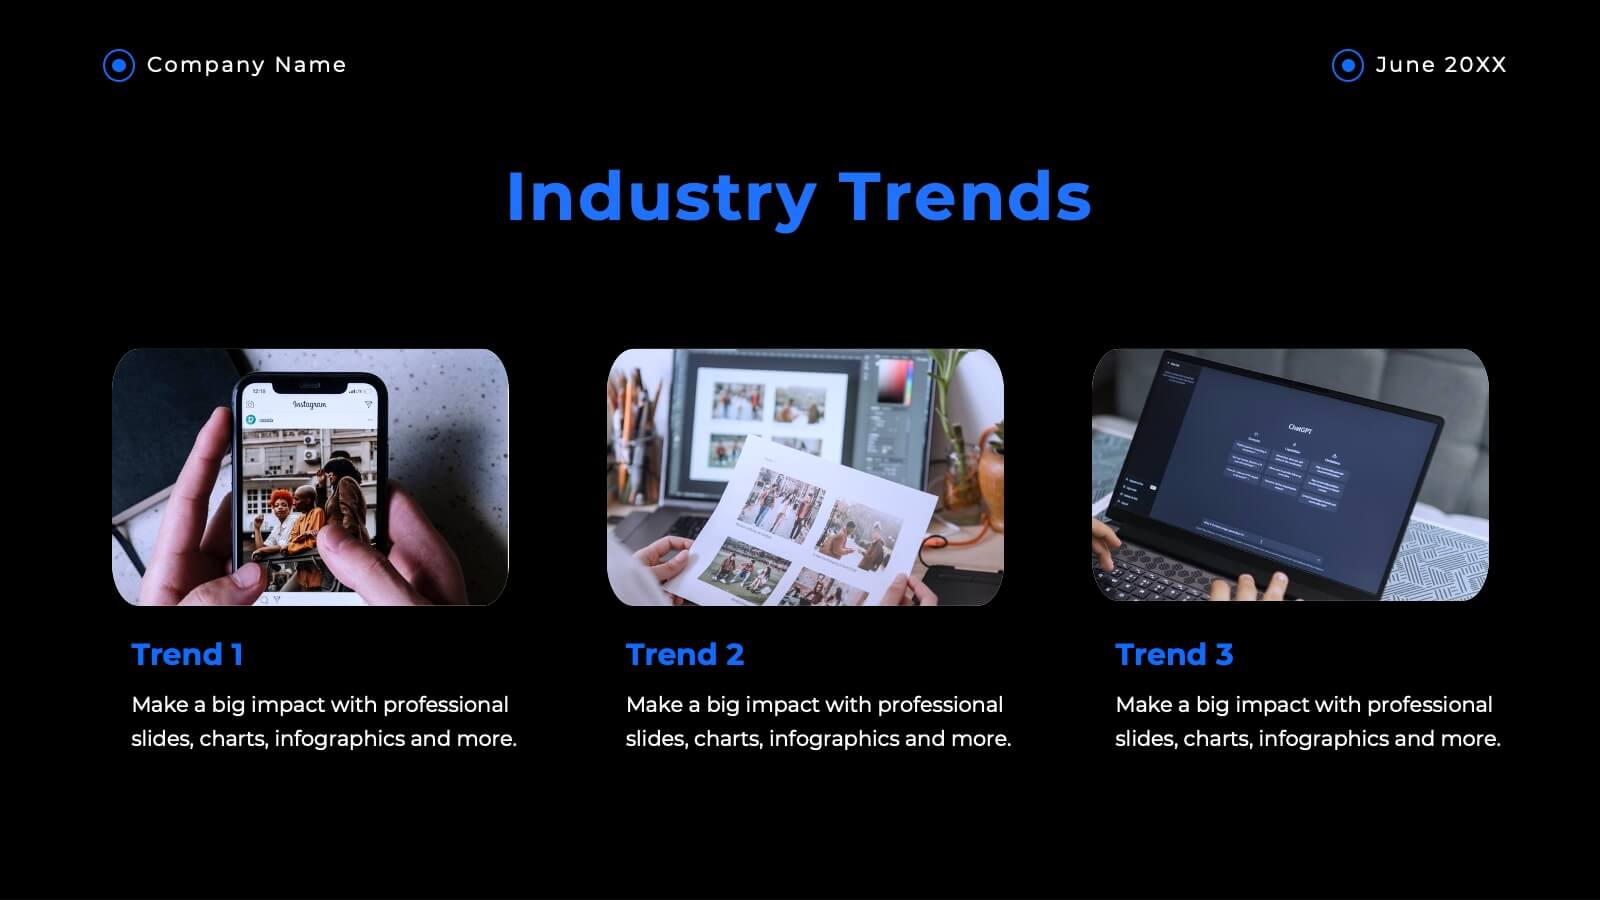
Syncopate Agency Portfolio Presentation
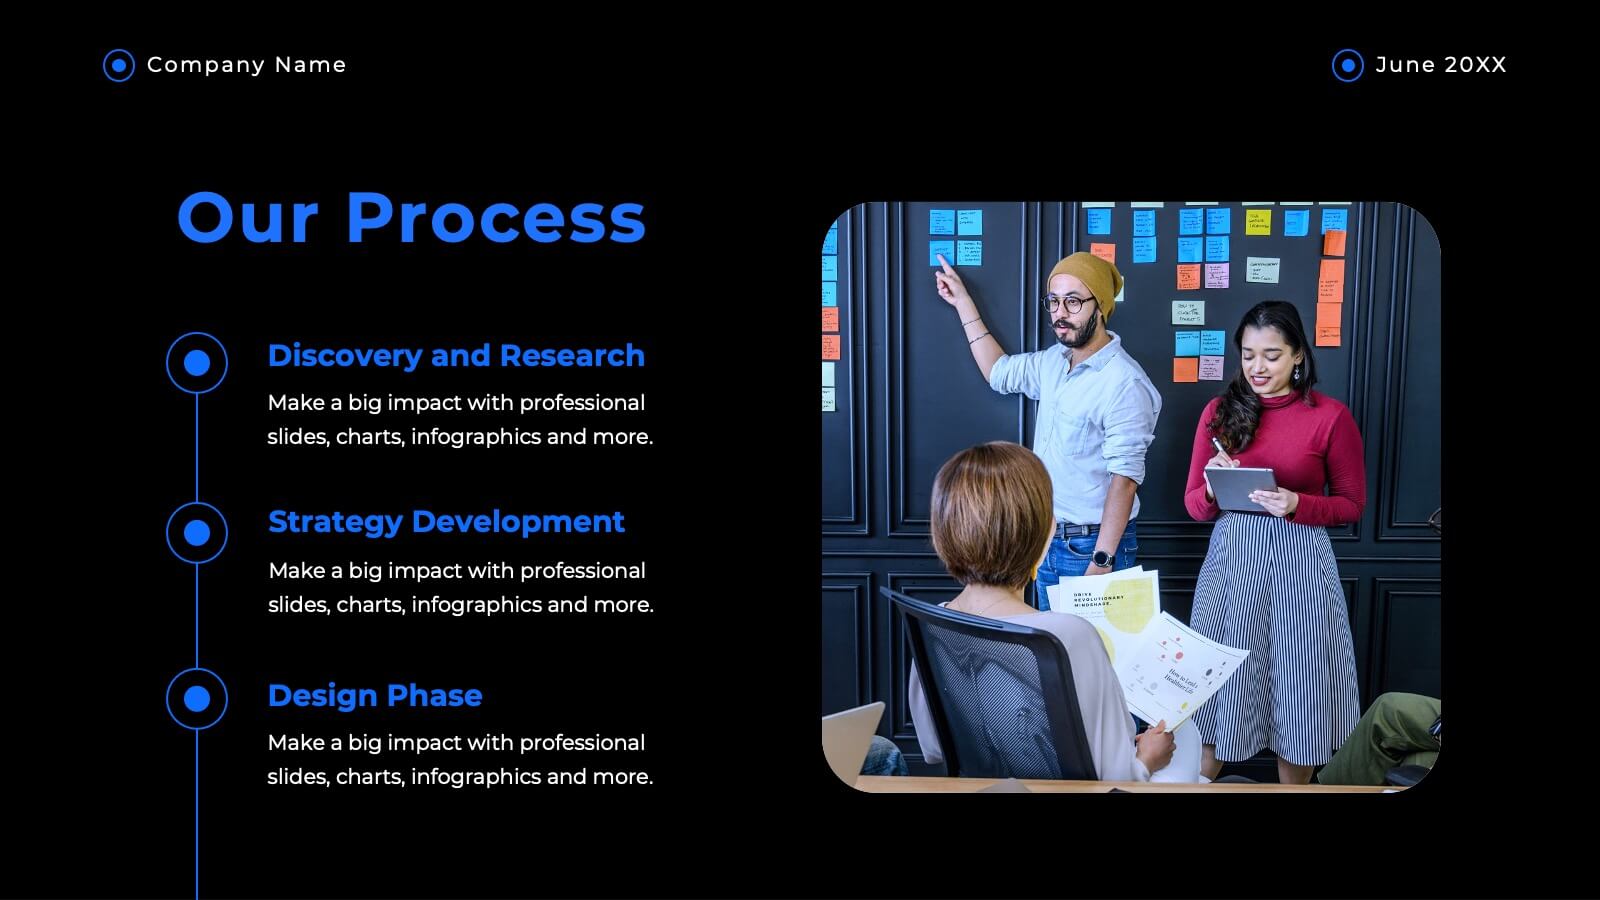
Showcase your agency’s expertise and achievements with a professional portfolio presentation designed to captivate and inform. This versatile template is tailored for agencies looking to highlight their services, approach, and client success stories with clarity and impact. The presentation includes thoughtfully designed slides covering company mission, market analysis, creative processes, case studies, and future strategies. Utilize dedicated sections to detail campaign executions, partnership opportunities, and awards received. The layout balances aesthetic appeal with functionality, ensuring your audience remains engaged throughout your presentation. Compatible with PowerPoint, Google Slides, and Keynote, this template is fully customizable. Easily edit colors, text, and images to align with your agency's branding. Present your portfolio with confidence, leaving a lasting impression on clients, partners, and stakeholders.


6 slides
Scrum Team Roles and Sprint Planning Presentation
Visualize your Agile workflow with this Scrum team diagram. Highlight roles, responsibilities, and key sprint planning phases in a clear, circular flow. Ideal for project managers, team leads, or Agile coaches. Fully editable in PowerPoint, Keynote, and Google Slides to support your software development or Agile training presentations.


5 slides
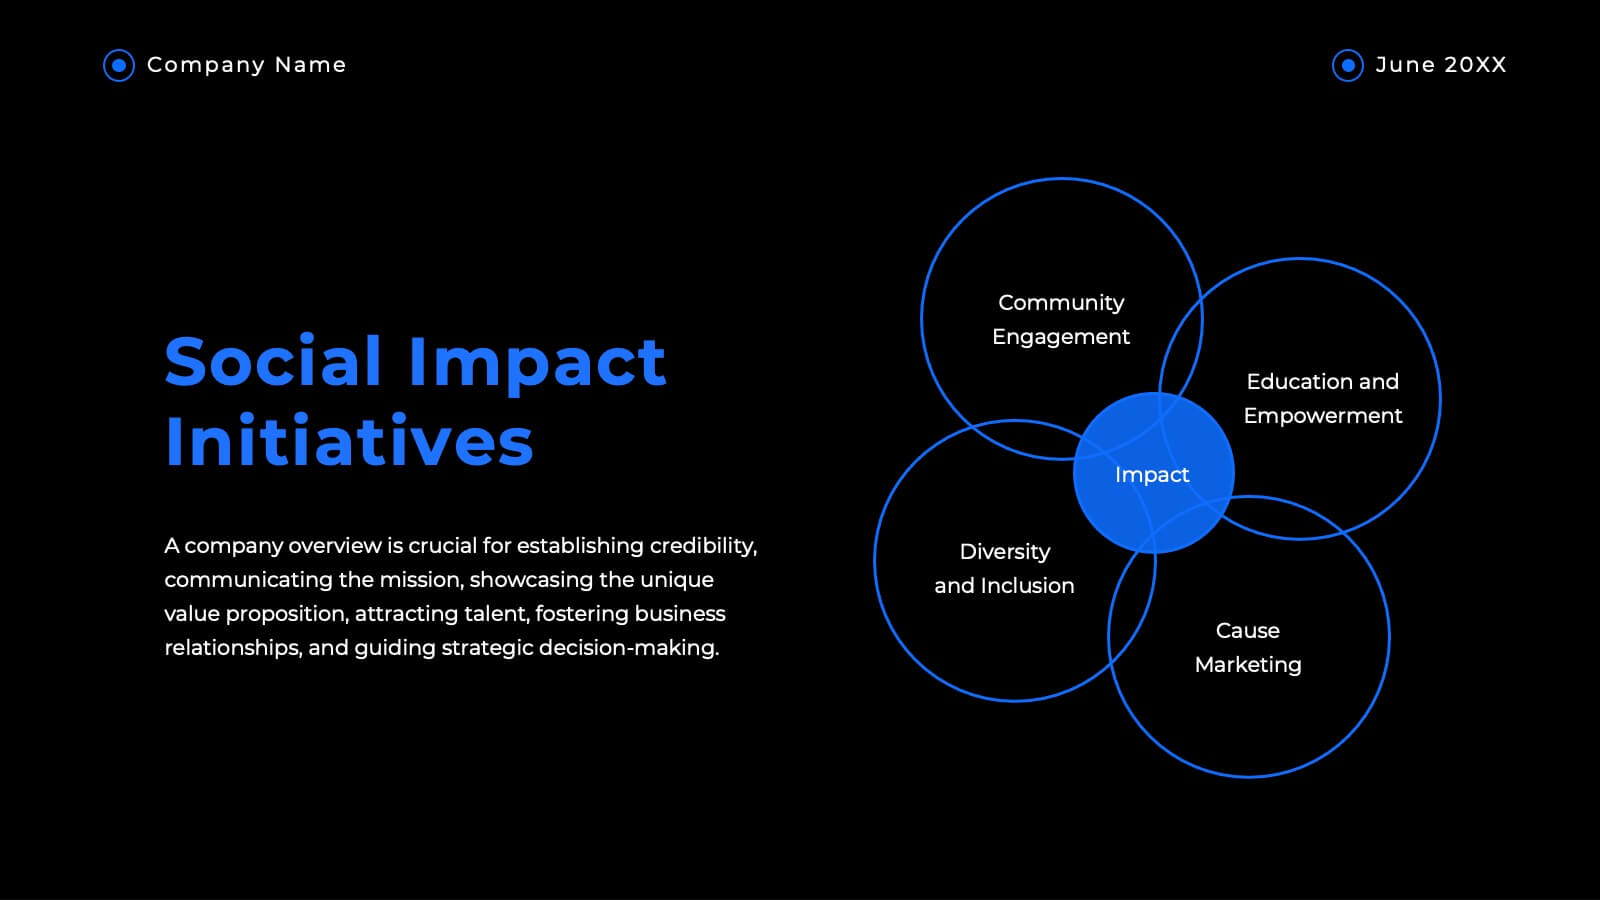
Topic Organization with Bubble Mapping Presentation
Easily structure complex information with the Topic Organization with Bubble Mapping Presentation. This visually engaging layout uses a central idea with grouped supporting elements, making it perfect for brainstorming, mind mapping, or topic clustering. Fully editable in PowerPoint, Keynote, or Google Slides—ideal for educators, strategists, and project teams.


6 slides
Six Sigma DMAIC Method Presentation
Bring clarity and momentum to your improvement plan with this dynamic presentation, designed to visually guide teams through each stage of a structured problem-solving process. It helps you present goals, insights, and actions with confidence while keeping the workflow clear and engaging. Fully compatible with PowerPoint, Keynote, and Google Slides.


26 slides
Roaster Presentation Template
Are you interested in knowing about the best coffee in town? Roaster is a fresh and bold template perfect for marketing. This template will be sure to make your services and products stand out. The background stays in theme with coffee tone colors and many pictures. Overall Roaster can help you make any kind of presentation you need and help you create a professional online presence. This template is a great starting point for creating an impressive sales page. You'll be able to quickly add in your information and customize this template to display a captivating presentation.


5 slides
Editable Data Charts Presentation
Bring your data to life with a clean, engaging layout that makes every insight easy to understand. This presentation helps you explain percentages, comparisons, and key metrics with clarity while keeping your narrative smooth and professional. Designed for clear data storytelling and effortless editing, it's fully compatible with PowerPoint, Keynote, and Google Slides.


20 slides
Aurumix Agency Portfolio Presentation
Make a lasting impression with this bold and creative agency portfolio presentation. Designed to showcase your services, case studies, client success stories, and campaign strategies, this template helps highlight your agency’s expertise with confidence. Fully customizable and compatible with PowerPoint, Keynote, and Google Slides for a seamless, professional presentation experience.


6 slides
Market Research Case Study
Visualize your research findings with this step-by-step arrow-style case study slide. Ideal for outlining research methodology, key findings, and conclusions across six distinct phases. This layout is perfect for marketing reports, academic presentations, or business insights. Fully editable in PowerPoint, Keynote, and Google Slides.


10 slides
HR Management Presentation
The HR Management Presentation template is expertly designed to communicate crucial aspects of human resource management. It features a visually engaging layout that systematically breaks down important HR elements such as recruitment, training, employee engagement, and performance metrics. Each section is clearly labeled and accompanied by intuitive icons that aid in quick comprehension, making it an ideal choice for HR professionals aiming to present complex data in an accessible format. This template enhances audience engagement through its structured presentation of information, focusing on strategic management within HR. It is perfectly suited for showcasing HR strategies, policy updates, or organizational improvements in a clear and effective manner.


5 slides
Buyer Journey Infographic Presentation
Understanding how buyers move from awareness to action becomes effortless with this clean, visual presentation. It guides you through each stage, helping you explain behaviors, insights, and touchpoints with clarity. Easy to customize and fully compatible with PowerPoint, Keynote, and Google Slides.
22 slides
Haven Advertising Agency Proposal Presentation
Wow your clients with this sophisticated agency presentation template! Perfect for showcasing your services, client success stories, and market analysis. Ideal for agencies looking to impress and secure new business. Compatible with PowerPoint, Keynote, and Google Slides, this template ensures your proposals stand out with professional elegance. Perfect for any pitch or proposal.


8 slides
Lean Business Model Canvas Framework Presentation
Visualize your entire business strategy on a single slide with this Lean Business Model Canvas. Ideal for startups or strategic planning, each editable block represents a key area: value propositions, customer segments, revenue, and more. Streamlined and clear, it's perfect for team alignment or investor-ready business model pitches.