


Features
- 4 Unique slides
- Fully editable and easy to edit in Microsoft Powerpoint, Keynote and Google Slides
- 16:9 widescreen layout
- Clean and professional designs
- Export to JPG, PDF or send by email


Do you have any questions?
Recommend


6 slides
Identifying Market Challenges Presentation
Stay ahead of the competition by breaking down market challenges with this dynamic presentation template! Designed for business strategists, marketers, and analysts, this layout helps you visually structure key obstacles and opportunities. Perfect for market research and competitive analysis. Fully customizable and compatible with PowerPoint, Keynote, and Google Slides.


5 slides
History of Photography Infographics
The History of Photography traces back to the early 19th century when the concept of capturing and preserving images through a camera was first realized. These infographic templates provide a visually stunning format to showcase the key milestones, influential photographers, and technological advancements that shaped the history of photography. The template consists of vertical infographics, making it easy to present information in a visually appealing and organized manner. It is compatible with Powerpoint, Keynote, and Google Slides, ensuring seamless customization and adaptability to your specific needs.


12 slides
Leadership Development and Growth
Highlight leadership skills with this dynamic radar chart template, ideal for tracking individual or team competencies across six core areas. Use this layout to visualize progress in communication, strategy, vision, influence, adaptability, and accountability. Great for HR reviews, training evaluations, or performance dashboards. Fully editable in PowerPoint, Keynote, and Google Slides.


5 slides
RAPID Decision-Making Roles Overview Presentation
Clarify accountability and streamline decisions with the RAPID Decision-Making Roles Overview Presentation. This visual layout breaks down the five essential roles—Recommend, Agree, Perform, Input, and Decide—into a clear quadrant diagram. Ideal for project teams, leadership alignment, or decision-making workshops. Fully editable in PowerPoint, Google Slides, Keynote, and Canva.


7 slides
Agile Methodology Process Infographic
Introducing our agile methodology infographic template, designed to help you visualize and communicate the principles and processes of Agile project management. Agile is about flexibility, collaboration, and achieving efficient results. This template makes it easy to convey these concepts in a clear and engaging manner. This infographic is fully customizable and compatible with Powerpoint, Keynote, and Google Slides. This is clearly structured and sectioned to represent key aspects of Agile, from sprints to retrospectives. Utilize pie charts, timelines, and process flows to demonstrate Agile workflows and iterations.


7 slides
Team Leadership and Management Presentation
Unlock the secrets of effective team leadership and management with our detailed presentation template. Designed for training sessions and workshops, it provides clear guidance on key leadership principles and team management tactics through engaging graphics and strategic layouts. Ideal for enhancing team dynamics and leadership skills.


5 slides
Cognitive Behavioral Therapy Overview Presentation
Help your audience connect the dots between thoughts, feelings, and behaviors with this clean, illustrated layout. Designed to simplify complex mental health concepts, this CBT infographic template is perfect for educators, coaches, or therapists. Fully editable and compatible with PowerPoint, Keynote, and Google Slides for effortless customization.
4 slides
Team Performance and Progress Tracker Presentation
Track momentum, highlight achievements, and visualize team success with this clean performance tracker layout. Featuring gauge meters and progress bars, this slide makes it easy to present productivity metrics, goal progress, or task completion at a glance. Fully editable and compatible with PowerPoint, Keynote, and Google Slides.


4 slides
Layered Strategy Circles Presentation
Bring your strategy to life with a sleek circular layout that visually connects goals, actions, and outcomes in a unified flow. Perfect for showcasing layered processes or business frameworks, this design keeps complex ideas simple. Fully editable and compatible with PowerPoint, Keynote, and Google Slides for smooth customization.


4 slides
E-Learning Module Structure Presentation
Turn your lesson flow into a visual journey your audience can actually follow. This presentation template maps out the structure of an e-learning module with step-by-step clarity—ideal for course creators, instructional designers, or trainers. Easily customize each stage. Fully editable in PowerPoint, Keynote, and Google Slides for flexible use.


21 slides
Journey Annual Report Presentation
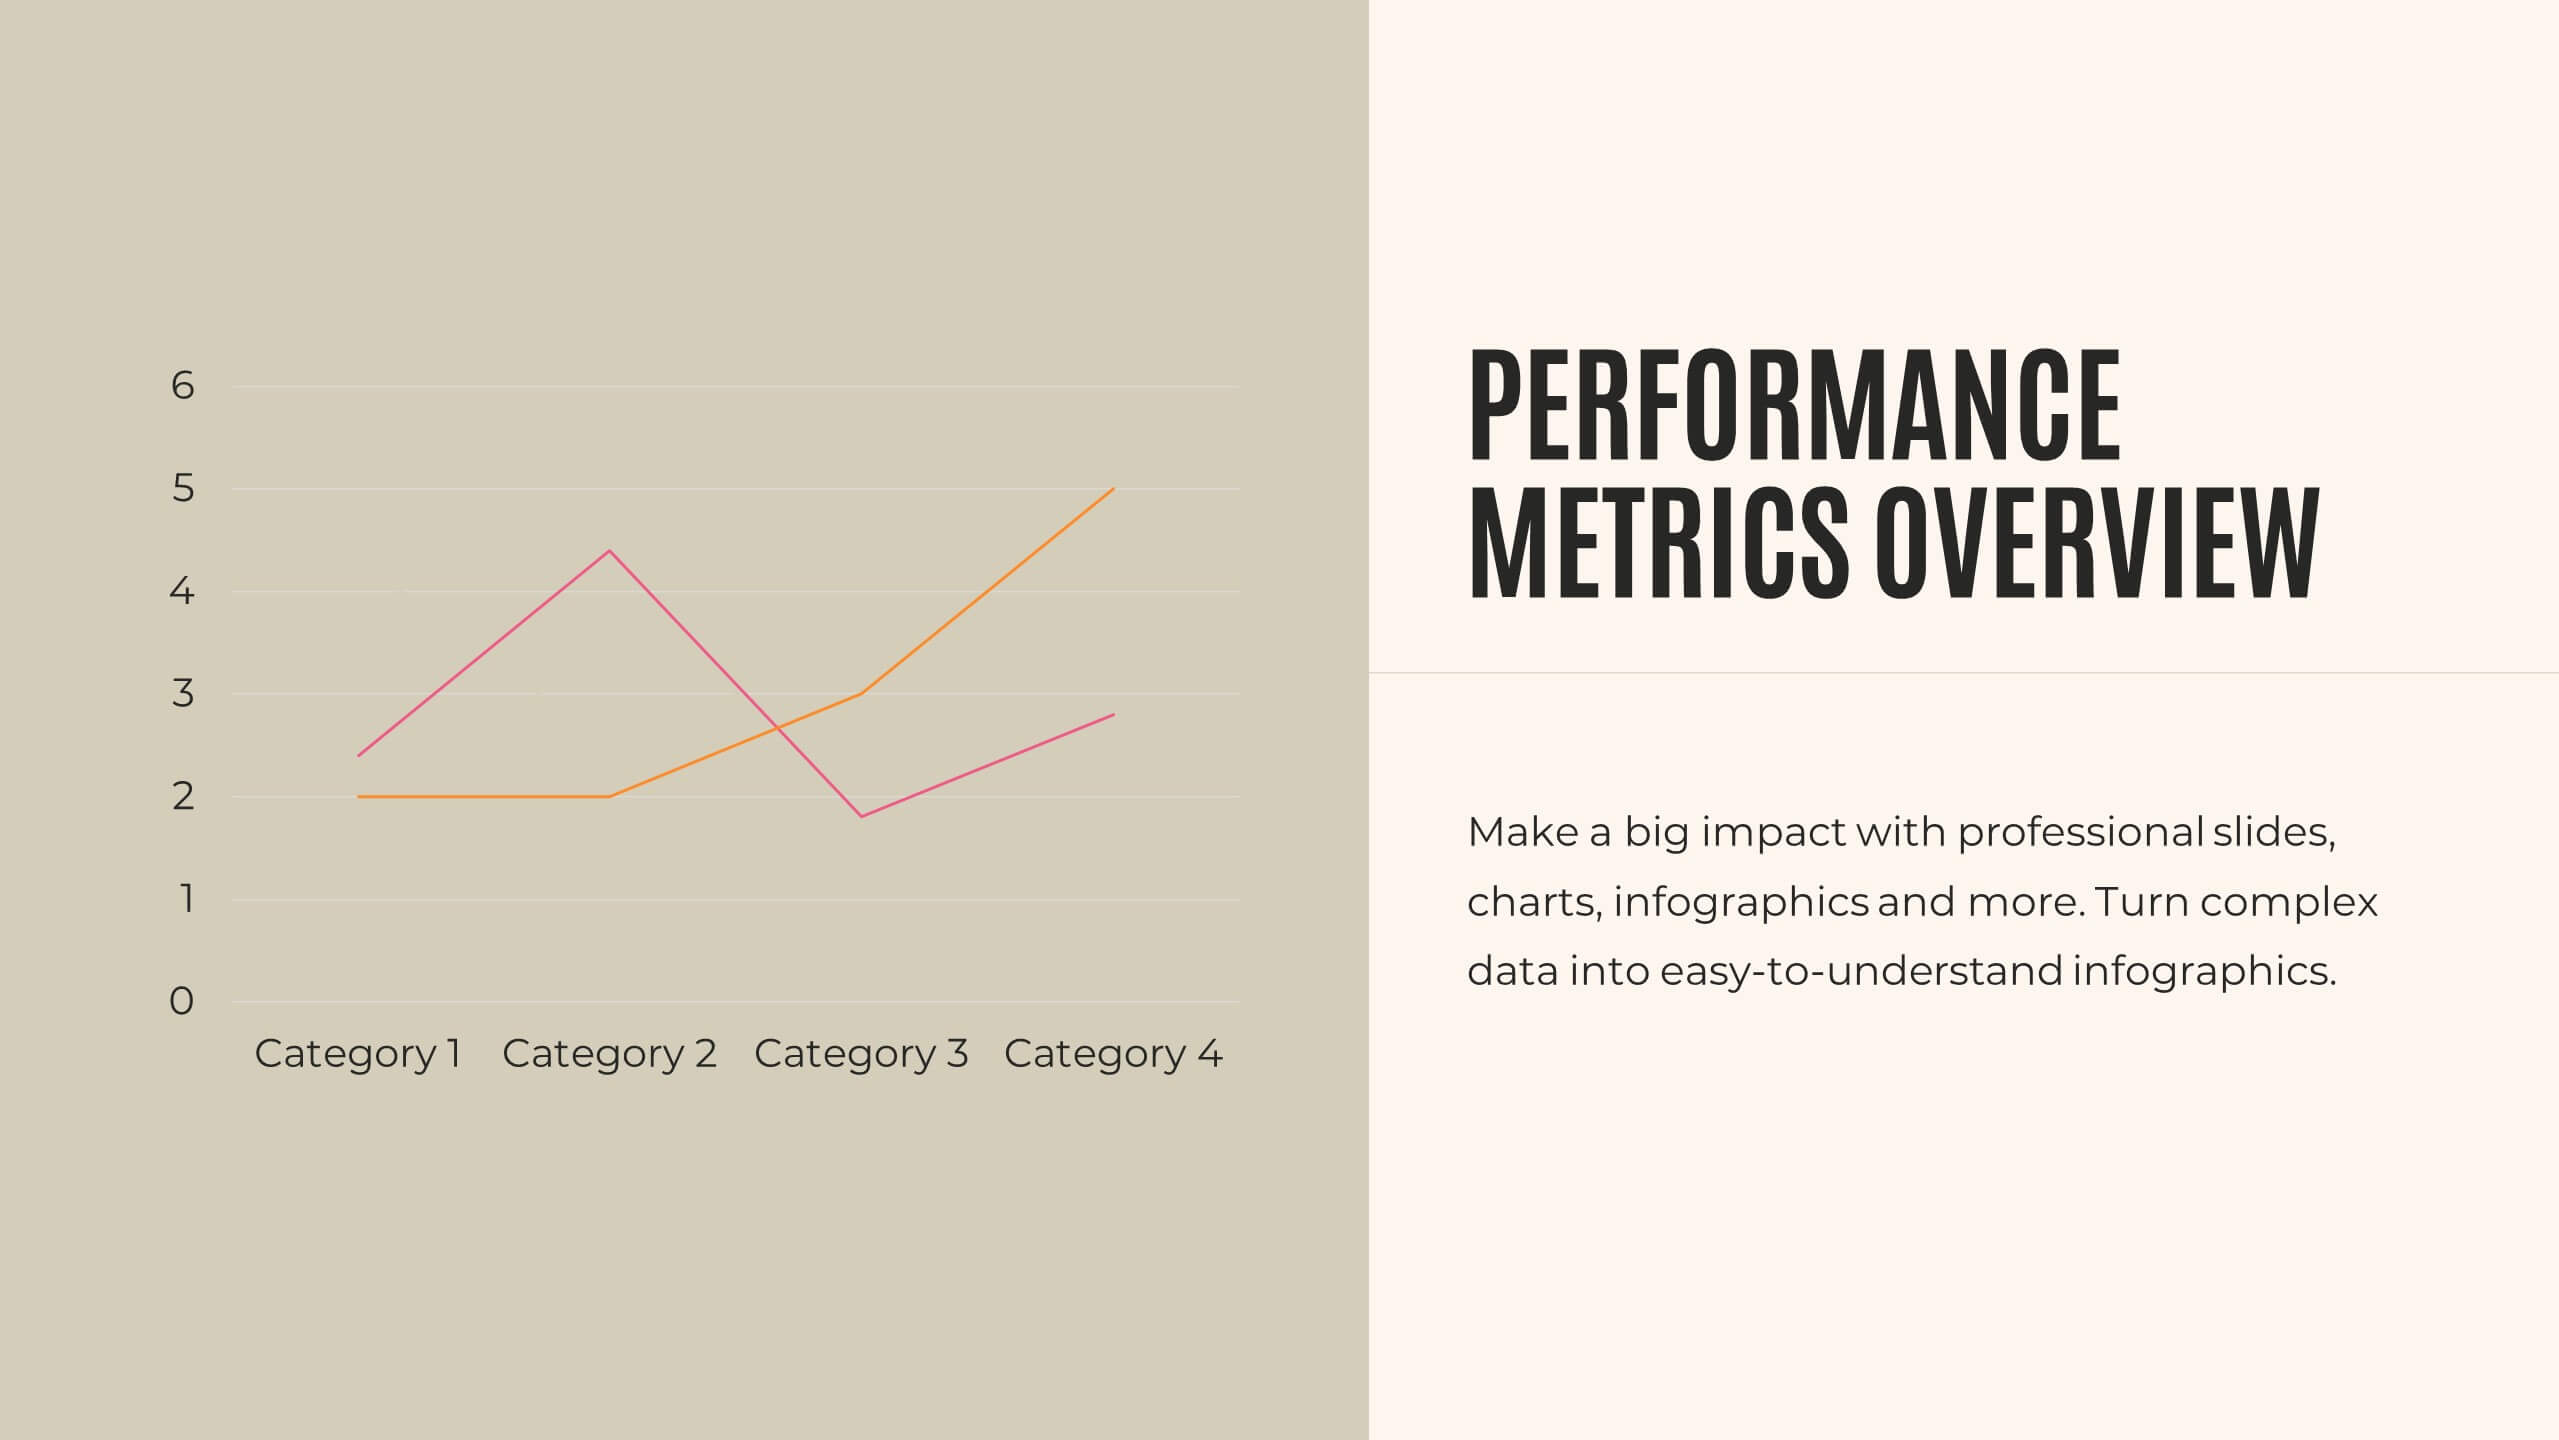
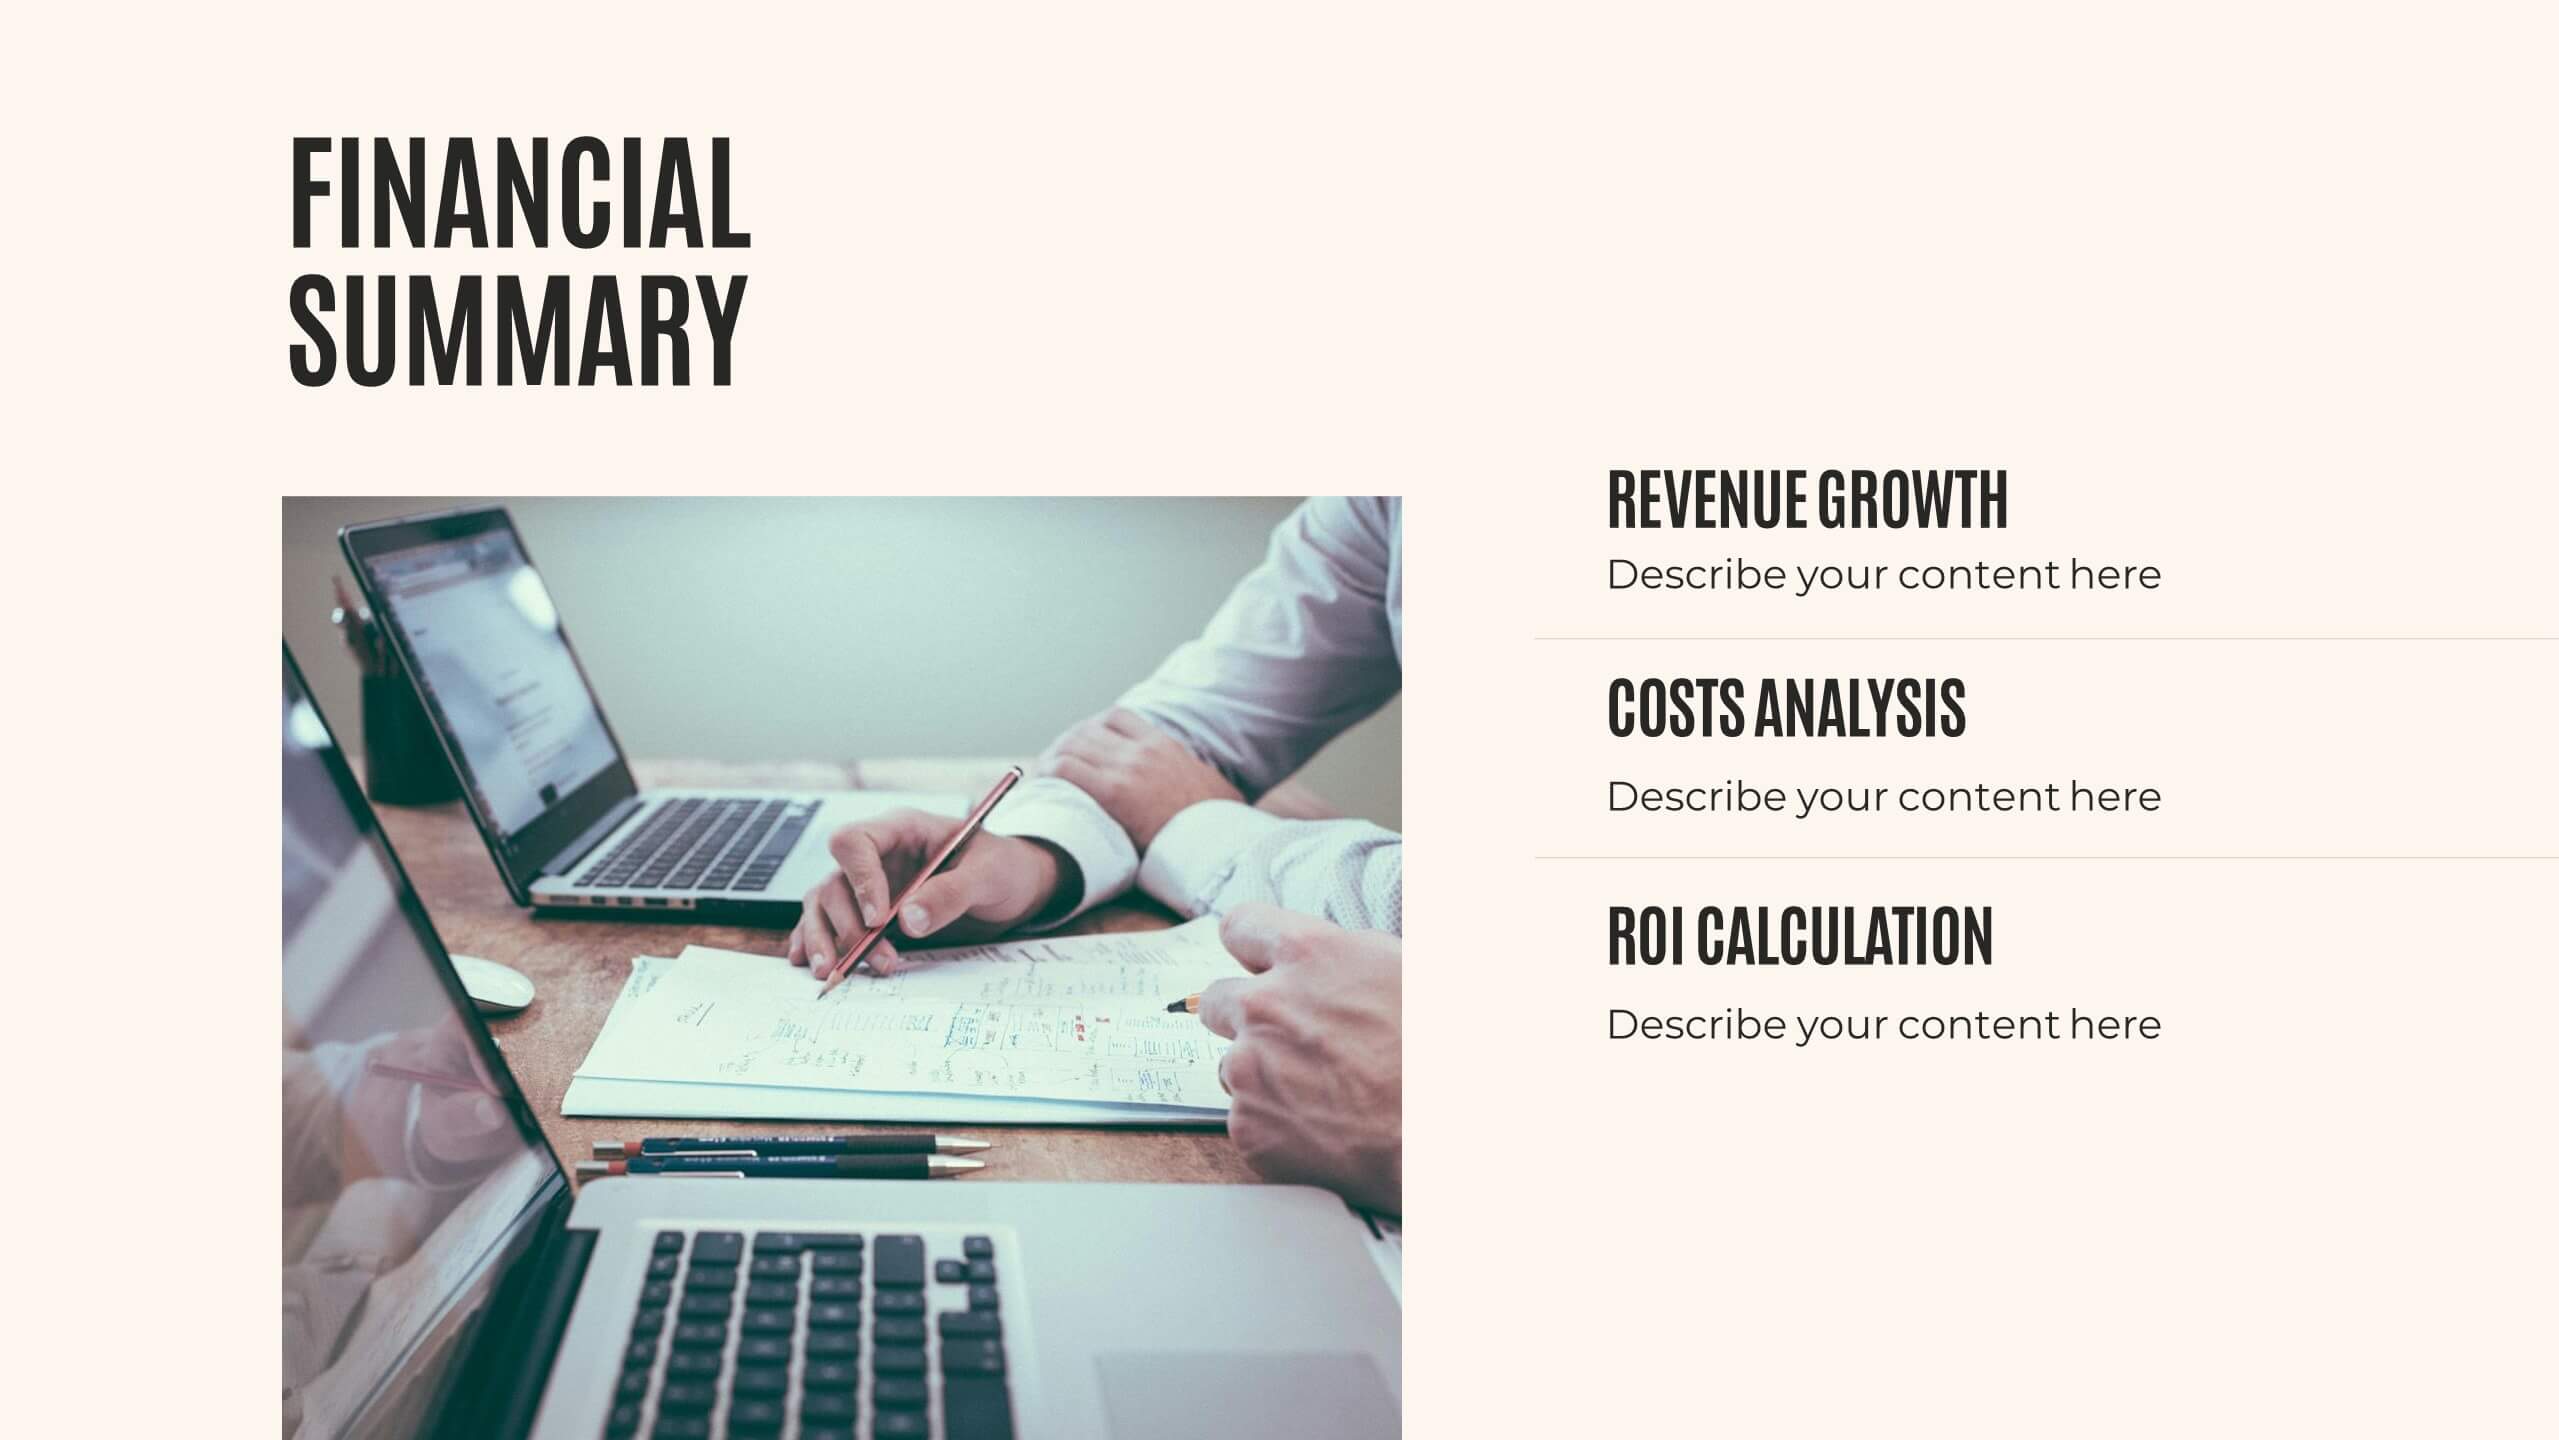
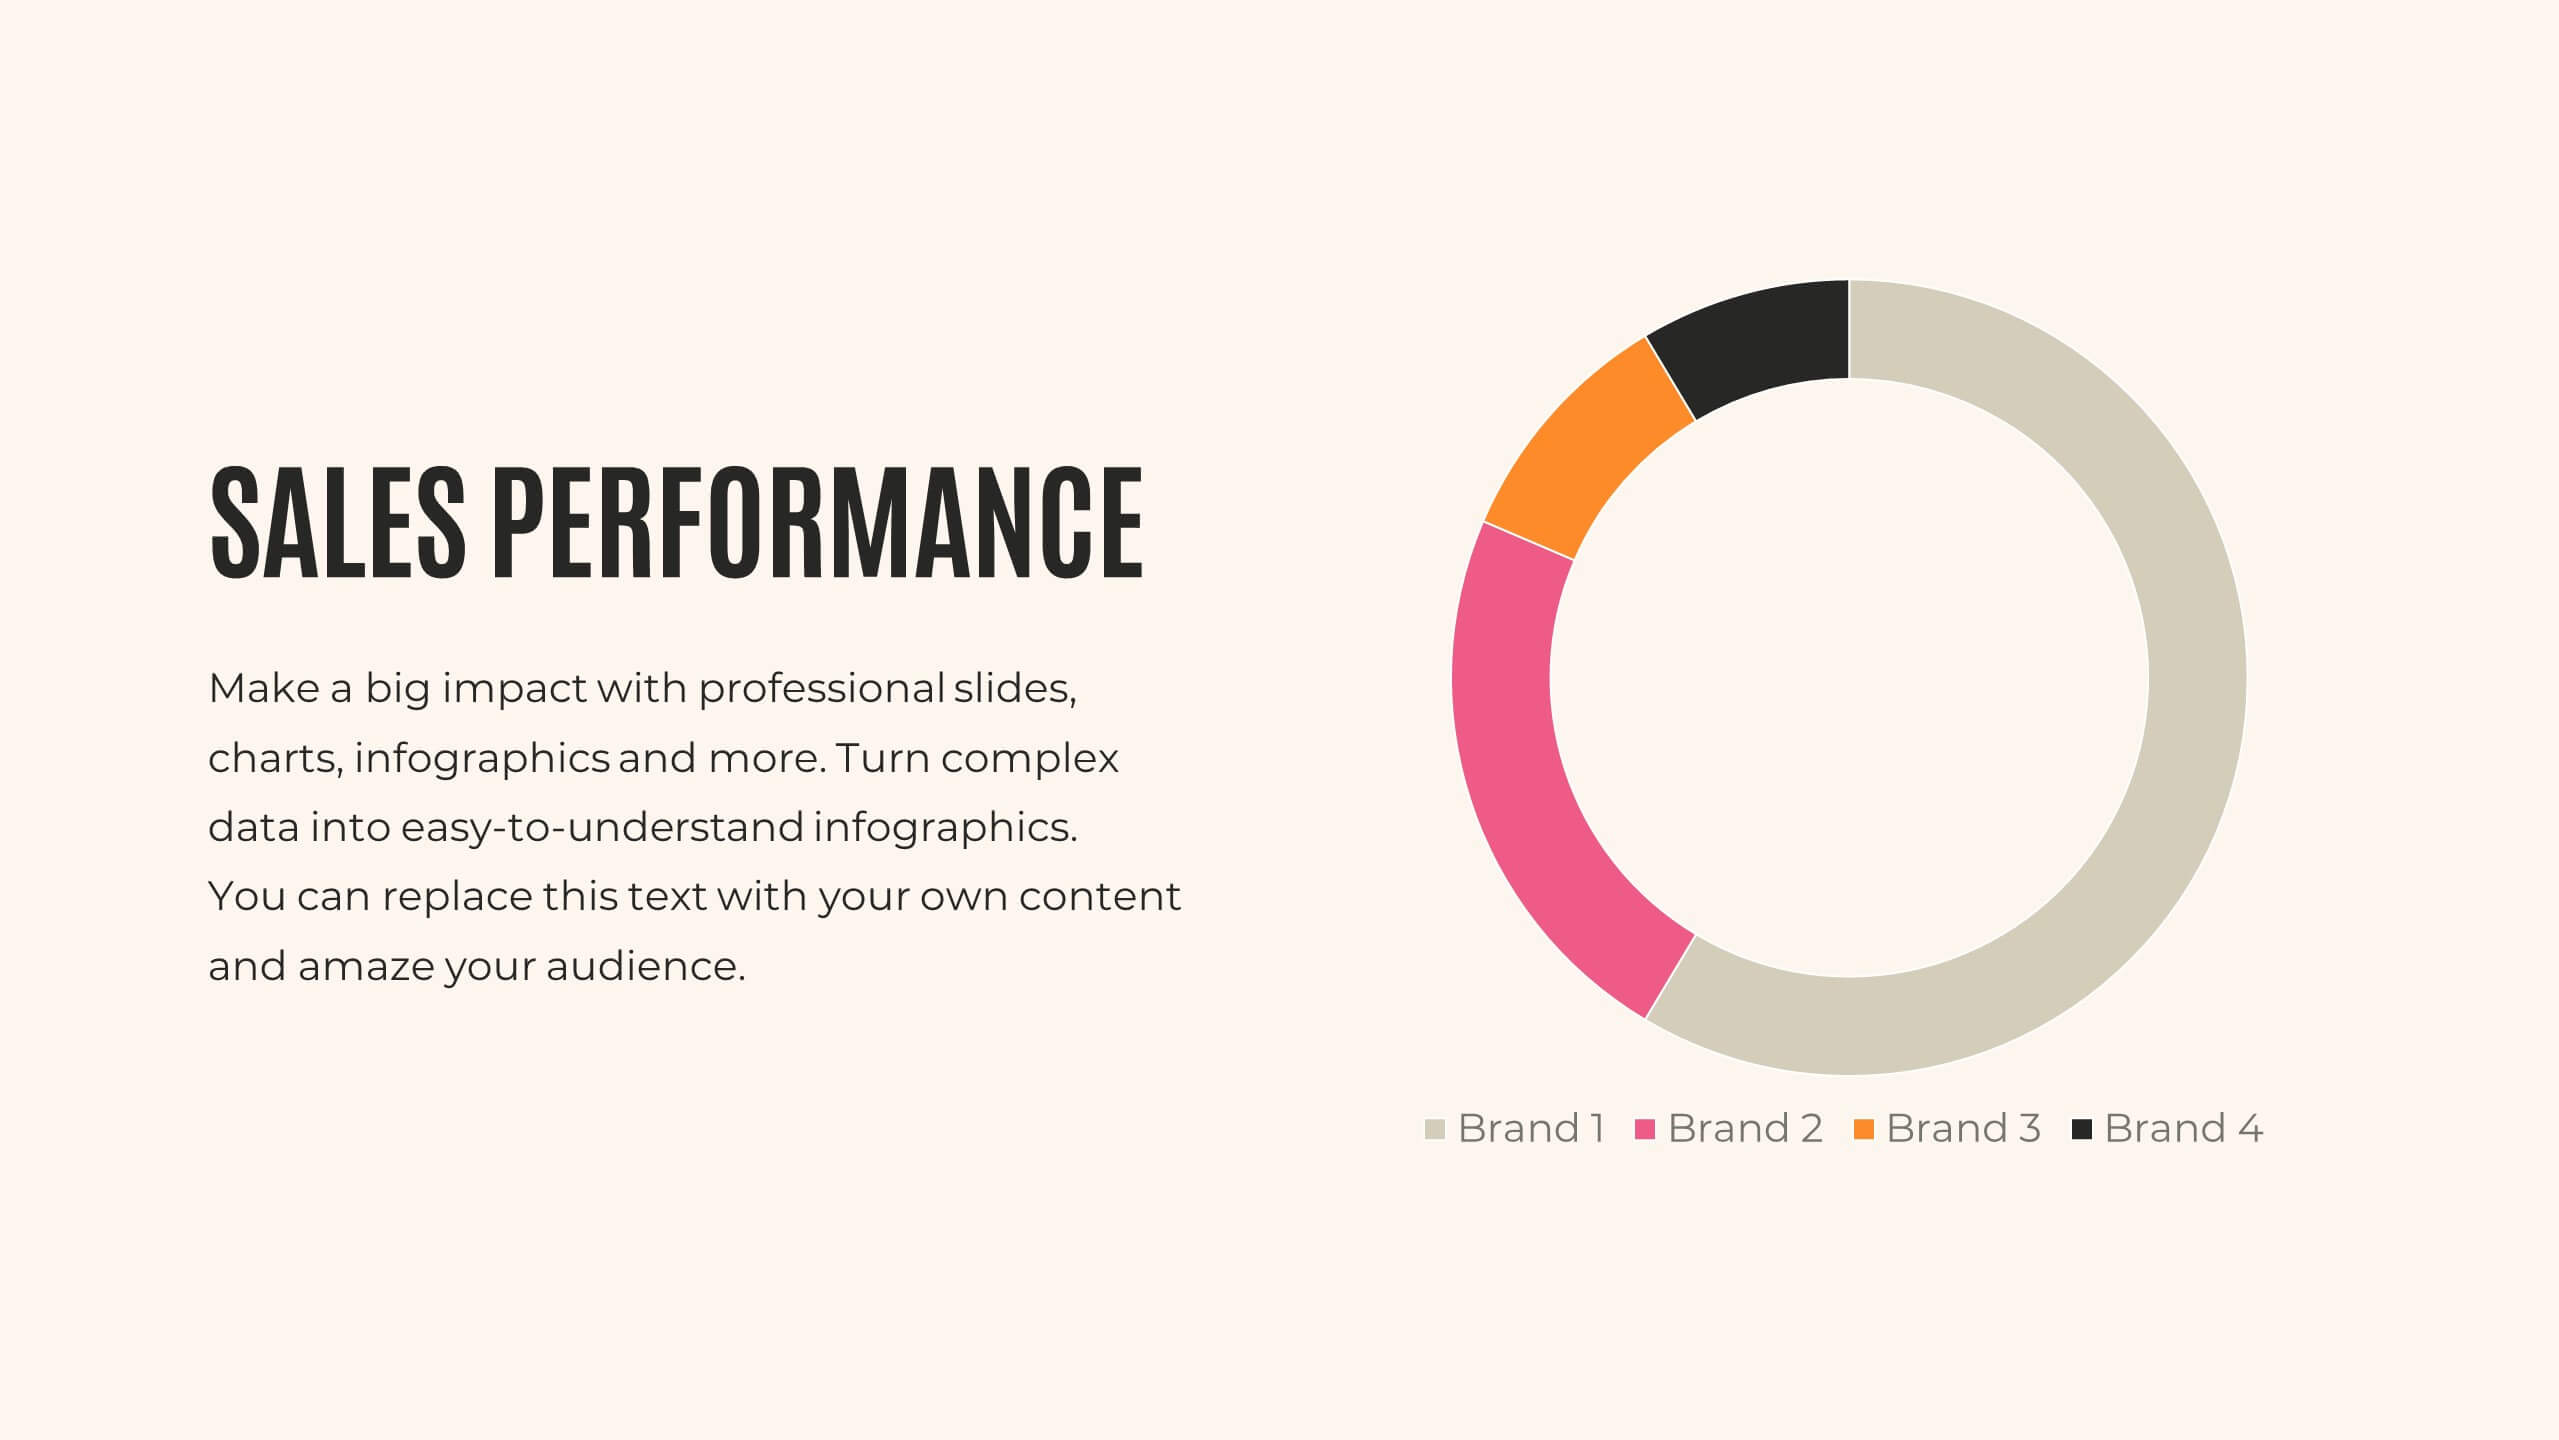
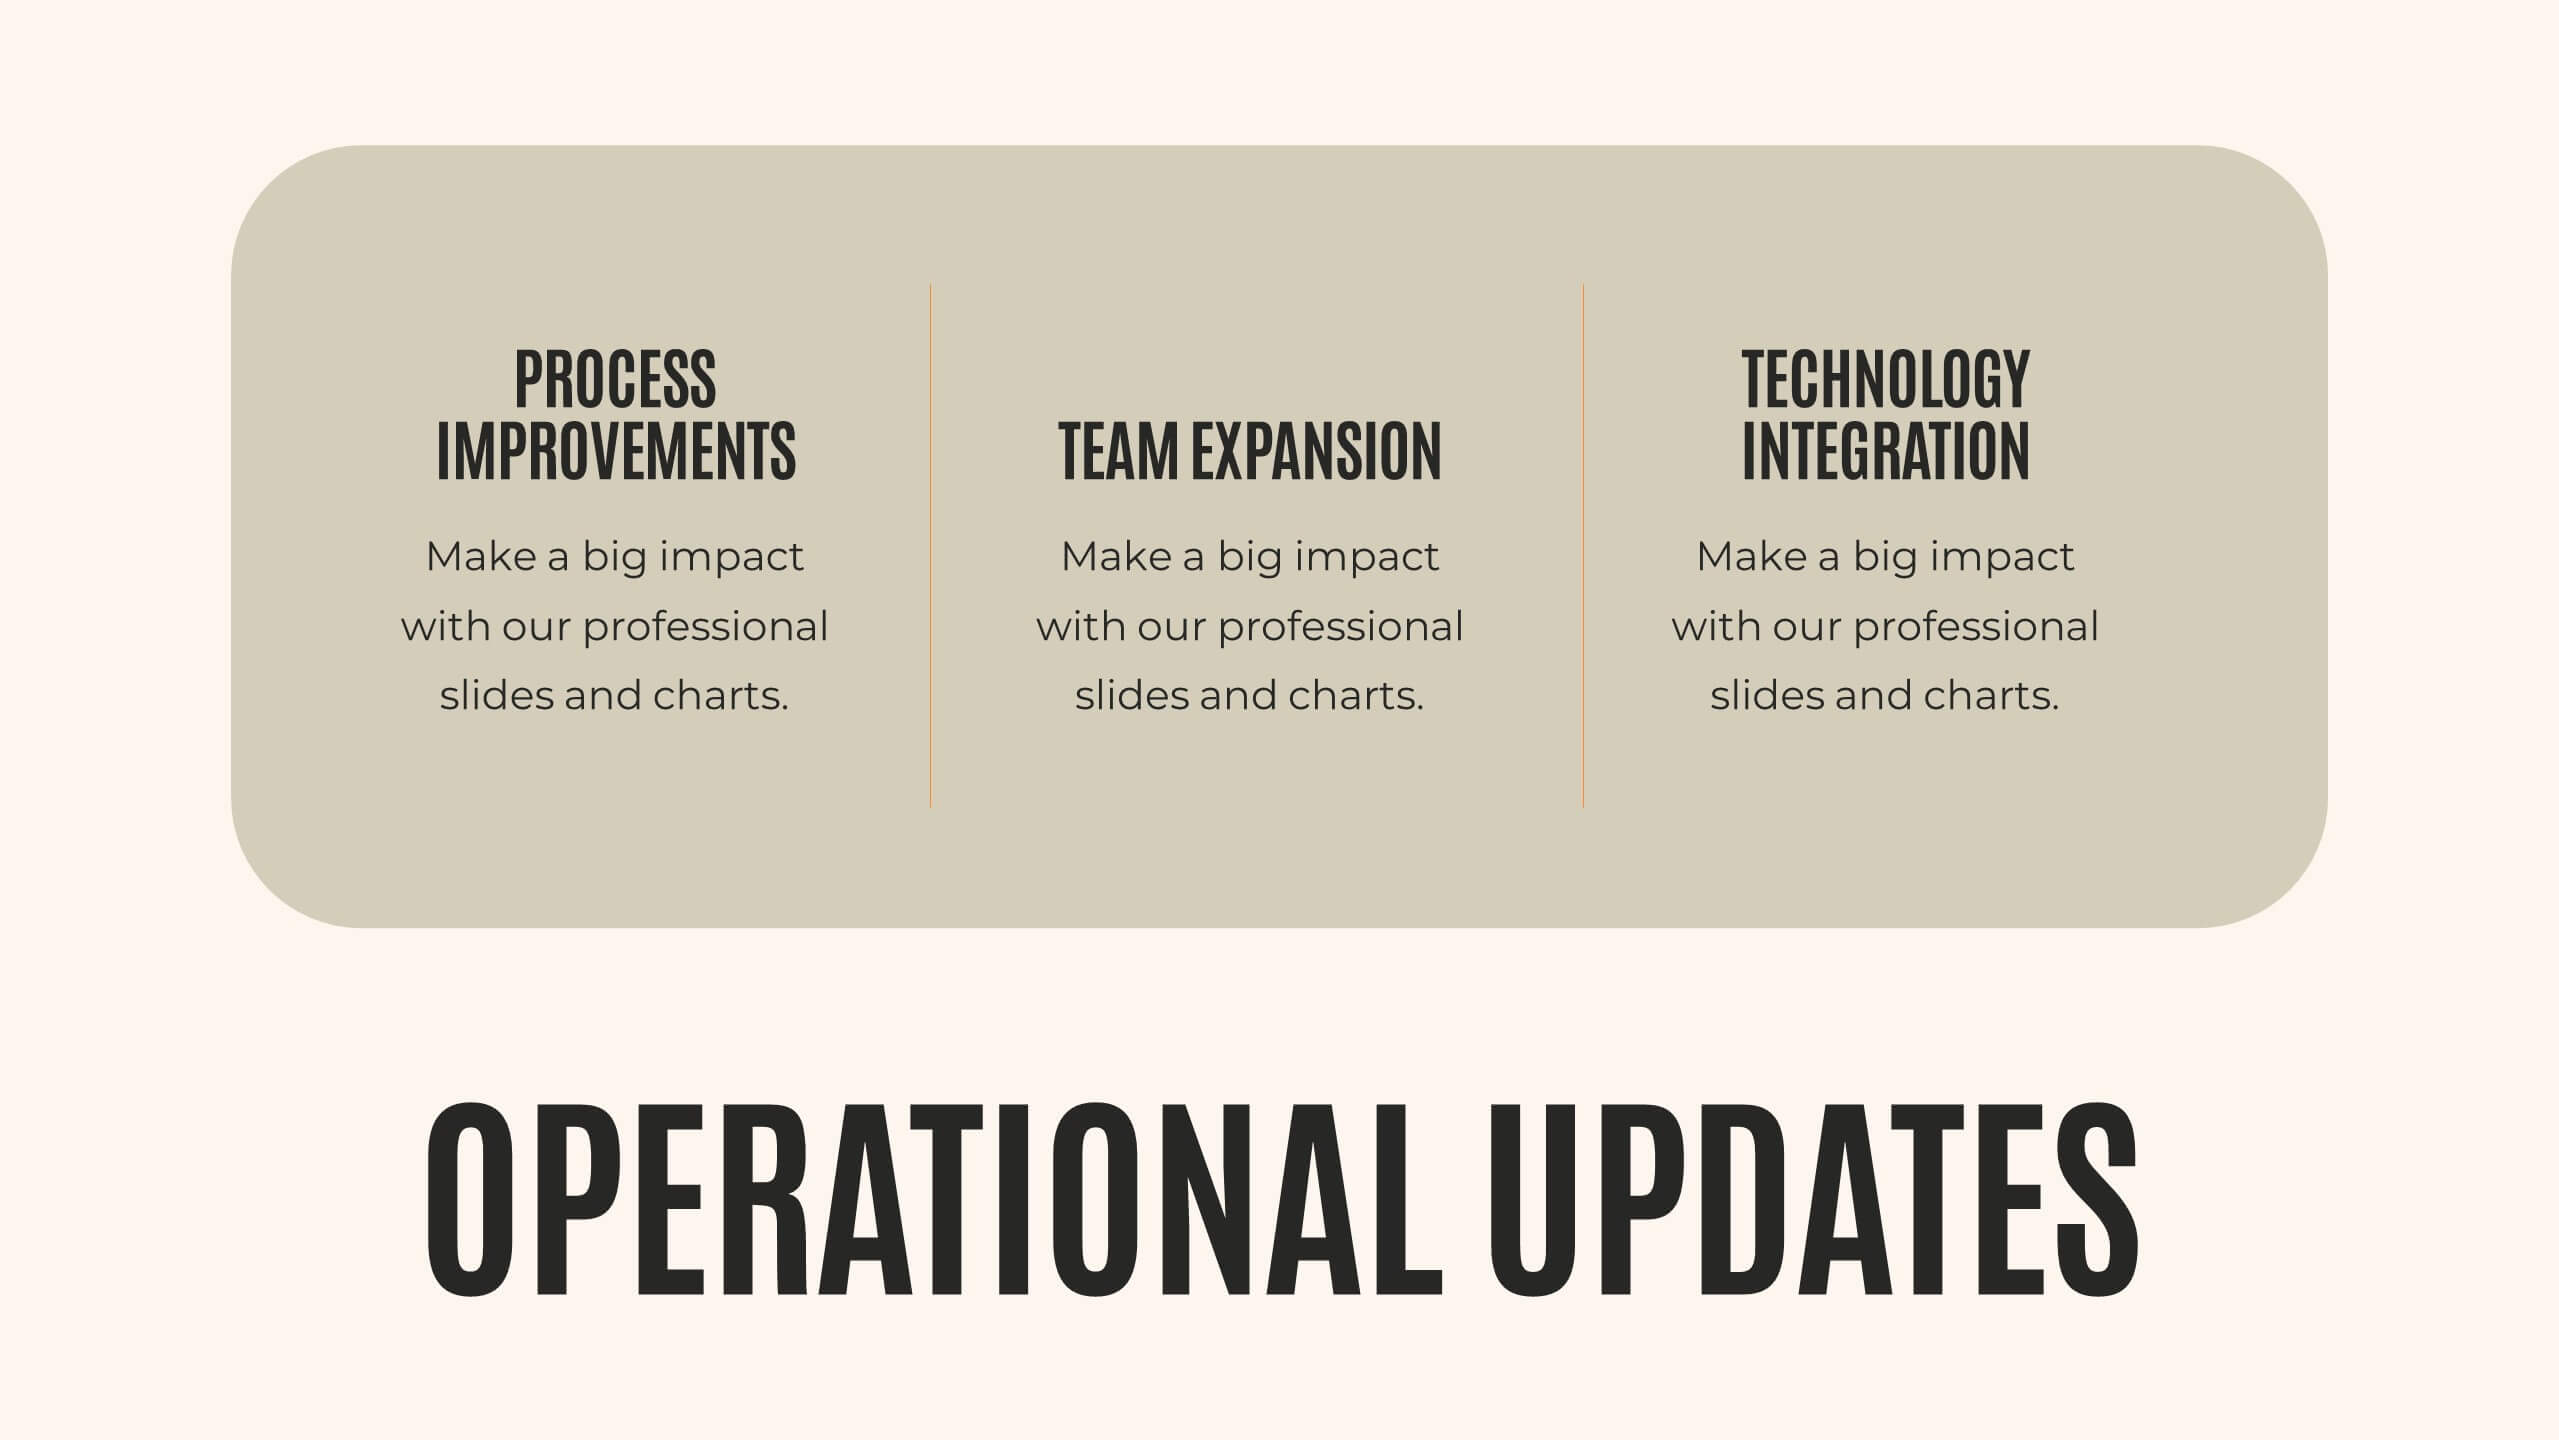
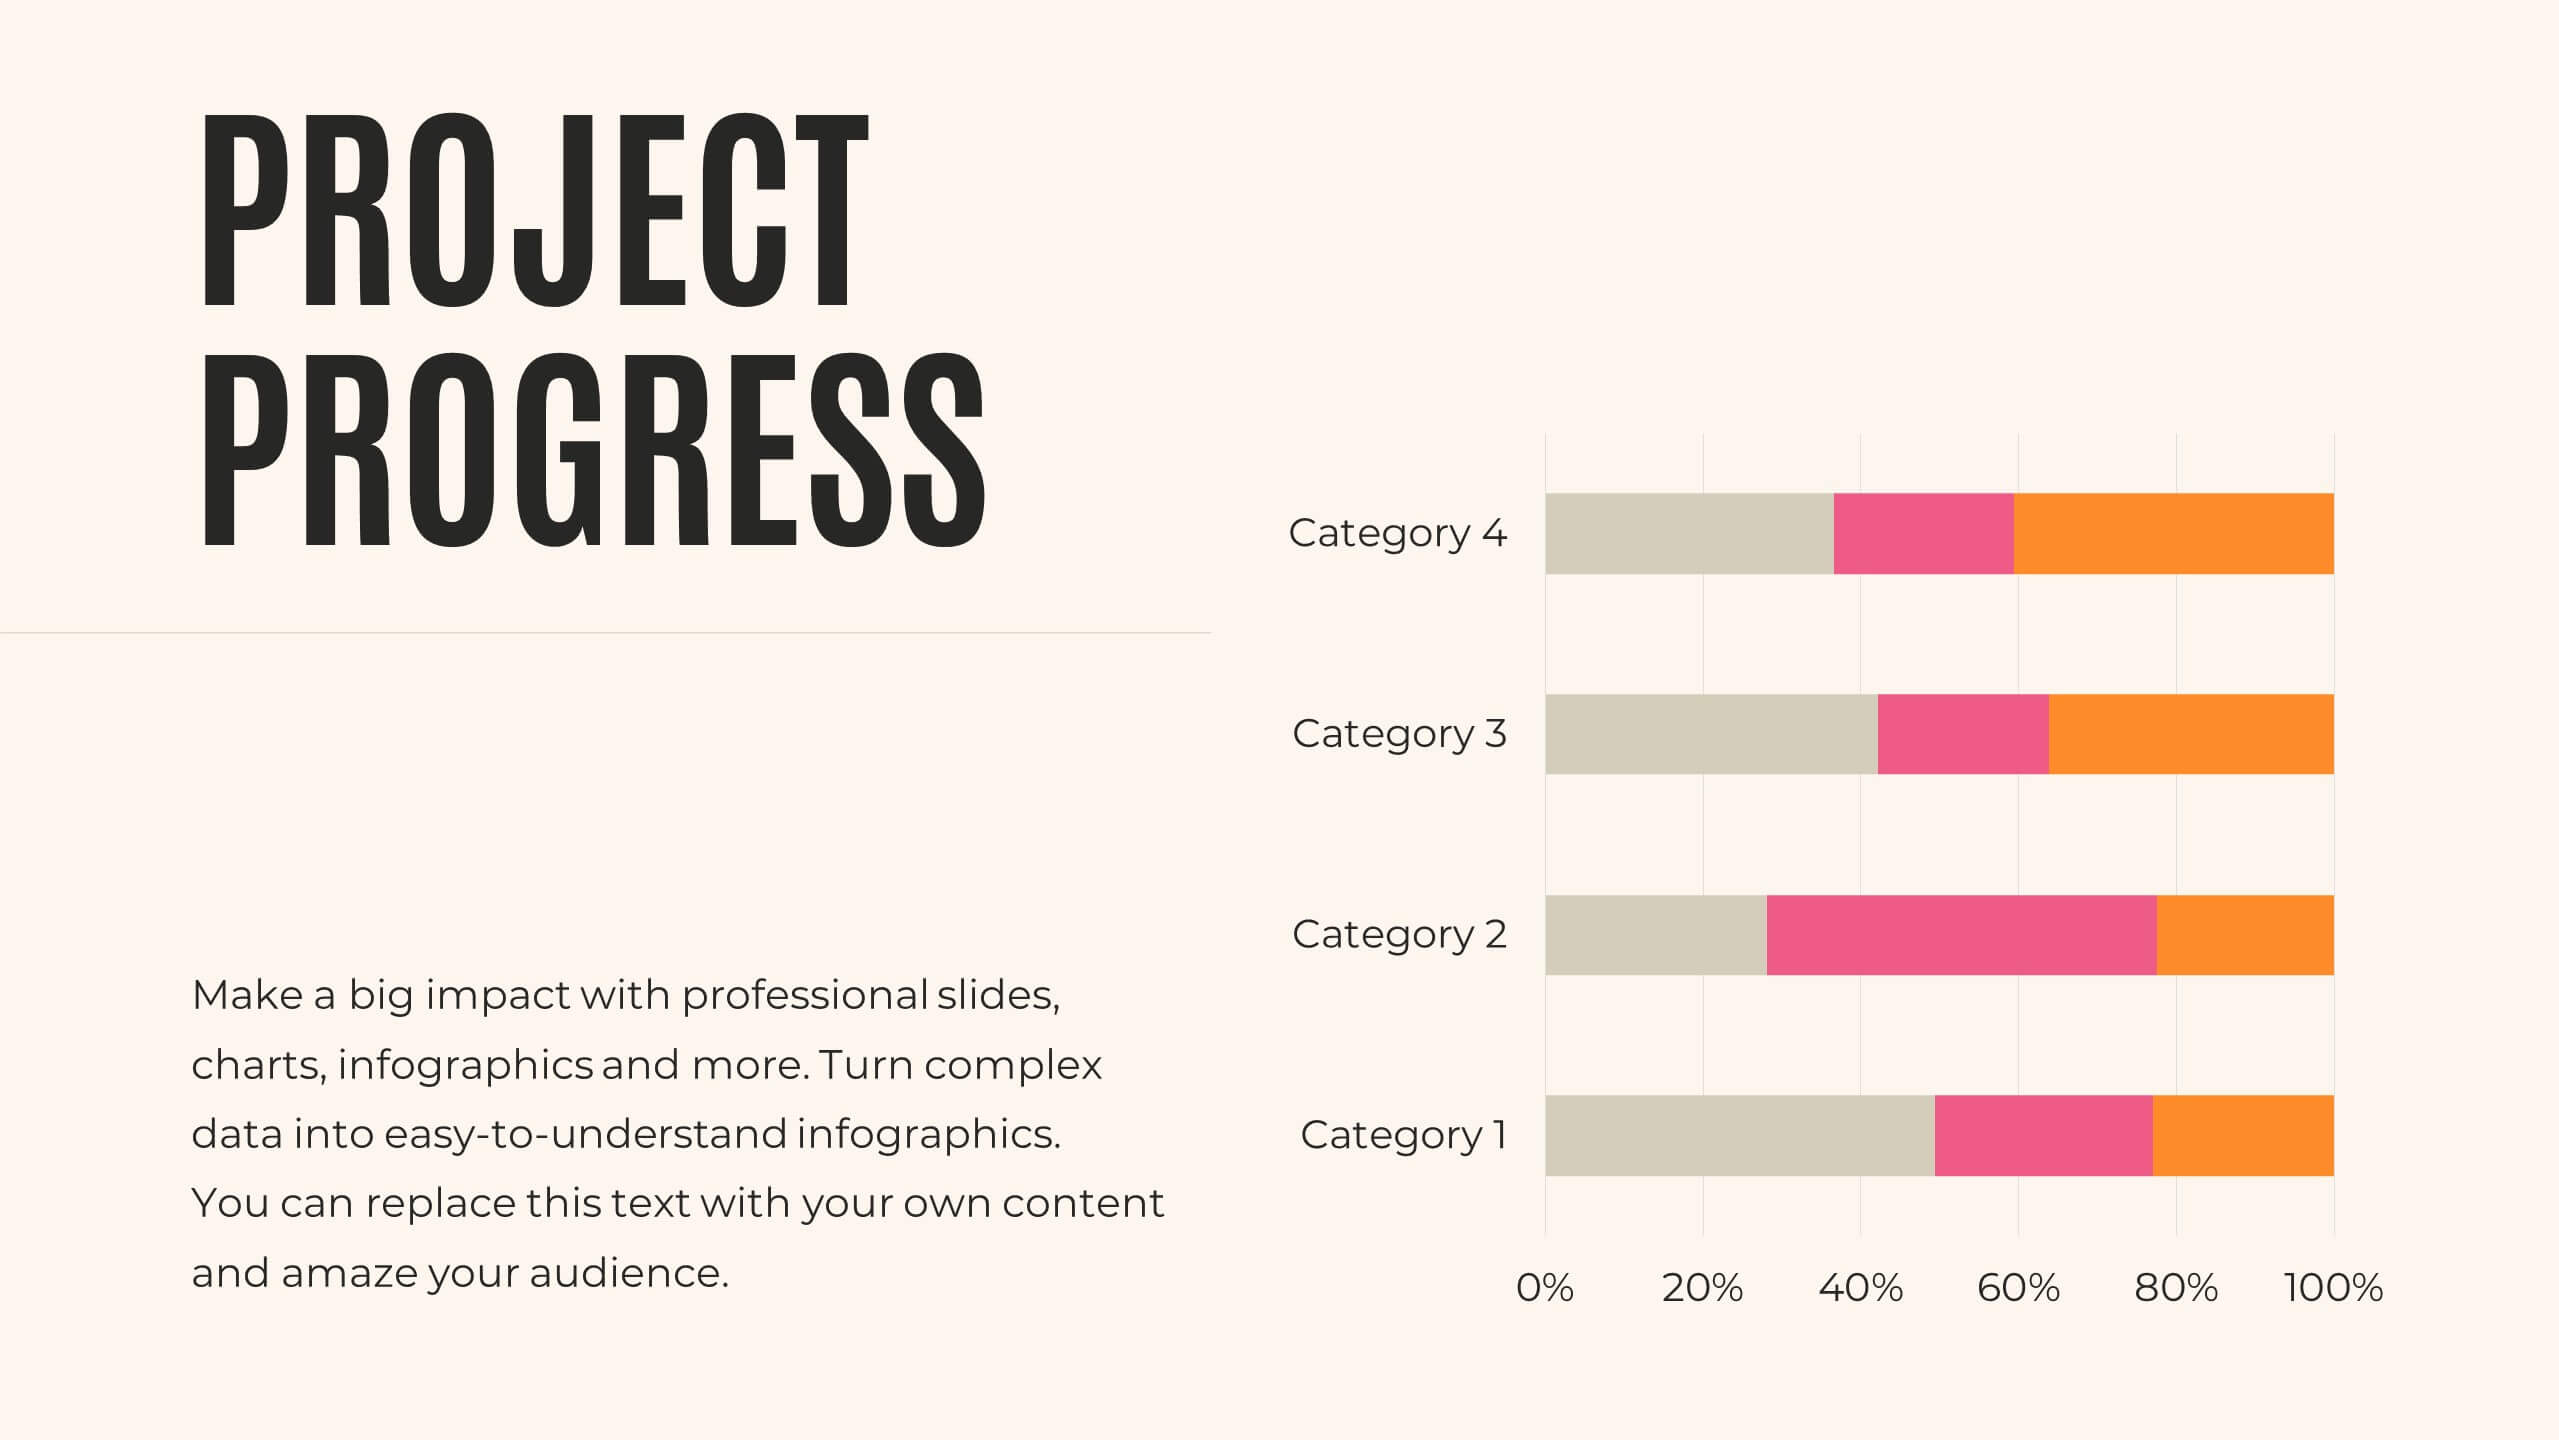
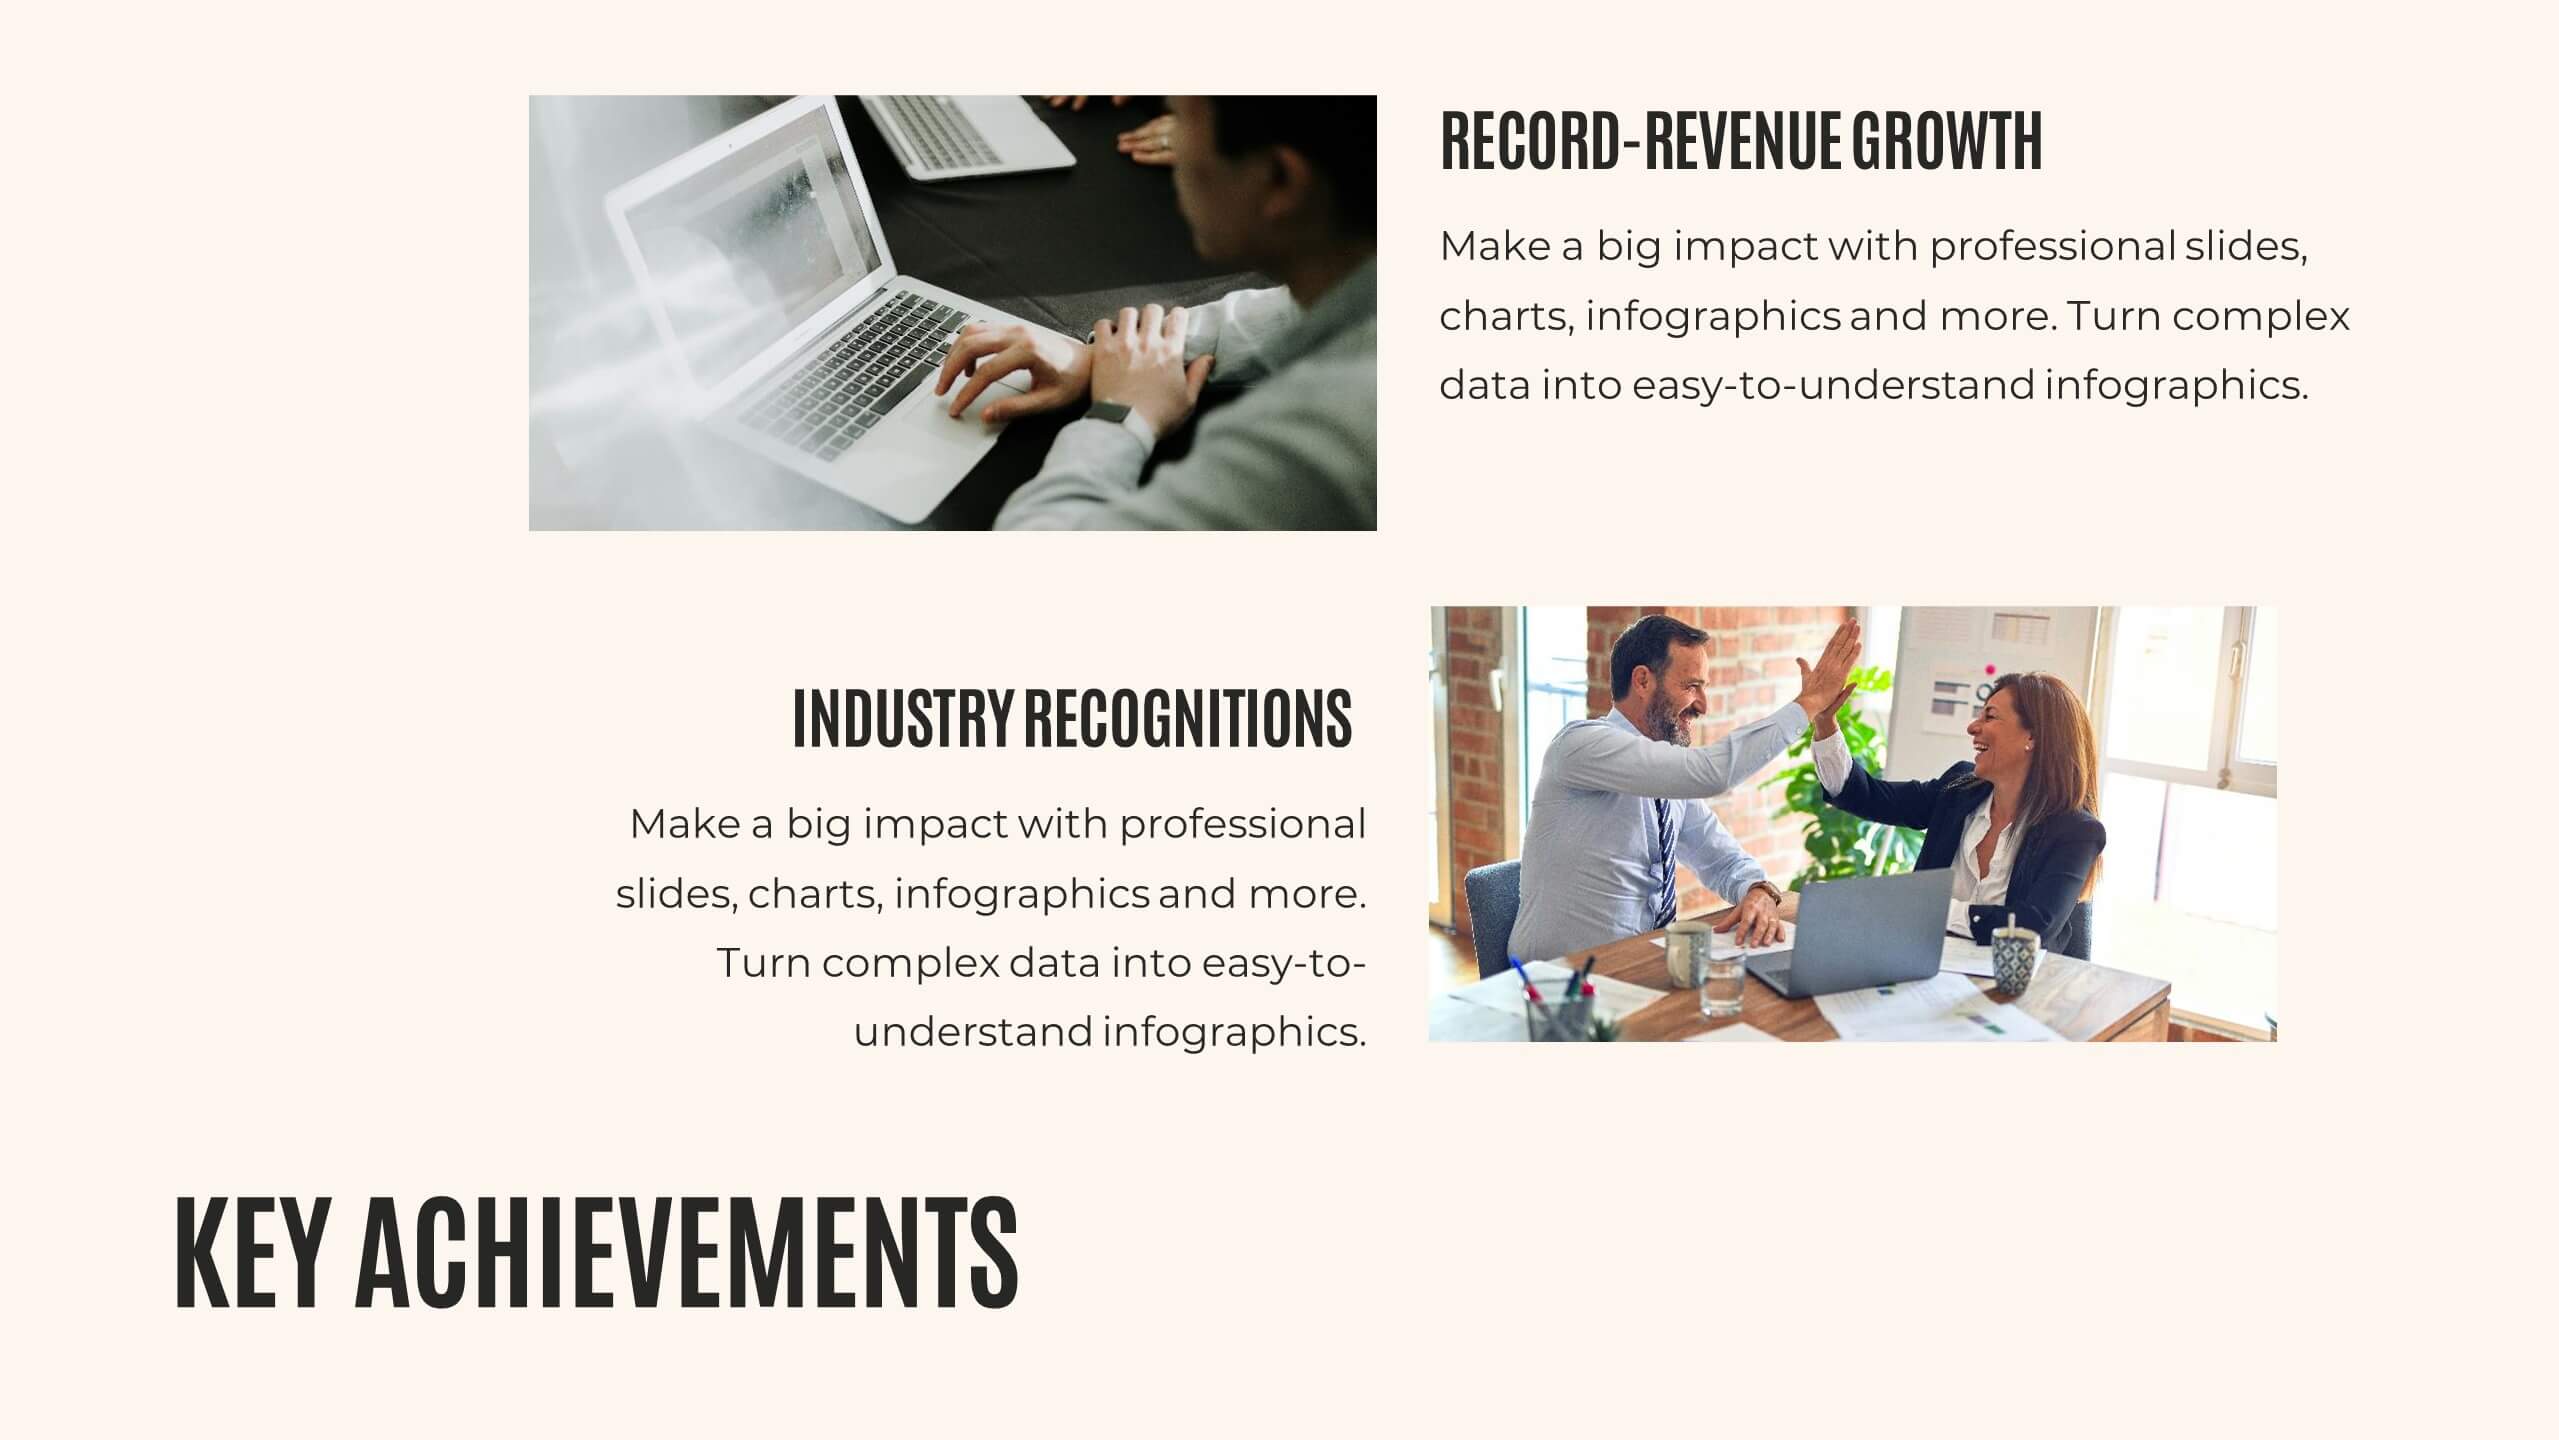
Present your annual report with clarity and impact! This template covers agenda, key highlights, financial summary, sales performance, and project progress. Ideal for detailing achievements, insights, and future priorities. Compatible with PowerPoint, Keynote, and Google Slides, it ensures your data is visually compelling and easy to understand. Showcase your success effortlessly!


20 slides
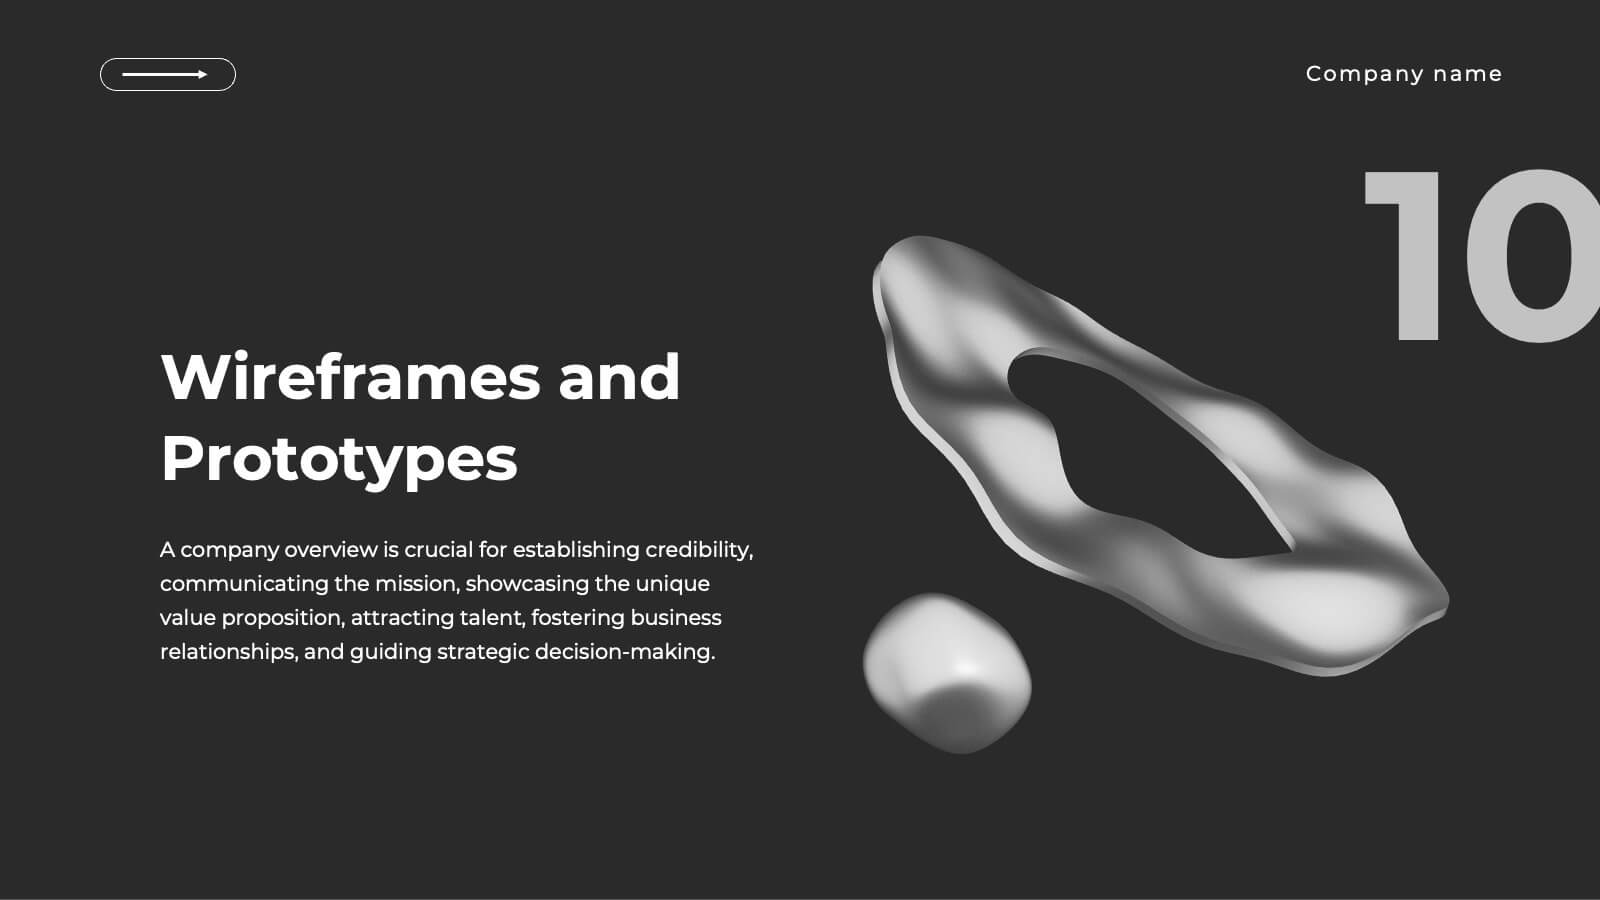
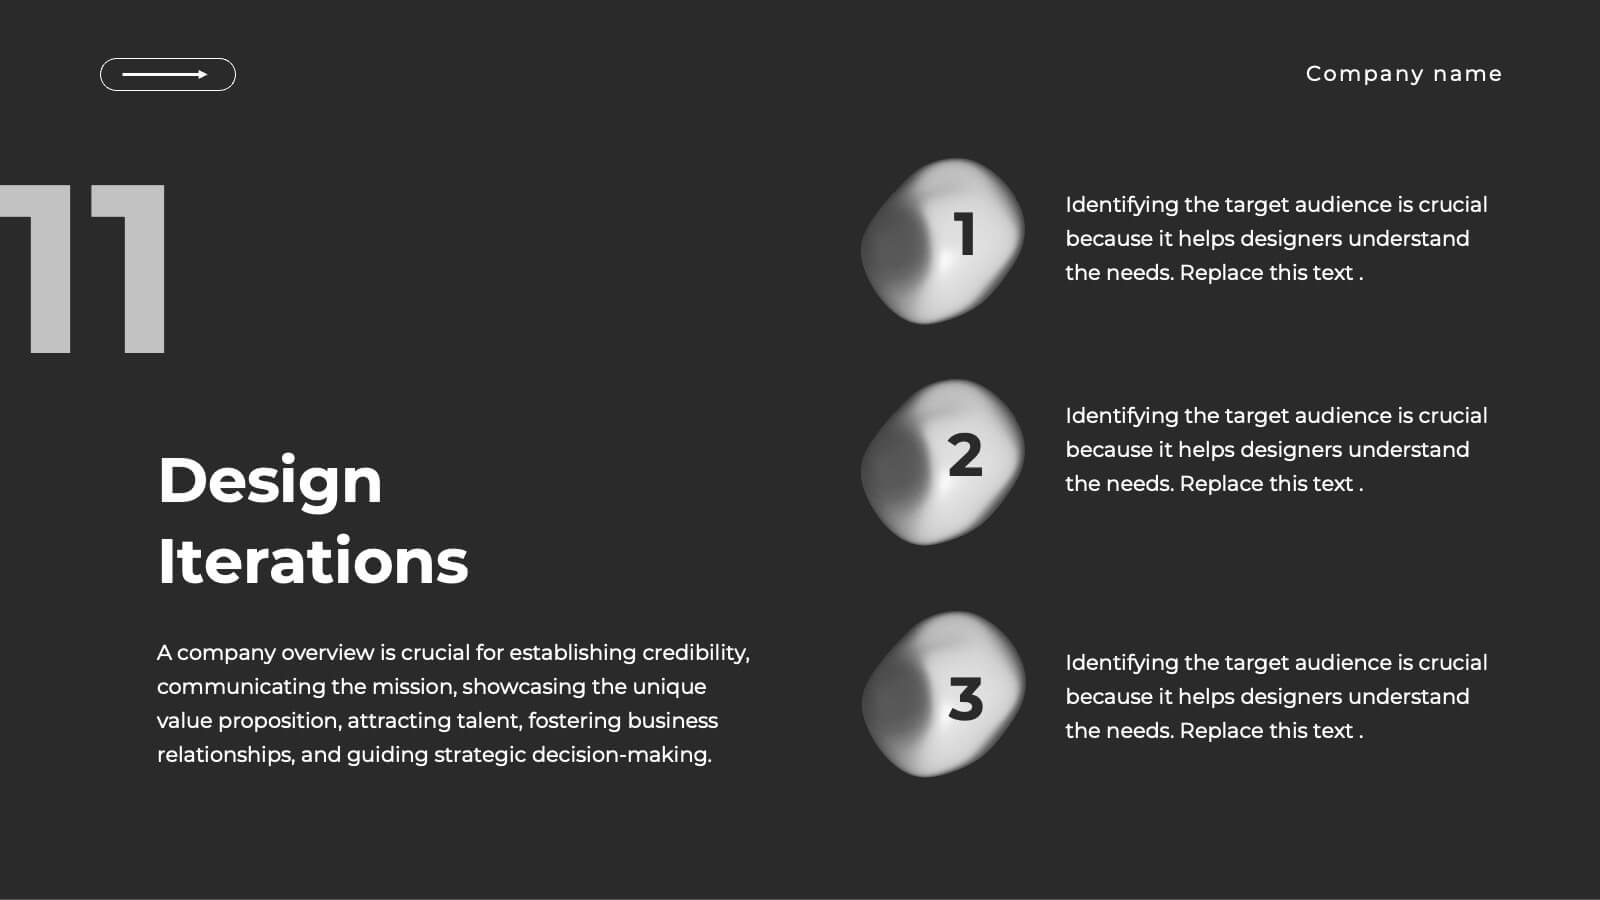
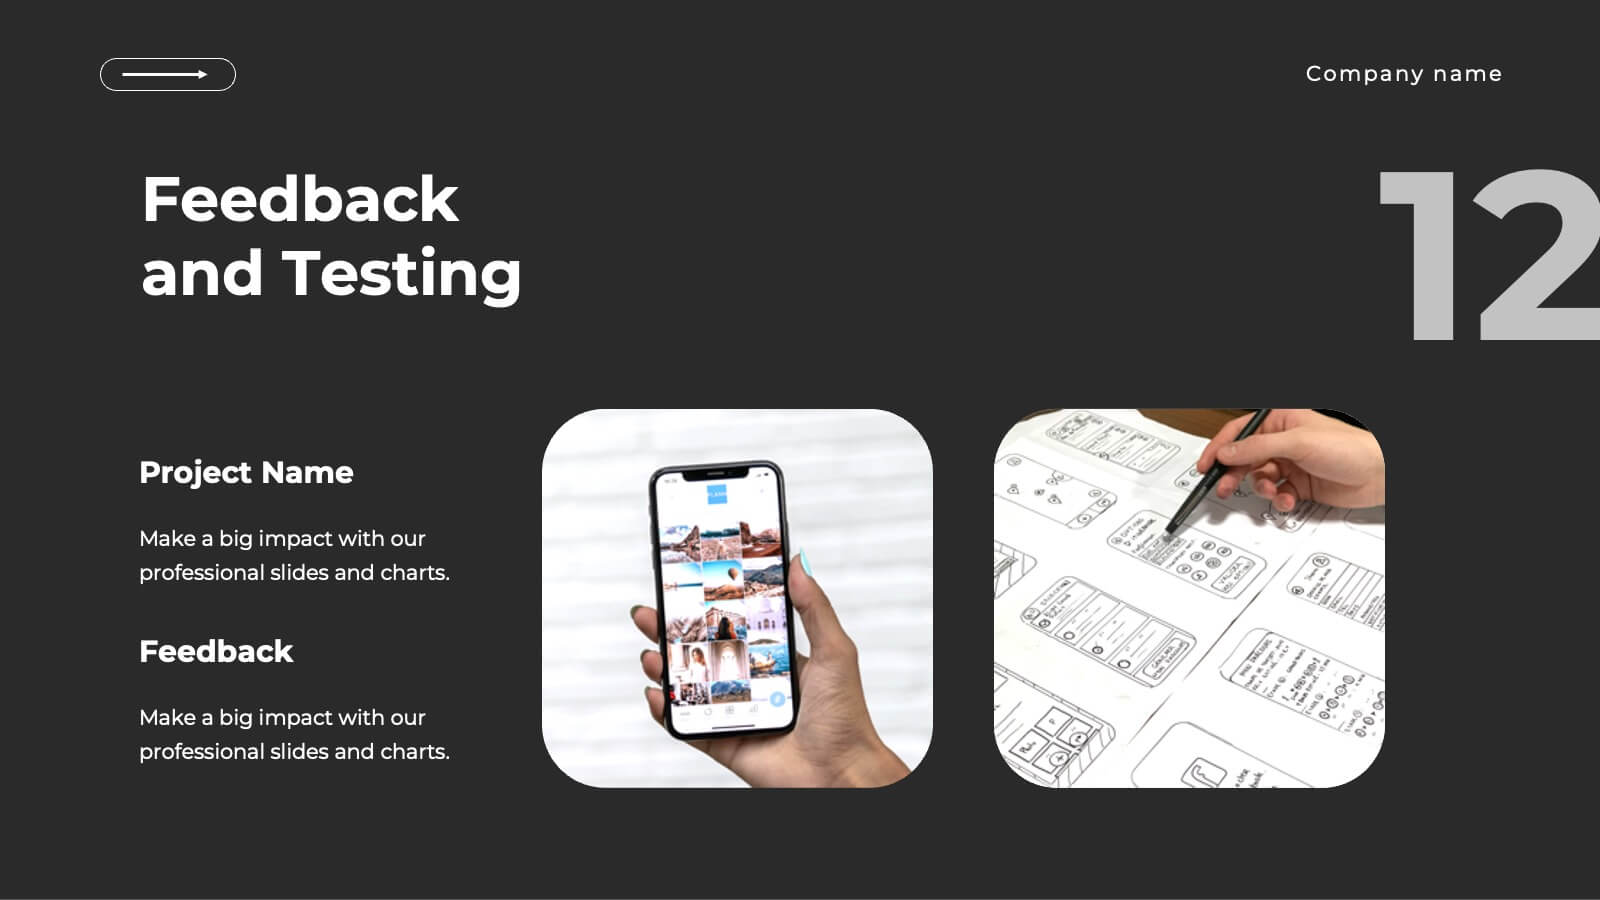
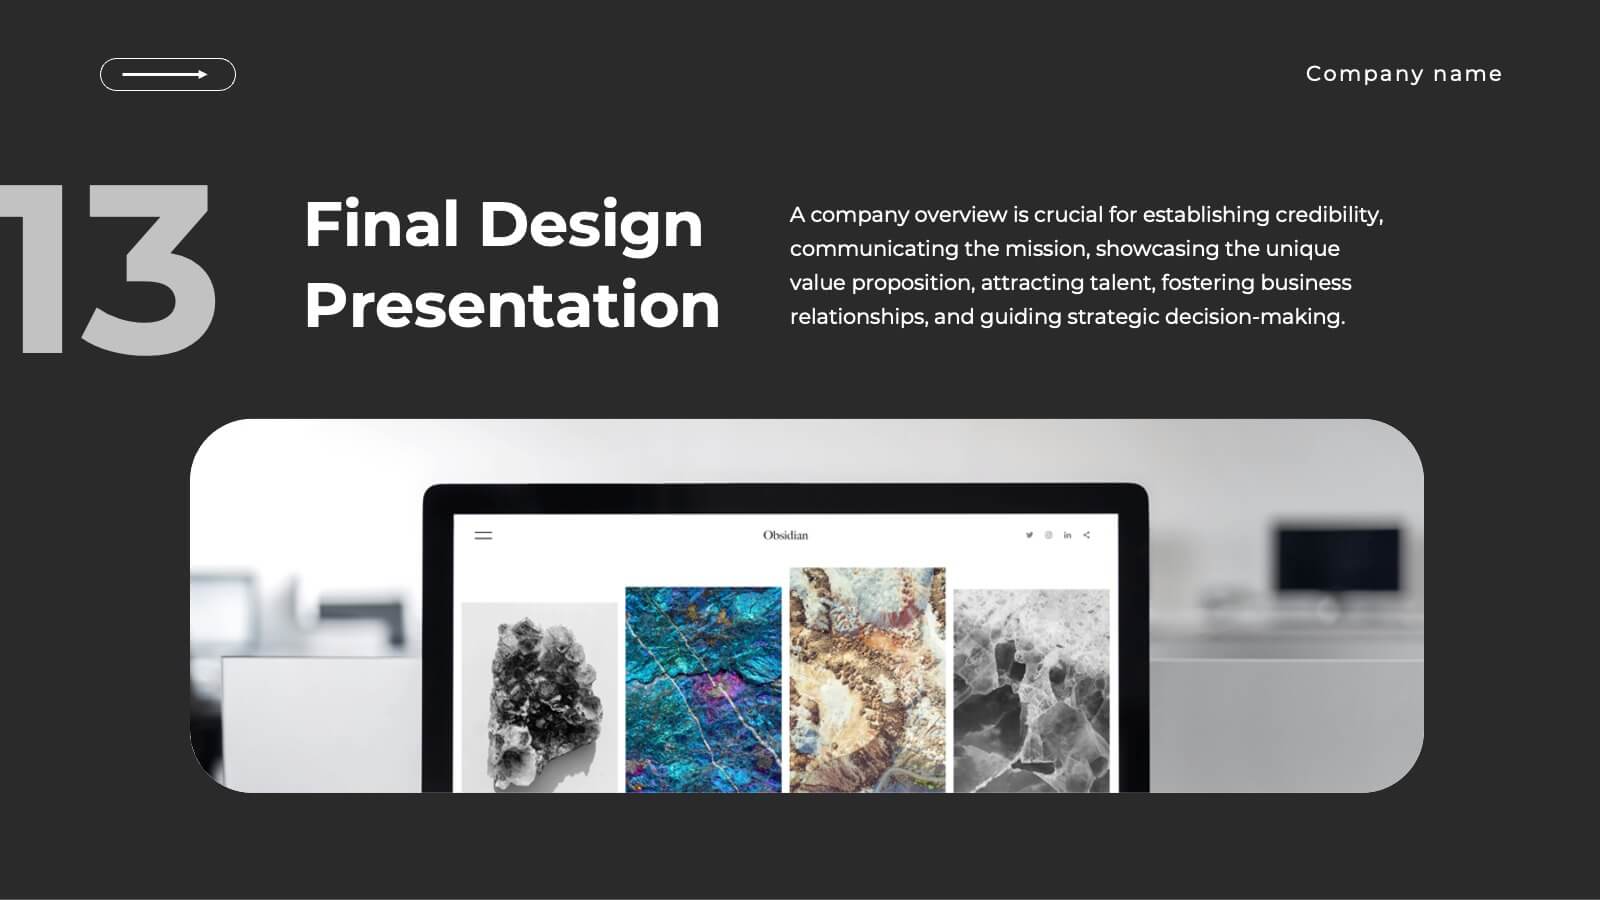
Realm UX UI Design Pitch Deck Presentation
Present your UX/UI design process with this sleek and modern design template! It covers everything from concept development to wireframes, prototypes, design iterations, and final design presentation. Fully customizable and compatible with PowerPoint, Keynote, and Google Slides, it’s perfect for design teams and professionals looking to showcase their creative process effectively.


22 slides
Etherwind Advertising Agency Proposal Presentation
This Advertising Agency Proposal Presentation Template offers a sleek and professional layout, perfect for showcasing your agency's capabilities, services, and success stories. Covering essential sections such as market analysis, strategy development, campaign execution, and client testimonials, it ensures a compelling pitch to potential clients. Designed for easy customization in PowerPoint, Keynote, and Google Slides, making it a versatile choice for agencies looking to impress their audience.


6 slides
Business Performance Pie Chart Presentation
Showcase key business insights with the Business Performance Pie Chart Presentation template. Designed for professionals, this fully editable slide deck allows you to present performance metrics, financial data, and strategic analysis using visually appealing pie charts. Ideal for business reports, investor meetings, and corporate presentations, it ensures clarity and engagement. Compatible with PowerPoint, Keynote, and Google Slides.


23 slides
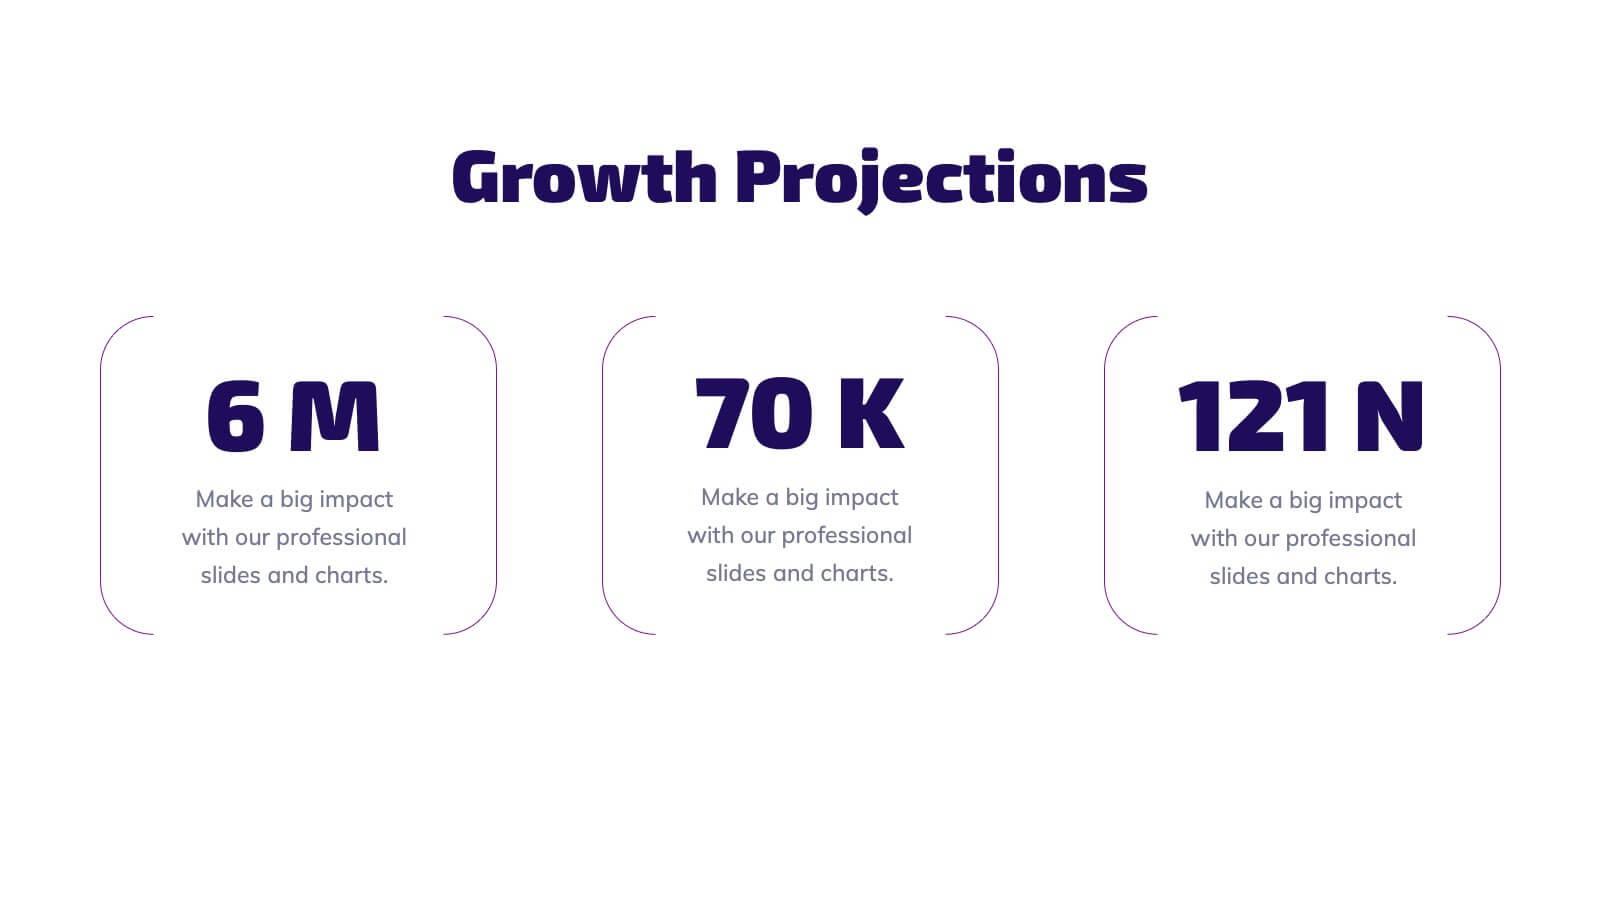
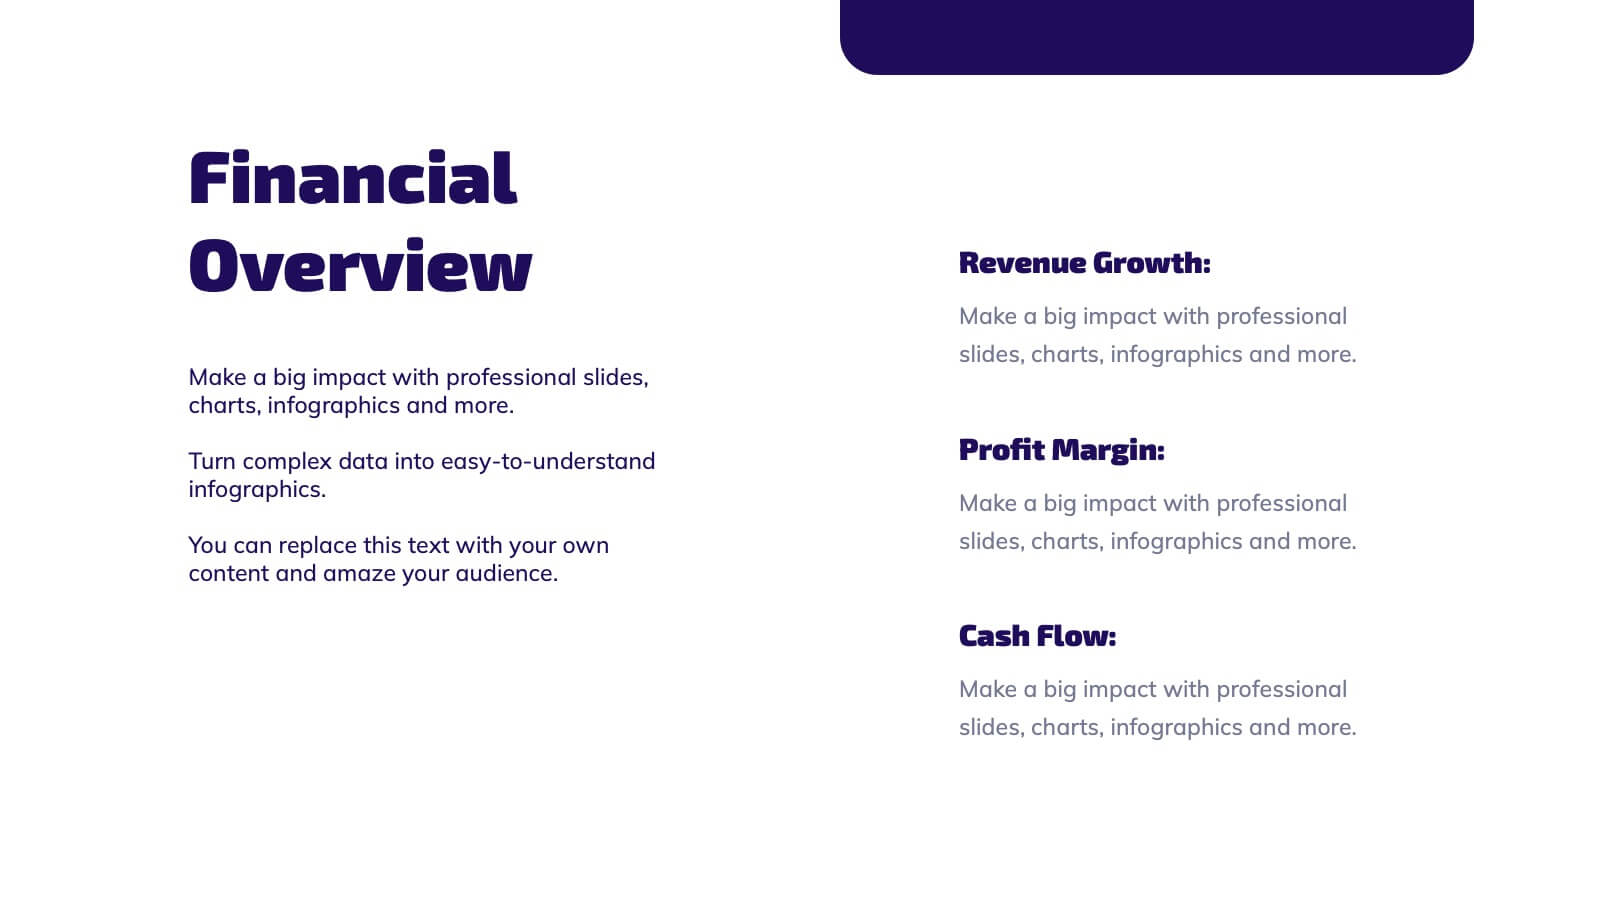
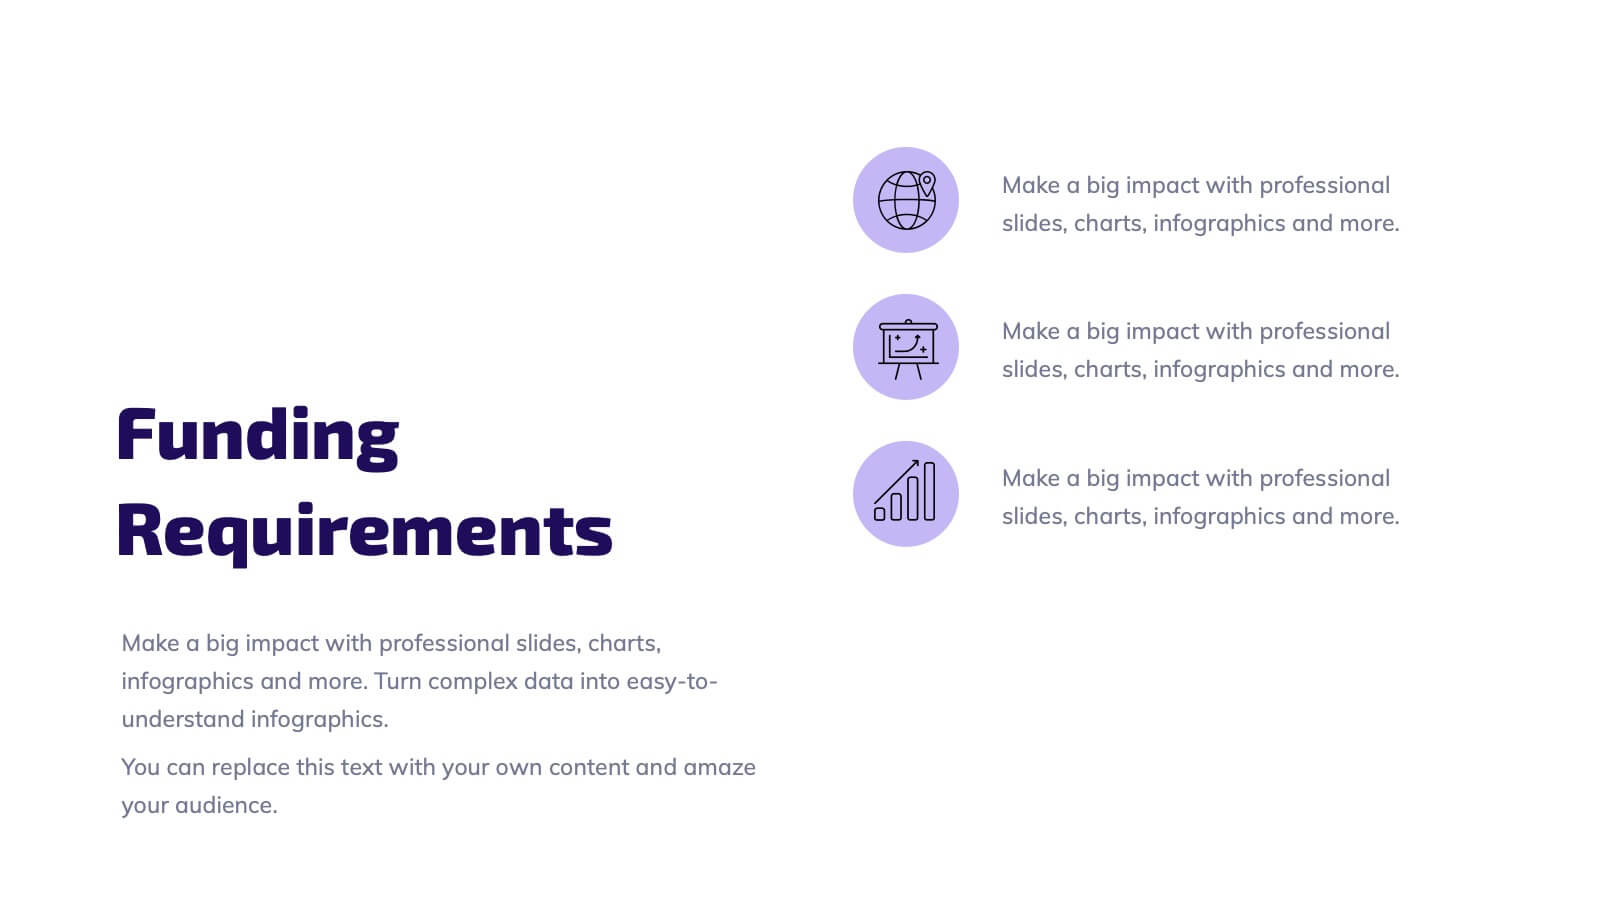
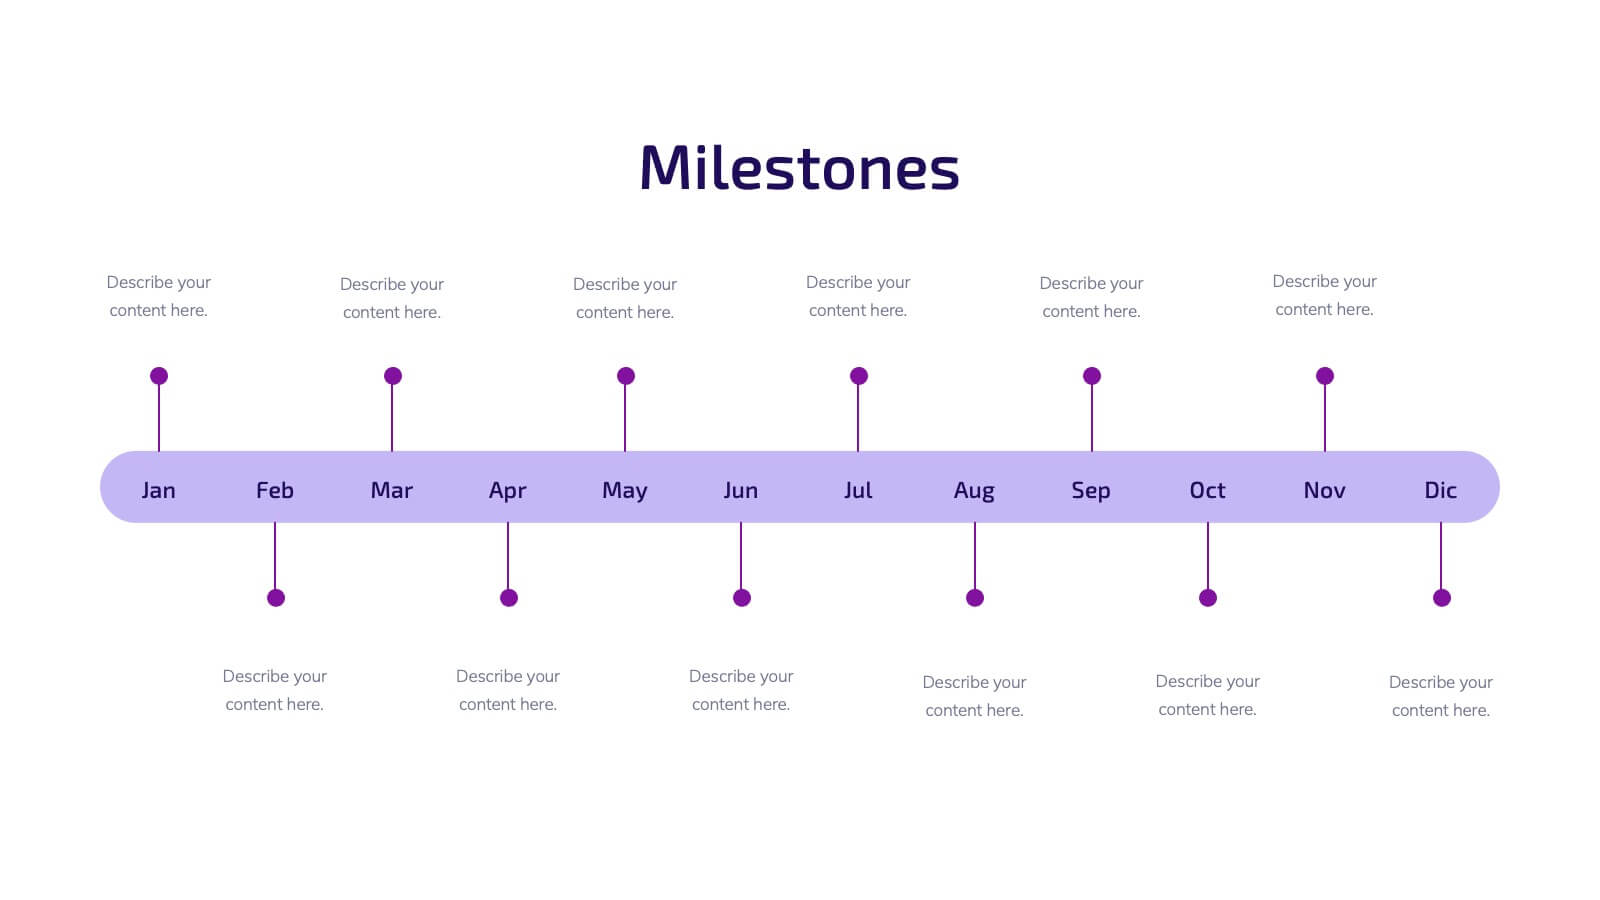
Illume Startup Pitch Deck Presentation
Light up your startup journey with this captivating presentation template! Perfect for pitching your business idea, it guides you through key elements like market analysis, financial projections, and growth strategies. With a modern design that grabs attention, this template will help you shine in front of investors. Compatible with PowerPoint, Keynote, and Google Slides.


4 slides
Historical Event Timeline Presentation
Visualize your timeline with this Historical Event layout, ideal for showcasing progress, milestones, or key moments over time. Featuring a horizontal design with date markers and icons, it’s perfect for history, education, or project recaps. Fully editable in PowerPoint, Keynote, and Google Slides to match your content and branding.


22 slides
Kinetic Content Marketing Pitch Deck Presentation
Get ready to elevate your presentations with the Kinetic Pitch Deck template, designed to capture attention and convey your message with impact! This modern, bold design uses a sleek black and gold color scheme to create a sense of sophistication and power. Every slide is thoughtfully structured, ensuring your content is delivered with clarity and style. From your Company's Vision and Core Values to Market Presence and Financial Highlights, this template covers all the essential aspects of a compelling pitch. With fully editable slides, you can easily customize it to fit your brand's identity and make a lasting impression on your audience. Perfect for marketing proposals, business pitches, or corporate presentations, this versatile template is compatible with PowerPoint, Keynote, and Google Slides. Prepare to captivate your audience and make your next presentation unforgettable with this dynamic and visually striking pitch deck template!