


Features
- 10 Unique slides
- Fully editable and easy to edit in Microsoft Powerpoint, Keynote and Google Slides
- 16:9 widescreen layout
- Clean and professional designs
- Export to JPG, PDF or send by email


Do you have any questions?
Recommend


6 slides
Gantt Charts Analysis Infographic
Streamline your project planning with our Gantt Chart Analysis Infographic, designed for seamless integration with Powerpoint, Google Slides, and Keynote. The Gantt chart layout allows you to display activities against a time scale, making it easy to identify key phases, task durations, and overlapping activities. Each bar represents a task, with colors and lengths that can be customized to reflect different stages or priorities. Perfect for detailing project timelines, and workflow coordination, this template is a visual aid that enhances clarity and fosters collaborative project management. With this Gantt Chart infographic, you can ensure your project stays on track.


26 slides
Fashion Brand Shop Aesthetic Presentation
A fashion brand shop is a retail store that exclusively sells products from a particular fashion brand. This presentation template has a stylish design that perfectly reflects the essence of a high-end fashion brand. Whether you're launching a new collection, presenting your brand's story, or showcasing your latest fashion products, this template will captivate your audience. The presentation boasts sleek and elegant slides, featuring a blend of colors and images that will resonate with your brand's aesthetic. With its customizable elements, you can easily tailor the presentation to align with your brand's unique identity and aesthetics.


5 slides
Watercolor Accent Style Template Presentation
Add subtle creativity to your slides with this Watercolor Accent Style Template. Ideal for timelines, progressions, or process visualization, this layout features numbered brushstroke segments in soft, hand-painted textures. Use it to highlight key points with elegance and clarity. Fully editable in PowerPoint, Google Slides, and Canva.


5 slides
5 Module Online Training Content Presentation
Kick off your training session with a clean, engaging visual that maps out each module in a clear, easy-to-follow flow. This presentation helps you organize lessons, outline learning goals, and guide learners through a structured digital program. Fully compatible with PowerPoint, Keynote, and Google Slides.


21 slides
Ashbrook Startup Funding Proposal Presentation
This Startup Funding Presentation Template is designed to help entrepreneurs pitch their ideas effectively. Covering essential aspects such as the business model, market analysis, growth plan, and financial overview, it provides a professional structure to captivate investors. Fully customizable and compatible with PowerPoint, Keynote, and Google Slides.


7 slides
Online Meeting Infographic
Online meetings, also known as virtual meetings or web meetings, are gatherings or discussions that take place over the internet, enabling participants to communicate, collaborate, and interact with each other remotely. This infographic template is a great way to streamline the process and enhance the efficiency of virtual meetings. This template aims to provide a comprehensive guide to conducting effective online meetings. Compatible with Powerpoint, Keynote, and Google Slides. Customize the content and design to suit your specific needs and ensure your online meetings are efficient, engaging, and productive.


26 slides
Jenzen Presentation Template
Jenzen is a modern multi-purpose template with warm tones for coaching and investing. Jenzen is suitable for all types of businesses Its slide designs can be used in conjunction with each other, making it perfect for sharing information about the various services available to customers. It's easy to use, resulting in high quality presentations. Its slide designs can be used with each other to create more elaborate presentations complete with charts, images and text boxes. It's simple yet stylish design makes it easy for anyone to use and is for both personal use as well as professional use.


5 slides
Project Boundaries and Deliverables Presentation
Visualize key checkpoints with the Project Boundaries and Deliverables Presentation. This flag-style timeline infographic clearly marks each phase of your project journey—ideal for outlining scope, goals, and delivery milestones. Designed for clarity and progress tracking, this template works seamlessly in PowerPoint, Keynote, and Google Slides.


6 slides
IT System Design and Architecture Strategy
Present your IT blueprint with the IT System Design and Architecture Strategy Presentation. This modern pentagon layout helps map out five essential components of your system strategy clearly and efficiently. Fully editable in PowerPoint, Keynote, and Google Slides—perfect for IT leaders, consultants, and infrastructure teams.


26 slides
Networking for Success Presentation Template
Elevate your professional connections and opportunities with this sleek and impactful presentation template designed for networking success. Tailored for professionals, entrepreneurs, and career coaches, it features dynamic layouts for showcasing strategies, tools, and benefits of effective networking. The template includes sections for step-by-step guides, actionable tips, relationship-building techniques, and key metrics to measure success. With modern visuals and well-organized content, it ensures your message is both compelling and easy to follow. Highlight your ideas with infographics, timelines, and data charts to keep your audience engaged. Whether you’re conducting a workshop, pitching a business, or presenting at a seminar, this template adapts to various purposes with ease. Fully customizable and easy to edit, it ensures your presentation reflects your unique style and message. Compatible with PowerPoint, Keynote, and Google Slides, this template makes it simple to deliver a polished and professional presentation across any platform.

21 slides
Juventas Product Roadmap Presentation
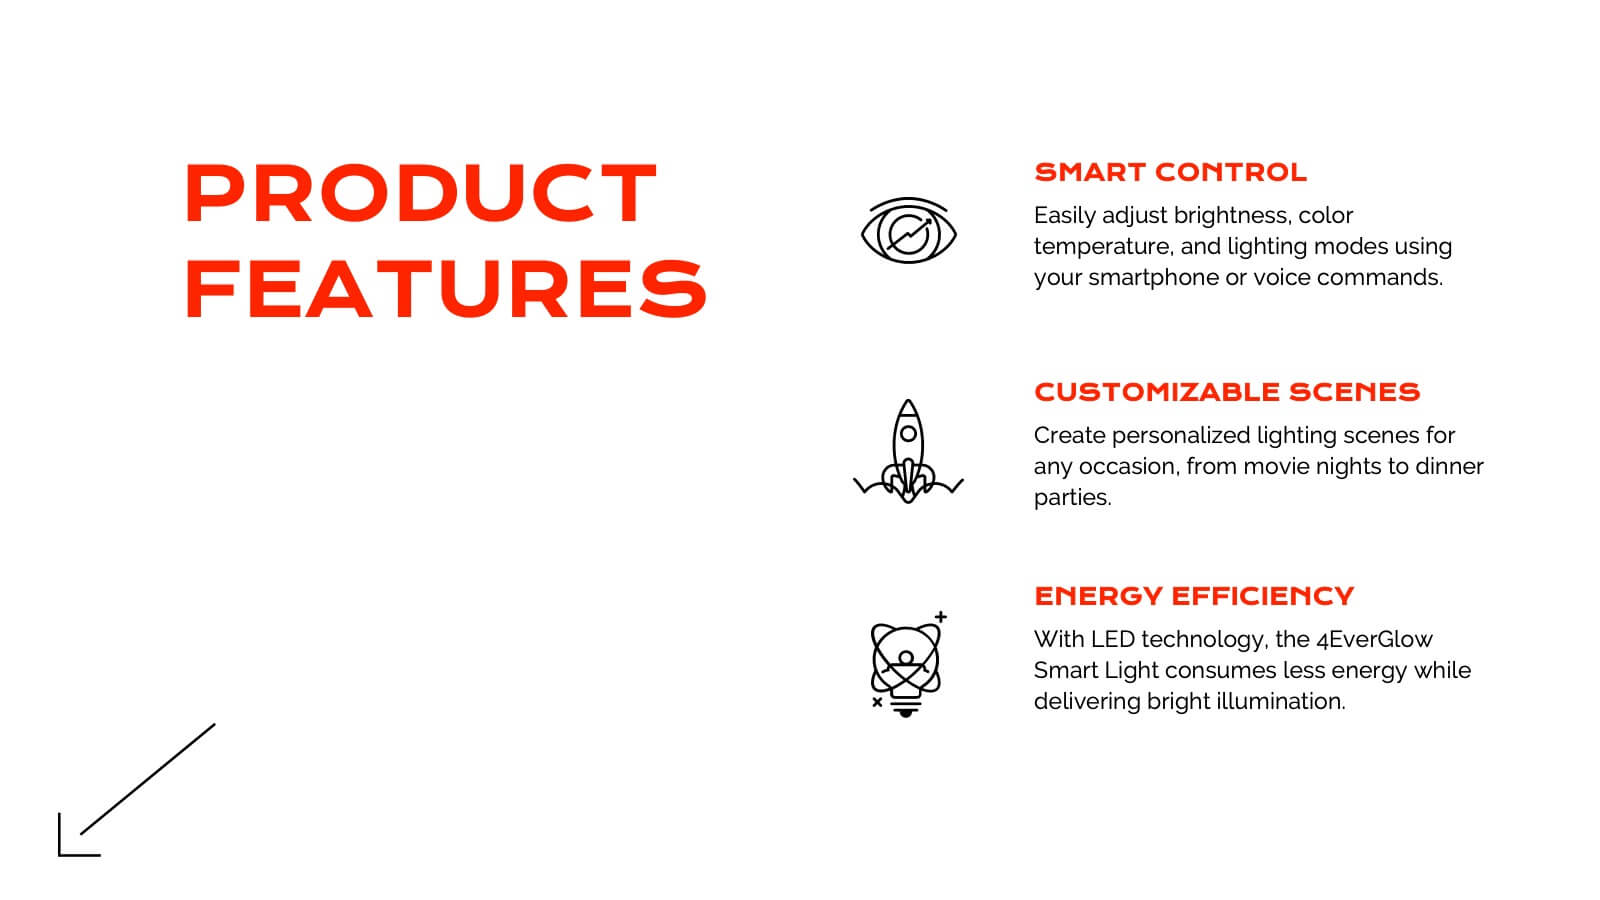
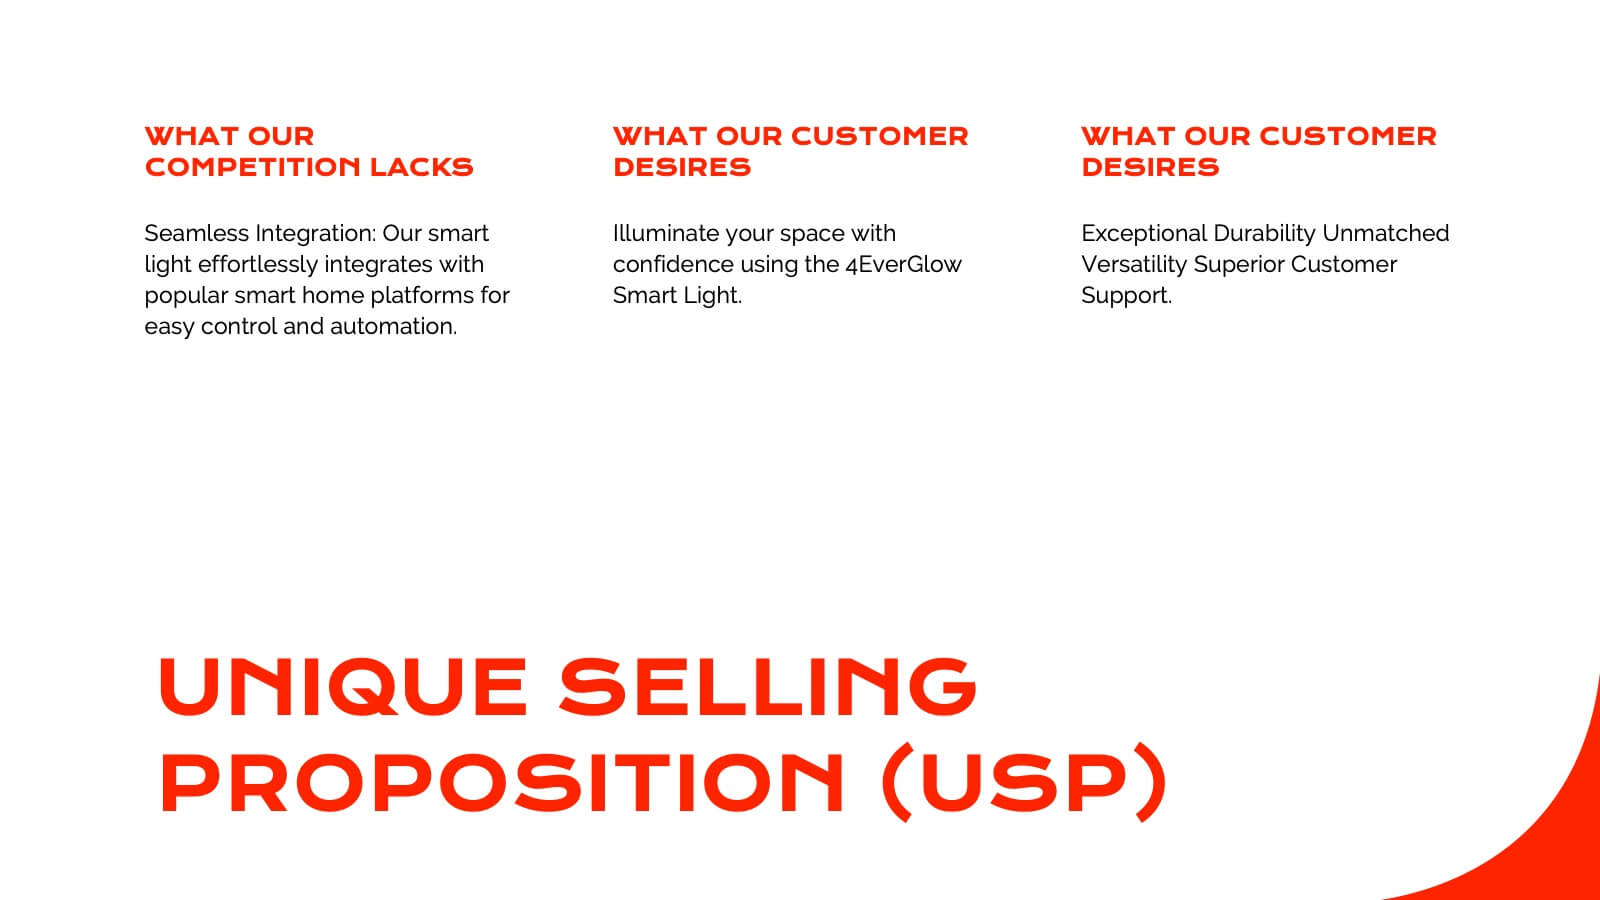
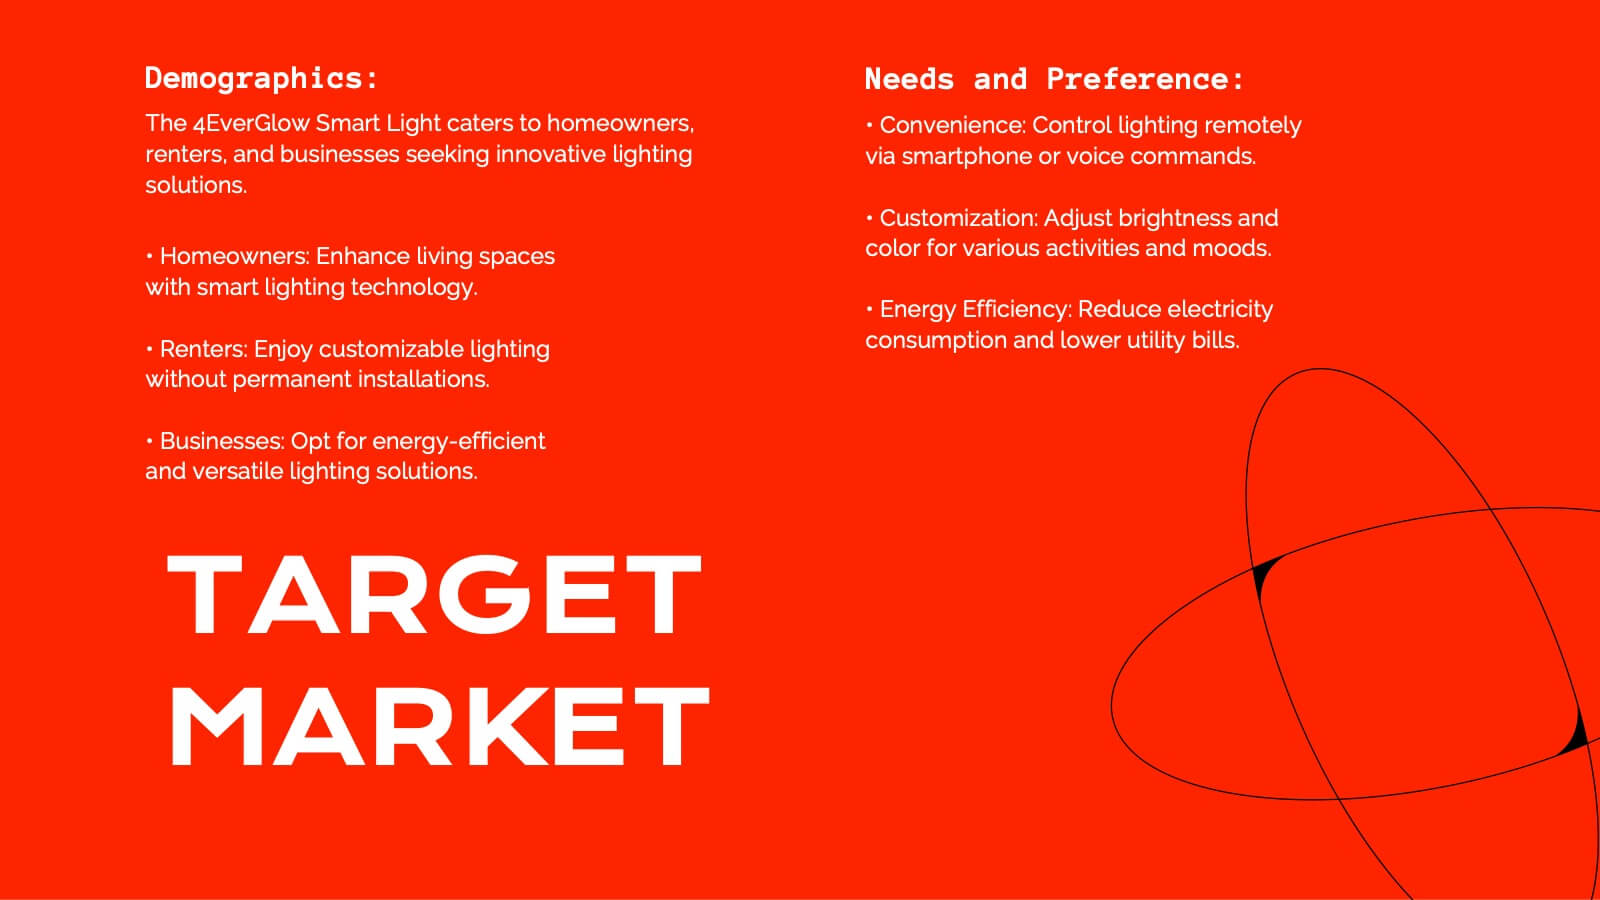
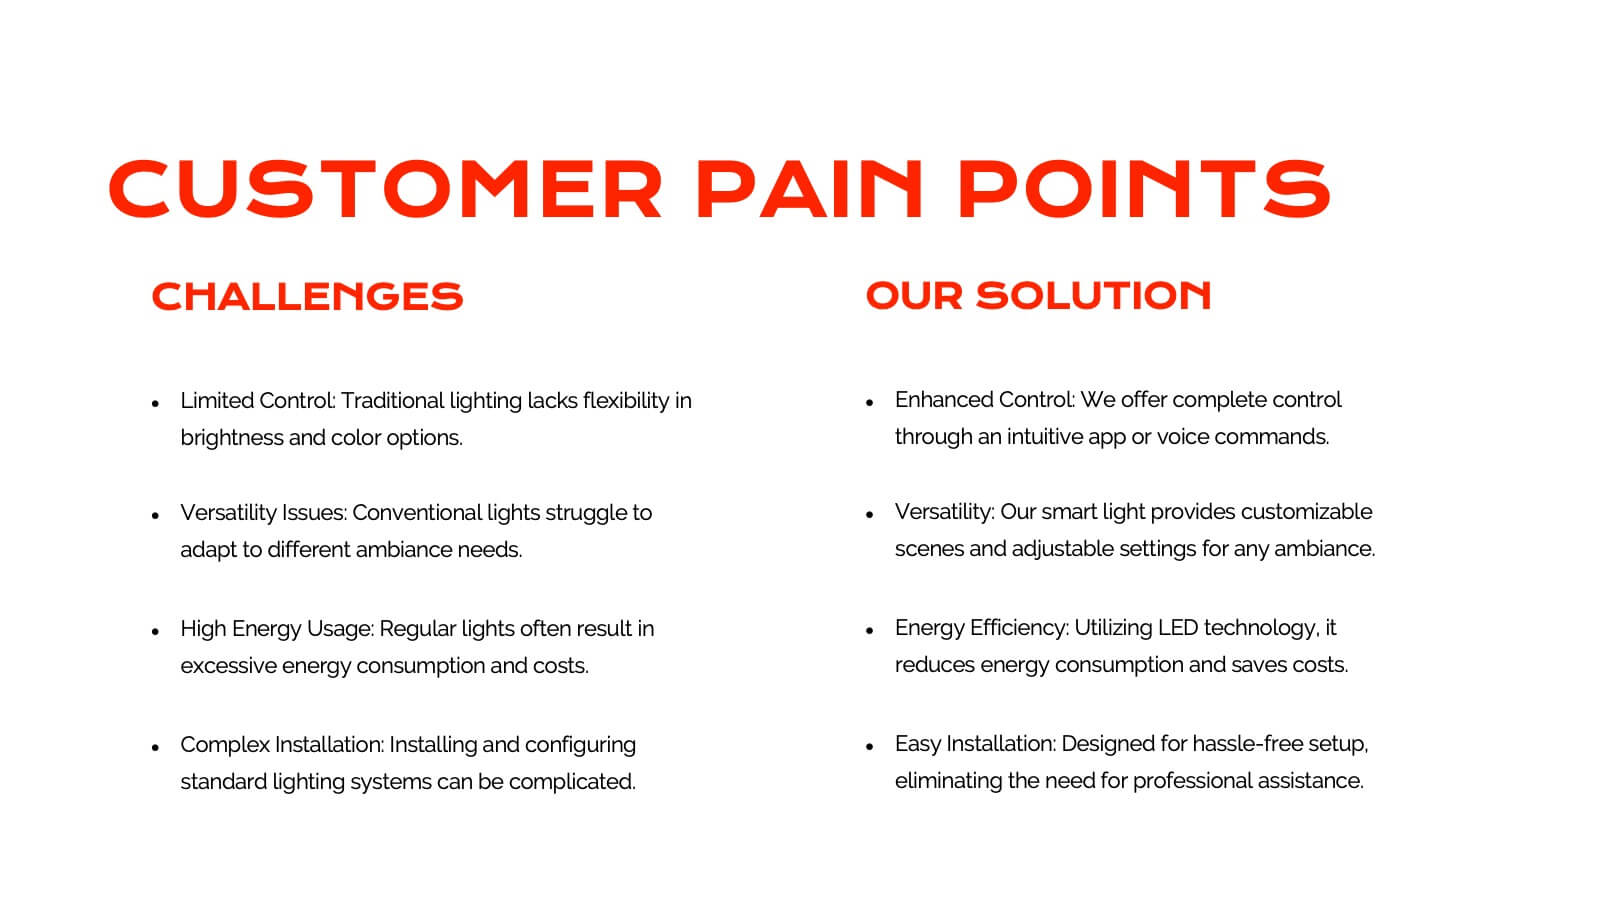
Get ready to dazzle your audience with a visually striking presentation that takes them through the entire product journey! This template covers essential areas such as product features, target market analysis, and competitive positioning. With its sleek, modern design, it's perfect for capturing attention and delivering clear information. Compatible with PowerPoint, Keynote, and Google Slides for effortless use across platforms.


8 slides
Meet the Team Presentation
Showcase your team effectively with our "Meet the Team Presentation" template. This sleek design features personalized cards for each team member, displaying their photo, name, and contact details on a visually appealing, color-coded background. Perfect for onboarding, company introductions, or team-building presentations, this template enhances recognition and cohesion. The distinct colors can be used to signify different roles or departments, making it easy to identify team dynamics at a glance. Compatible with PowerPoint, Keynote, and Google Slides, it’s an essential tool for any organization aiming to present their team in a professional and engaging manner.


6 slides
Market Trends Heat Map Visualization Presentation
Analyze market trends with an intuitive heat map infographic. This visualization helps identify patterns, strengths, and risks using color-coded data blocks. Perfect for financial analysis, competitive research, and industry forecasting. Fully customizable and compatible with PowerPoint, Keynote, and Google Slides for seamless integration into your presentations.


5 slides
Timeline-Based Year-End Recap Presentation
Summarize milestones with the Timeline-Based Year-End Recap Presentation. This structured, column-based layout allows you to compare achievements across multiple years in a clear, organized format. Each year is color-coded and paired with icons and editable label sections to highlight key points. Ideal for annual reports, strategic reviews, and progress tracking. Fully editable in PowerPoint, Google Slides, and Canva.


20 slides
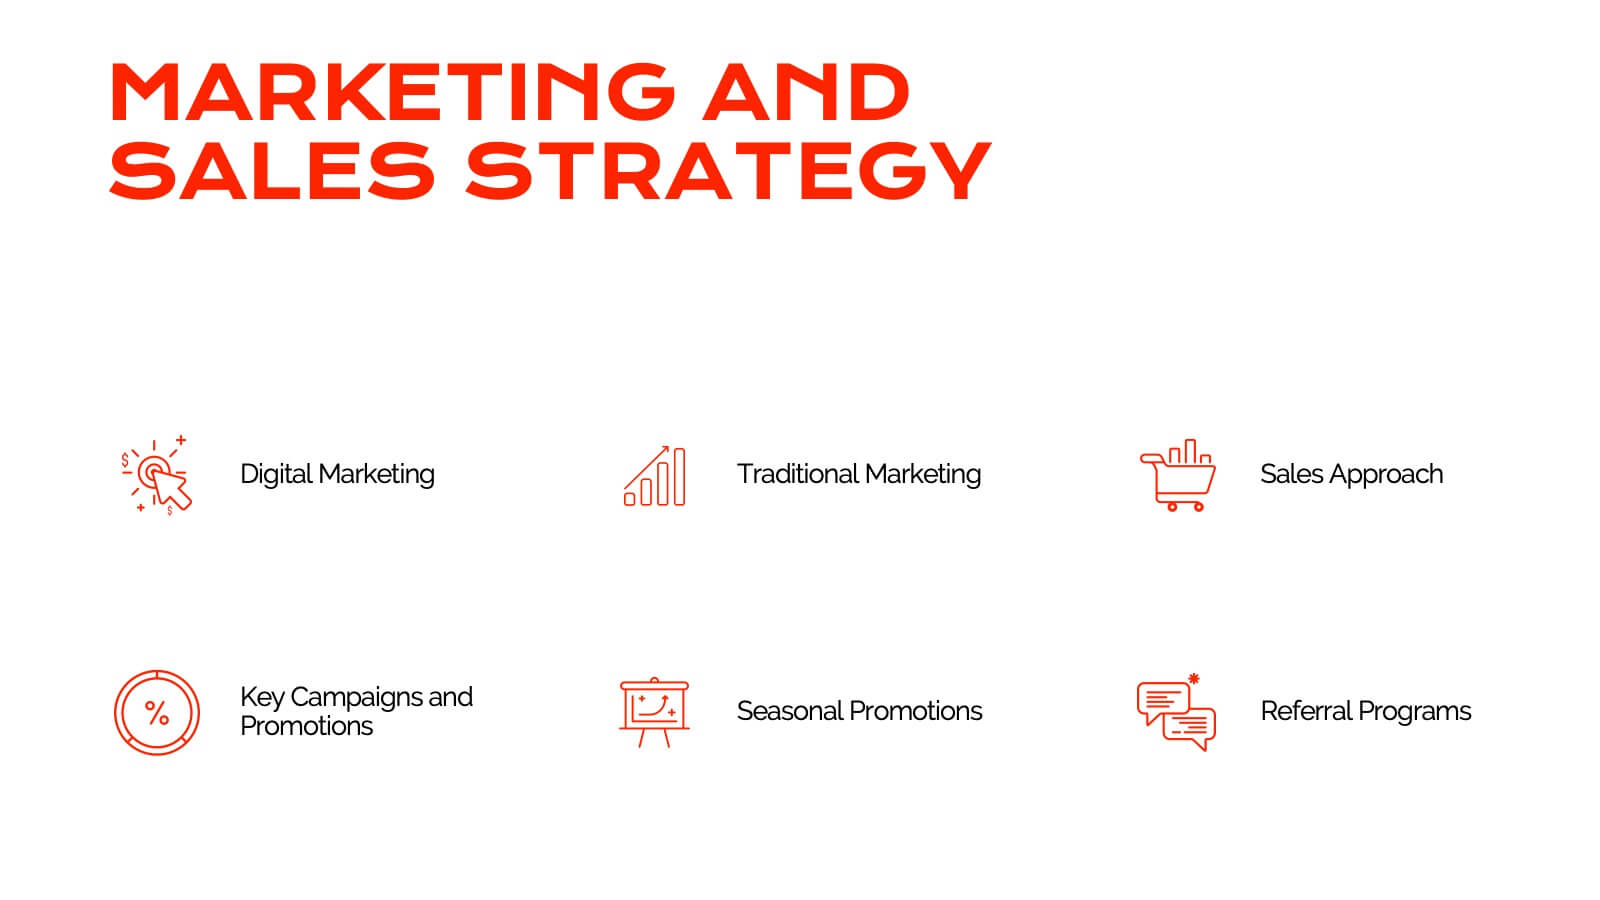
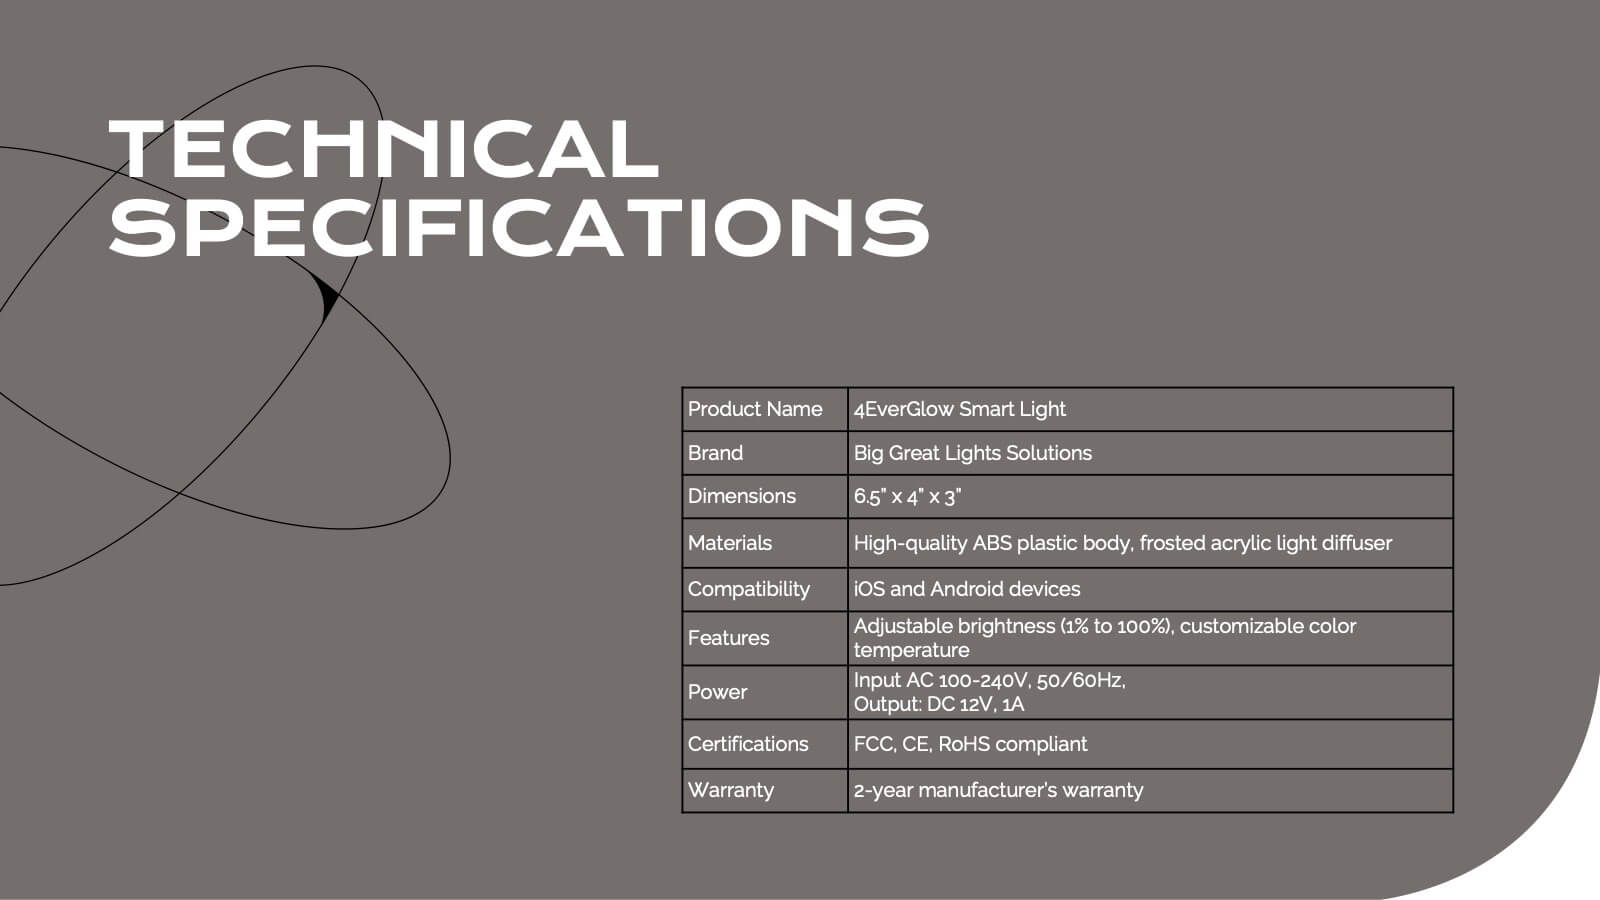
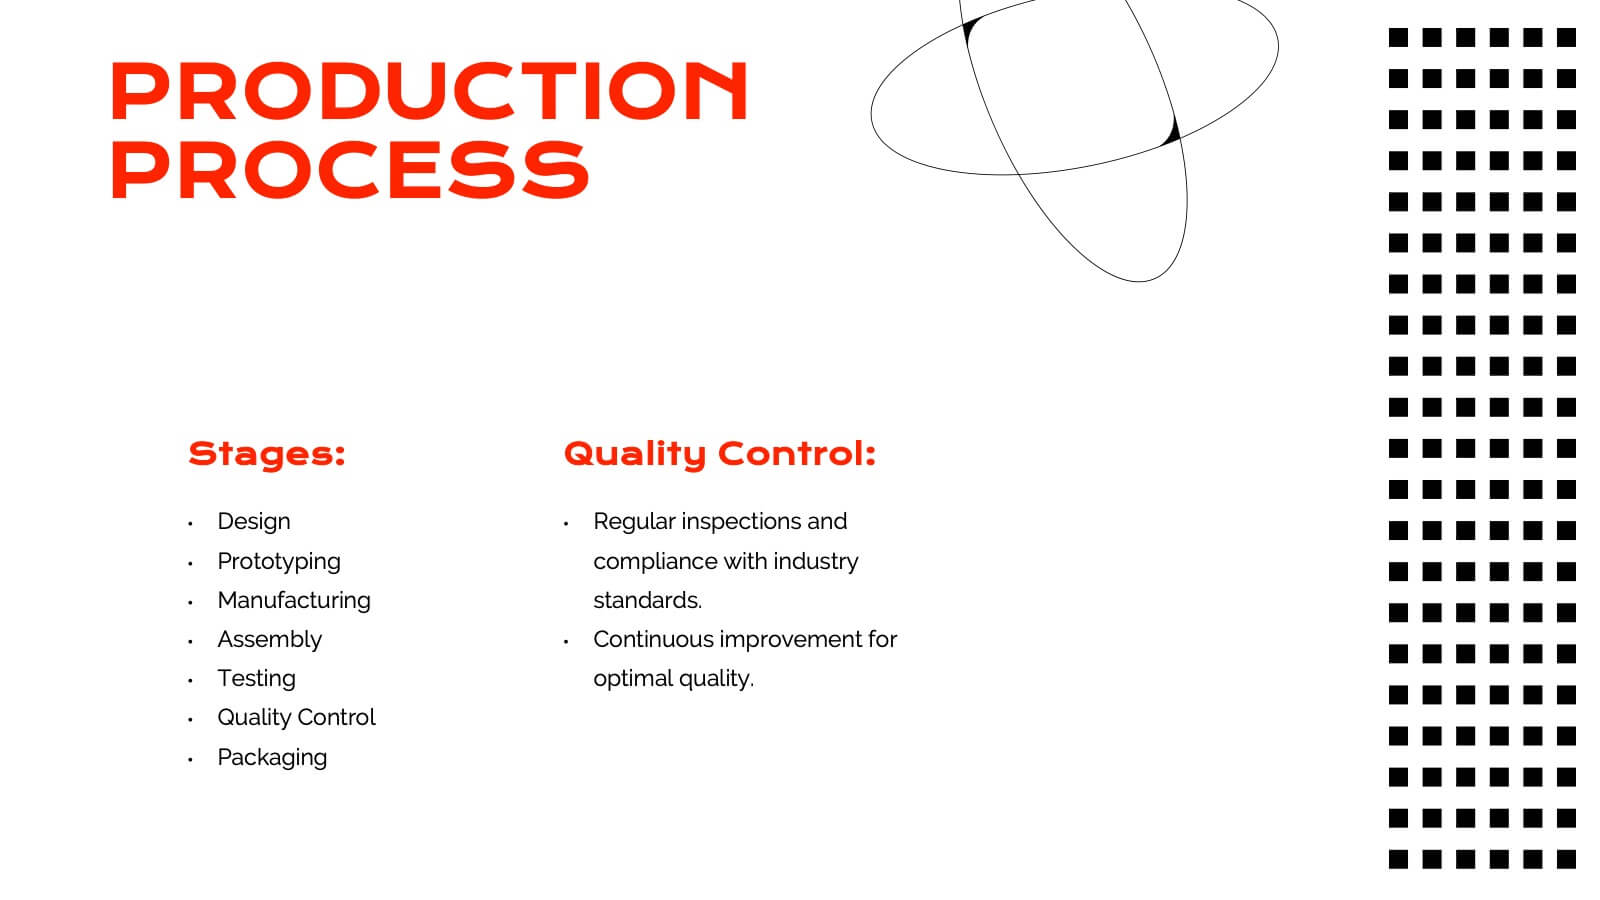
Elysium Product Launch Presentation
Launch your new skincare product with this stylish presentation template. Highlight key features, target market, pain points, and unique selling propositions. Perfect for marketing strategies and production processes. Fully compatible with PowerPoint, Keynote, and Google Slides.


6 slides
Innovation-Driven Culture and Vision
Present your strategy with clarity using the Innovation-Driven Culture and Vision Presentation. This clean, modern layout features five vertical icon markers to highlight key pillars of innovation. Ideal for leadership talks or team strategy meetings. Fully customizable in PowerPoint, Keynote, and Google Slides for easy edits and branding.


12 slides
Corporate Governance Strategy Presentation
Optimize your company's strategic direction with our Corporate Governance Strategy template. Designed to showcase the critical components of effective governance, this template is perfect for illustrating clear governance frameworks within PowerPoint, Keynote, and Google Slides. Ideal for corporate leaders aiming to enhance transparency, accountability, and organizational alignment, this template serves as an essential tool for fostering strong corporate governance practices.