


Features
- 6 Unique slides
- Fully editable and easy to edit in Microsoft Powerpoint, Keynote and Google Slides
- 16:9 widescreen layout
- Clean and professional designs
- Export to JPG, PDF or send by email


Do you have any questions?
Recommend


6 slides
5-Level Risk Assessment Diagram Presentation
Simplify complex risk analysis with a clean, layered design that walks your audience through five key levels of impact and probability. Perfect for corporate reports, project management, or strategic planning, this presentation ensures clarity and engagement. Fully compatible with PowerPoint, Keynote, and Google Slides for easy customization.


6 slides
E-Learning Industry Infographic
E-learning, short for "electronic learning," refers to the use of digital technologies to deliver educational content and programs to learners via the internet or other digital platforms. This infographic template is a visual representation that provides key information and insights about the e-learning industry. This encompasses a wide range of online learning methods, tools, and resources that cater to various educational needs and goals. This template serves as a valuable tool to educate viewers about the e-learning landscape, its benefits, and its potential for transforming education and training.


5 slides
Marijuana Industry Infographics
The Marijuana Industry refers to the cultivation, production, distribution, and sale of marijuana or cannabis-related products. These vertical infographics are designed to provide an overview of the marijuana industry. They offer a comprehensive look at the various aspects of the industry, including its history, growth, legalization, medical and recreational uses, and more. Inform and educate your viewers about the various aspects of the marijuana industry. Present data, trends, and insights related to the industry. This template is an effective tool for presenting key information about the marijuana industry in a visually engaging manner.
6 slides
Key Project Milestone Tracker Presentation
Stay on top of project timelines with this clean and colorful milestone tracker. Ideal for Gantt-style overviews, this slide helps teams visualize progress across months for multiple tasks. Compatible with PowerPoint, Keynote, and Google Slides for seamless editing.


6 slides
McKinsey 7S Model Articles Infographics
Explore the seven critical elements that make up the McKinsey 7S Model, including Strategy, Structure, Systems, Shared Values, Skills, Style, and Staff. Each of these components plays a vital role in shaping your company's success. This infographic is compatible with popular presentation tools like PowerPoint, Keynote, and Google Slides, making it effortless to incorporate into your next business presentation. Unlock the secrets of organizational effectiveness with this concise and visually appealing resource. Enhance your understanding of the McKinsey 7S Model and supercharge your company's performance today. Get ready to transform your business strategy with this user-friendly infographic.


5 slides
Business and Personal Goal Planning Presentation
Align your vision with action using the Business and Personal Goal Planning slide. This clean, professional layout helps break down up to four key objectives using flag-themed visuals, customizable text blocks, and supportive icons. Perfect for comparing business goals with personal development targets in a single view. Fully editable in PowerPoint, Keynote, and Google Slides—ideal for team meetings, coaching sessions, or strategic planning.


8 slides
Agriculture Business Model Presentation
Turn your ideas into growth with this vibrant and modern presentation design. Perfect for explaining market strategies, production cycles, or investment models in agriculture, it helps visualize key stages from concept to harvest. Fully customizable and compatible with PowerPoint, Keynote, and Google Slides for a seamless presentation experience.


7 slides
Subsistence Agriculture Infographic
Bring the essence of sustainability to your presentations with our Subsistence Agriculture infographic, designed for seamless integration with Powerpoint, Keynote, and Google Slides. This infographic is perfect for educators, agricultural professionals, and sustainability advocates who need to convey the importance of self-sufficient farming practices and their impact on local communities. Our Subsistence Agriculture infographic illustrates the fundamentals of agriculture that relies on the self-production of food by individuals and small communities. It highlights how this method supports sustainability, food security, and ecological balance. The visually engaging elements emphasize traditional farming techniques, crop diversity, and the role of agriculture in rural livelihoods. By incorporating this infographic into your presentations, you present a compelling narrative on the significance of subsistence farming in today's world. It not only educates your audience on the basics but also inspires discussions on the broader implications for global food systems. Use this infographic to effectively communicate the value of subsistence agriculture in maintaining community resilience and environmental stewardship.


6 slides
Meeting Planner Infographics
Efficiently plan and organize meetings with our Meeting Planner infographic template. This template is fully compatible with popular presentation software like PowerPoint, Keynote, and Google Slides, allowing you to easily customize it to illustrate and communicate the key steps and strategies for effective meeting planning. The Meeting Planner infographic template offers a visually engaging platform to outline the meeting planning process, including scheduling, agenda creation, participant coordination, and follow-up actions. Whether you're a project manager, event planner, or business professional, this template provides a user-friendly canvas to create informative presentations and educational materials on meeting planning best practices. Optimize your meeting planning skills and efficiency with this SEO-optimized Meeting Planner infographic template, thoughtfully designed for clarity and ease of use. Customize it to showcase tips for successful meetings, tools for scheduling, and strategies for engaging participants, ensuring that your audience becomes more proficient in planning and executing productive meetings. Start crafting your personalized infographic today to become a more effective Meeting Planner.


7 slides
Sales Infographic Presentation Template
A Sales Infographic is a visual representation of data or information related to sales. They can include charts, graphs, and diagrams that show how much money a company has made, how many products they have sold, and what their best-selling products are. This template is perfect for anyone who wants to show off their sale numbers in a fun and easy-to-understand way. This template has colorful pictures and charts that make it easy to see how much you've sold and how well your sales are doing. This template is a perfect way to help a company make decisions and track progress.

21 slides
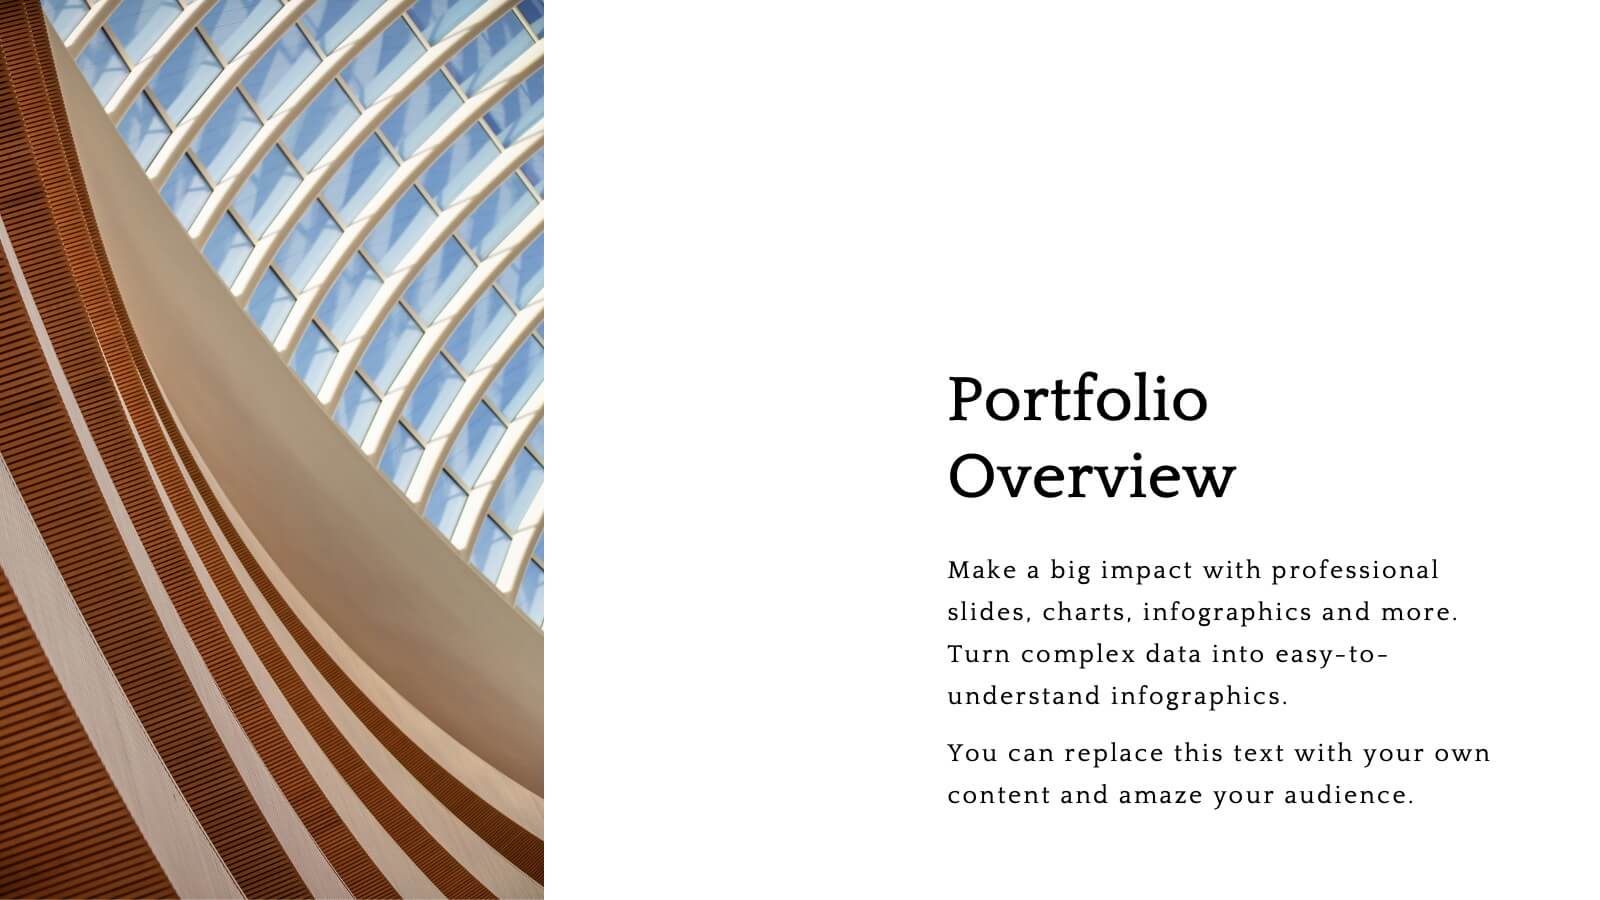
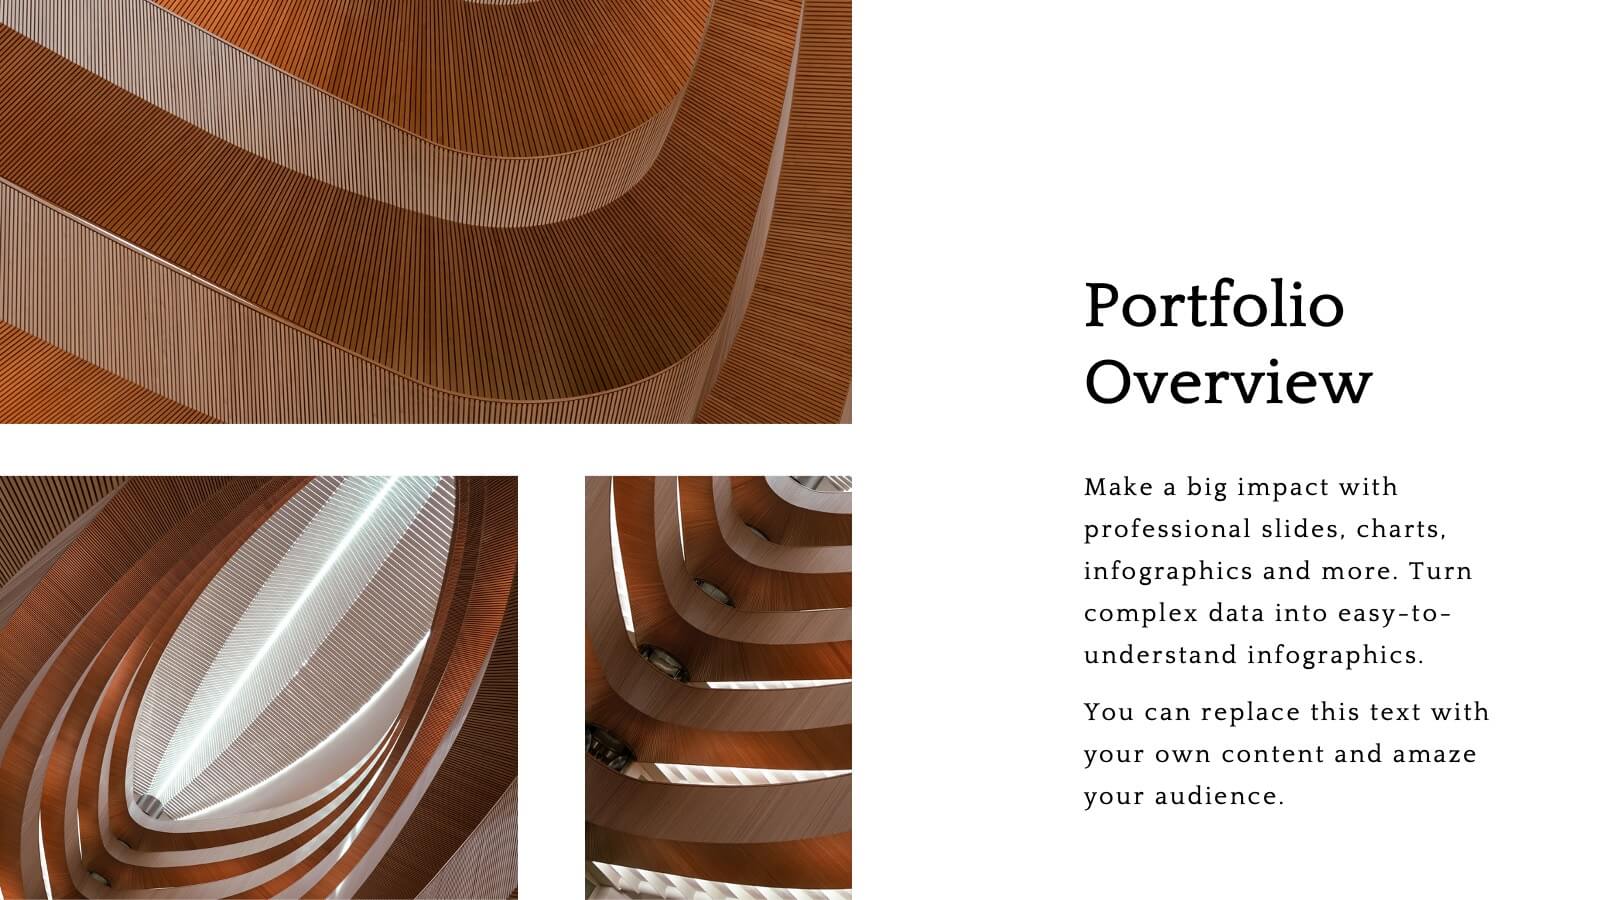
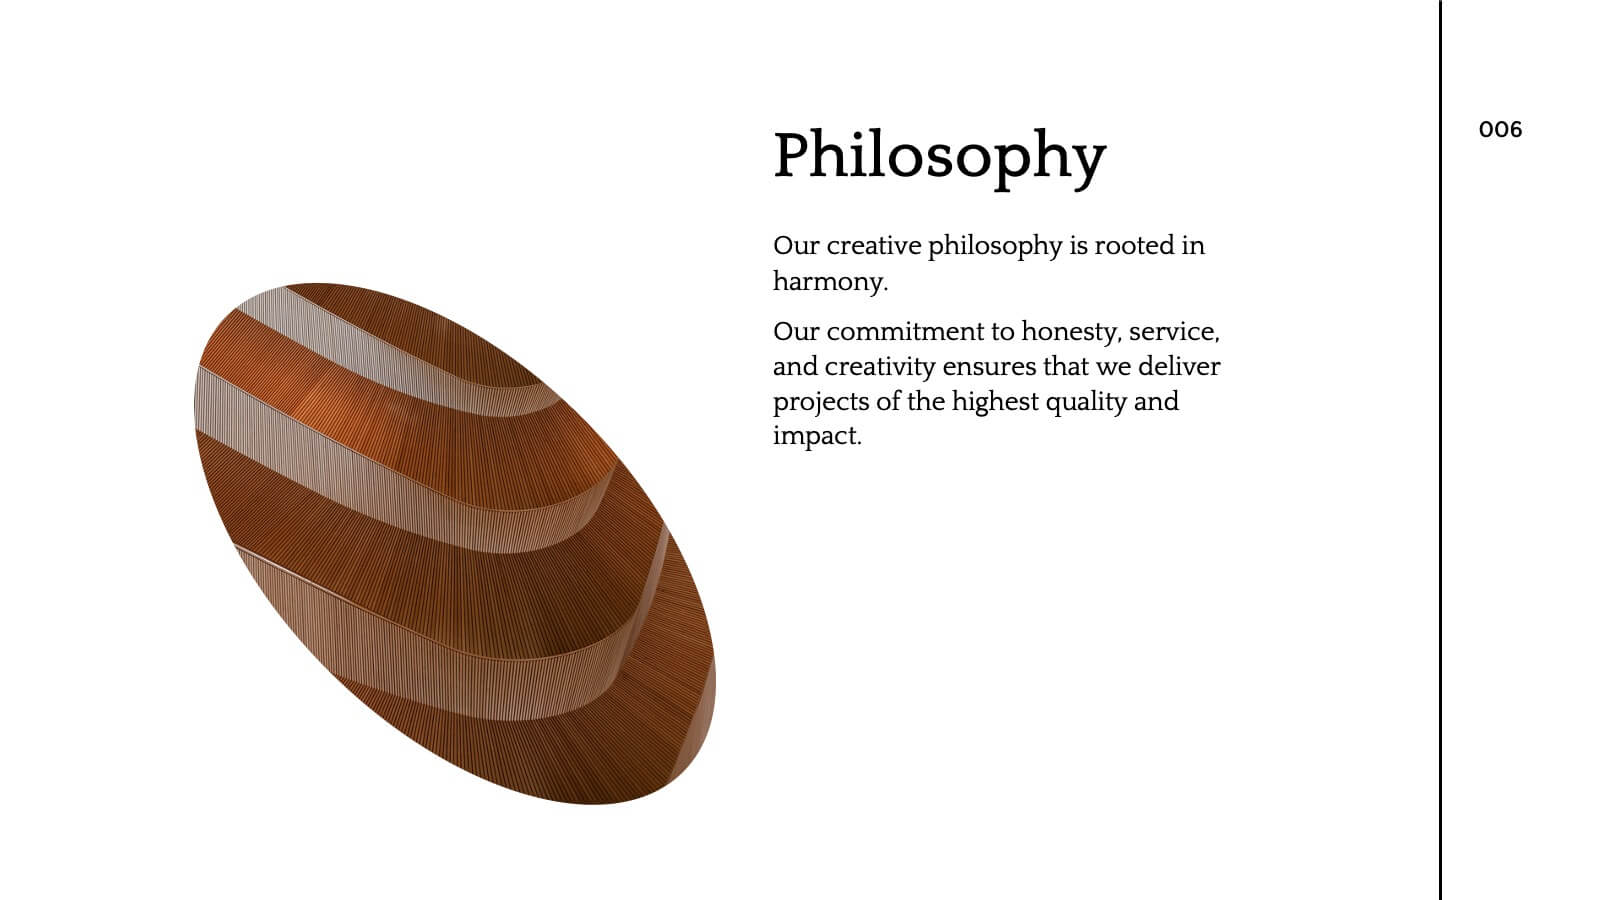
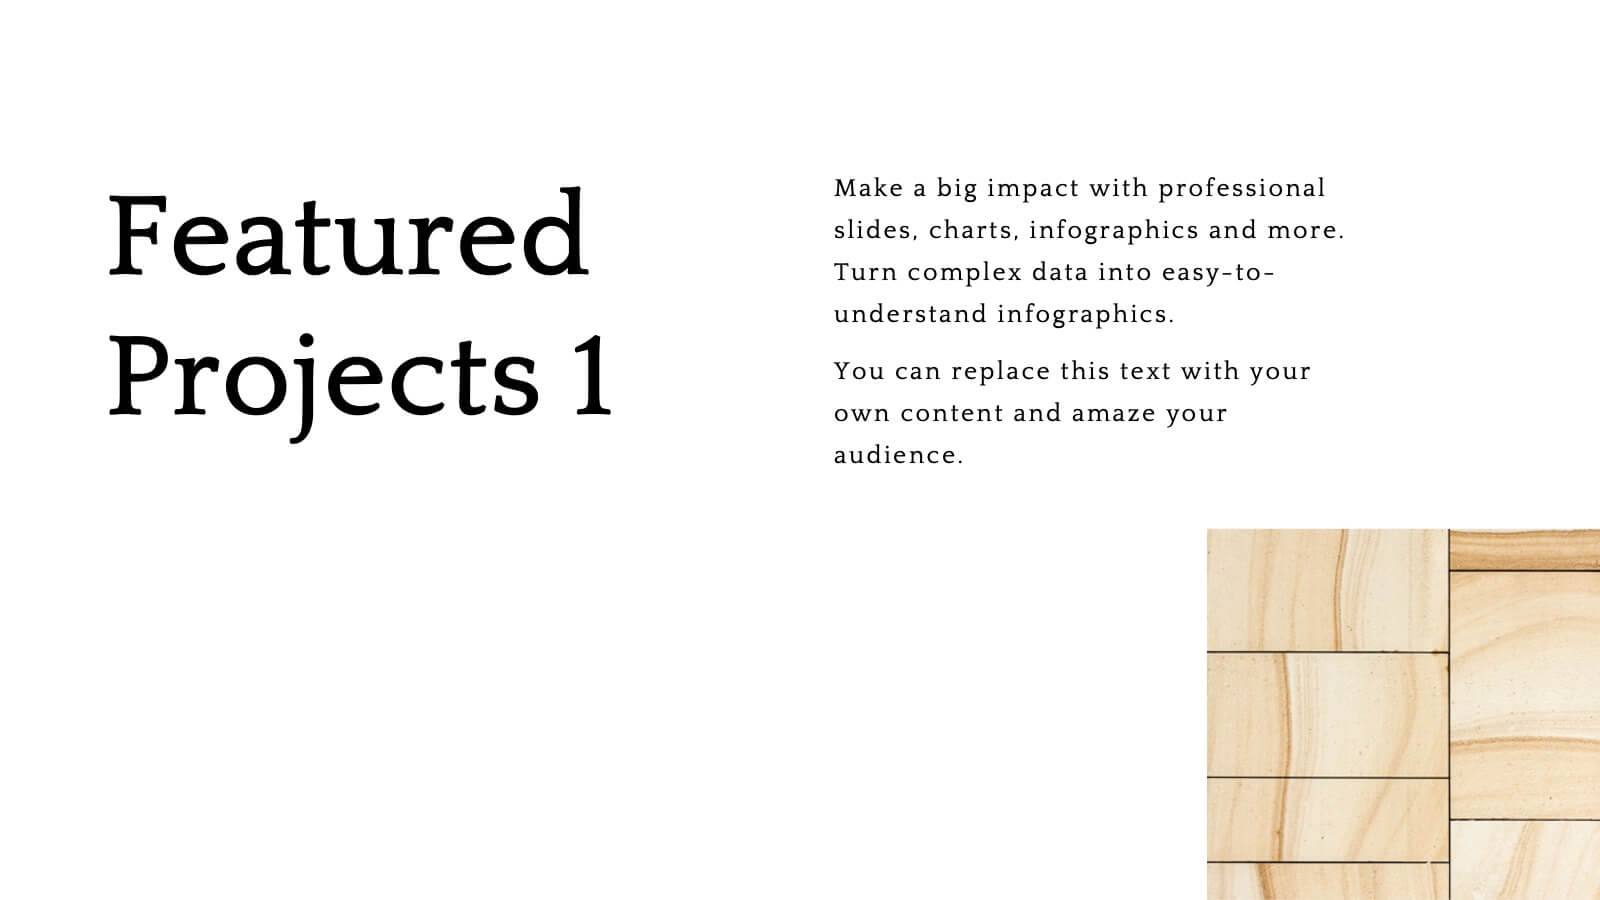
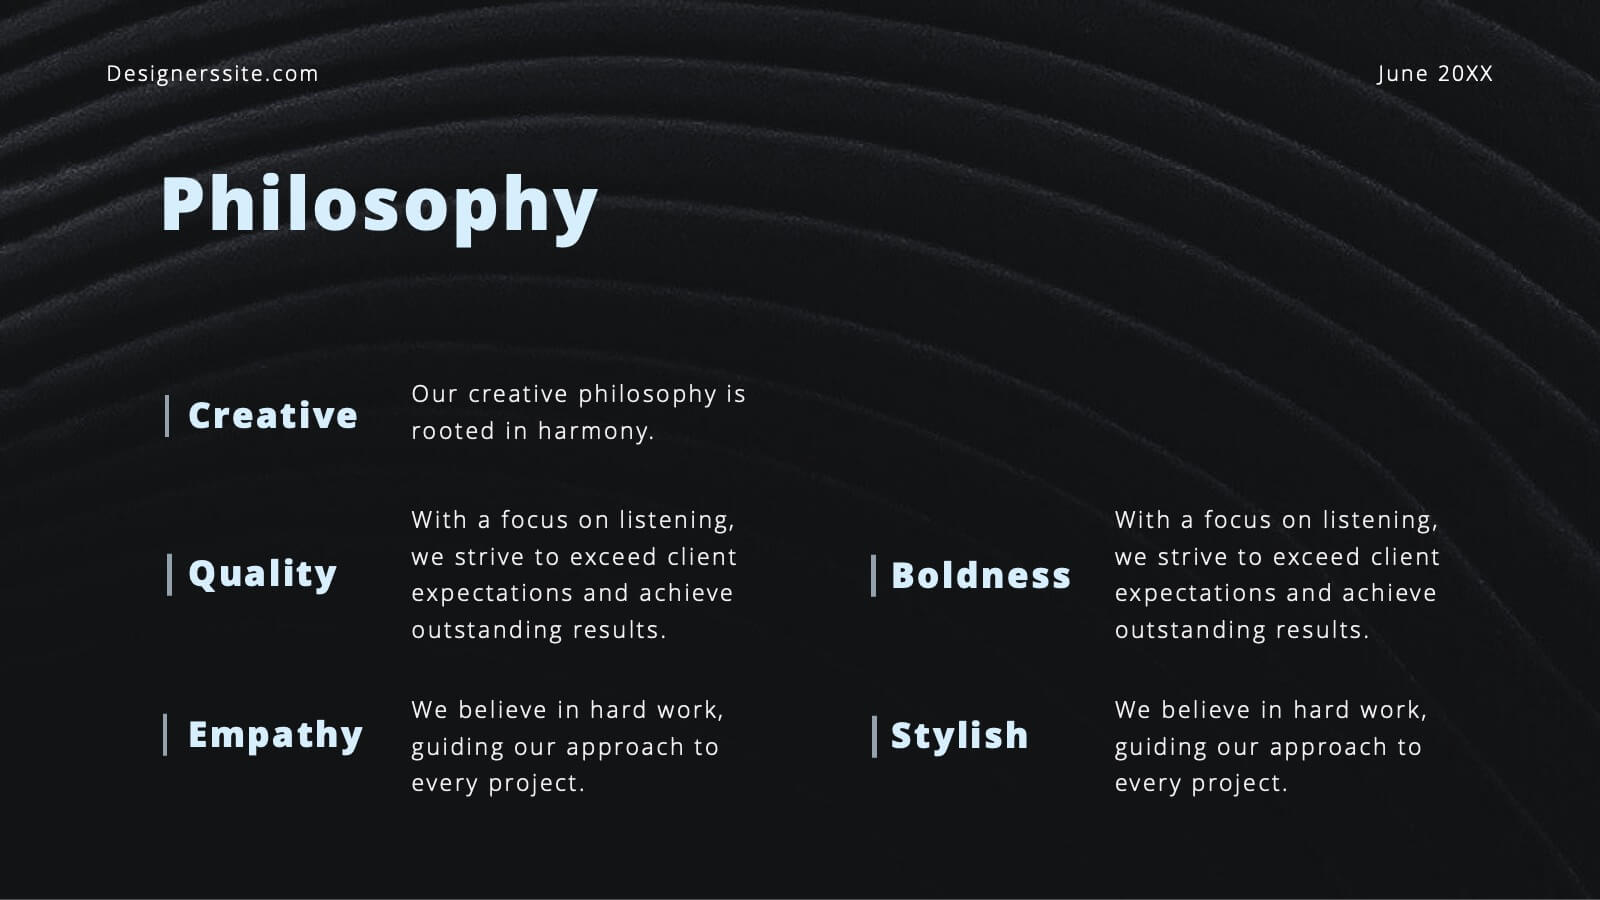
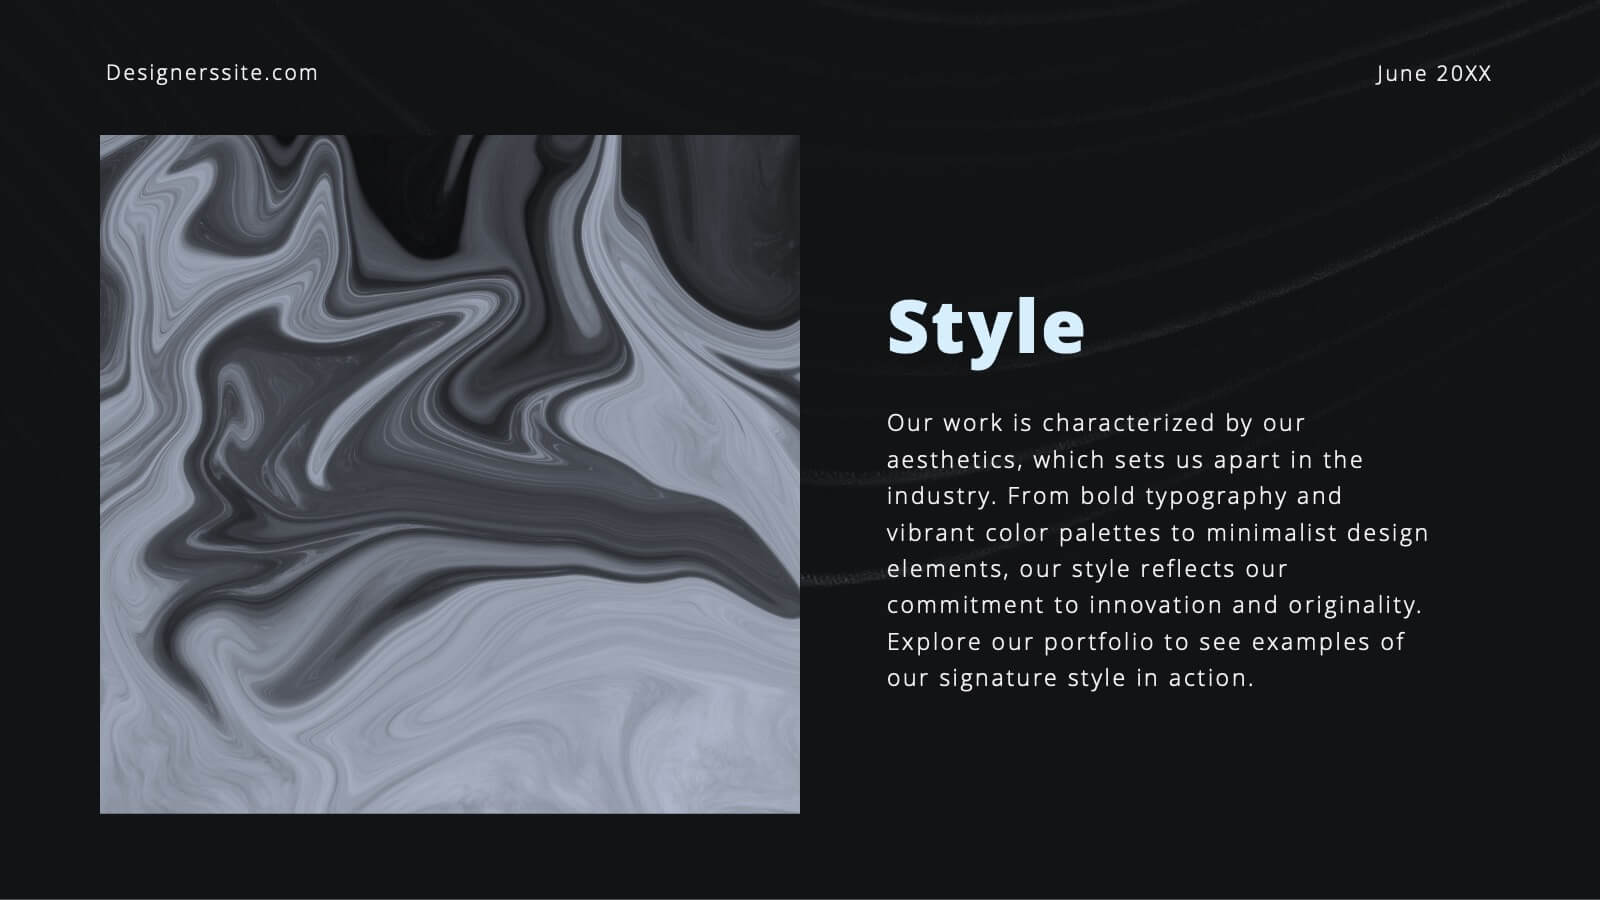
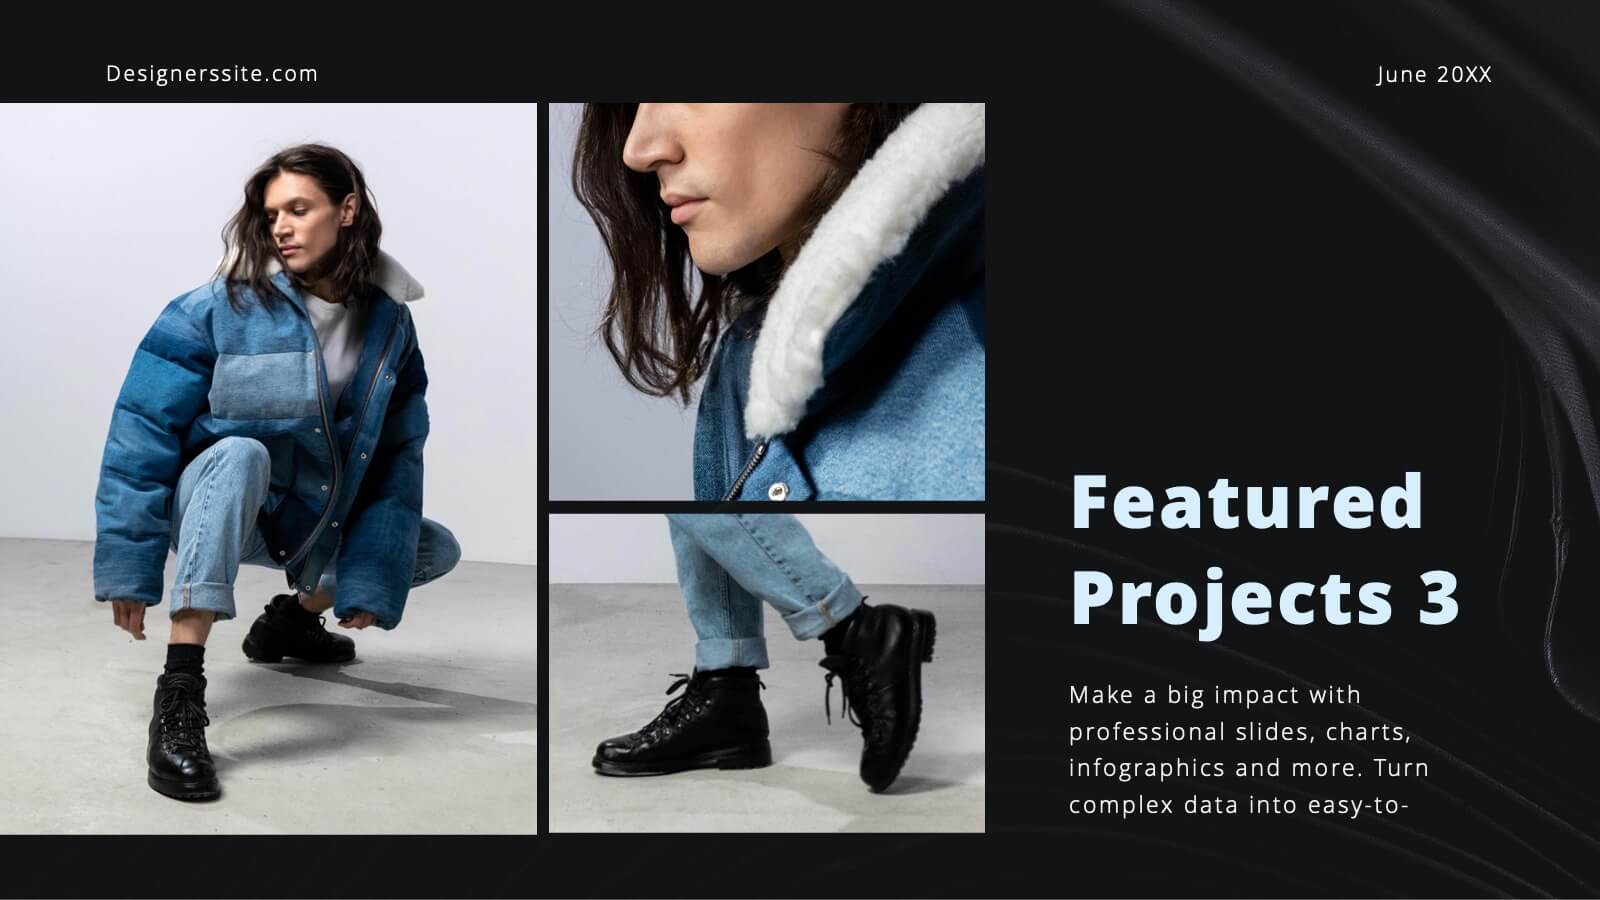
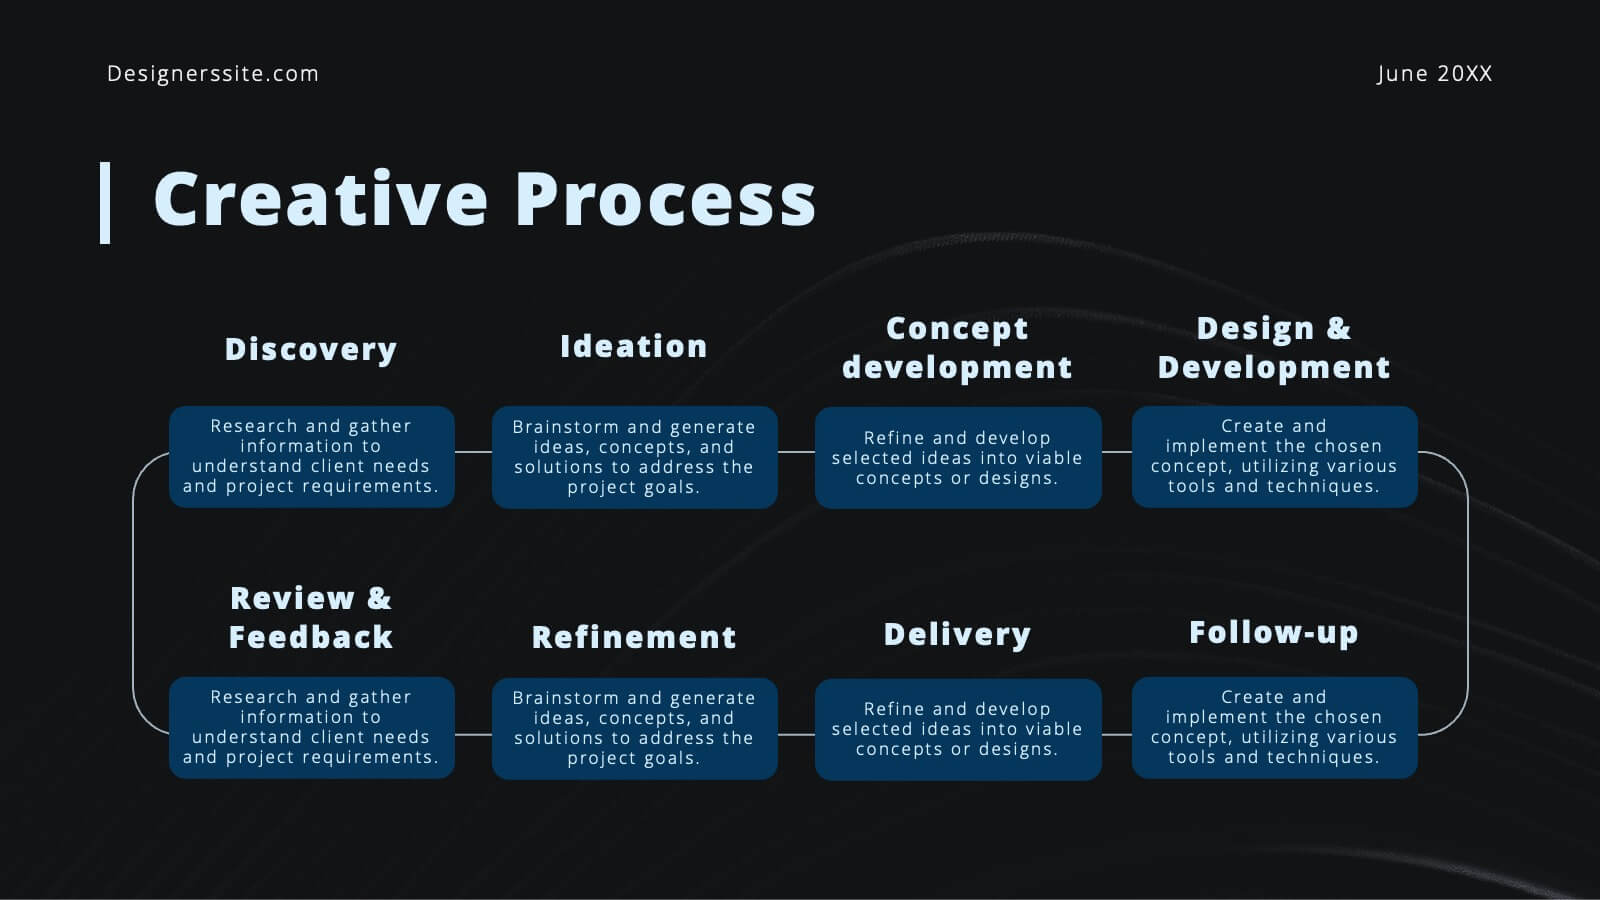
Flare Creative Portfolio Presentation
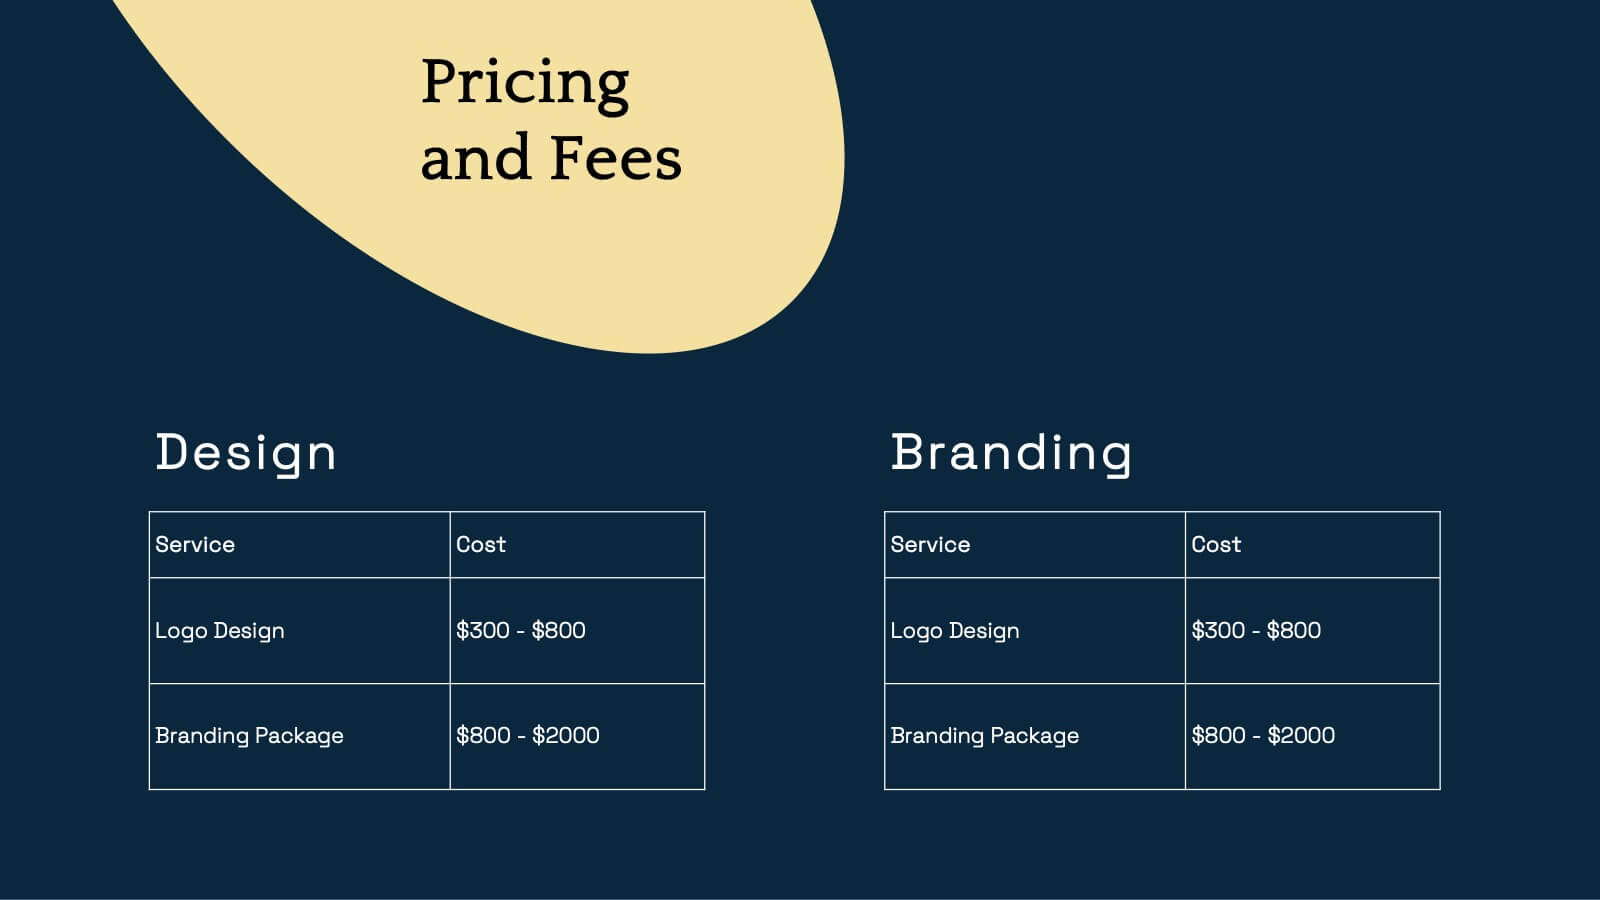
Showcase your creative work with this elegant portfolio template! Perfect for highlighting projects, client testimonials, and services offered. Ideal for artists, designers, and creatives aiming to impress clients and collaborators. Compatible with PowerPoint, Keynote, and Google Slides, this template ensures your portfolio is clear, professional, and visually stunning. Make your work shine!


5 slides
Energy Sources in The United States Infographics
Energy Sources in The United States Infographics is a bold, colorful, and modern presentation


7 slides
Puzzle Communication Infographic
Piece together the art of effective communication with our puzzle communication infographic. Set on a sleek white foundation, complemented by the enigma of purple, the zest of orange, and the passion of red, this template ingeniously utilizes puzzle pieces to symbolize interconnected communication elements. Enhanced with inventive infographics, representative icons, and adjustable image placeholders, it offers a comprehensive exploration of communication dynamics. Exquisitely crafted for Powerpoint, Keynote, or Google Slides. An indispensable tool for communication specialists, team leads, trainers, or anyone keen on enhancing interpersonal exchanges.


5 slides
Comprehensive Sex Education Infographics
Navigate the sensitive landscape of human sexuality education with our comprehensive sex education infographics. Cast on a canvas of bold colors like black, yellow, and red, these infographics delicately handle the topics inherent to sex education. This tool is invaluable for educators, health professionals, advocacy groups, and policymakers who champion for informed, safe, and healthy choices. Compatible with Powerpoint, Keynote, and Google Slides. Ensuring the content resonates with audiences of diverse ages and backgrounds. The inclusion of compelling graphics and intuitive icons, fosters an environment of learning and openness, essential for impactful discussions.


20 slides
Bravo Creative Portfolio Presentation
Showcase your creative prowess with this sleek, modern portfolio presentation template. Perfect for highlighting featured projects, client testimonials, and your creative process, this template ensures your work shines. Its stylish design and professional layout make it ideal for impressing potential clients and collaborators. Compatible with PowerPoint, Keynote, and Google Slides, it's versatile for any platform.


4 slides
Learning Plan Presentation
Kick off your lesson planning with a bright, organized layout that makes learning goals feel simple, structured, and easy to follow. This presentation helps outline steps, milestones, and study priorities in a clear visual format that keeps students or teams on track. Fully compatible with PowerPoint, Keynote, and Google Slides.


3 slides
Introduction to Cryptocurrency Presentation
Step into the future of finance with this sleek, modern template designed to explain digital currencies in a simple, engaging way. Perfect for educators, startups, and analysts, it transforms complex ideas into clear visuals. Fully compatible with PowerPoint, Keynote, and Google Slides for effortless editing and professional presentations.