


Features
- 5 Unique slides
- Fully editable and easy to edit in Microsoft Powerpoint, Keynote and Google Slides
- 16:9 widescreen layout
- Clean and professional designs
- Export to JPG, PDF or send by email


Do you have any questions?
Recommend


4 slides
Vision Statement Slide Presentation
Spark inspiration from the very first slide with a clean, modern layout designed to express future goals with clarity and confidence. This presentation helps teams communicate direction, long-term aspirations, and strategic focus in a simple, structured format. Fully compatible with PowerPoint, Keynote, and Google Slides.


6 slides
Project Timeline and Weekly Schedule Presentation
Plan smarter with the Project Timeline and Weekly Schedule Presentation—a clear, structured template for tracking tasks week by week across multiple projects. Ideal for managers, teams, or freelancers needing a bird’s-eye view of workload distribution. Fully editable for PowerPoint, Keynote, and Google Slides.


8 slides
Social Media Engagement Metrics
Track engagement with clarity using the Social Media Engagement Metrics Presentation. This layout features a smartphone mockup at the center, with four vertically stacked icons representing key engagement indicators. Surrounding the device, space is allocated for concise data insights or definitions labeled A through D. Perfect for presenting analytics like likes, shares, comments, and reach. Fully editable in PowerPoint, Keynote, and Google Slides.


6 slides
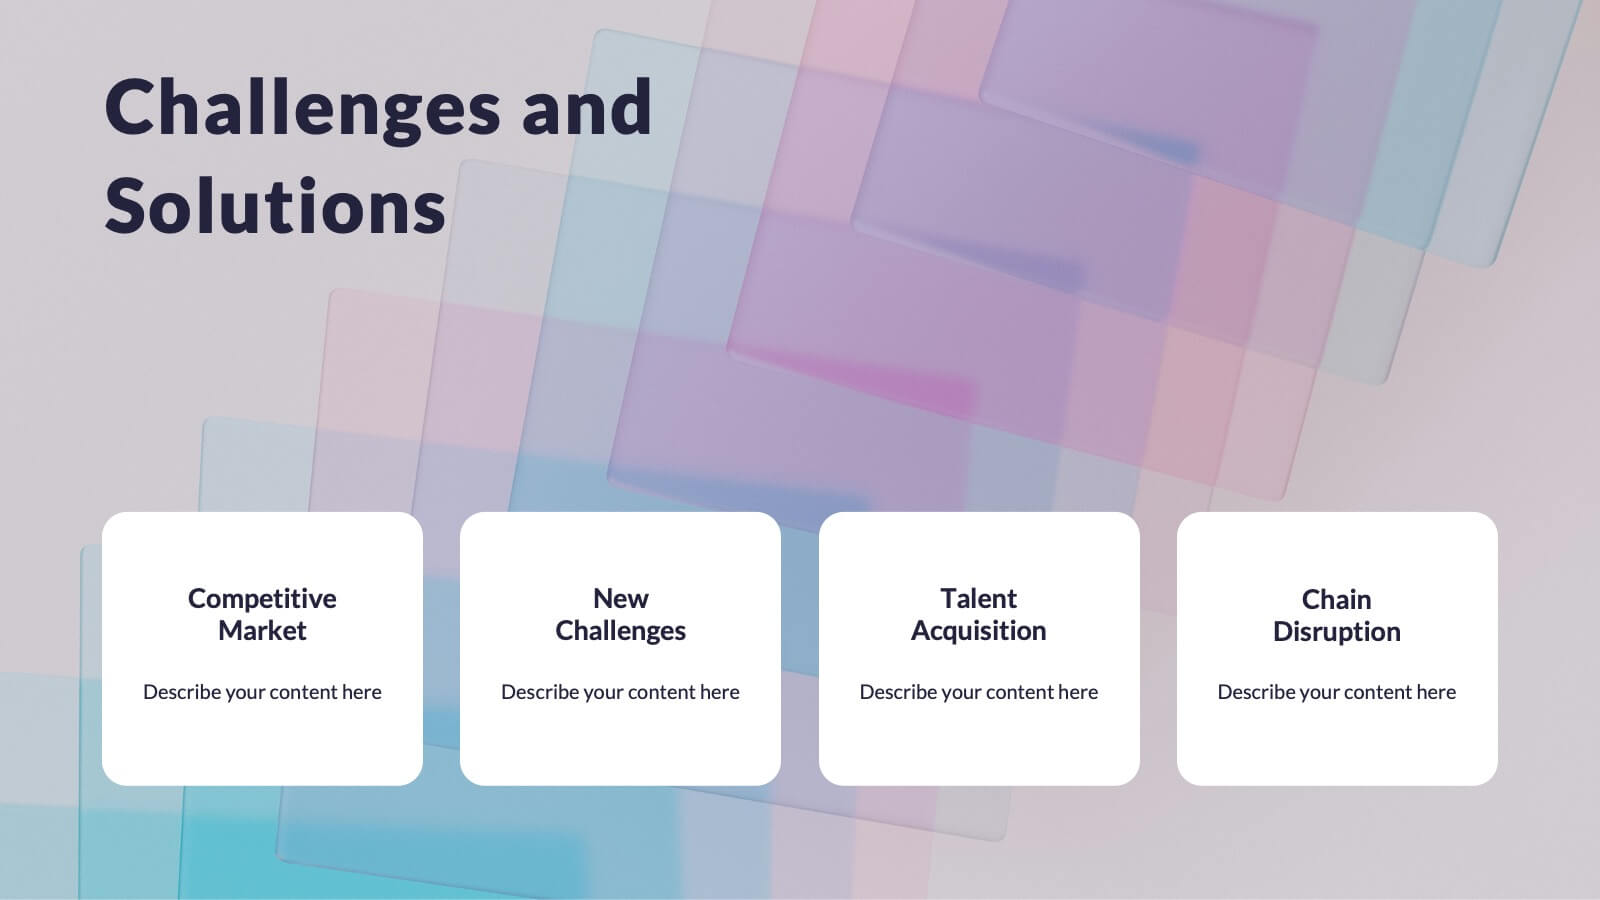
Problem-Solving Framework for Business Success Presentation
Streamline your approach to complex challenges with this 6-step business problem-solving framework. This professional slide layout clearly separates each stage—from identifying the issue to implementing solutions—using easy-to-edit circular markers and concise content boxes. Ideal for consulting pitches, internal planning, or strategy development, this slide is fully customizable in PowerPoint, Keynote, and Google Slides.


8 slides
Meeting Agenda Presentation
Streamline your meeting agendas with our "Meeting Agenda Presentation" template. This design features a central node linked to four key points, each representing a separate agenda item, ensuring a clear and organized discussion flow. Color-coded segments aid in visually distinguishing between topics, making it easy for participants to follow and engage. Ideal for team meetings, project updates, and strategic discussions, this template enhances communication and efficiency. Its intuitive layout keeps your sessions on track and productive. Compatible with PowerPoint, Keynote, and Google Slides, it's an essential tool for any professional aiming to optimize their meeting presentations.


5 slides
Environment News Infographics
Dive into the pressing issues of our times with environment news infographics. Crafted in shades of a serene blue palette, this collection is designed for environmental activists and journalists. It stands out with its creative, vertical style, making it perfect for detailed storytelling and comprehensive data representation related to environmental news and studies. Compatible with Powerpoint, Keynote, and Google Slides. The template features innovative graphics, icons, and image placeholders, all customizable to highlight ecological statistics, climate change advancements, or conservation efforts, making complex information accessible and engaging.


5 slides
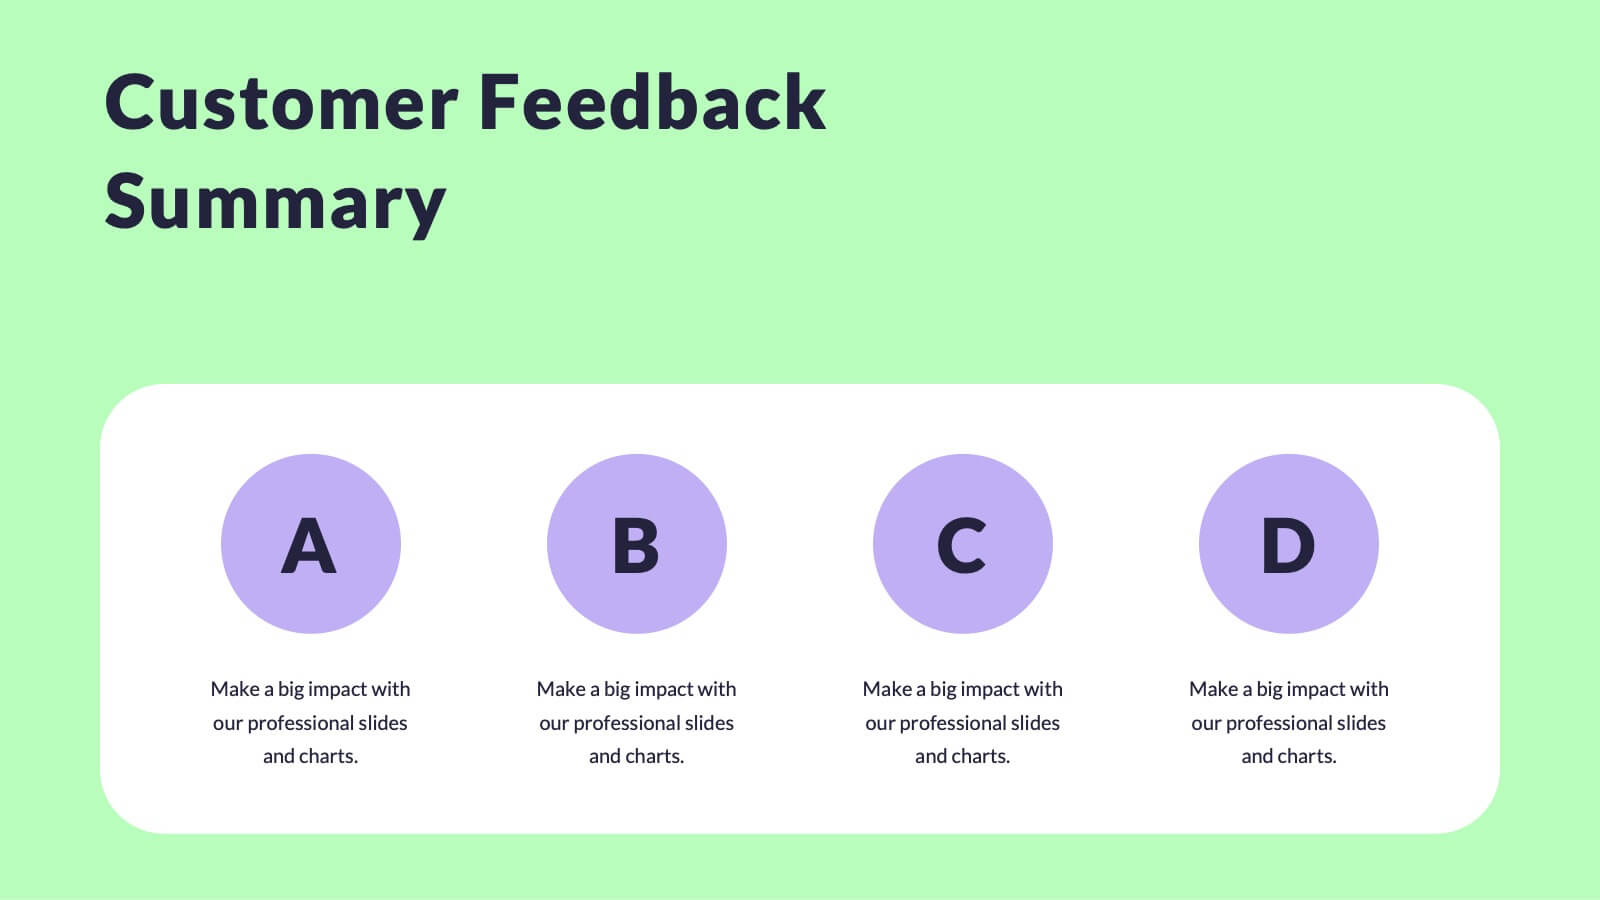
Sports Performance Analysis Presentation
Visualize athletic metrics and improvement strategies with this Sports Performance Analysis slide layout. Designed around a dynamic running figure, it uses labeled circular markers (A–D) to clearly break down four key insights or action points. Perfect for sports reviews, training breakdowns, or coaching sessions. Fully editable in PowerPoint, Keynote, and Google Slides.


20 slides
Moonfern Product Launch Presentation
Introduce your product to the market with confidence using this expertly designed presentation template. Featuring a sleek and modern layout, it covers essential sections such as product overview, target market, and unique selling proposition. Dive into product features, pricing strategy, and competitive analysis to effectively communicate value and strategy. The template also includes slides for marketing plans, distribution channels, and use cases, ensuring a comprehensive approach to your launch. Perfect for PowerPoint, Google Slides, and Keynote, it allows for easy customization, ensuring your presentation aligns seamlessly with your branding and goals.


7 slides
Modern Artificial Intelligence Infographic
Modern Artificial Intelligence refers to the contemporary state of AI technology, methods, and applications that have evolved significantly in recent years, especially from the early 21st century onwards. This infographic template is designed to present complex information in a clear and engaging manner. This template uses visuals like charts, graphs, icons, and text to enhance understanding. The objective of this infographic is to provide a visual and informative snapshot of the contemporary landscape of artificial intelligence, making complex concepts accessible to a broad audience.


10 slides
Conceptual Mind Map for Projects
Illuminate your strategy with the Conceptual Mind Map for Projects Presentation. Designed in the shape of a lightbulb, this diagram visually connects five key project concepts to a central idea, perfect for presenting innovation, team workflows, or business planning. Easily editable in PowerPoint, Keynote, or Google Slides to suit any industry or audience.


7 slides
Master Six Sigma Infographic Presentation
Six Sigma is a methodology used by organizations to improve their business processes and eliminate defects. Use this template to explore the key concepts of Six Sigma and how it can be applied in different industries. This templates include helpful illustrations, charts and tips which allow you to present information in a clear and concise way that makes it easy for your audience to understand and take notes. This template has been made using modern fonts, appealing color combinations and simple layouts. The clean and simple design is compatible with Powerpoint, Keynote and Google Slides.


14 slides
Agenda Institutional Infographic
Our institutional agenda slide templates are meticulously designed to cater to educational institutions, government bodies, and other large organizations. These templates help in organizing and presenting meeting agendas to ensure clear communication and systematic discussion of points in large-scale meetings. These templates feature a range of designs from sleek, modern minimalist styles to more structured and detailed layouts that incorporate elements like timelines, photo placeholders, and detailed text areas. They are perfect for outlining the sequence of topics, discussion points, key speakers, and timelines, enhancing both preparation and participation during institutional meetings. Fully editable and adaptable, these templates can be tailored to match the specific branding and communication styles of your institution. The varied designs ensure that there is a template to fit the unique needs of different types of meetings, whether it's a board meeting, a faculty gathering, or an inter-departmental committee.


6 slides
Digital Mockup Infographic
This collection of digital mockup templates is expertly designed to showcase your digital products and services with clarity and impact. Whether you are presenting an app, website, or any other digital interface, these templates provide the perfect backdrop, illustrating how your designs perform across different devices such as smartphones, tablets, and desktop computers. The clean, modern aesthetic of each mockup is coupled with a user-friendly layout that emphasizes ease of use and visual appeal. The subtle color palettes and strategic use of space ensure that your product stands out, making these mockups a valuable tool for professionals in software development, digital marketing, and graphic design. Customizable elements allow you to adapt each template to fit your specific project needs, making it straightforward to insert your own screenshots and text. Use these mockups in client presentations, marketing materials, or portfolio showcases to communicate the functionality and aesthetics of your digital products effectively.


6 slides
Breast Cancer Effects Infographic
Breast Cancer Awareness Month, is an annual international health campaign organized by various organizations to raise awareness about breast cancer, highlight the importance of early detection and treatment, and provide support for those affected by the disease. This infographic template is a visual representation that provides information about the various effects and impacts of breast cancer on individuals' health, well-being, and daily lives. This infographic can be used to raise awareness, educate, and support individuals who are affected by breast cancer, as well as their families and communities.


22 slides
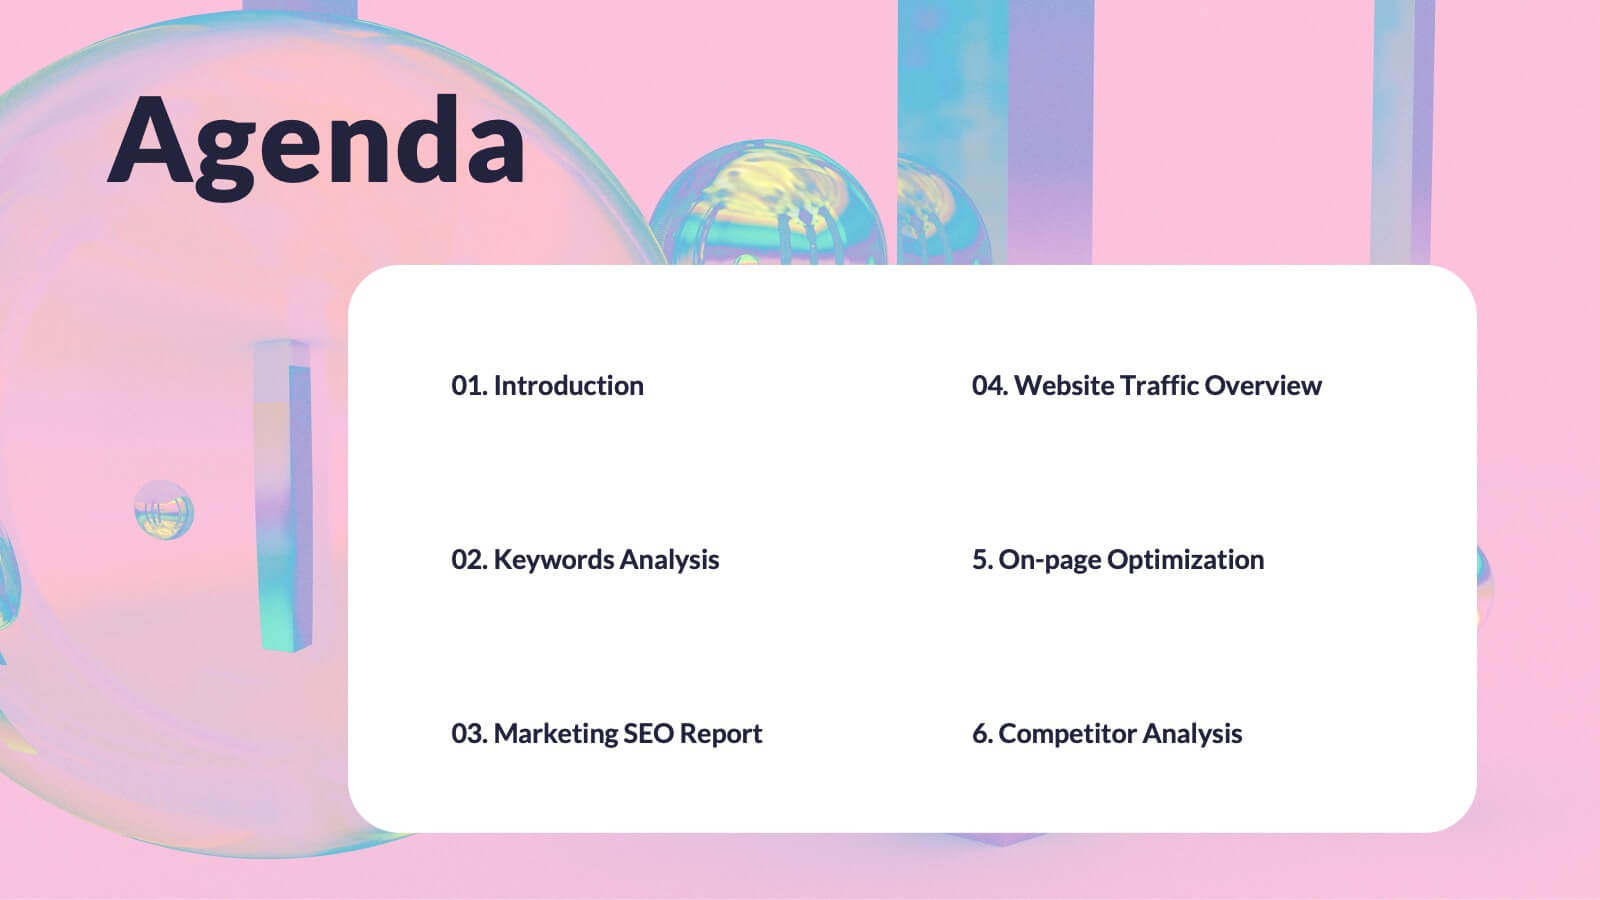
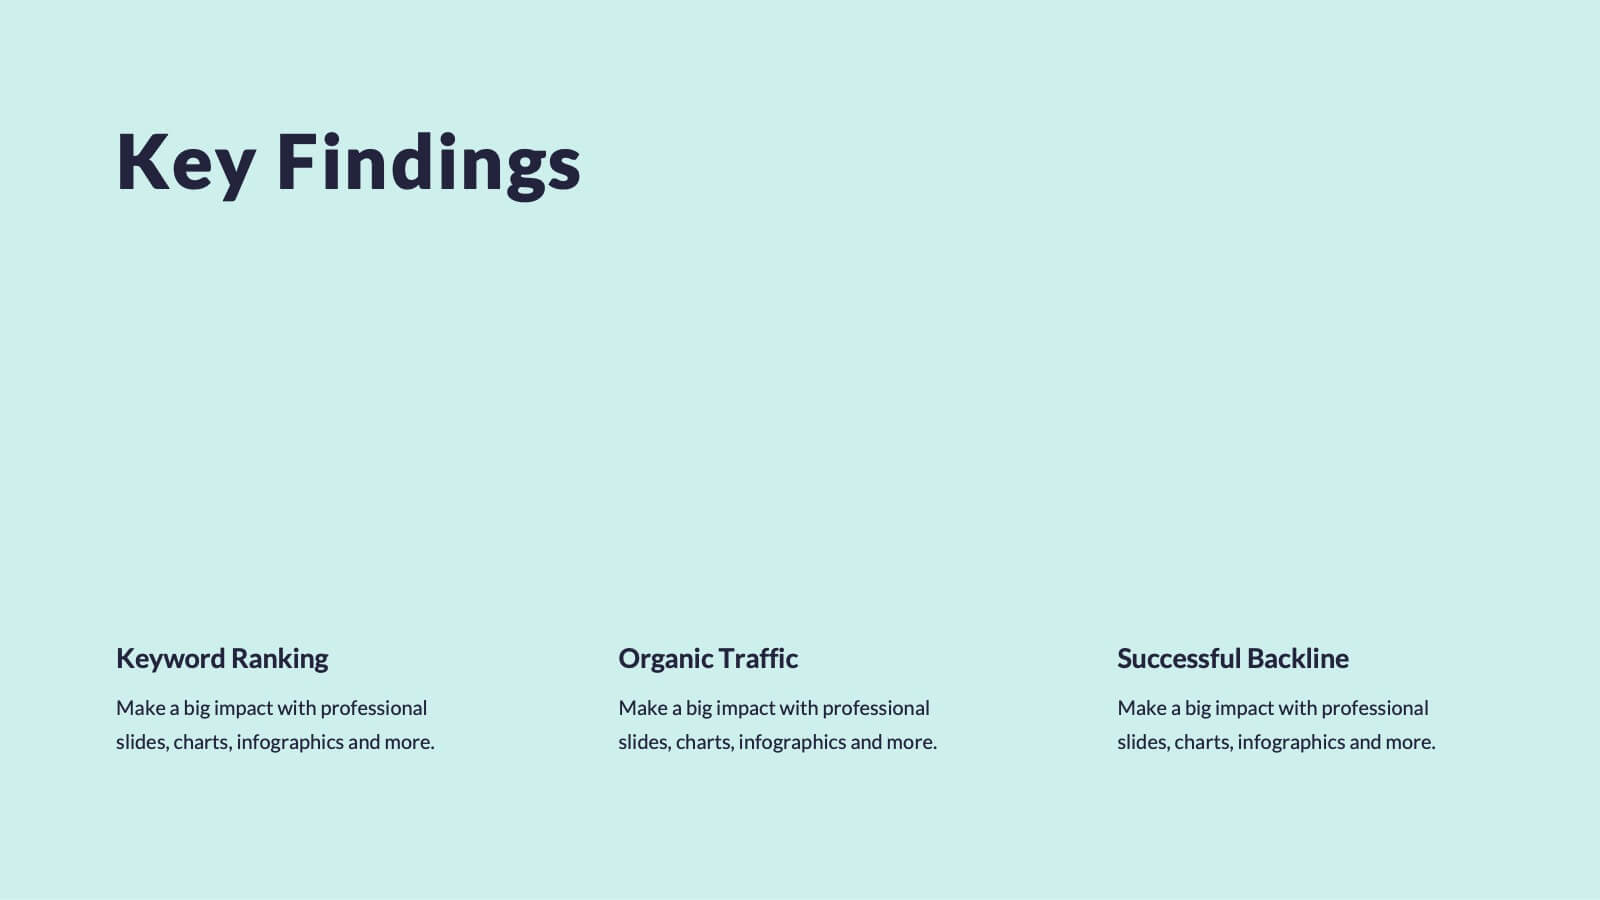
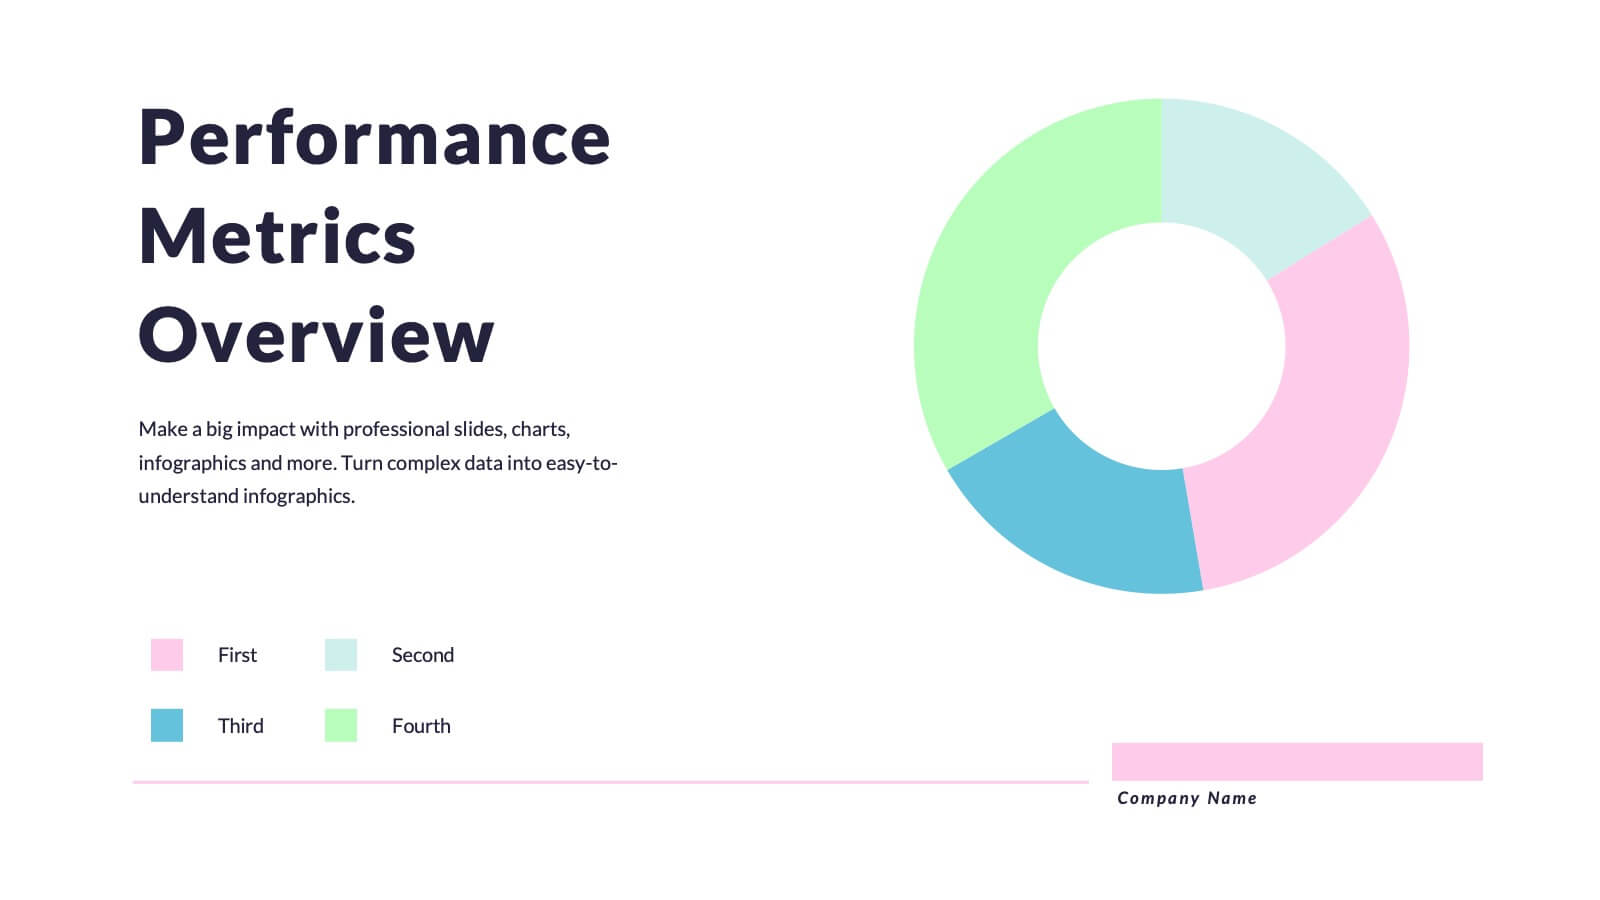
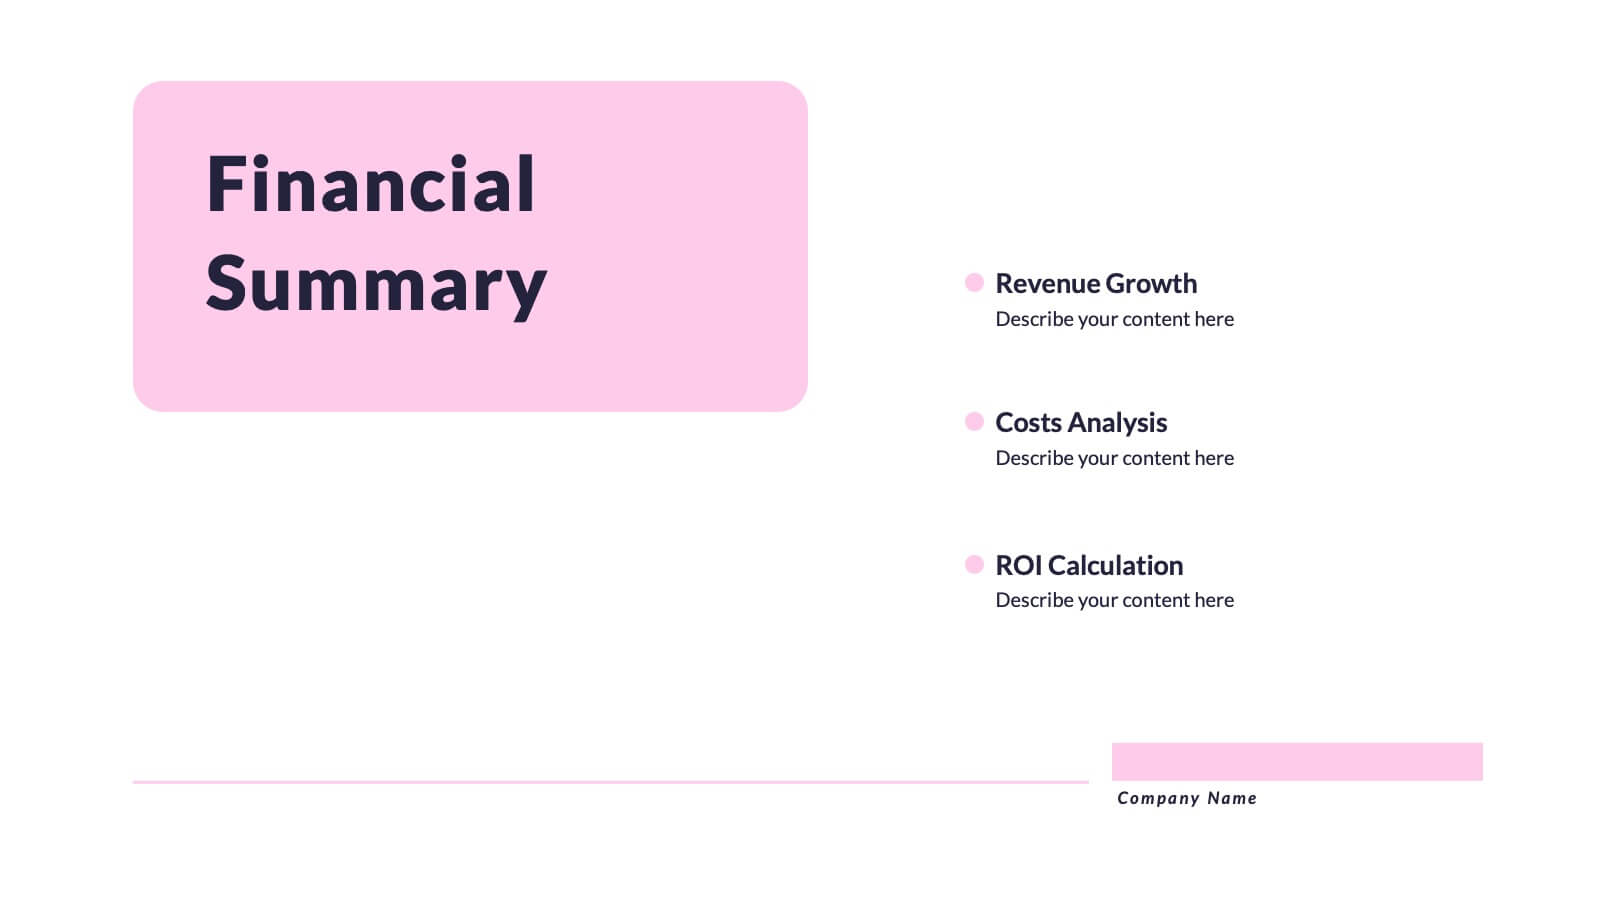
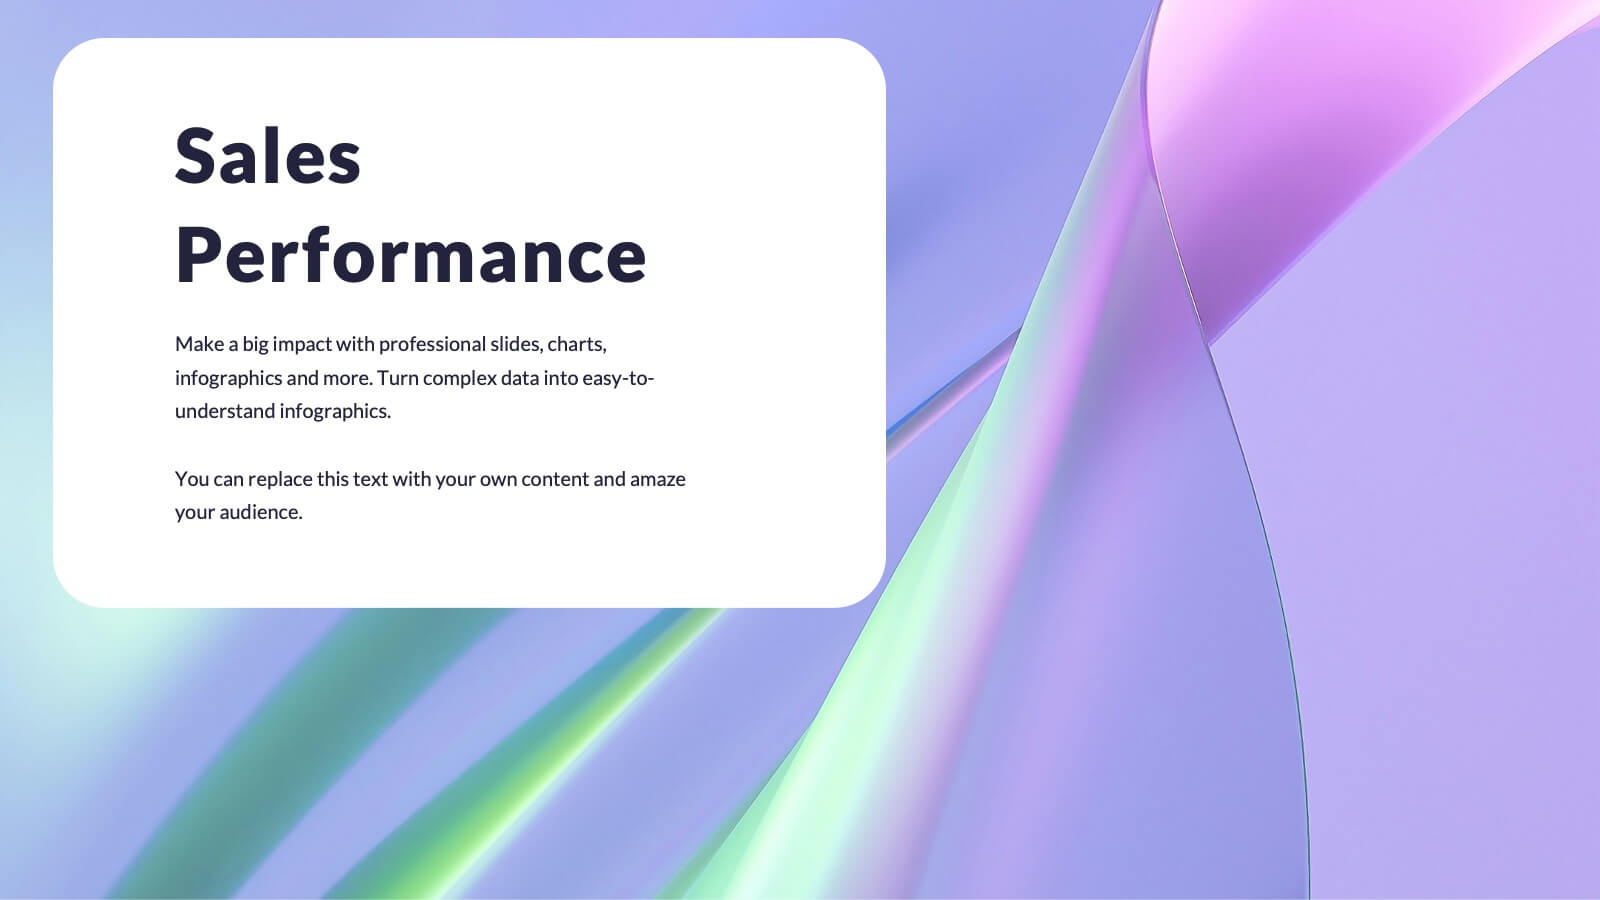
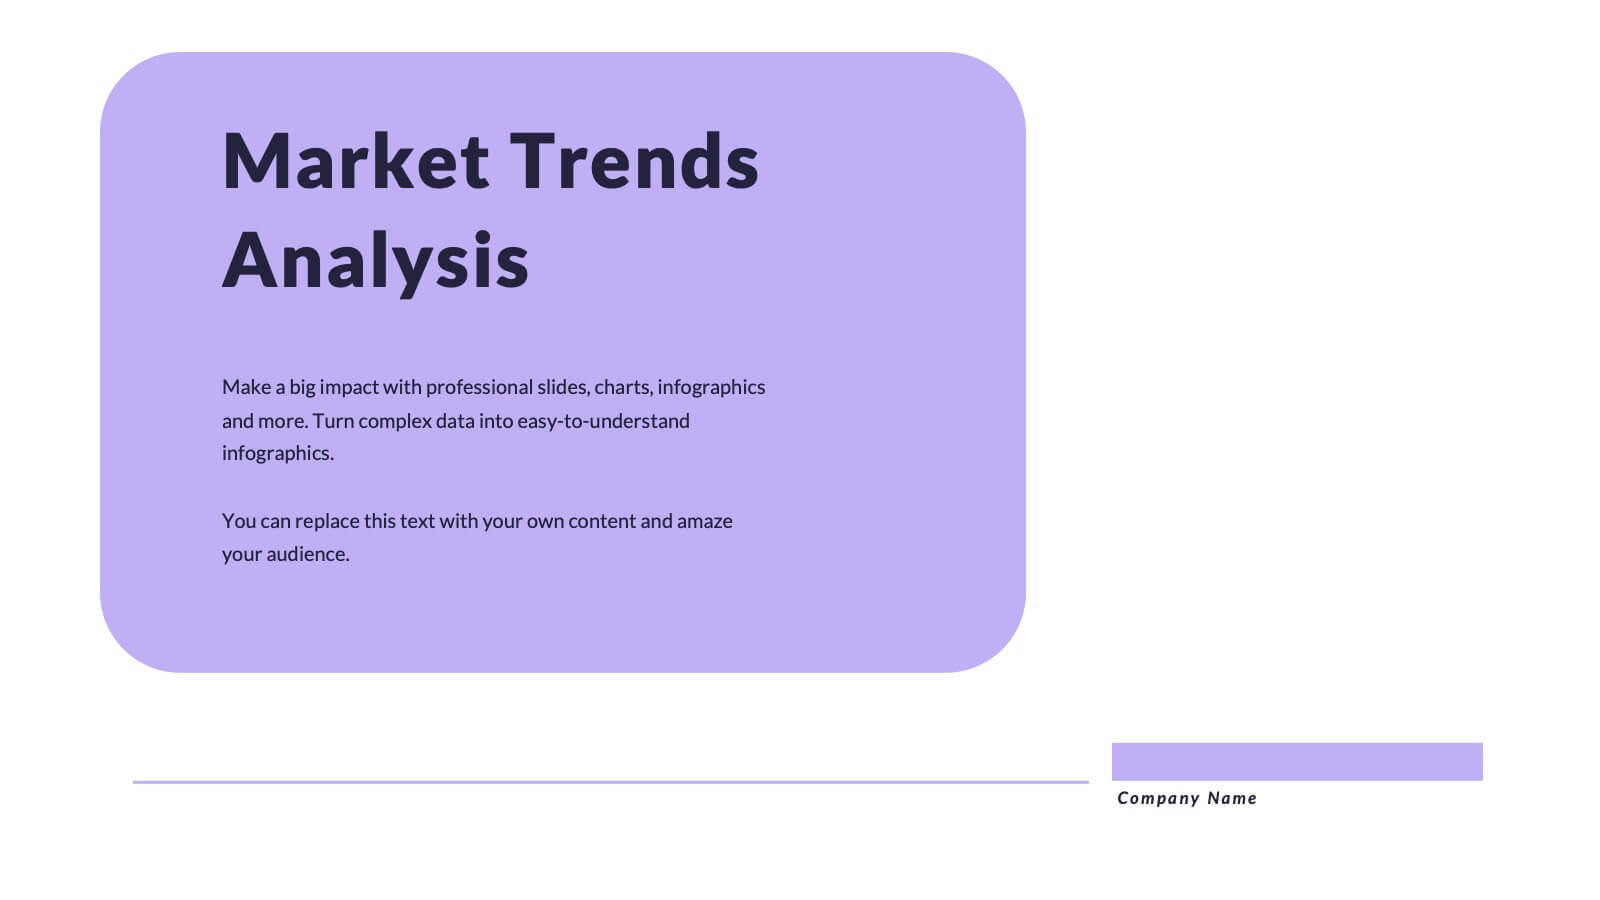
Quantum Research Findings Report Presentation
Discover insights like never before with this vibrant presentation template! Perfect for showcasing research findings, it includes slides for key findings, performance metrics, and market trends. Clearly present data and engage your audience with visually appealing graphics. Compatible with PowerPoint, Keynote, and Google Slides, making it easy to use on any platform.


7 slides
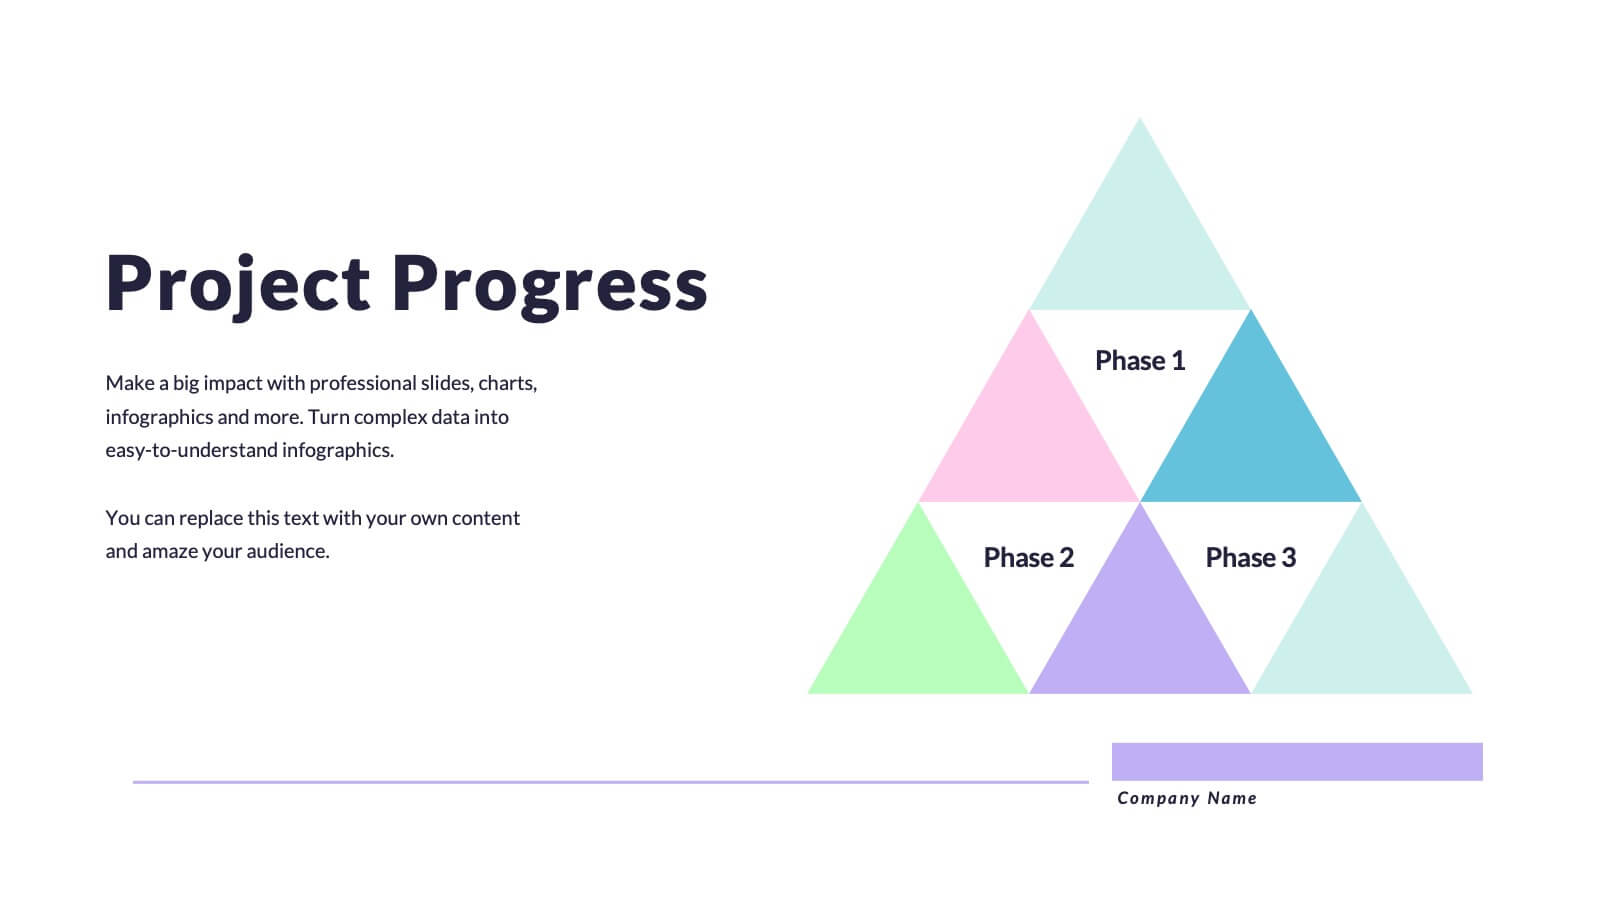
Product Roadmap Infographic Presentation
A well-designed Roadmap infographic can be a powerful tool used to communicate your vision. This template highlights important dates, objectives and milestones to achieve over a period of time. The roadmap provides a clear view of what needs to be done, and when it needs to be done. This template is fully editable in PowerPoint, Keynote and Google Slides, making it easily personalized and customized to suit your project needs. Use this roadmap infographic to help you display a plan for accomplishing a long-term goal, and communicate your vision in an appealing and memorable way!


4 slides
Startup Investor Pitch Deck
Command investor attention with this dynamic Startup Pitch Deck slide. Featuring bold metrics, sleek data visualizations, and clean typography, it's designed to highlight growth and business potential. Fully editable in PowerPoint, Keynote, and Google Slides—ideal for tech, finance, and innovation-driven startups.