


Features
- 6 Unique slides
- Fully editable and easy to edit in Microsoft Powerpoint, Keynote and Google Slides
- 16:9 widescreen layout
- Clean and professional designs
- Export to JPG, PDF or send by email


Do you have any questions?
Recommend


5 slides
Step-by-Step Flow Diagram Presentation
Bring clarity to every stage of your process with a clean, easy-to-follow visual path that guides your audience step by step. This presentation helps simplify workflows, instructions, and project milestones in a structured, approachable layout. Fully compatible with PowerPoint, Keynote, and Google Slides.


7 slides
Solution Infographics Presentation Template
Featuring our solution Infographic template, We have a solution for your presentation problems. Give your next presentation the edge with this template, that allows you to present the perfect solutions to your audience. All the content is completely customizable and the built-in icons can be replaced with your own text and illustrations. Choose from the various themes available, and make it fit your needs. This template contains all the elements needed to make your infographic presentation pop! graphs, photos and a minimal style makes this design perfect for any kind of project.


7 slides
Travel Agency Infographic
A travel agency is a business that assists individuals or groups in planning, booking, and organizing travel and vacation experiences. This infographic template is designed to showcase the magic of travel and the essential services provided by travel agencies. This template is perfect for inspiring wanderlust and aiding travelers in planning their dream adventures. The primary goal is to make your travel planning process easier and more convenient for your audience. Compatible with Powerpoint, Keynote, and Google Slides. This template is your gateway to a world of exciting adventures and seamless travel planning.


21 slides
Moonshade Strategic Planning Report Presentation
This strategic planning template provides a comprehensive framework to align your business objectives with actionable plans. With sections for SWOT analysis, resource allocation, key metrics, and growth opportunities, it ensures that every element is covered for successful execution. Customizable in PowerPoint, Keynote, and Google Slides, it's perfect for building focused, strategic initiatives.


26 slides
Flyx Presentation Template
Flyx is a perfect modern template for you that is very easy to use. This template has a simple, clean, and basic design with high quality illustrations. It can be used for small businesses to large corporate companies and personal use as well. The design is minimal with white and different colors giving it a fresh look. Flyx is easy to edit and is perfect for branding presentations, you can change the colors with just one simple click. Pictures and charts are also made for easy editing as well as easy readability without too much confusion on reading. This template is easy to use and high quality making it suitable for all types of businesses. It is easy to create this modern and bold presentation that will deliver your message with an impact.


10 slides
Step-by-Step Customer Lifecycle
Clearly outline each phase of your customer journey with the Step-by-Step Customer Lifecycle Presentation. This slide template features a circular flow layout with five distinct stages, making it ideal for showcasing onboarding, engagement, retention, and loyalty strategies. Customize the icons, titles, and descriptions to match your brand message. Fully editable in PowerPoint, Keynote, and Google Slides.


7 slides
Puzzle Communication Infographic
Piece together the art of effective communication with our puzzle communication infographic. Set on a sleek white foundation, complemented by the enigma of purple, the zest of orange, and the passion of red, this template ingeniously utilizes puzzle pieces to symbolize interconnected communication elements. Enhanced with inventive infographics, representative icons, and adjustable image placeholders, it offers a comprehensive exploration of communication dynamics. Exquisitely crafted for Powerpoint, Keynote, or Google Slides. An indispensable tool for communication specialists, team leads, trainers, or anyone keen on enhancing interpersonal exchanges.

20 slides
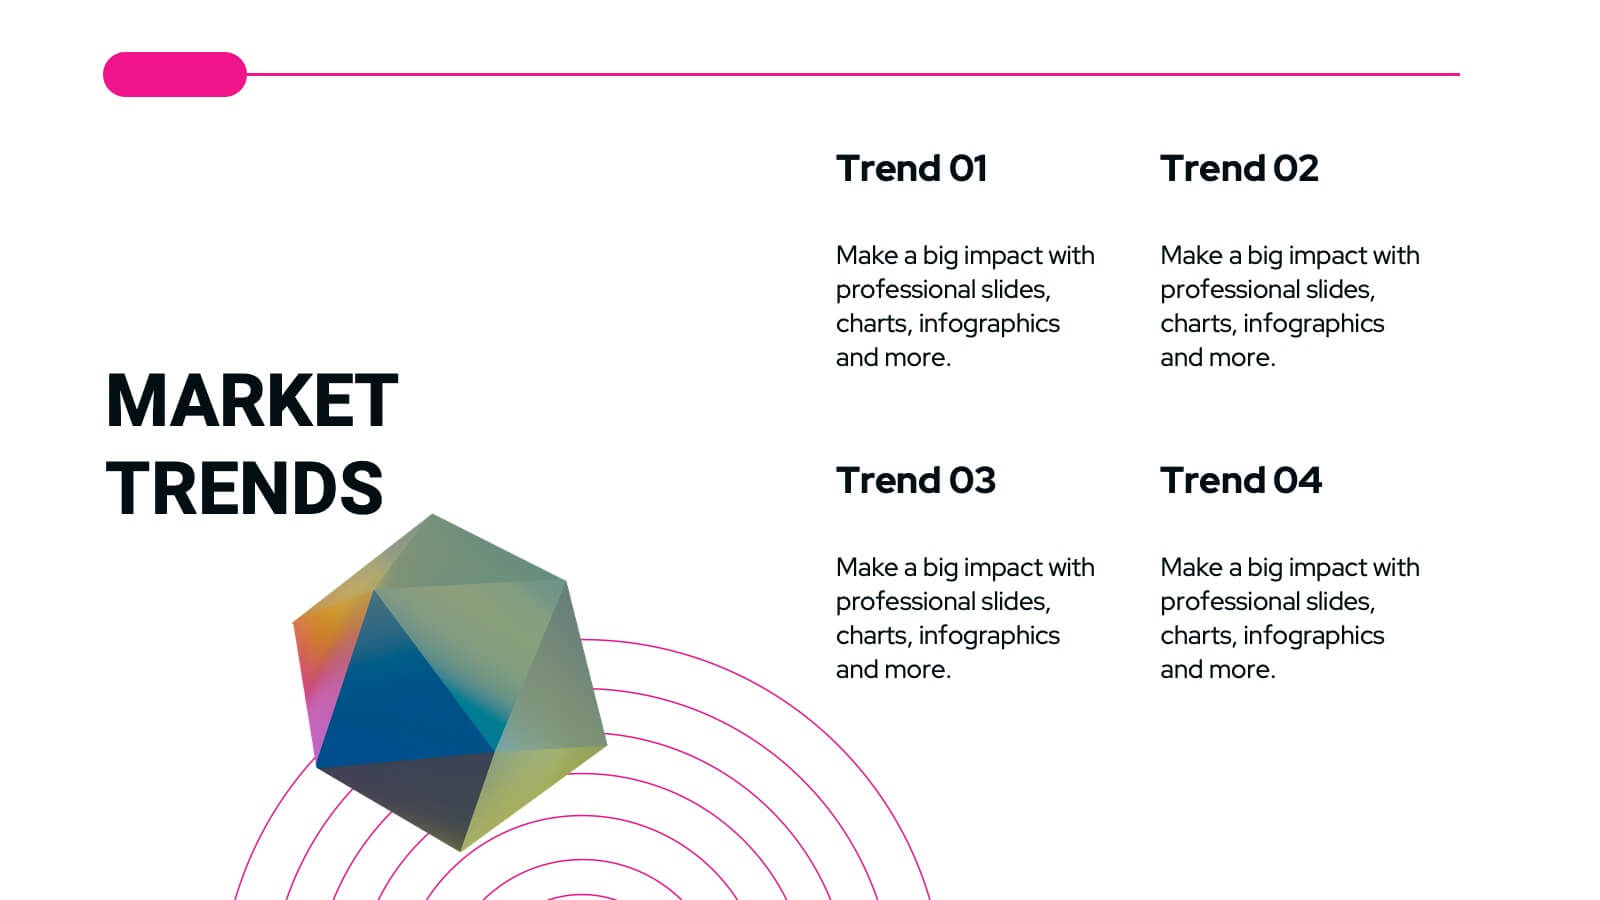
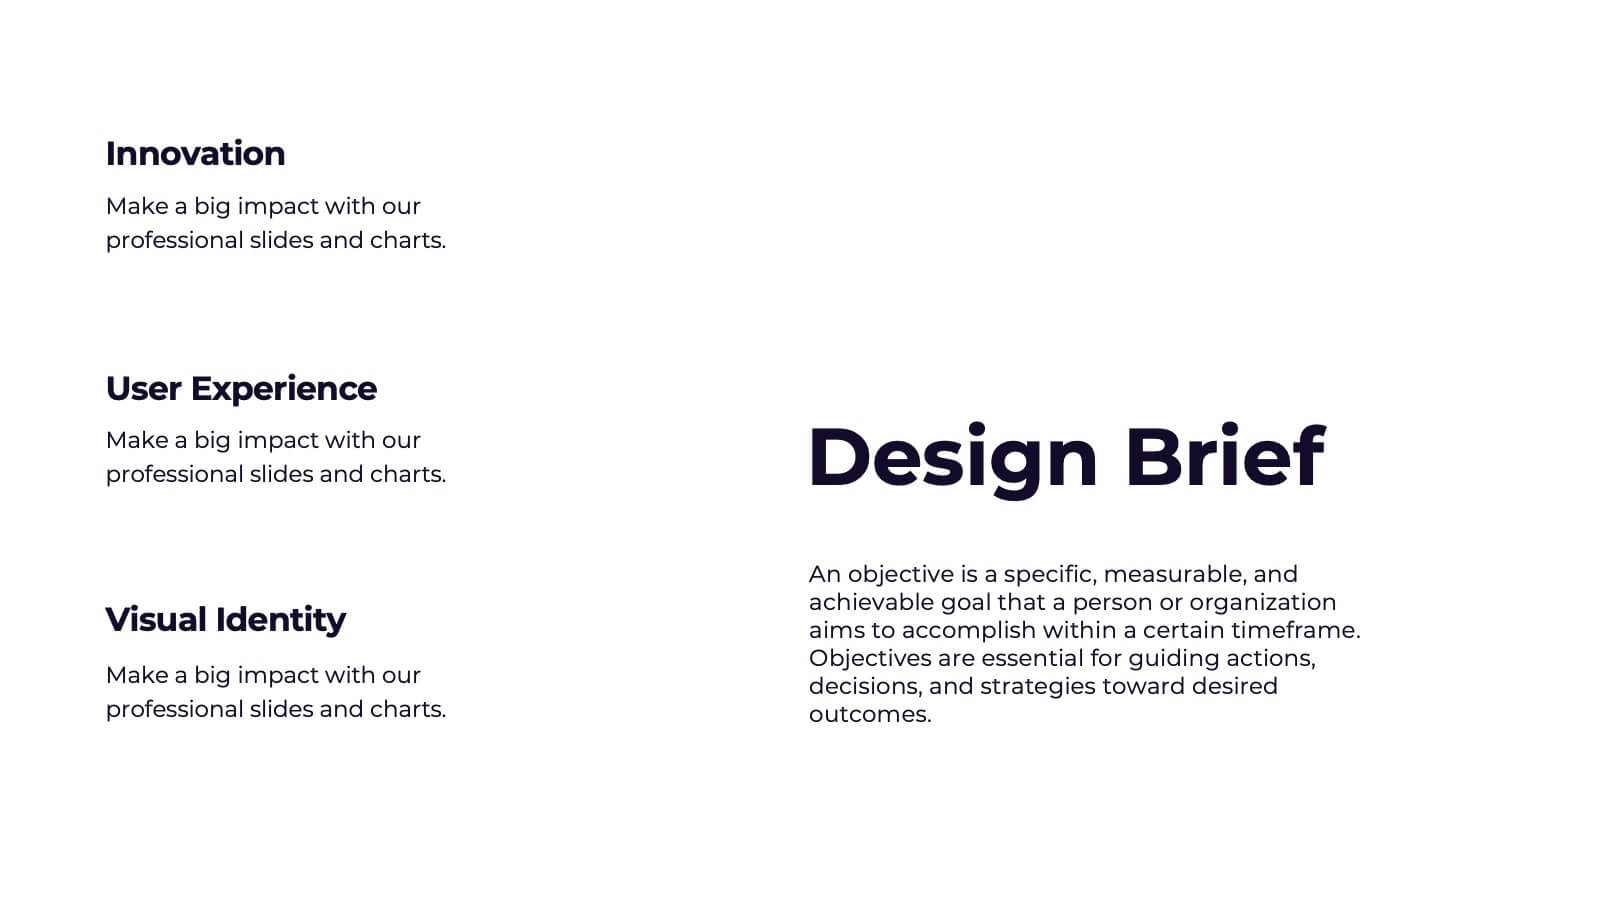
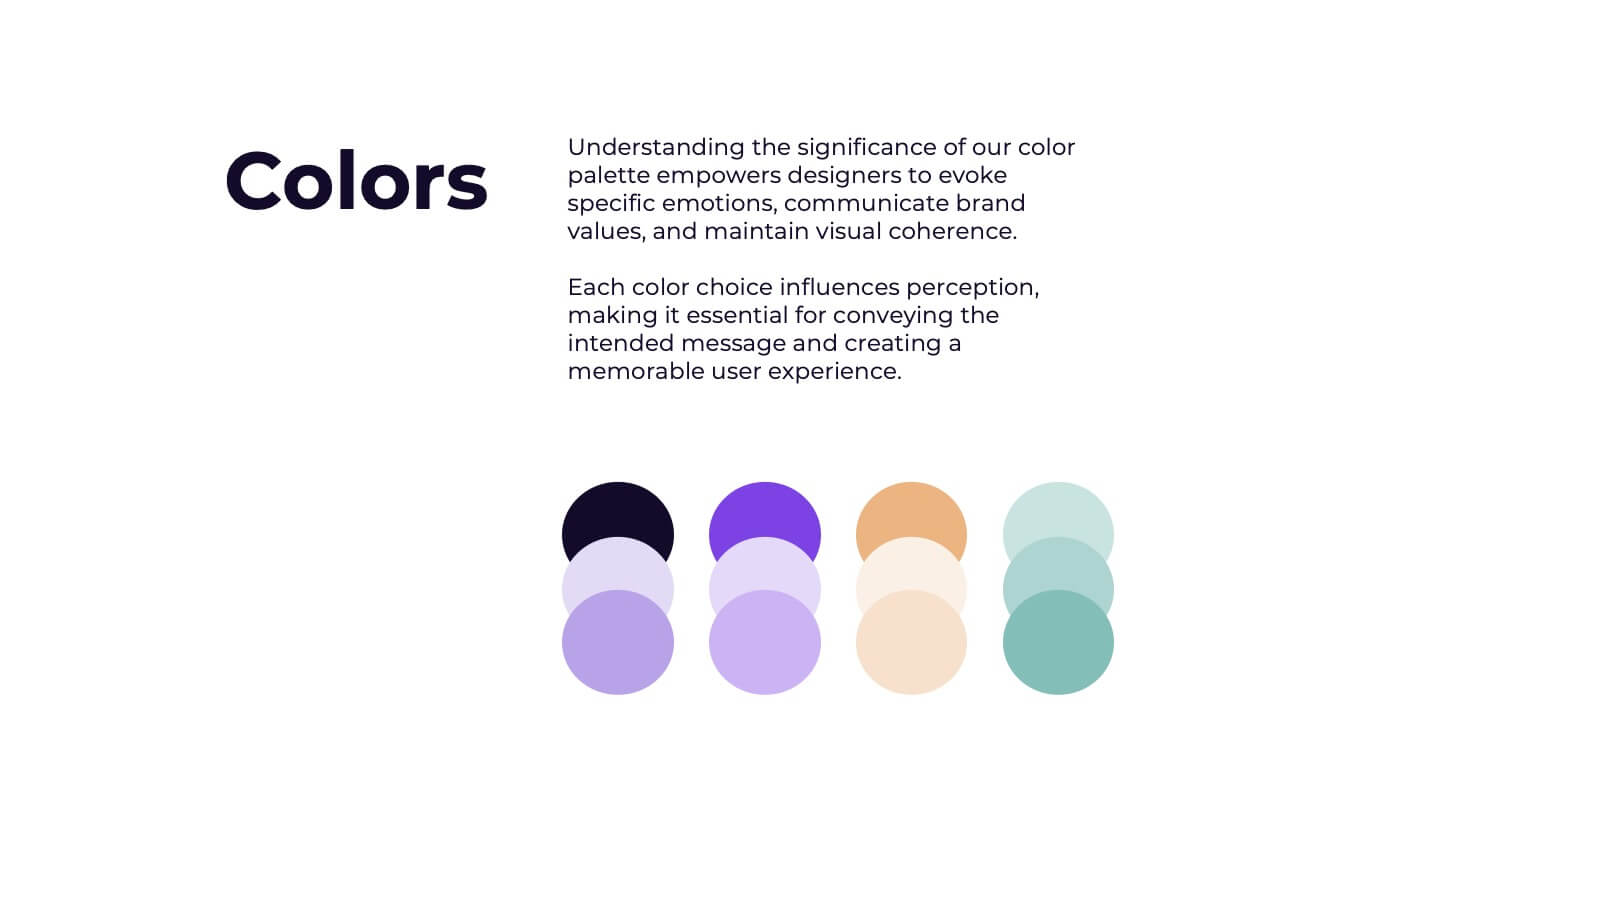
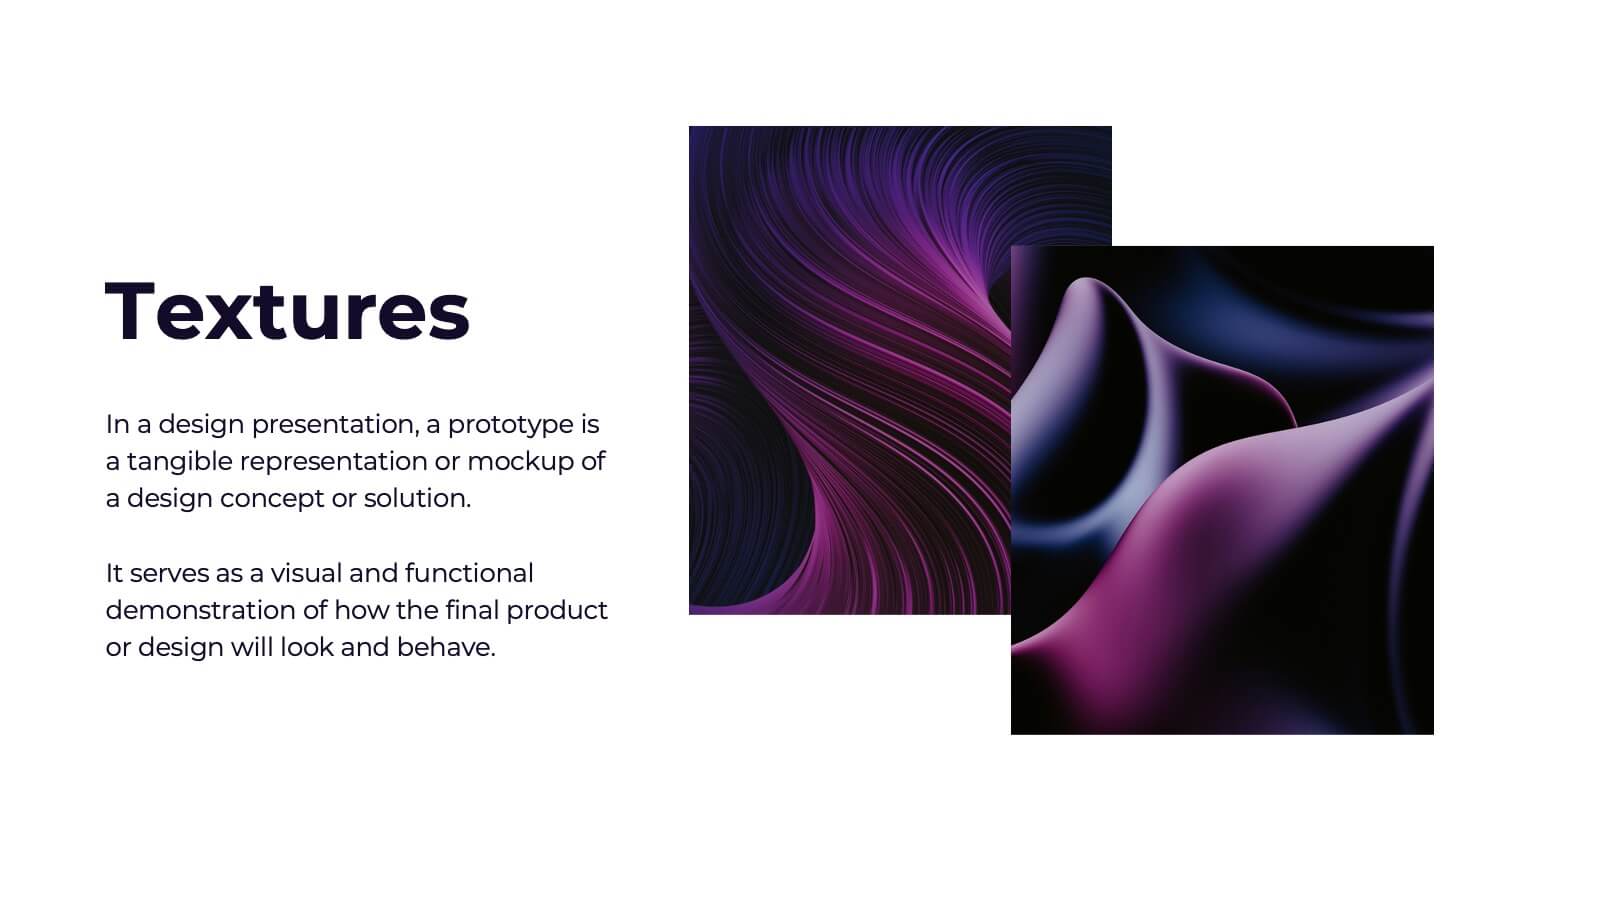
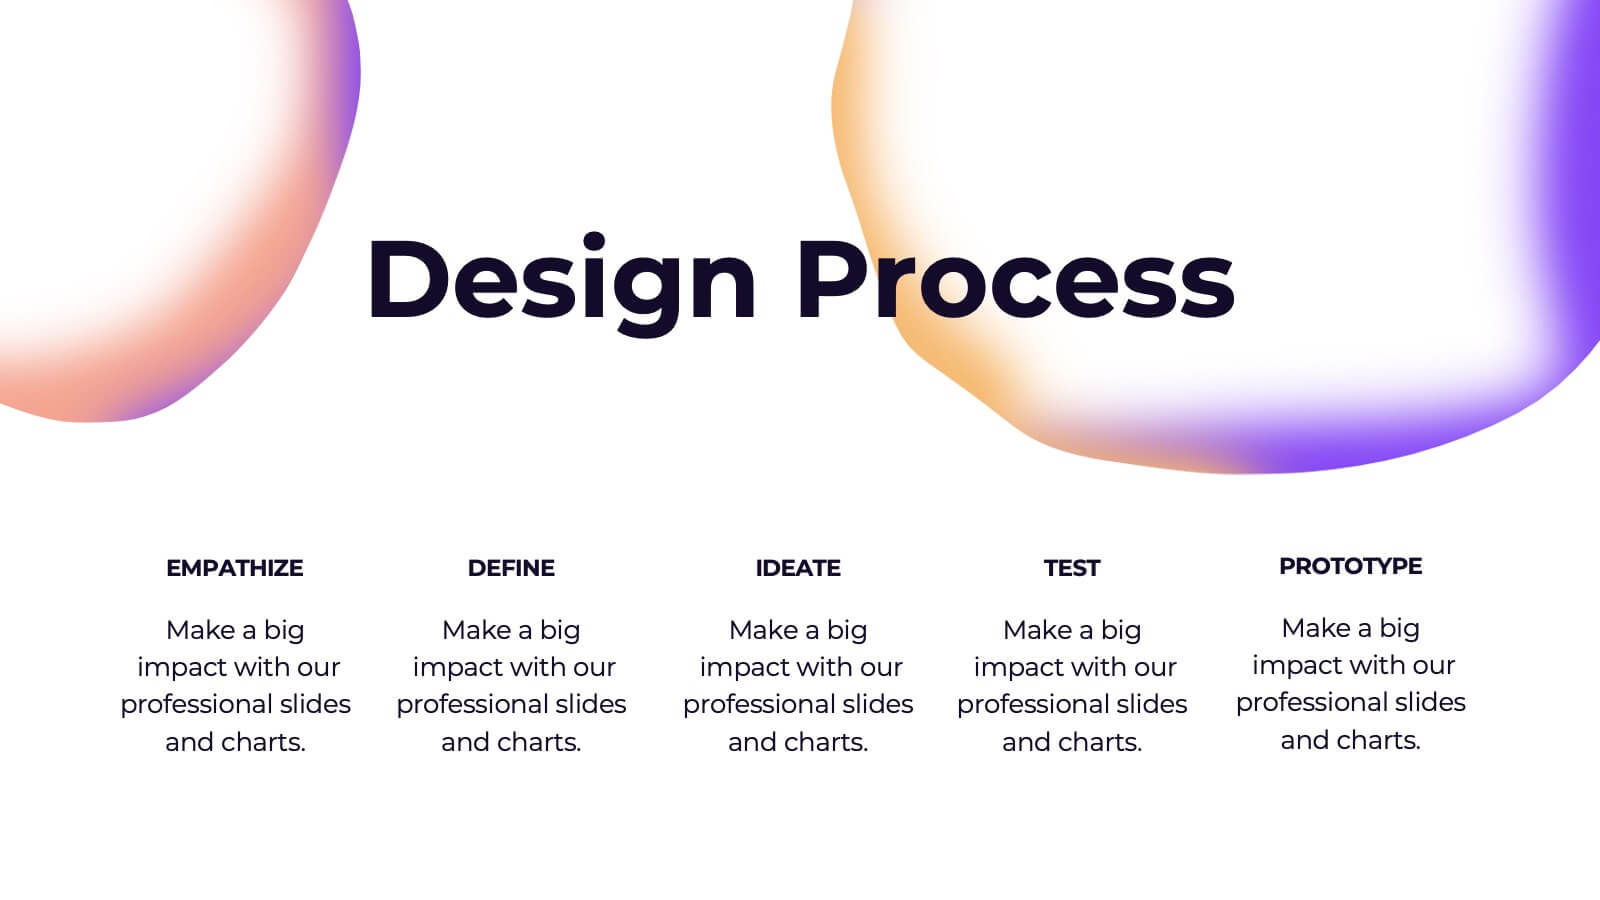
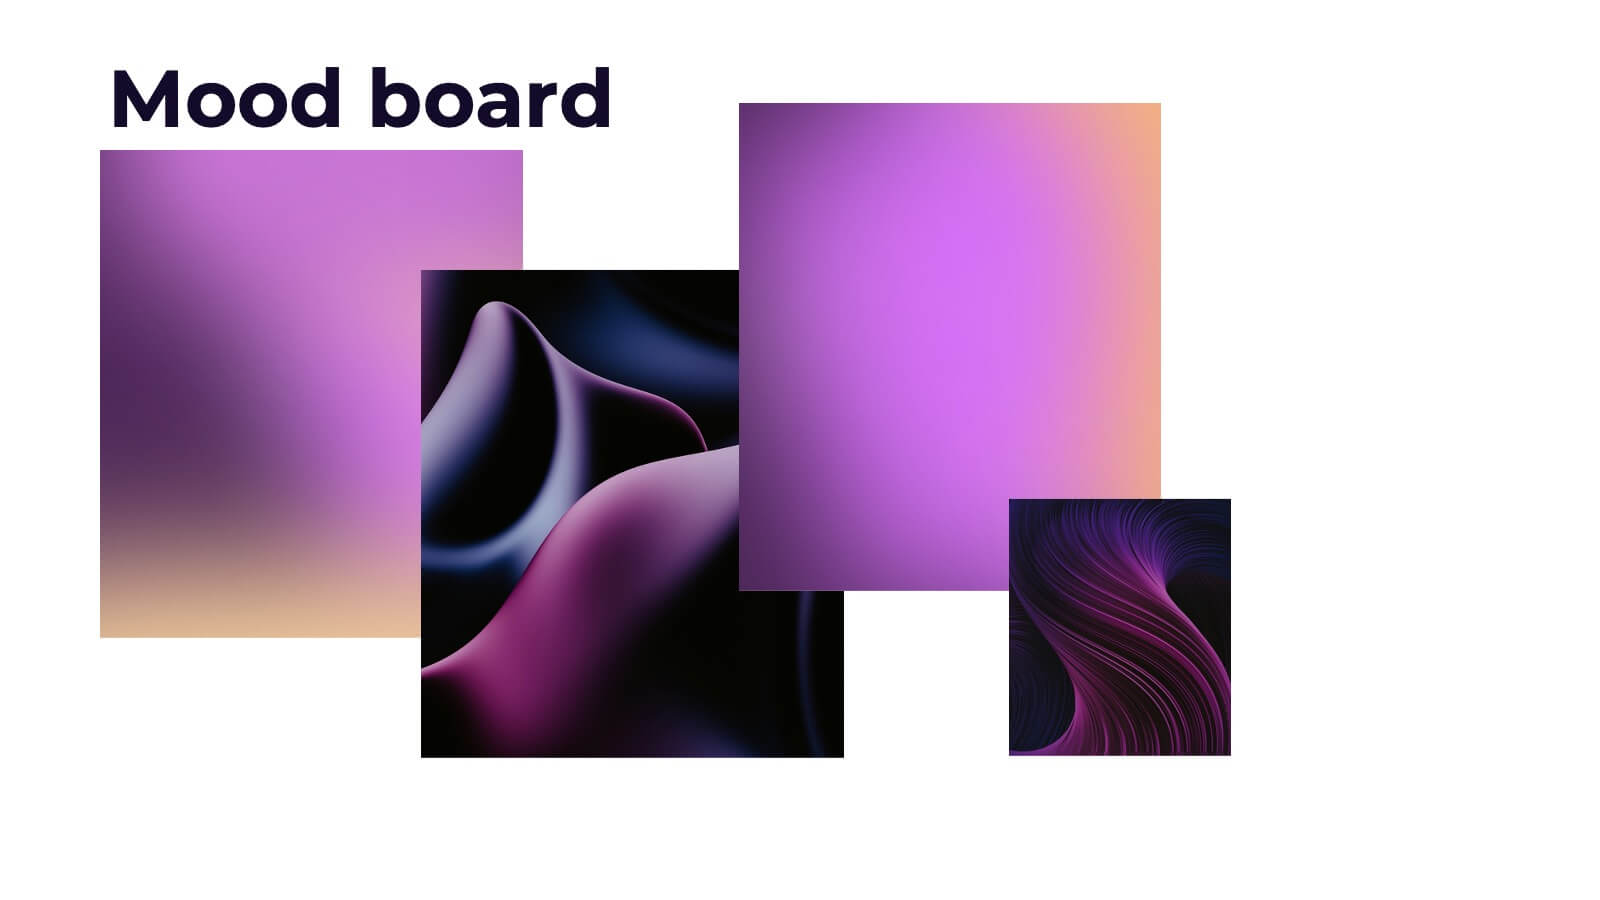
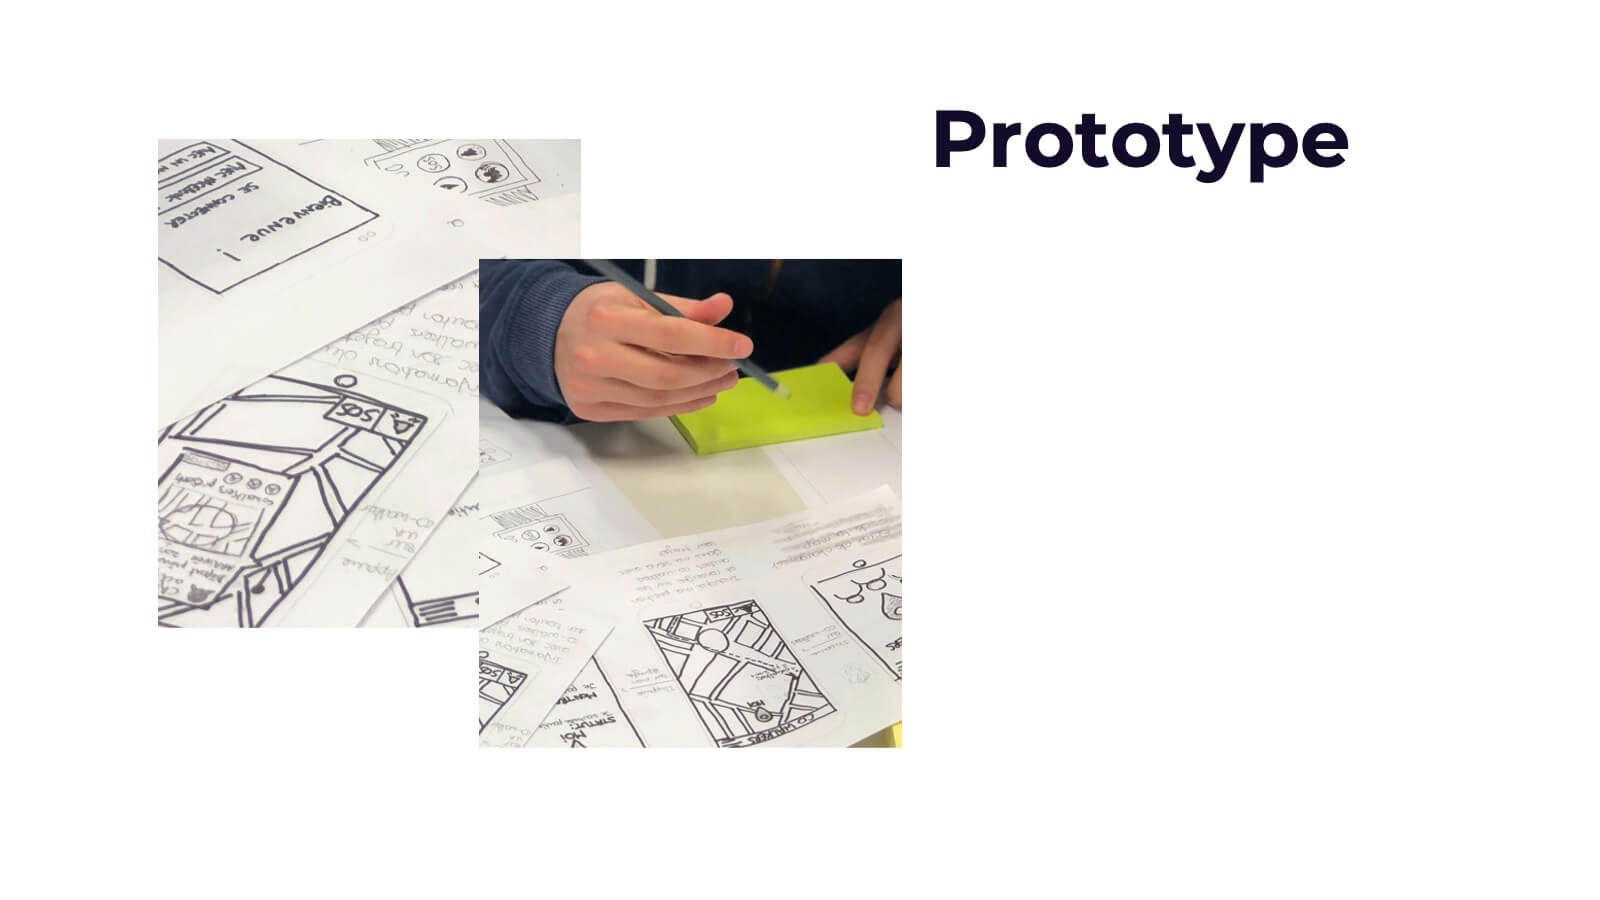
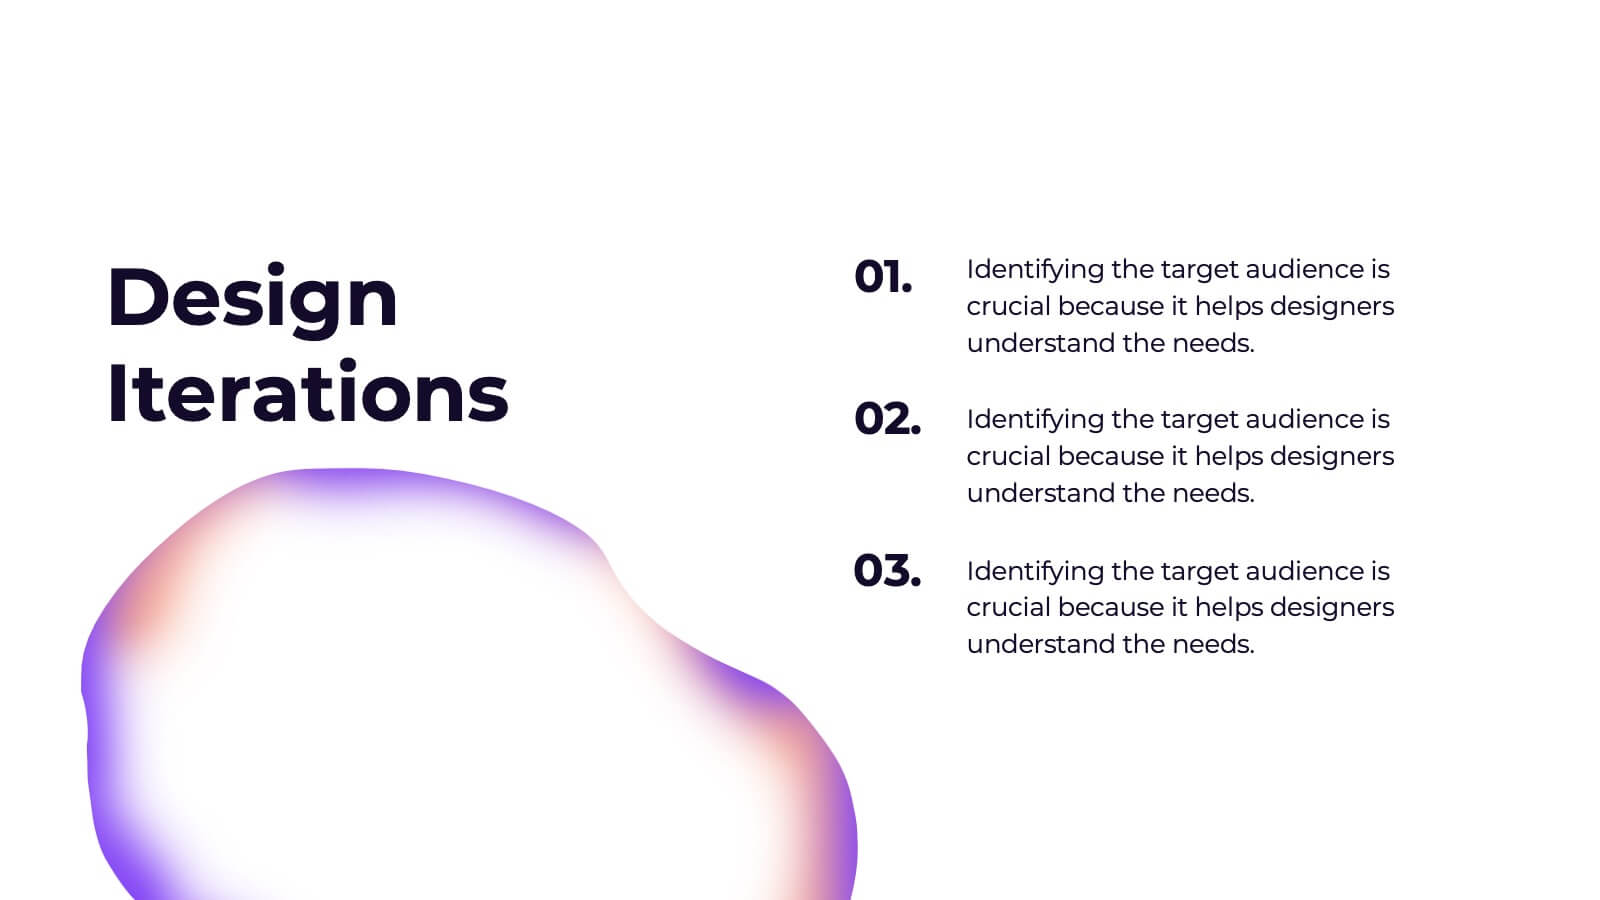
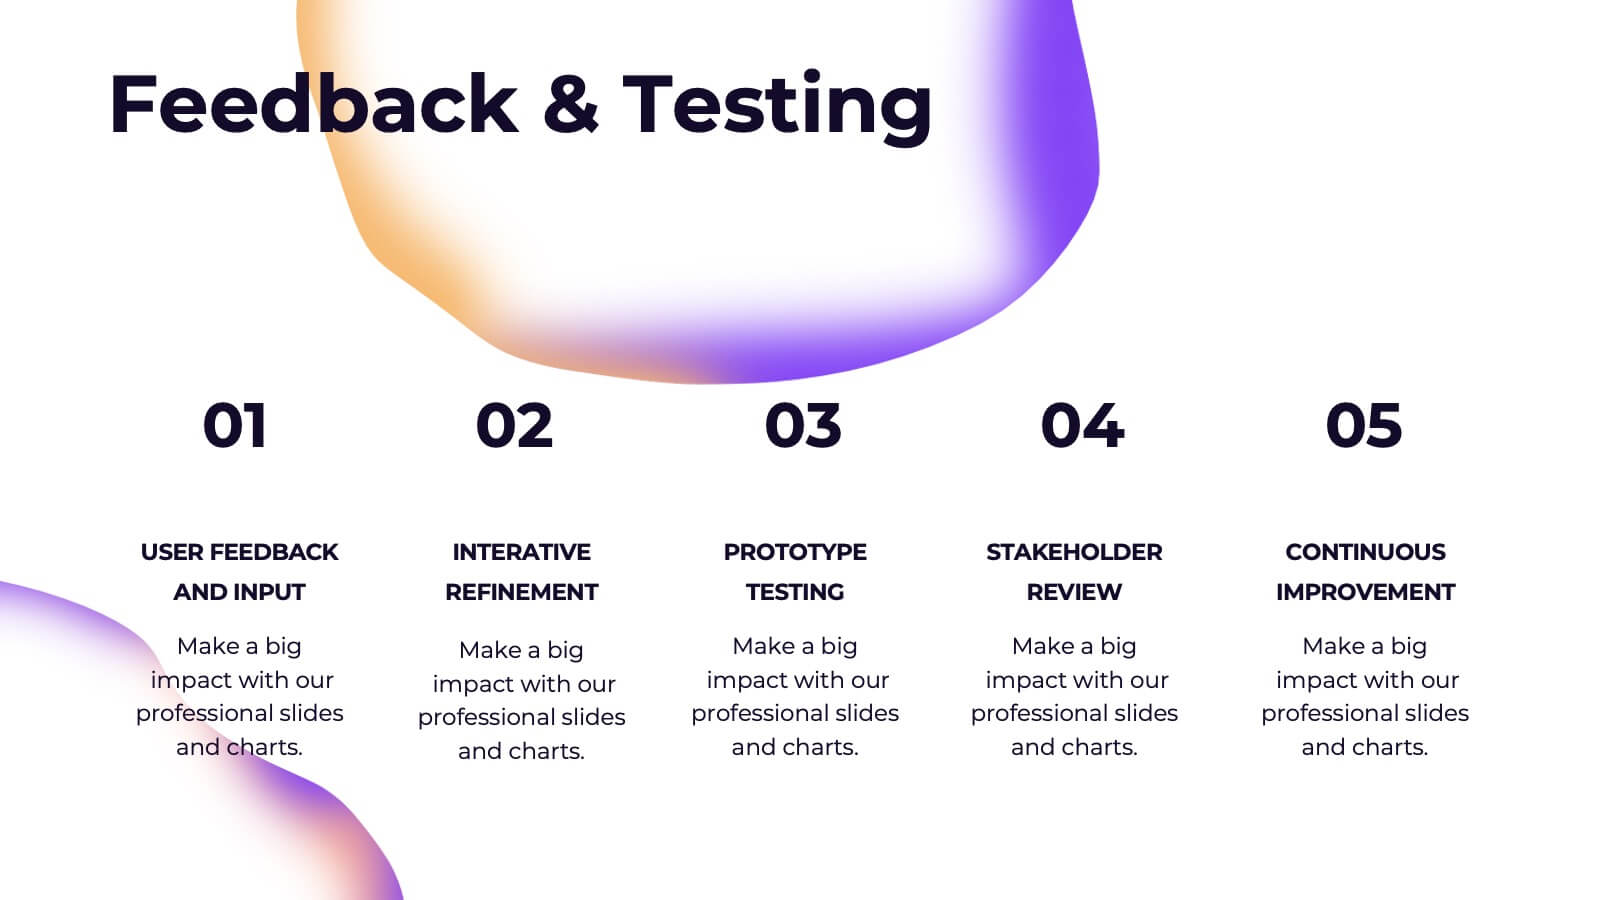
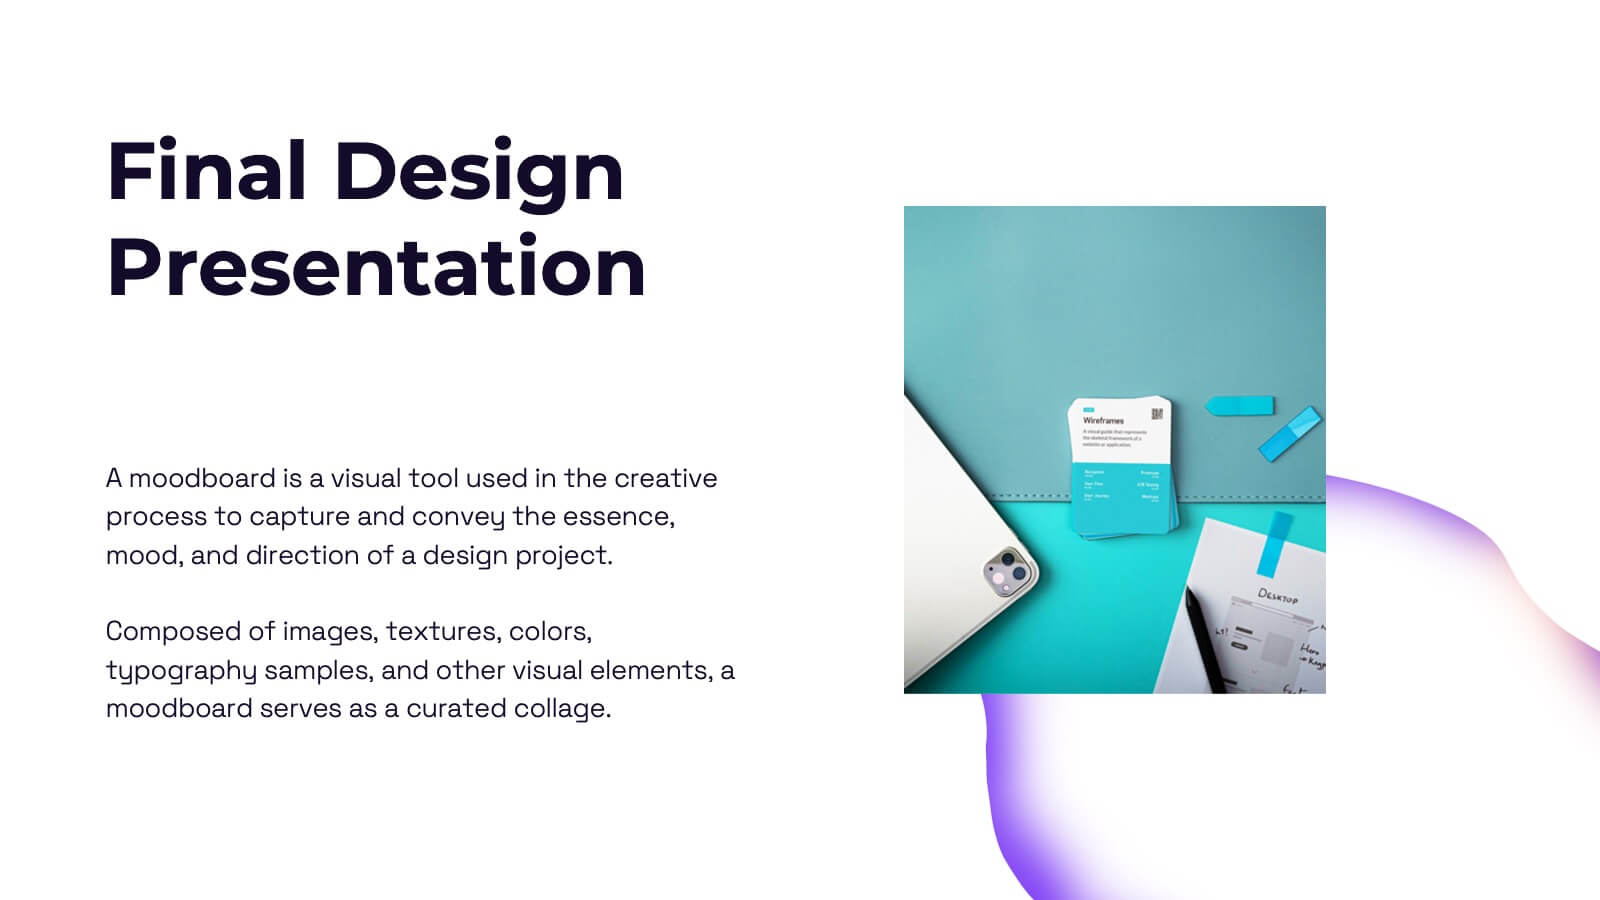
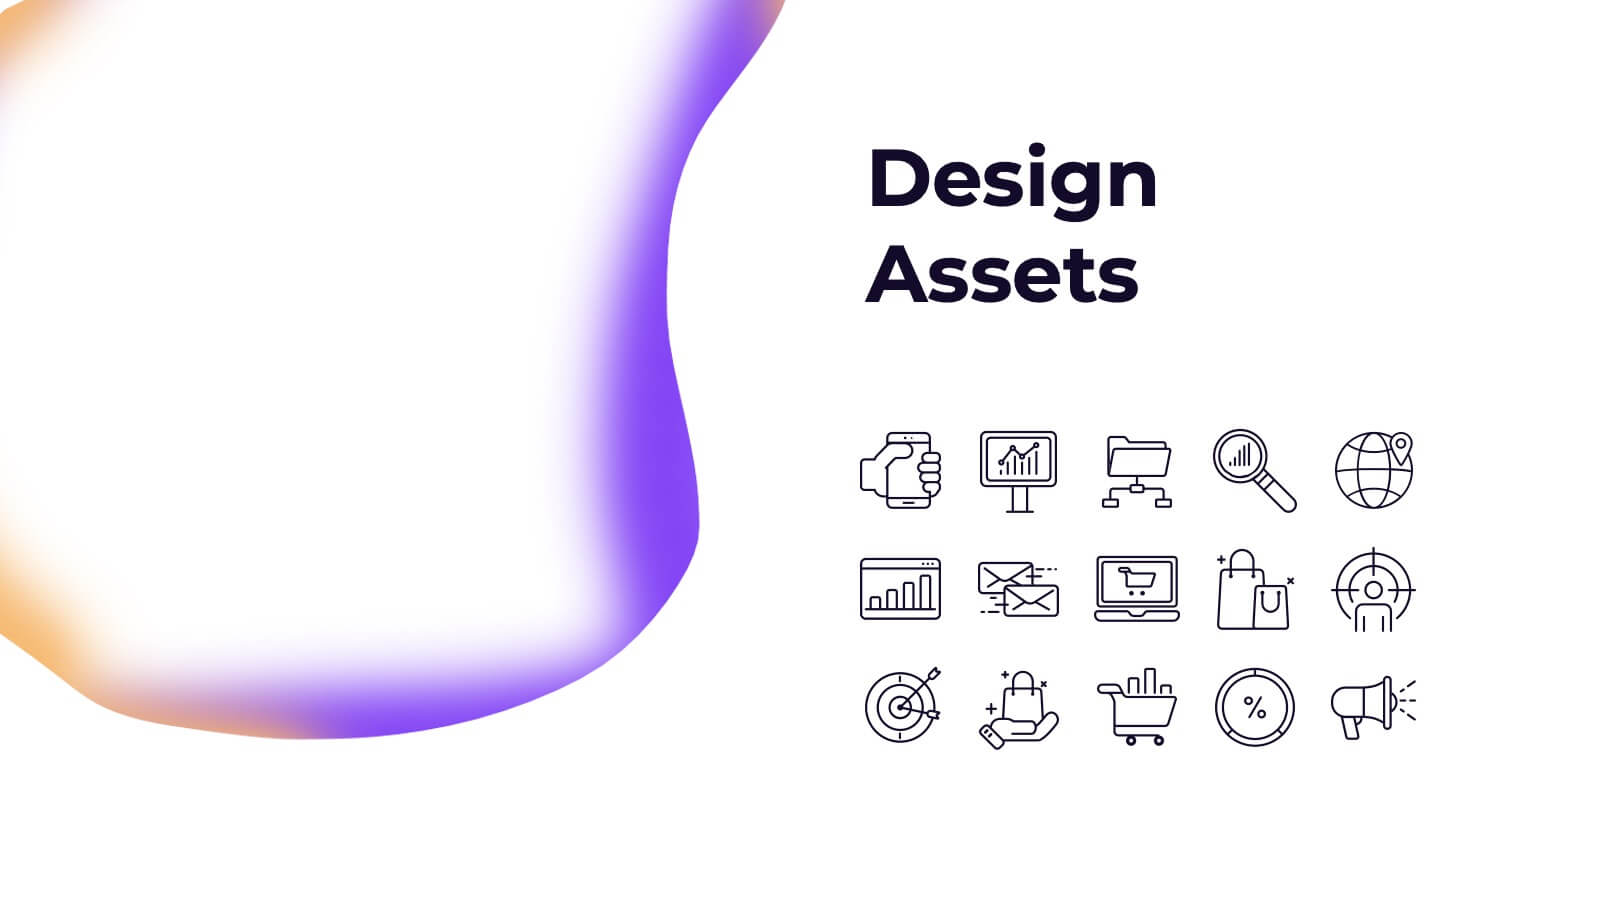
Valkyrie Design Strategy Proposal Presentation
Elevate your design strategy presentations with this visually captivating and modern template! It covers every step of the design process, from concept development and mood boards to prototype iterations and feedback. Ideal for showcasing design elements, textures, and assets, this template is perfect for creative professionals. Compatible with PowerPoint, Keynote, and Google Slides for easy, polished presentations.


5 slides
Types of Restaurants Infographics
Restaurants are establishments that prepare and serve food and beverages to customers. These infographic templates are perfect for anyone looking to explore the diverse world of dining establishments and understand the unique features and offerings of each type. These provide an engaging and comprehensive overview of the diverse culinary world. With its visually appealing design and well-organized information, this is ideal for anyone looking to learn about different restaurant types, plan dining experiences, or educate others about the wide range of dining options available.


5 slides
Environment Preservation Infographics
Environment preservation refers to the protection, conservation, and sustainable management of natural resources and ecosystems to maintain their integrity and ensure their long-term viability. These vertical infographics are designed to raise awareness about the current environmental challenges and inspire individuals and communities to take action to protect and conserve the environment. It can be used in presentations, workshops, educational campaigns, and sustainability initiatives to inspire individuals, organizations, and communities to take steps towards a more sustainable and resilient future. Compatible with Powerpoint, Keynote, and google Slides.


4 slides
Marketing KPI Dashboard Presentation
Visualize marketing performance at a glance with this Marketing KPI Dashboard Presentation. Designed with a modern funnel graphic and monthly performance bars, this slide highlights key metrics such as audience reach, engagement rate, conversion rate, and campaign effectiveness. Color-coded indicators make insights easy to interpret. Ideal for marketing teams, strategy updates, and performance reviews. Fully customizable in PowerPoint, Keynote, and Google Slides.


5 slides
Business Overview and Highlights Summary
Summarize your company’s key milestones with this Business Overview and Highlights Summary slide. Featuring a clean layout with a bold briefcase visual and four spotlight areas, it’s ideal for showcasing achievements. Fully editable in PowerPoint, Keynote, and Google Slides.


6 slides
Market Differentiation with Blue Ocean Strategy Presentation
Set your brand apart with our Market Differentiation with Blue Ocean Strategy template. This visually compelling tool helps you chart a course through uncharted business waters, emphasizing innovation in cost management, value creation, and buyer engagement. Compatible with PowerPoint, Keynote, and Google Slides, it’s perfect for presenting strategic insights that escape the competitive red ocean into the clear, blue waters of uncontested market space.


7 slides
Real Estate Agency Infographic
Real estate refers to property consisting of land, buildings, and natural resources like minerals, water, and crops, it is a fundamental part of societies and economies globally. Embark on a visual journey through the real estate landscape with our real estate agency infographic. Bold, dynamic, and informative, this infographic is your compass in the world of properties, guiding you through the ins and outs of real estate dynamics and opportunities. Compatible with Powerpoint, Keynote, and Google Slides. This informative guide will help you navigate the world of real estate, ensuring you make informed decisions in this dynamic market.


5 slides
The Problem of Food Waste Infographics
Food Waste refers to any food that is discarded or lost along the food supply chain, from production to consumption. These vertical infographics are designed to cover the problem of food waste and can be designed to highlight statistics and facts about the issue. This infographic can be used to show how much food is wasted annually and the negative impact that this waste has on the environment. In the text boxes provide tips for reducing food waste, such as buying only what you need, storing food properly, and using leftovers creatively. Included are engaging visuals, such as icons and illustrations, and a clear layout.


6 slides
Market Growth Strategy with Asia Map Presentation
Visualize strategic growth across Asian markets with this map-based presentation. Highlight regions by opportunity level, compare metrics with vertical bar charts, and display yearly projections. Ideal for business development, expansion plans, or market analysis. Fully editable in PowerPoint, Keynote, and Google Slides for tailored, data-driven presentations.


6 slides
Industry Analysis Porter's 5 Forces Presentation
Analyze industry competition with this Porter's Five Forces template! This structured layout visually breaks down key factors like buyer power, supplier influence, competitive rivalry, new market entrants, and substitution threats, making it ideal for strategic planning and market assessments. Fully customizable and compatible with PowerPoint, Keynote, and Google Slides.