


Features
- 4 Unique slides
- Fully editable and easy to edit in Microsoft Powerpoint, Keynote and Google Slides
- 16:9 widescreen layout
- Clean and professional designs
- Export to JPG, PDF or send by email


Do you have any questions?
Recommend


6 slides
Circular Concept Diagram for Strategy Presentation
Visualize interconnected ideas with this circular concept diagram, ideal for showcasing six key strategic pillars or processes. Each segment is clearly labeled and icon-supported, creating an easy-to-follow layout. Perfect for business planning, marketing strategies, or organizational models. Compatible with PowerPoint, Keynote, and Google Slides for full customization.


6 slides
Business Flow Chart Design Presentation
Bring clarity and momentum to your process with a clean, visual layout that turns complex steps into an easy-to-follow flow. This presentation helps teams map stages, responsibilities, and progress with confidence, making it perfect for planning, strategy, and operations. Fully compatible with PowerPoint, Keynote, and Google Slides.


7 slides
Concentric Circles Model Infographic Presentation
A Concentric Circle Infographic is a visual tool that represents information, data or ideas in a circular format, where each circle is centered inside the next larger circle. In this template you can use the circles to show the relationships between different elements or components, with the innermost circle representing the most important or central idea, and the outer circles representing related or peripheral ideas. Designed in Powerpoint, Keynote, and Google slides the circles in the template can be easily customized with different colors, sizes, and designs to fit your needs.


5 slides
Risk Management Bowtie Diagram Layout Presentation
Visualize risk pathways with clarity using the Risk Management Bowtie Diagram Layout Presentation. This design helps illustrate cause-and-effect relationships around a central risk event, making it ideal for identifying threats, controls, and consequences. Fully editable and easy to adapt in Canva, PowerPoint, Google Slides, and Keynote.


4 slides
Innovative Business Solution Strategy
Present fresh, impactful ideas with this innovative business solution strategy slide. Featuring a creative lightbulb design, this template helps you showcase strategic solutions, key initiatives, or breakthrough concepts in a visually organized way. Perfect for startups, innovation workshops, and business growth meetings. Fully editable and compatible with PowerPoint, Keynote, and Google Slides.


23 slides
Pomona Business Plan Presentation
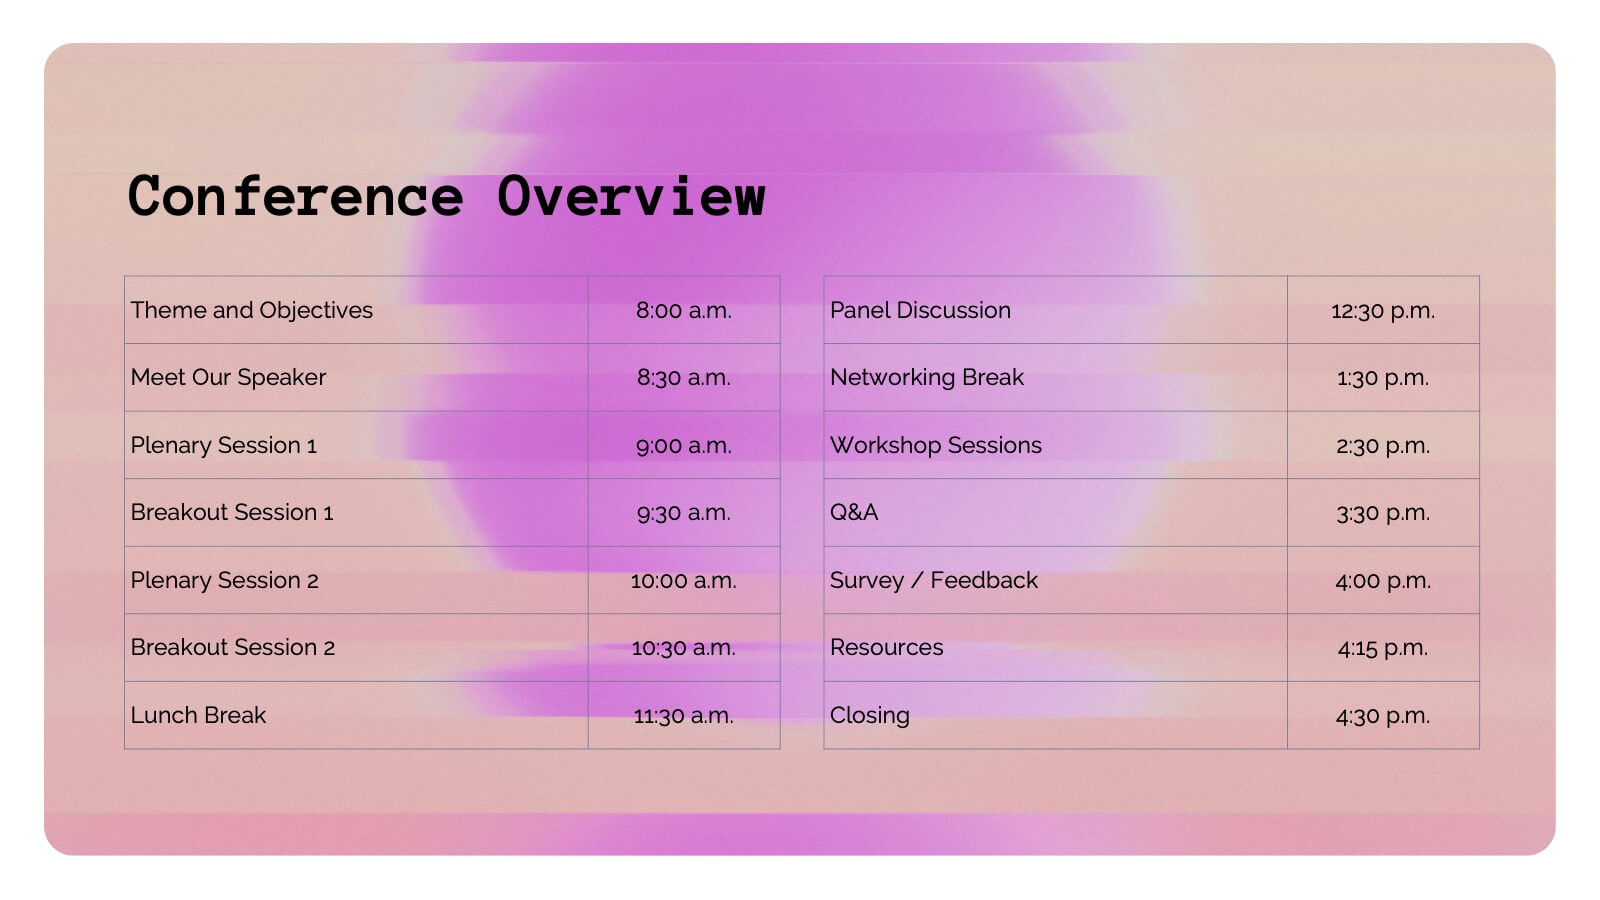
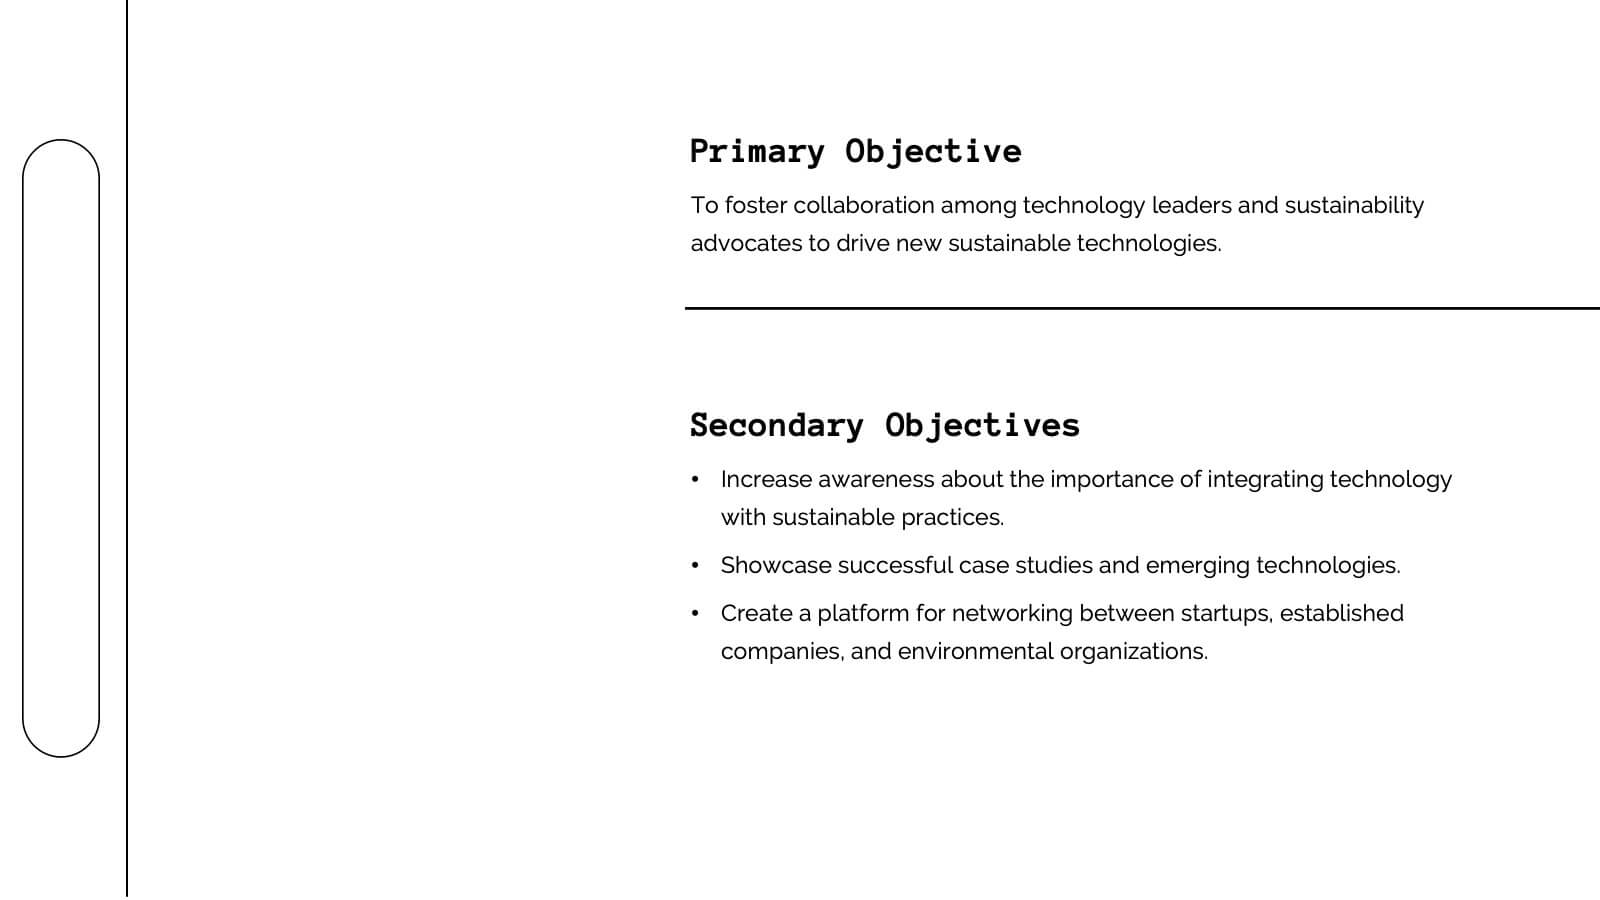
This vibrant and adaptable event agenda template is perfect for organizing your business conference or corporate event. It includes customizable sections for session details, speaker information, and key activities like networking breaks, workshops, and panel discussions. Compatible with PowerPoint, Keynote, and Google Slides, it ensures a smooth and engaging event presentation experience!


5 slides
Employee Onboarding HR Presentation
Start your presentation with energy and clarity using this clean, engaging slide designed to simplify every step of the onboarding journey. It helps explain employee integration, training stages, and team alignment in a way that feels intuitive and visually organized. Fully compatible with PowerPoint, Keynote, and Google Slides.


8 slides
Virtual Team Collaboration Presentation
The "Virtual Team Collaboration" presentation template is designed to highlight different facets of teamwork in a remote setting. Each slide features a central visual metaphor illustrated by connected circles, symbolizing the interconnected nature of virtual team activities and communication. The layout provides placeholders for titles and descriptive text, making it suitable for detailing various aspects of virtual collaboration such as project management, communication protocols, and role assignments. The design encourages a clear and organized presentation of information, facilitating discussions on best practices and strategies for effective remote teamwork.


4 slides
Workplace Safety Guidelines Presentation
Create a safer, smarter workspace with this clean and visual presentation design. Ideal for communicating safety standards, compliance rules, and hazard prevention tips, it helps teams stay informed and engaged. Fully customizable and compatible with PowerPoint, Keynote, and Google Slides for easy editing and professional delivery.


6 slides
Digital Marketing Strategy and Trends Presentation
The "Digital Marketing Strategy and Trends" template is designed to help marketers visualize and present their strategies and market trends effectively. It facilitates clear mapping of key steps in digital marketing campaigns, making it easier to convey complex strategies in a digestible format. This template is compatible with PowerPoint, Keynote, and Google Slides, ensuring it can be utilized across various platforms for diverse audiences.


26 slides
Entrepreneurship 101 Professional Presentation
This template offers a modern, professional framework for presentations about Entrepreneurship 101. It combines a clean, contemporary design with a palette of cool blues and muted reds, setting a tone that's both creative and serious—just right for the innovative spirit of entrepreneurship. Within its slides, you'll find all the tools needed to outline the essentials of starting a new business, from identifying opportunities to understanding market trends. Perfect for aspiring entrepreneurs, business school classes, or startup workshops, the template includes varied slide types: team introductions, big ideas, comparative analyses, and growth charts. The slides also feature infographics for brainstorming sessions, process flows for business operations, and timeline representations for strategic planning. Designed for adaptability, the template works seamlessly with PowerPoint, Keynote, and Google Slides, ensuring your entrepreneurial vision can be shared with clarity and impact.


6 slides
Business Overview Company Profile Presentation
Present Your Business with a Dynamic Overview! The Business Overview Company Profile template features a modern circular flow design, perfect for showcasing company insights, key strategies, and core values. With six structured content sections, this layout helps you present information in a clear and engaging way. Whether you're introducing your business or outlining corporate initiatives, this fully editable template in PowerPoint, Keynote, and Google Slides ensures a polished and professional presentation for any industry.


2 slides
Meeting and Business Planning Services Illustrations
Take your planning game to the next level with our meeting and business planning services illustrations pack! This illustrations pack is perfect for companies that need a way to visualize their ideas quickly and easily. Fully compatible with Powerpoint, Keynote, and Google Slides. Boost your productivity and make your meetings more exciting—download the meeting and business planning services illustrations pack today!


5 slides
Buyer Journey Infographic Presentation
Understanding how buyers move from awareness to action becomes effortless with this clean, visual presentation. It guides you through each stage, helping you explain behaviors, insights, and touchpoints with clarity. Easy to customize and fully compatible with PowerPoint, Keynote, and Google Slides.


4 slides
Business SWOT Evaluation Presentation
Break down business strategies with this visually structured SWOT analysis layout. Present strengths, weaknesses, opportunities, and threats in a clean, quadrant-style format. Ideal for reports, pitches, or internal reviews. Fully editable in PowerPoint, Keynote, and Google Slides for clear, impactful analysis that drives smarter decision-making and strategic alignment.


5 slides
Digital Marketing Agency Infographics
Elevate your agency's presentation game with our digital marketing agency infographics template. Designed in a vibrant palette of pink, white, and blue, this vertical infographic is a powerhouse tool tailored for marketing professionals, digital agencies, and consultants aiming to showcase their services, success stories, and unique strategies effectively. The template is a visual feast, featuring compelling graphics, diverse icons, and designated spaces for images that capture the essence of digital trends and marketing breakthroughs. Its intuitive design aids in breaking down complex information, ensuring your agency's innovative solutions are client-ready.


24 slides
Catalyst Strategic Planning Report Presentation
Unleash your strategic vision with the Catalyst Strategic Planning Report template! This vibrant and dynamic layout is designed to make your strategic planning presentations not only effective but also visually captivating. The template’s playful yet professional design elements, including bold color blocks and creative graphics, draw attention to key points, ensuring your message resonates with your audience. From SWOT analysis to market trends, and resource allocation to action plans, every slide is crafted to communicate your strategic objectives clearly and compellingly. Perfect for business reviews, strategic meetings, or investor presentations, this template allows you to present data-driven insights and actionable steps in an engaging manner. It’s fully customizable, making it easy to adapt to your brand’s colors and style. Whether you’re presenting to a team or stakeholders, the Catalyst template provides the perfect platform to articulate your vision. Compatible with PowerPoint, Keynote, and Google Slides, it’s your go-to tool for impactful strategic presentations!