


Features
- 4 Unique slides
- Fully editable and easy to edit in Microsoft Powerpoint, Keynote and Google Slides
- 16:9 widescreen layout
- Clean and professional designs
- Export to JPG, PDF or send by email


Do you have any questions?
Recommend


6 slides
Financial Report and Charts Presentation
Deliver financial insights with impact using this Financial Report and Charts Presentation Template. Featuring a clean layout with a money bag visual and percentage breakdowns, it’s perfect for showcasing profit distribution, investment categories, or budget summaries. Fully customizable in PowerPoint, Keynote, and Google Slides.


22 slides
Nimbus Project Milestones Report Presentation
This project plan template offers a modern, vibrant design that clearly outlines key project components, including problem statements, objectives, deliverables, timelines, and risk management. It’s perfect for teams looking to present a comprehensive project overview. Compatible with PowerPoint, Keynote, and Google Slides for impactful presentations with a polished look!


5 slides
Colorful Circular Flow Chart Presentation
Bring your ideas full circle with a vibrant, energetic flow that instantly grabs attention and makes complex processes feel effortless to follow. This presentation is perfect for illustrating cycles, workflows, or interconnected stages in a clear, dynamic way. Fully compatible with PowerPoint, Keynote, and Google Slides.

20 slides
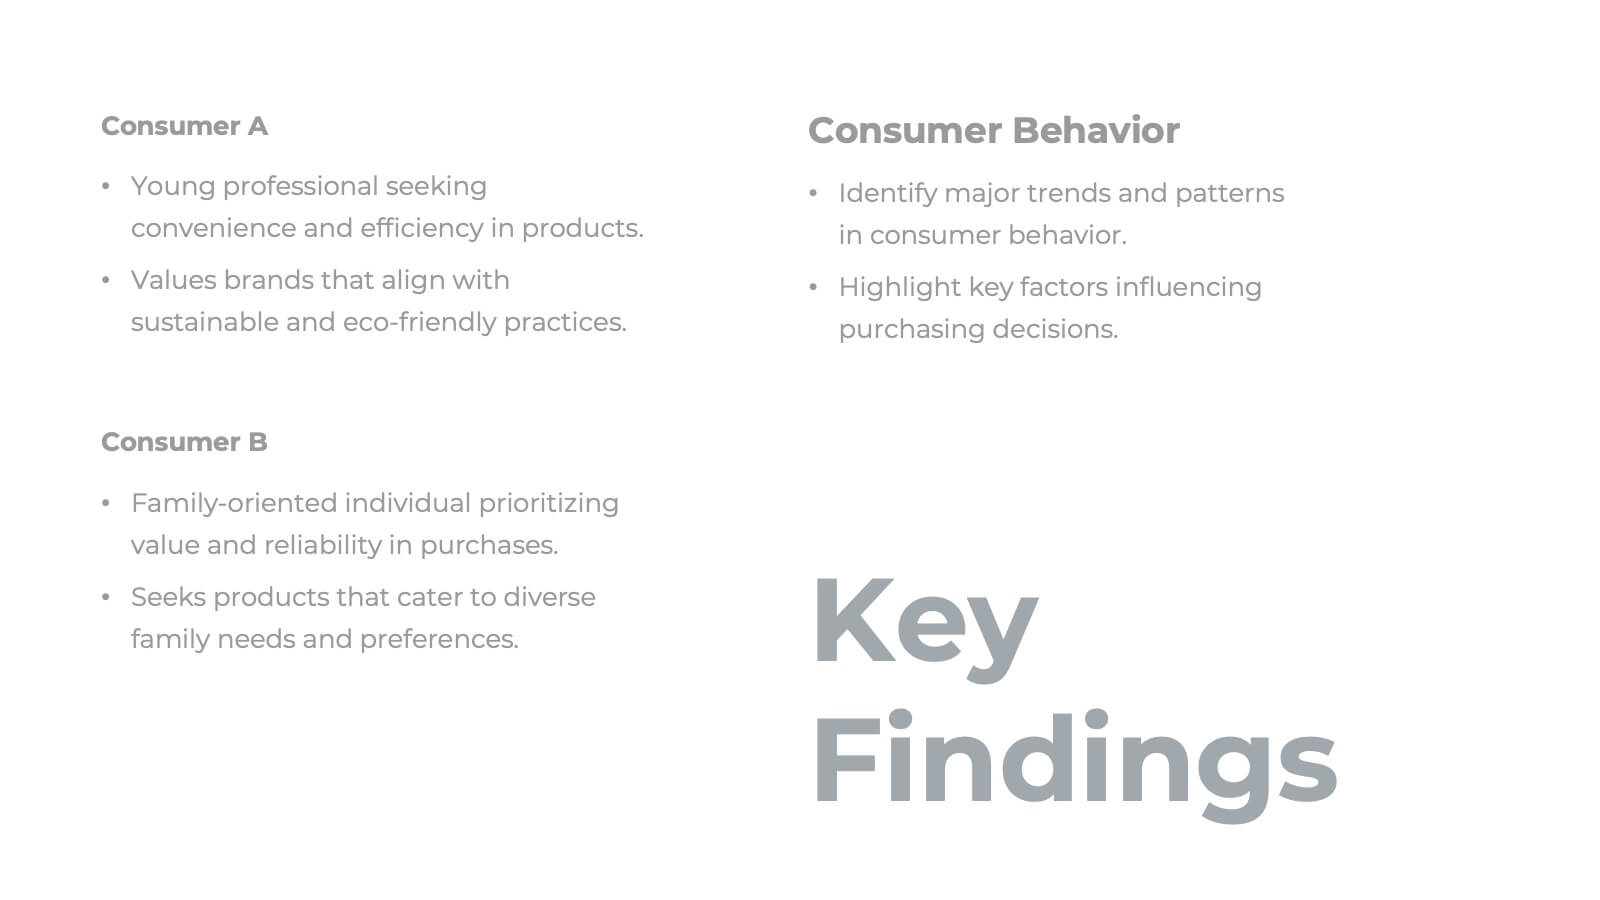
Malachite Research Proposal Presentation
Present your research findings with clarity and professionalism using this structured research presentation template! Covering all essential elements, from research objectives and methodology to key findings and implications, this template ensures your work is communicated effectively. It's perfect for academic, corporate, or scientific presentations. Compatible with PowerPoint, Keynote, and Google Slides, it's versatile and ready for your next project.


6 slides
McKinsey Strategy Implementation Model Presentation
Visualize organizational alignment with the McKinsey 7S Model slide. Featuring a clean circular layout, it highlights Strategy, Structure, Systems, Shared Values, Style, Staff, and Skills. Ideal for consulting, planning, or leadership presentations. Fully editable and compatible with PowerPoint, Google Slides, and Keynote for easy customization and branding.


26 slides
Remote Work Strategies Presentation
Enhance your team's flexibility with our Remote Work Strategies presentation template, designed for use with PowerPoint, Keynote, and Google Slides. This template is an invaluable asset for team leaders, HR professionals, and business consultants dedicated to cultivating a productive remote work culture. Our template is tailored to provide an in-depth analysis of remote work best practices, offering slides that cover essential strategies for communication, collaboration, and project management in a virtual environment. It also includes insights on setting up a successful home office, maintaining work-life balance, and leveraging technology for seamless remote operations. With customizable elements, you can illustrate the advantages of remote work, share success stories, and provide actionable tips to maximize team efficiency from afar. This template is SEO-optimized to ensure your presentation reaches those seeking to optimize their remote work operations and foster a thriving digital workplace.


6 slides
Target Audience Segmentation Strategy
Break down your audience with clarity using the Target Audience Segmentation Strategy Presentation. This slide features a vibrant vertical funnel layout, ideal for displaying five customer segments or persona categories. Each layer is numbered and color-coded, with connected callout areas for detailed insights. Perfect for marketers, campaign strategists, or product teams presenting customer journey data, audience demographics, or behavioral insights. Fully customizable in PowerPoint, Keynote, and Google Slides—easily align the design with your brand colors and content structure.


8 slides
Business Expense and Cost Control
Visualize cost distribution and expense tracking with the Business Expense and Cost Control Presentation. This circular arrow chart is ideal for breaking down four key categories—such as departments, cost centers, or financial strategies—while also displaying percentage-based insights. Fully customizable in PowerPoint, Keynote, and Google Slides, it’s perfect for finance teams, analysts, or consultants needing a visual approach to budget control.


10 slides
Revenue Growth Strategies and Metrics Presentation
Highlight your key success drivers with the Revenue Growth Strategies and Metrics Presentation. This upward arrow-based layout is perfect for showcasing growth phases, financial KPIs, or strategic revenue initiatives. Clean, professional, and fully editable in PowerPoint, Keynote, and Google Slides—ideal for business reviews, sales pitches, and quarterly updates.


7 slides
Communication Infographic Presentation Template
Communication Infographics are a more professional way of presenting facts and a great way to share your marketing strategy and goals with your team. Our template includes a variety of infographic elements, including bullet points, call to actions and persuasive slogans. This template design is ideal for presentations on subjects such as content marketing, sales, social media strategy, and many more. Our Communication Template includes graphic illustrations, slides and text boxes for your topics. In this template you can easily add your own text and images to create a meaningful presentation.


8 slides
Achievements and Goals Milestone
Illustrate your team's journey with this visually engaging milestone roadmap. Featuring a step-by-step block design with space for five key accomplishments, it's perfect for goal tracking, progress reviews, or roadmap presentations. Fully editable in PowerPoint, Keynote, and Google Slides.


4 slides
Startup Business Plan Executive Overview Presentation
Present your startup vision with this bold, rocket-themed executive overview template. Perfect for outlining growth strategies, milestones, and launch plans, it combines vibrant visuals with a clean layout. Fully editable in Canva, PowerPoint, and Google Slides, it’s ideal for inspiring investors and stakeholders with a clear, professional business roadmap.


7 slides
Company Profile Infographic
This collection of company profile templates is designed to meet the diverse needs of various businesses, providing an efficient and polished method for presenting a company's identity, accomplishments, and offerings. Each template is meticulously crafted to cater to different professional contexts, making them suitable for annual reports, investment summaries, or internal briefings. Structured for clarity, these templates enable businesses to effectively communicate essential details such as company history, objectives, and the breadth of services or products offered. They are also equipped to showcase crucial statistics like employee numbers, significant achievements, and organizational hierarchy, enhancing the overall presentation. The design blends modern aesthetics with functionality, incorporating a professional color palette and clean layout that holds viewer interest and enhances readability. Customization is straightforward, allowing for easy adjustments in colors, fonts, and design elements to align with specific brand identities. Ideal for corporations looking to convey their market stance and engage potential clients, investors, or prospective employees, these templates serve as a vital tool in creating impactful and informative company profiles.


5 slides
WFH Policy Overview Presentation
Bring clarity and confidence to your remote-work guidelines with a clean, puzzle-style layout that makes every policy easy to follow. This presentation explains key expectations, communication standards, and workflow essentials designed to support productive work-from-home environments. Fully customizable and compatible with PowerPoint, Keynote, and Google Slides.


5 slides
Public Health and Wellness Strategy Presentation
Present a comprehensive Public Health and Wellness Strategy with this visually engaging template. Designed with a segmented circular diagram, it effectively outlines key areas such as healthcare infrastructure, mental well-being, preventive care, and emergency response. Ideal for health professionals, policy-makers, and organizations aiming to communicate community health initiatives and strategies. Fully customizable and compatible with PowerPoint, Keynote, and Google Slides.


7 slides
Digital Business Strategy Infographic
Navigate the complex landscape of digital business strategy with this comprehensive infographic template, which is meticulously designed to aid business strategists, entrepreneurs, and students in understanding and developing effective business plans. This resource breaks down the core components of a successful business strategy into digestible, visually engaging segments. The template spans several key areas of strategic planning including execution, governance, planning, marketing, and innovation. Each section is clearly delineated with vibrant colors and icons that correspond to different aspects of business strategy, such as venture, capital, and brand positioning. The layout is thoughtfully organized to guide the viewer through the process step-by-step, making complex concepts accessible and straightforward. Utilizing a clean and professional design, this template is ideal for presentations, educational materials, or as a visual aid during business meetings. It provides a clear roadmap for aligning digital tools and platforms with business objectives, highlighting the pathways to profitability and market expansion. Whether for internal strategy sessions, academic purposes, or entrepreneurial pitches, this infographic is an invaluable tool for conveying the essentials of digital business strategy effectively and efficiently.


5 slides
Strategic Framework Slide Presentation
Turn your strategy into a story that flows with clarity and precision using this clean, timeline-based presentation design. Ideal for illustrating project phases, corporate planning, or growth roadmaps, it keeps information structured and engaging. Fully editable and compatible with PowerPoint, Keynote, and Google Slides for seamless customization.