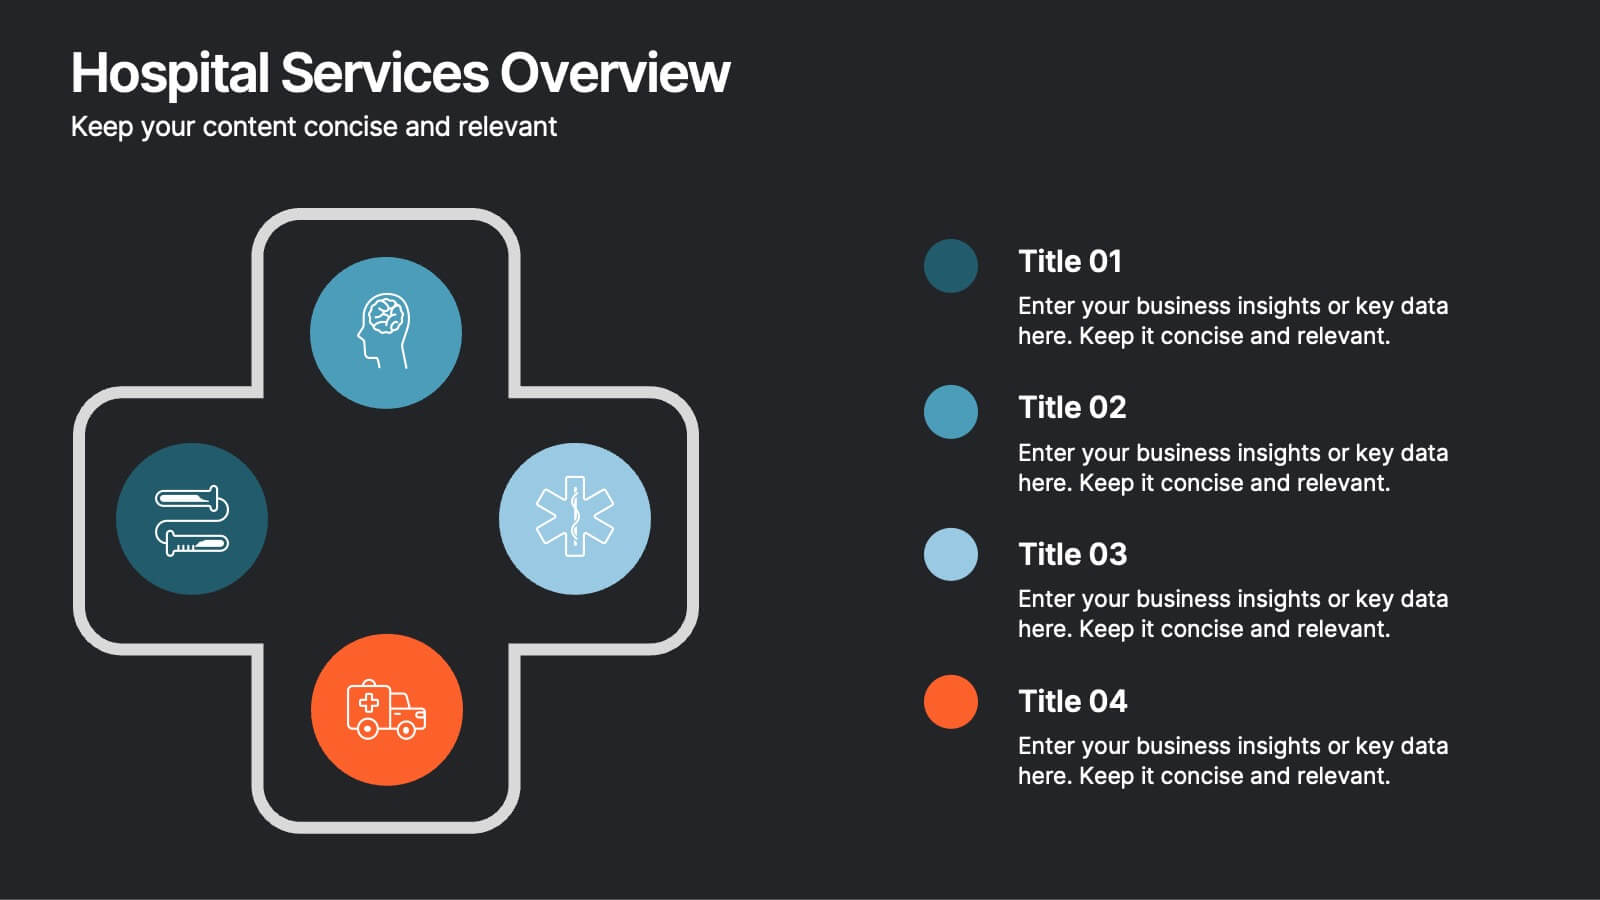
Hospital Services Overview Presentation
PowerPoint Template and Google Slides Theme
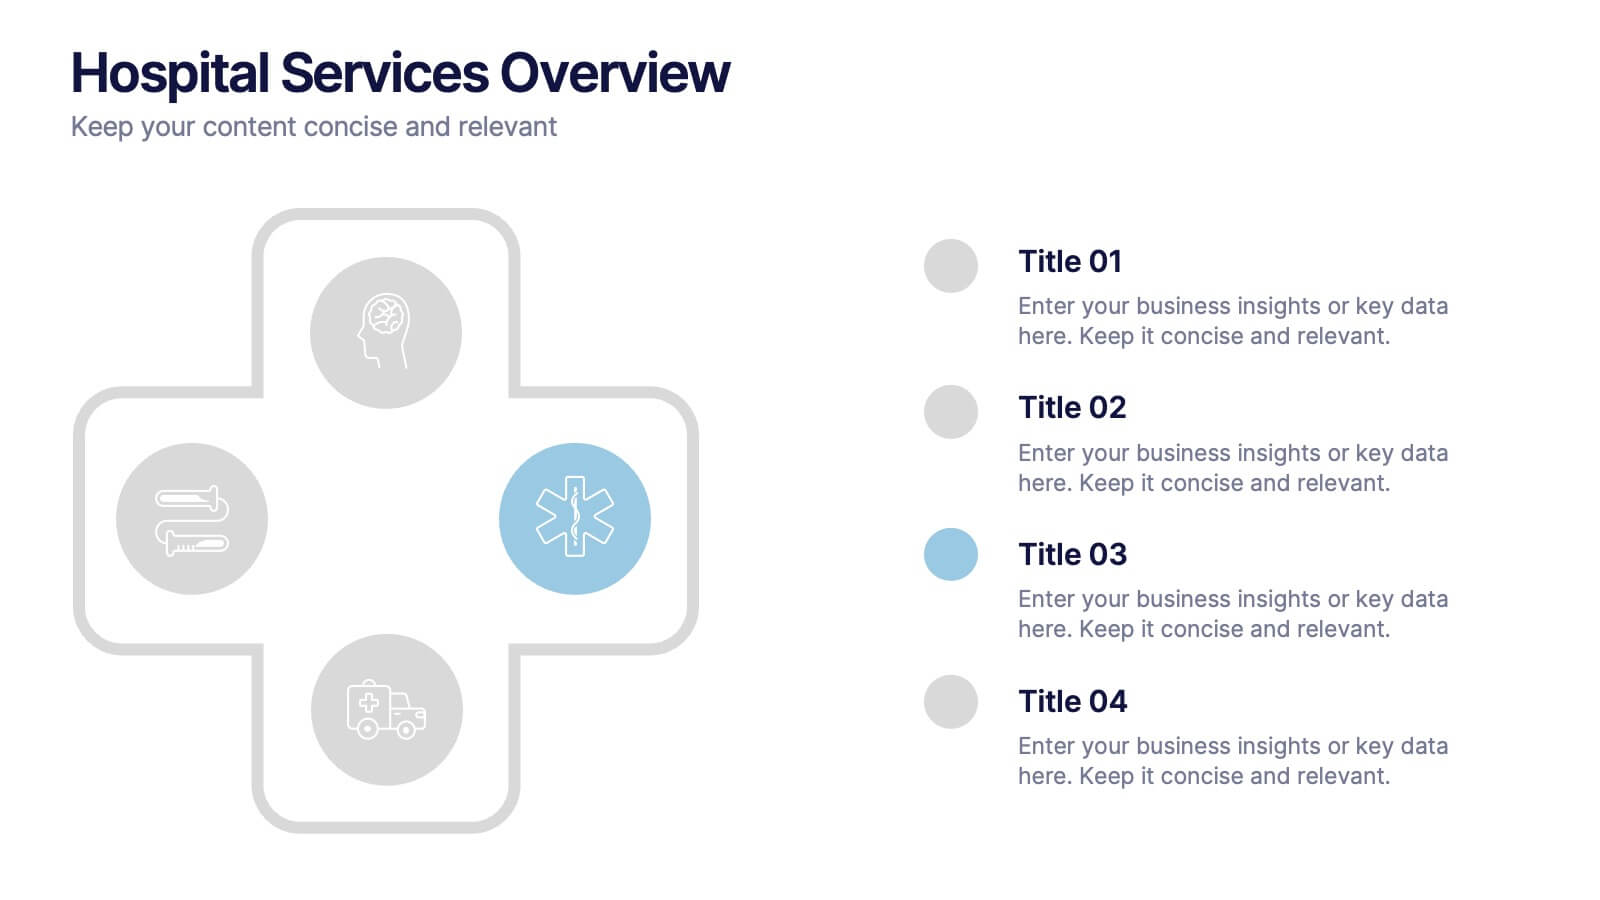
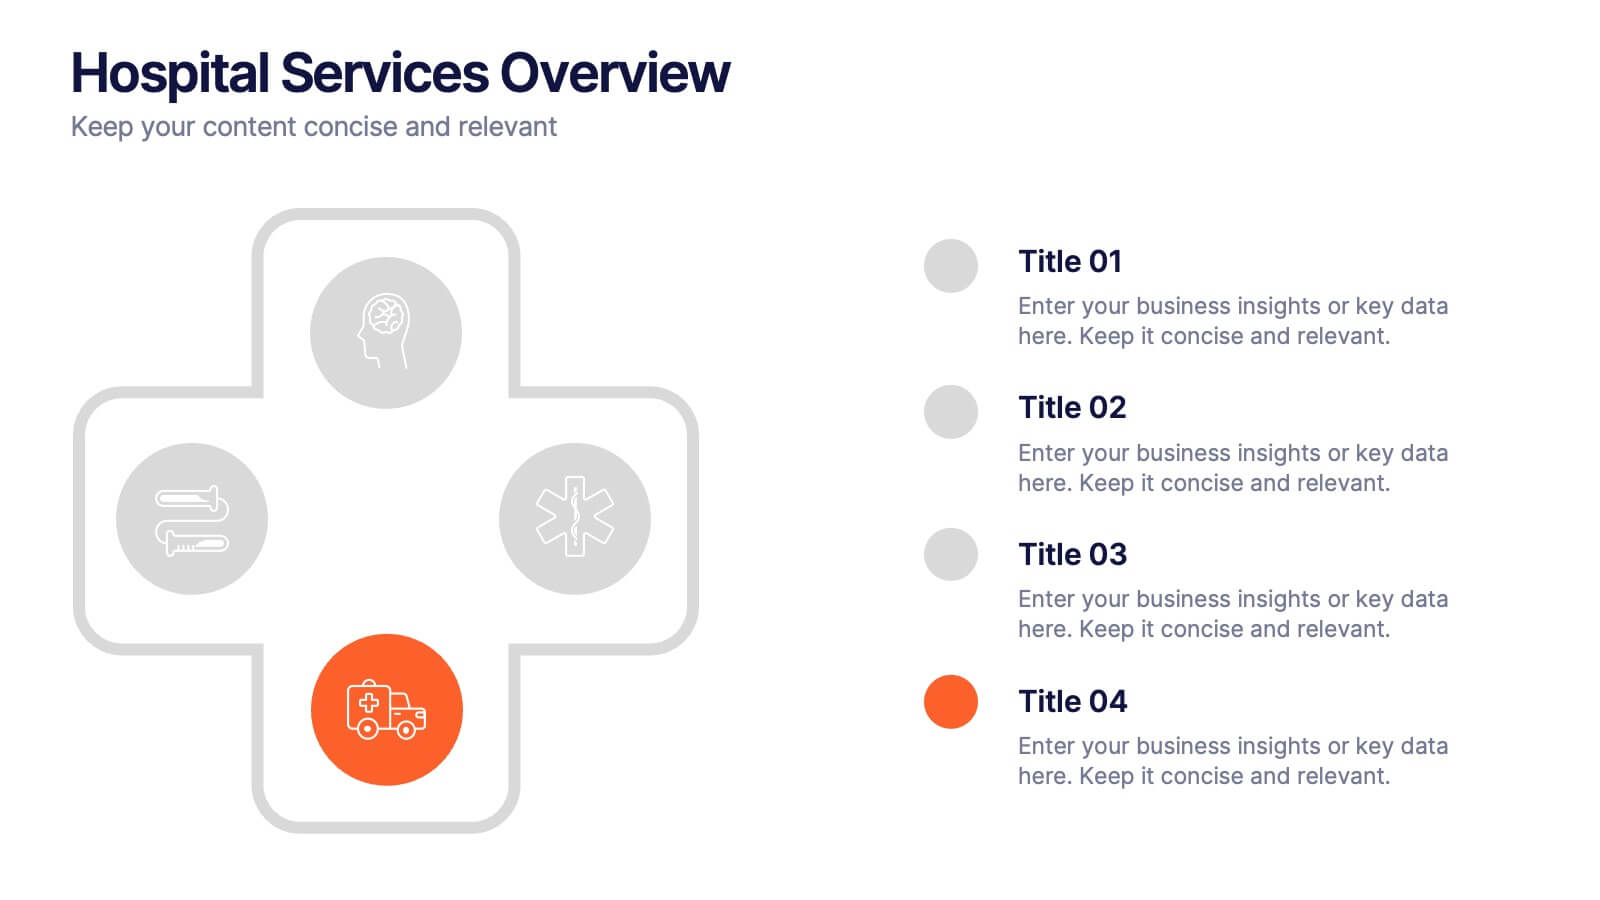
Features
- 10 Unique slides
- Fully editable and easy to edit in Microsoft Powerpoint, Keynote and Google Slides
- 16:9 widescreen layout
- Clean and professional designs
- Export to JPG, PDF or send by email
- Remove from favorites
Powerpoint Template
1 MB
Google Slides Template
External link
Keynote Template
2 MB
Recommend
- Remove from favorites
Powerpoint Template
2 MB
Google Slides Template
External link
Keynote Template
3 MB
5 slides
Country Highlight Asia Map Presentation
Showcase your regional insights with a clean and modern map that brings focus to key countries across Asia. Ideal for displaying market reach, growth metrics, or strategic locations, this visual layout makes data storytelling simple and effective. Fully compatible with PowerPoint, Keynote, and Google Slides for easy customization.
- Remove from favorites
Powerpoint Template
1 MB
Google Slides Template
External link
Keynote Template
2 MB
5 slides
Western Europe Political Map Slide Presentation
Showcase political insights and regional data with a clear, modern map design that highlights countries across Western Europe. Perfect for comparing demographics, election data, or market performance, this layout combines clarity with visual impact. Fully compatible with PowerPoint, Keynote, and Google Slides for easy customization and professional presentations.
- Remove from favorites
Powerpoint Template
1 MB
Google Slides Template
External link
Keynote Template
2 MB
8 slides
Insurance Market Trends Presentation
Stay Ahead in the Insurance Industry with this Insurance Market Trends Presentation template. Designed with a modern roadmap layout, this slide helps illustrate key trends, policy changes, and industry insights in an engaging and structured way. Ideal for insurance professionals, financial analysts, and business strategists, this fully customizable template is compatible with PowerPoint, Keynote, and Google Slides, making it easy to adapt to your specific needs.
- Remove from favorites
Powerpoint Template
1 MB
Google Slides Template
External link
Keynote Template
1 MB
4 slides
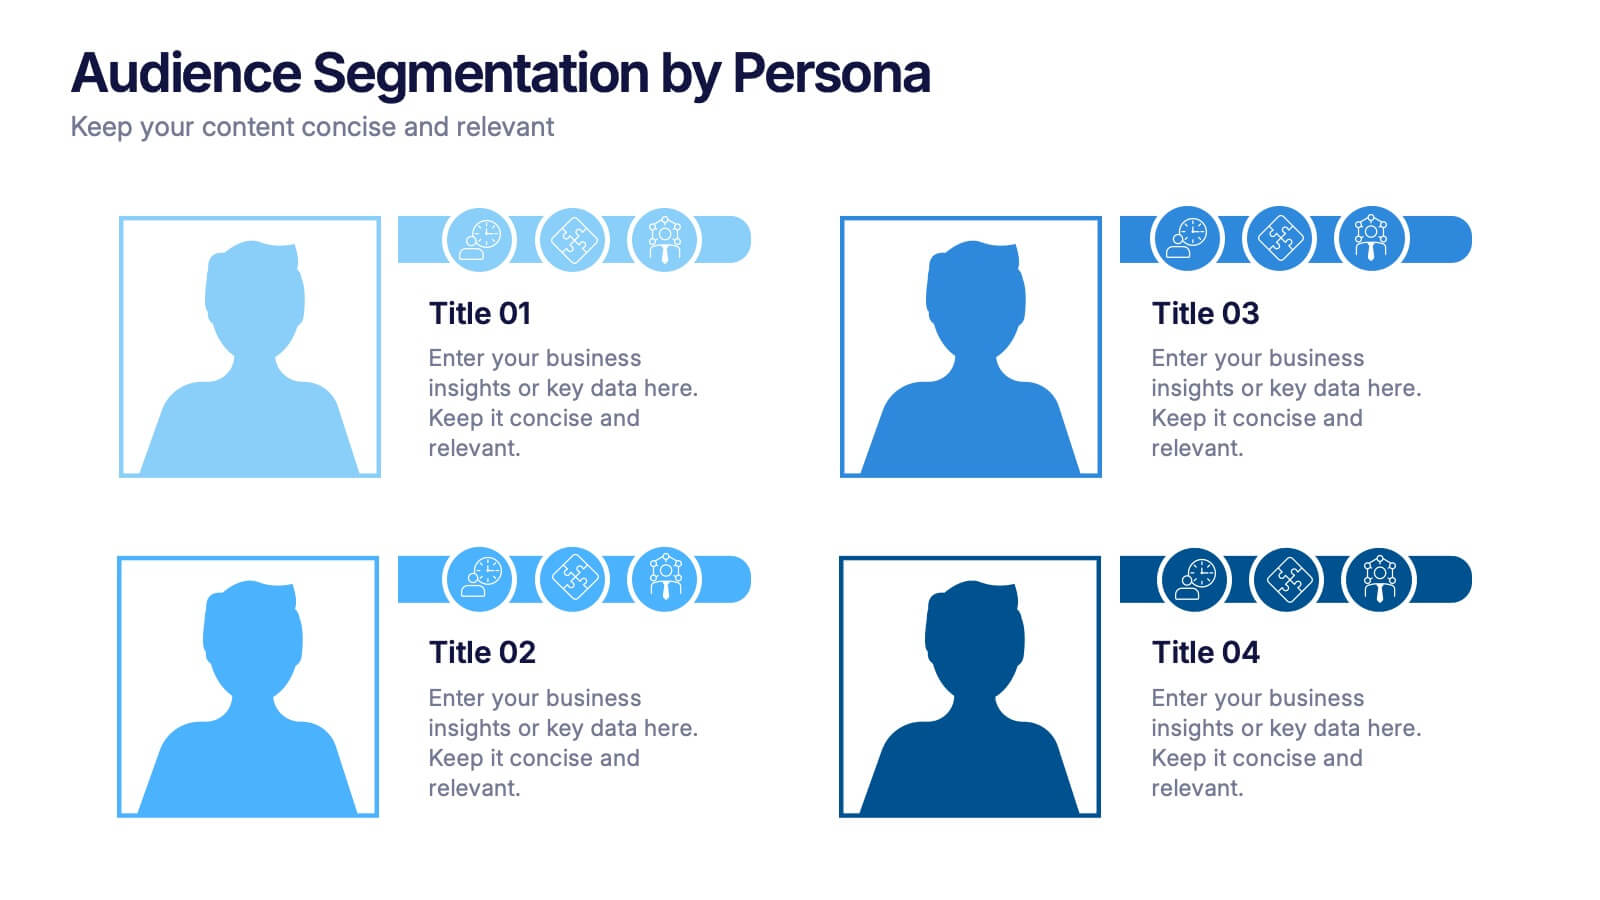
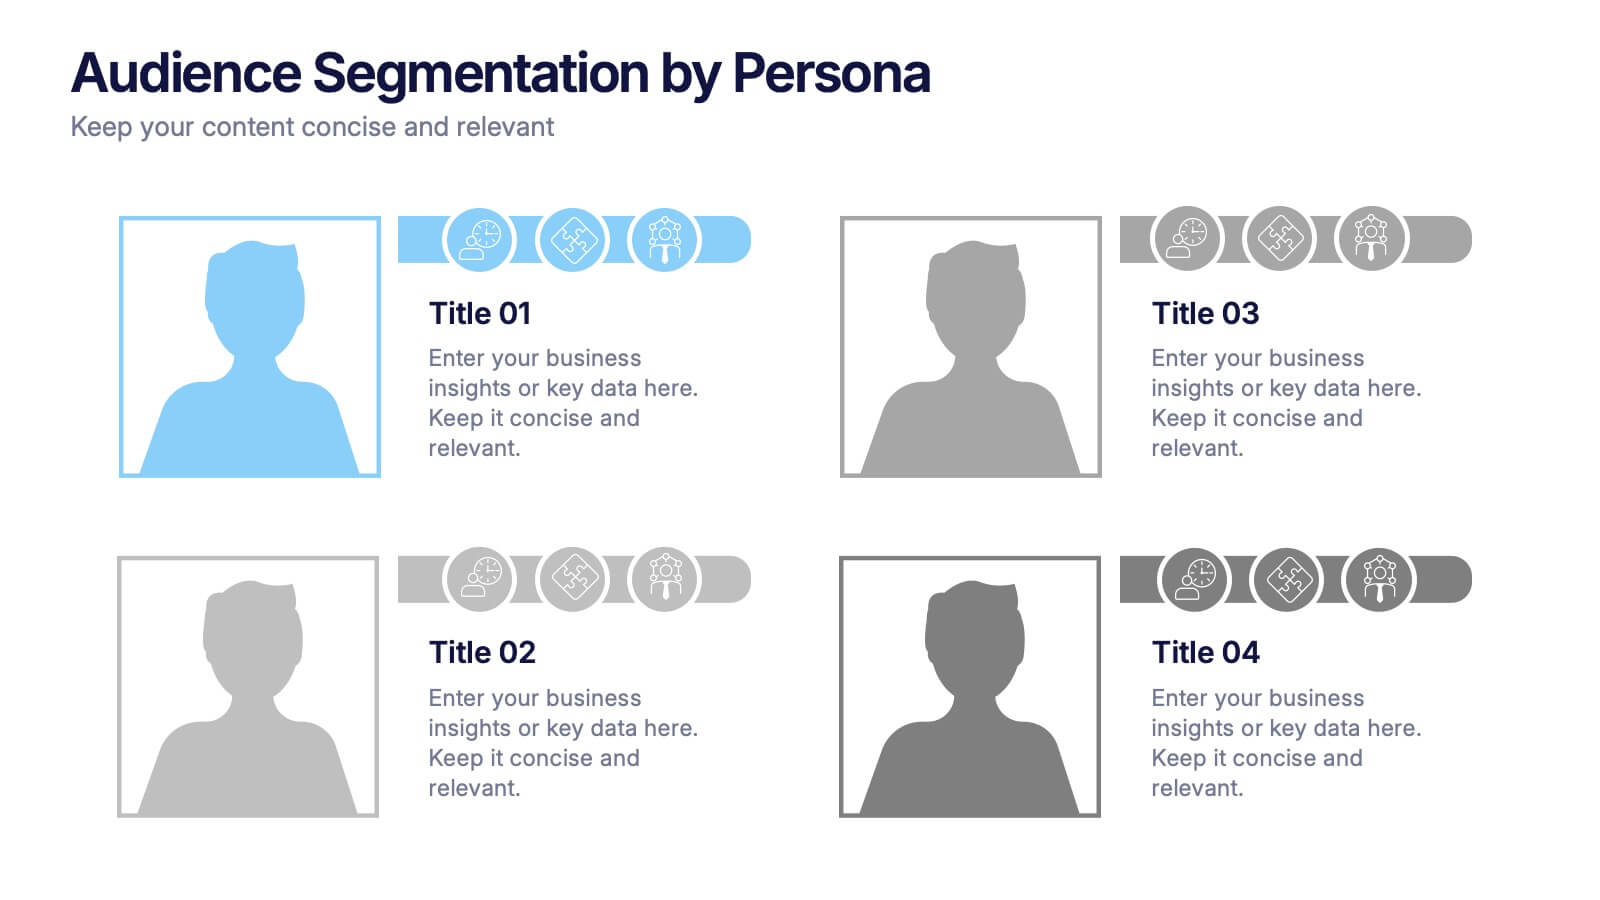
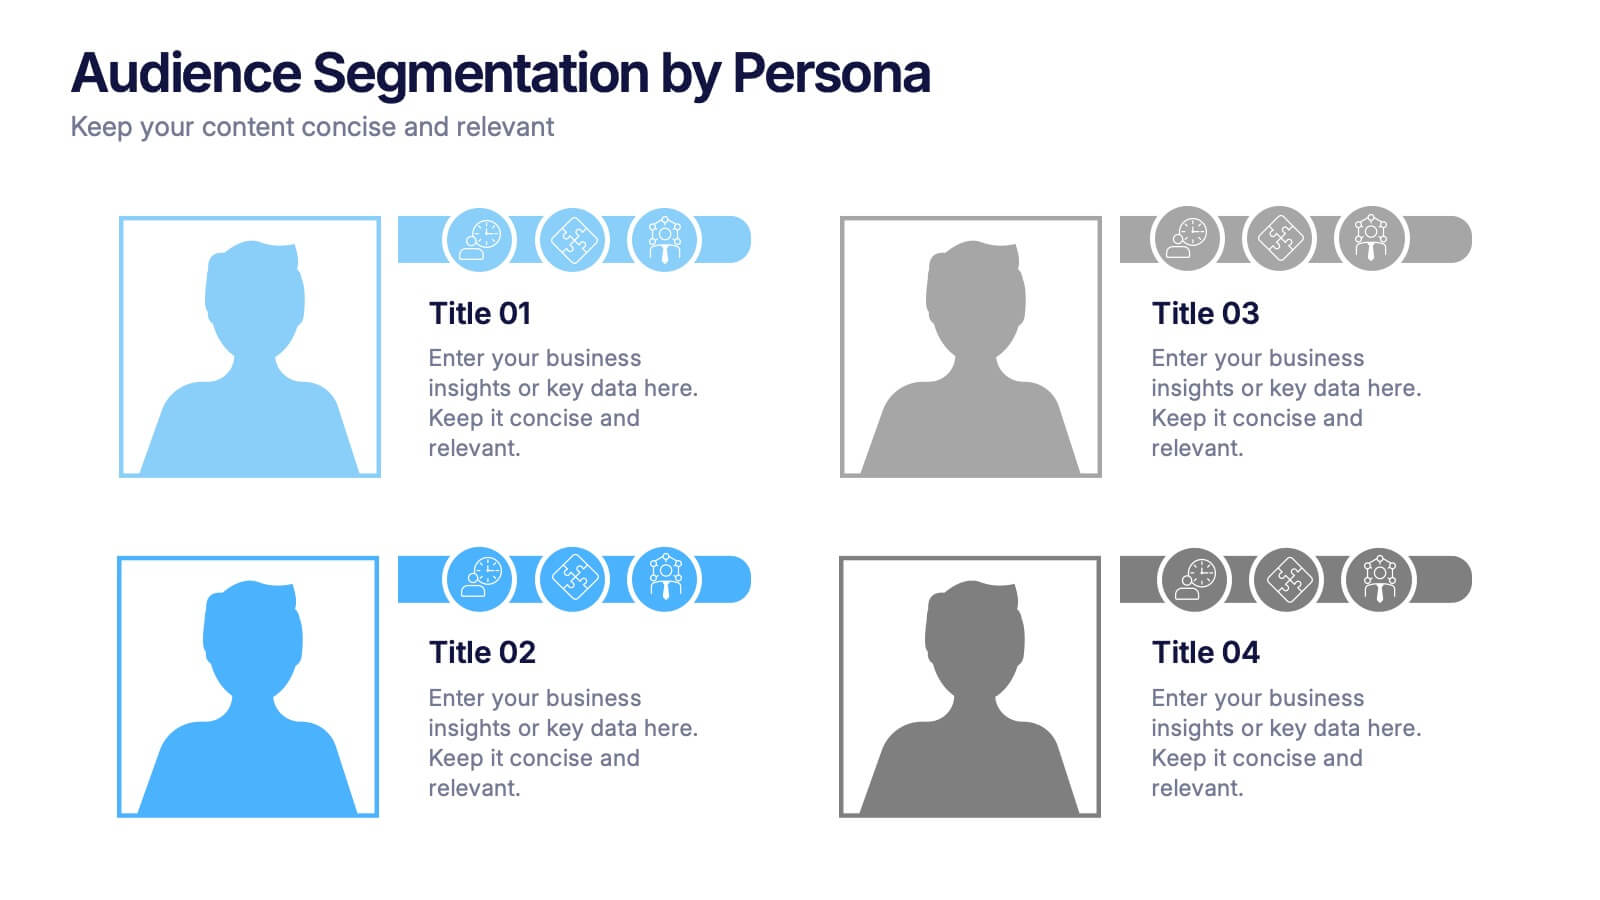
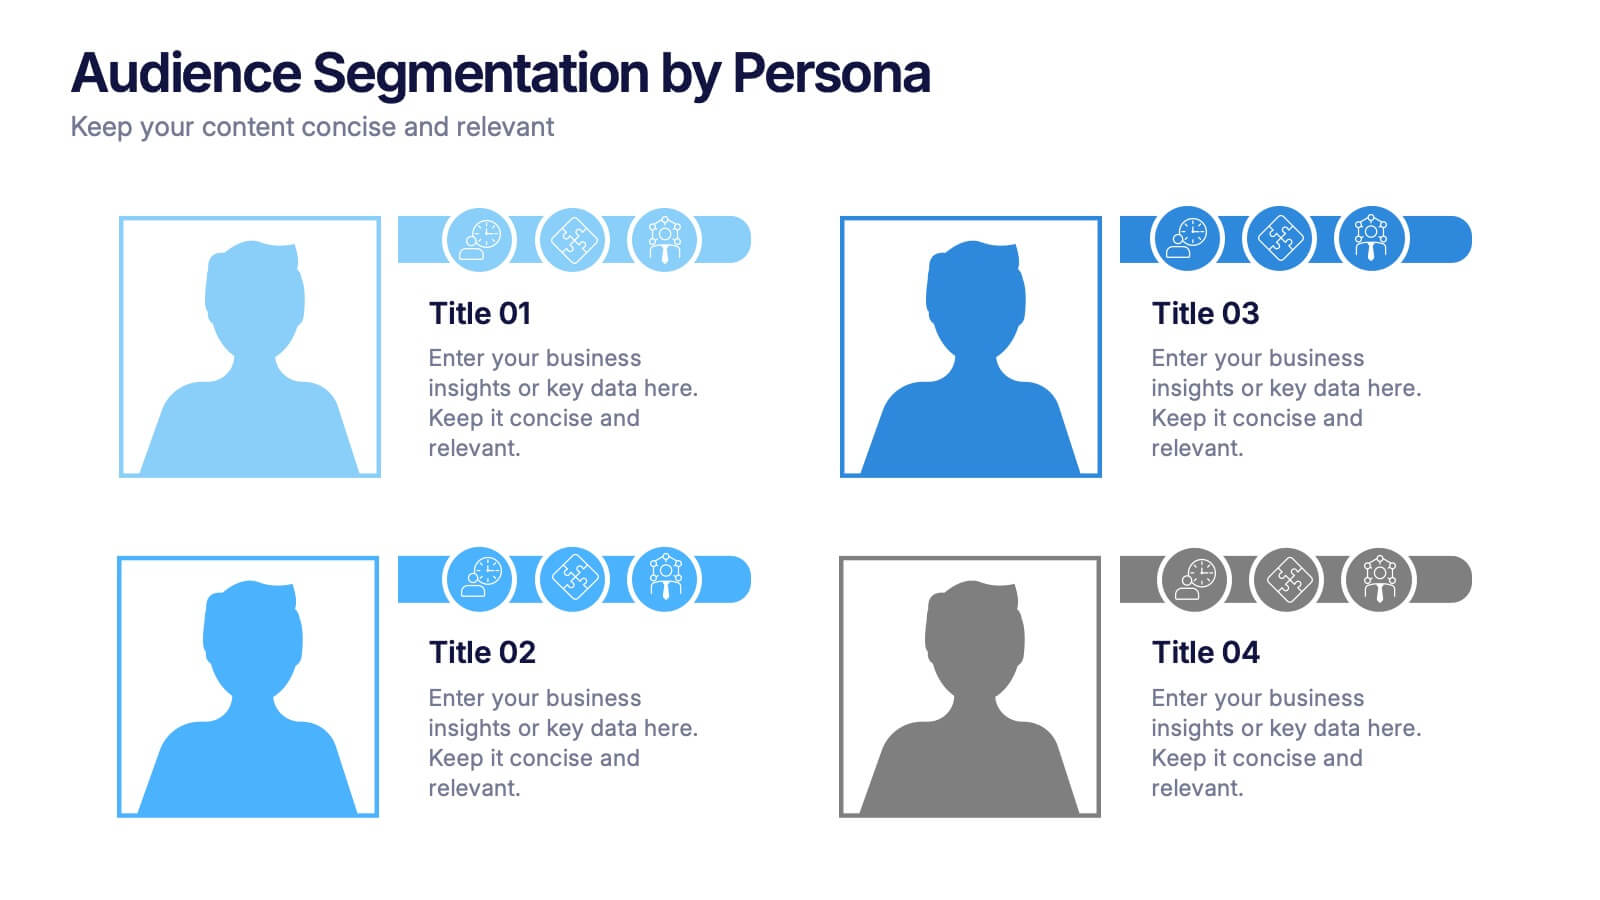
Audience Segmentation by Persona Presentation
Make data talk with personality! This vibrant slide set helps you visually compare buyer personas and their unique traits to refine audience targeting strategies. Whether you’re mapping user types or customer behaviors, these editable slides are perfect for strategic marketing. Fully compatible with PowerPoint, Keynote, and Google Slides.
- Remove from favorites
Powerpoint Template
1 MB
Google Slides Template
External link
Keynote Template
1 MB
7 slides
Porters Five Forces Model Infographic Presentation
Porter's Five Forces Model is a structured framework used to analyze the competitive forces within an industry and their impact on a company's profitability. With template you can create an appealing and informative infographic about Porter's Five Forces Model. Featuring helpful illustrations and easy-to-read text, this template is perfect for breaking down the complex concepts of Porter's Five Forces Model into simple, understandable terms. Designed for use with Powerpoint, Keynote, and Google Slides, you can easily add your own content and tailor the template to fit your specific needs.
- Remove from favorites
Powerpoint Template
1 MB
Google Slides Template
External link
Keynote Template
1 MB
4 slides
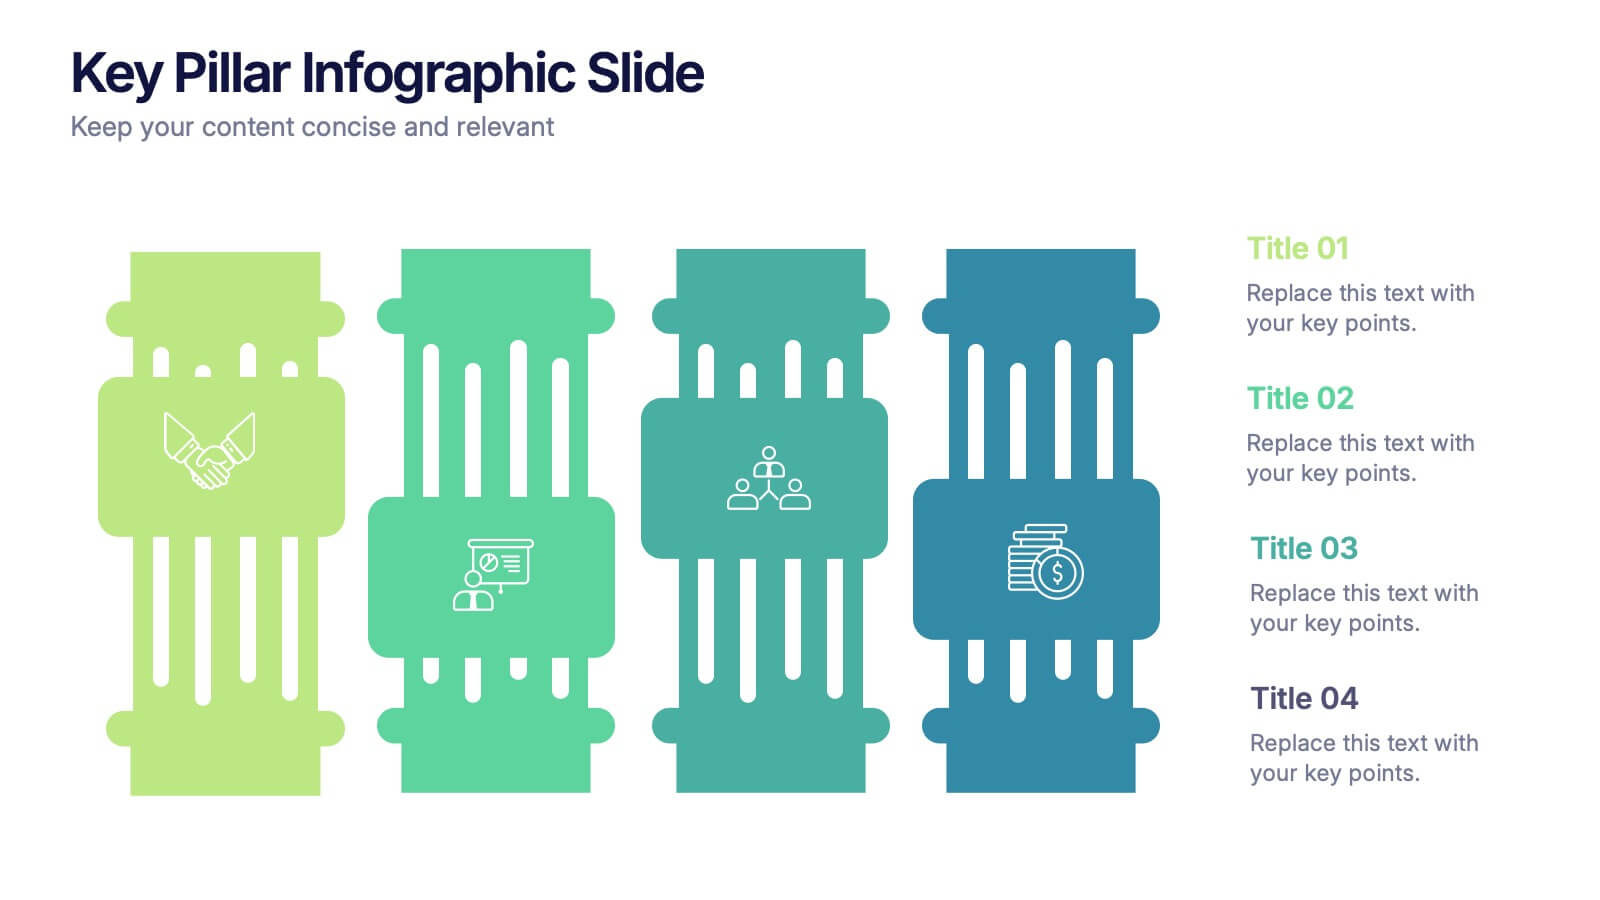
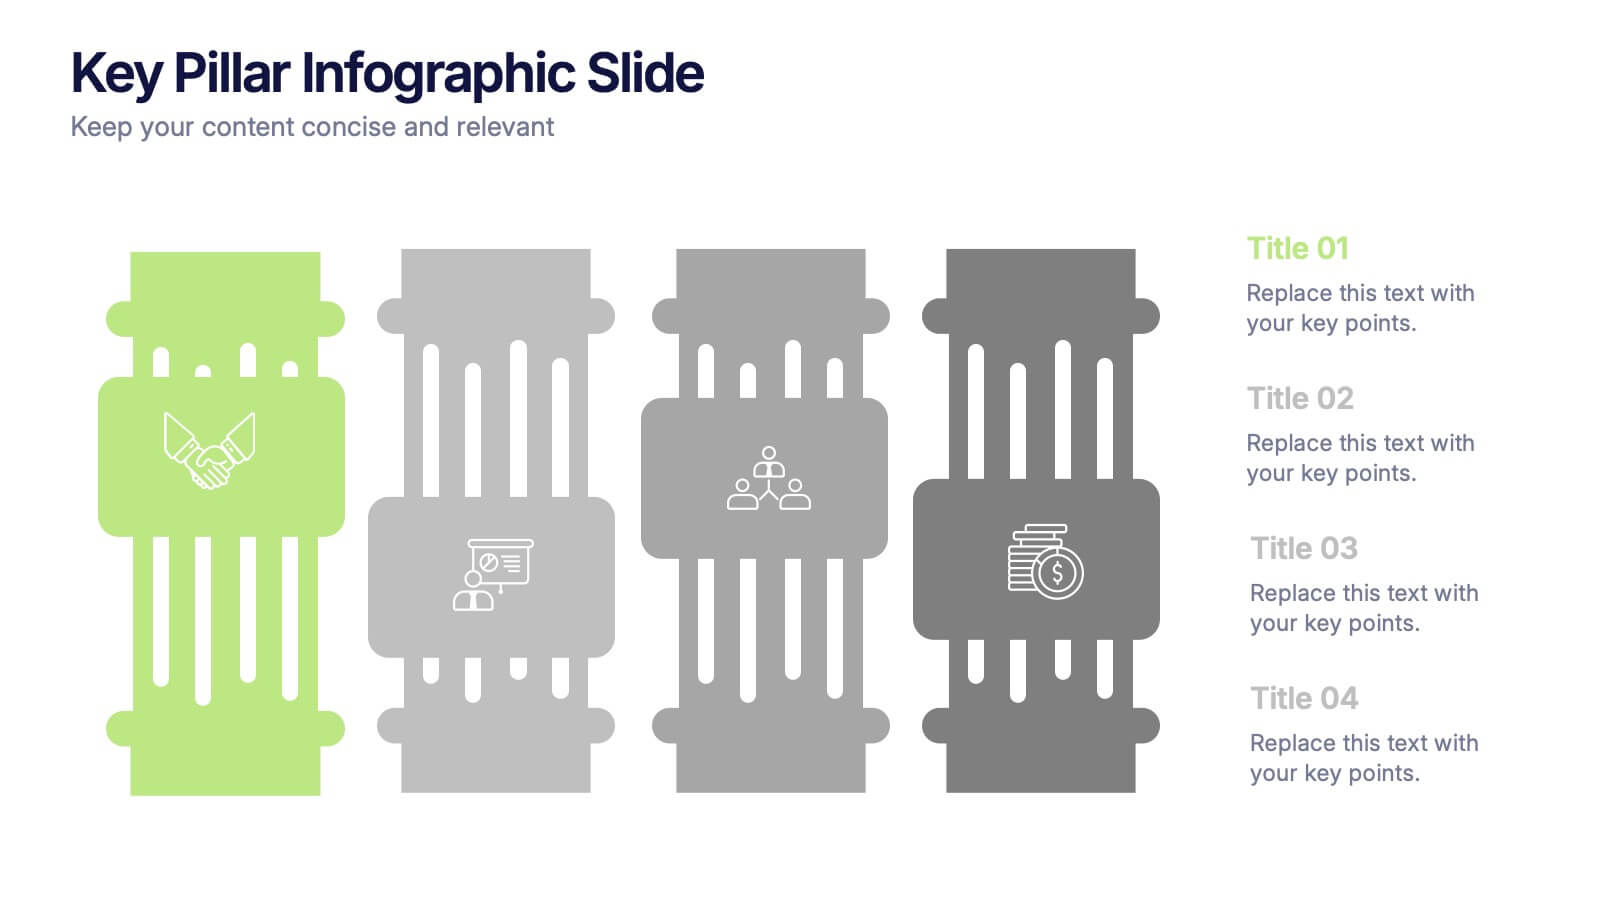
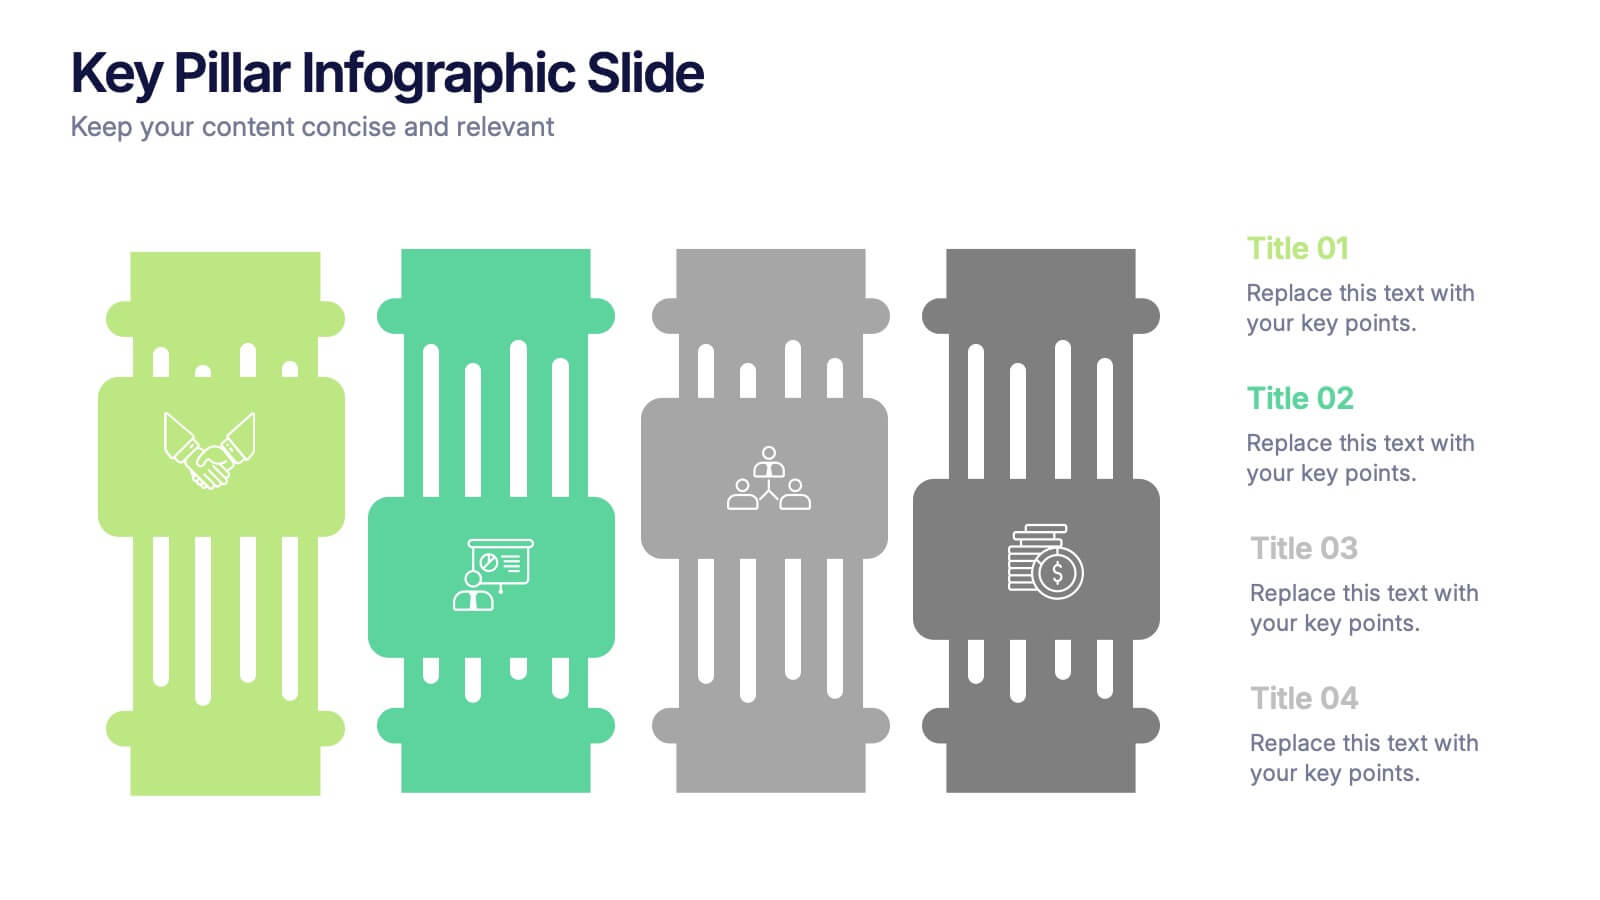
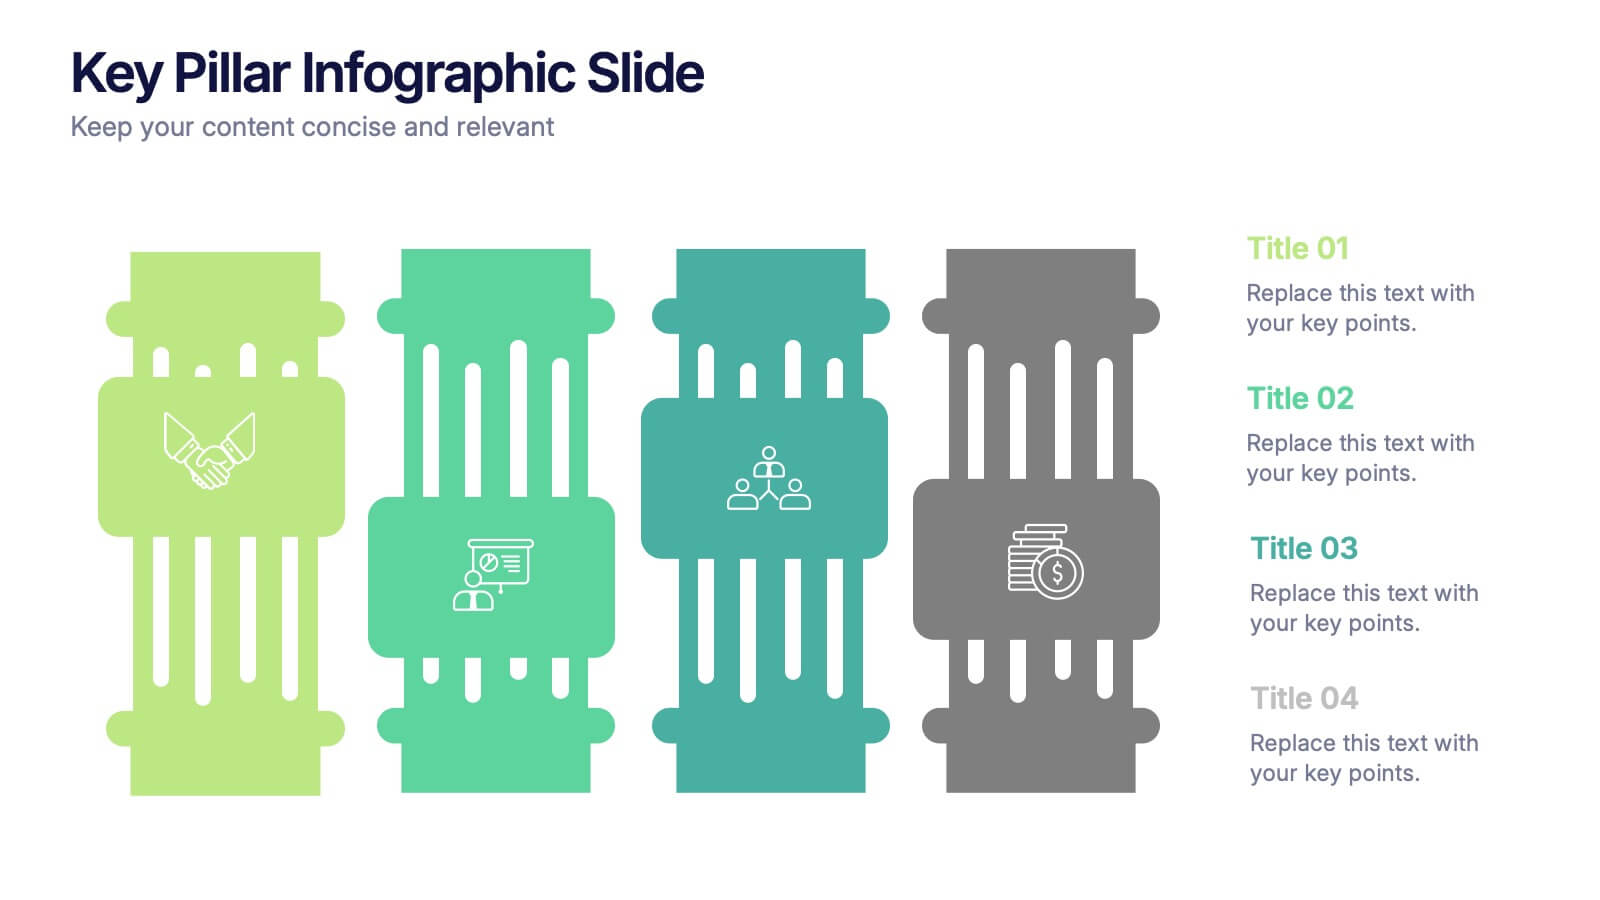
Key Pillar Infographic Slide Presentation
Make your ideas stand tall with this modern pillar-themed infographic layout. Perfect for illustrating strategies, business foundations, or organizational principles, it transforms complex data into visually clear, structured visuals. Fully editable and compatible with PowerPoint, Keynote, and Google Slides for professional and easy-to-customize presentations.
- Remove from favorites
Powerpoint Template
1 MB
Google Slides Template
External link
Keynote Template
2 MB
6 slides
Strategic Blocks in Business Canvas
Visualize and communicate your business model effectively with the Strategic Blocks in Business Canvas Presentation. This slide breaks down all critical segments—Partners, Activities, Resources, Value Propositions, Channels, Revenue Streams, and more—into a clean and colorful layout for strategic planning and stakeholder alignment. Fully editable in PowerPoint, Keynote, and Google Slides.
- Remove from favorites
Powerpoint Template
1 MB
Google Slides Template
External link
Keynote Template
2 MB
8 slides
Leadership Training Workshop Presentation
Boost your team's leadership skills with our 'Leadership Training Workshop' template, perfect for structuring dynamic and effective training sessions. Designed to focus on core leadership competencies, this template supports organizations in cultivating influential leaders. It's fully compatible with PowerPoint, Keynote, and Google Slides, facilitating a seamless integration into your training curriculum.
- Remove from favorites
Powerpoint Template
1 MB
Google Slides Template
External link
Keynote Template
1 MB
6 slides
Milestone Roadmap and Deadlines Presentation
Track progress with clarity using the Milestone Roadmap and Deadlines Presentation. This curved timeline layout highlights six key stages or deliverables with color-coded markers and icons. Perfect for visualizing project phases, quarterly goals, or deadline-driven strategies. Fully editable and compatible with PowerPoint, Keynote, and Google Slides.
- Remove from favorites
Powerpoint Template
1 MB
Google Slides Template
External link
Keynote Template
1 MB
5 slides
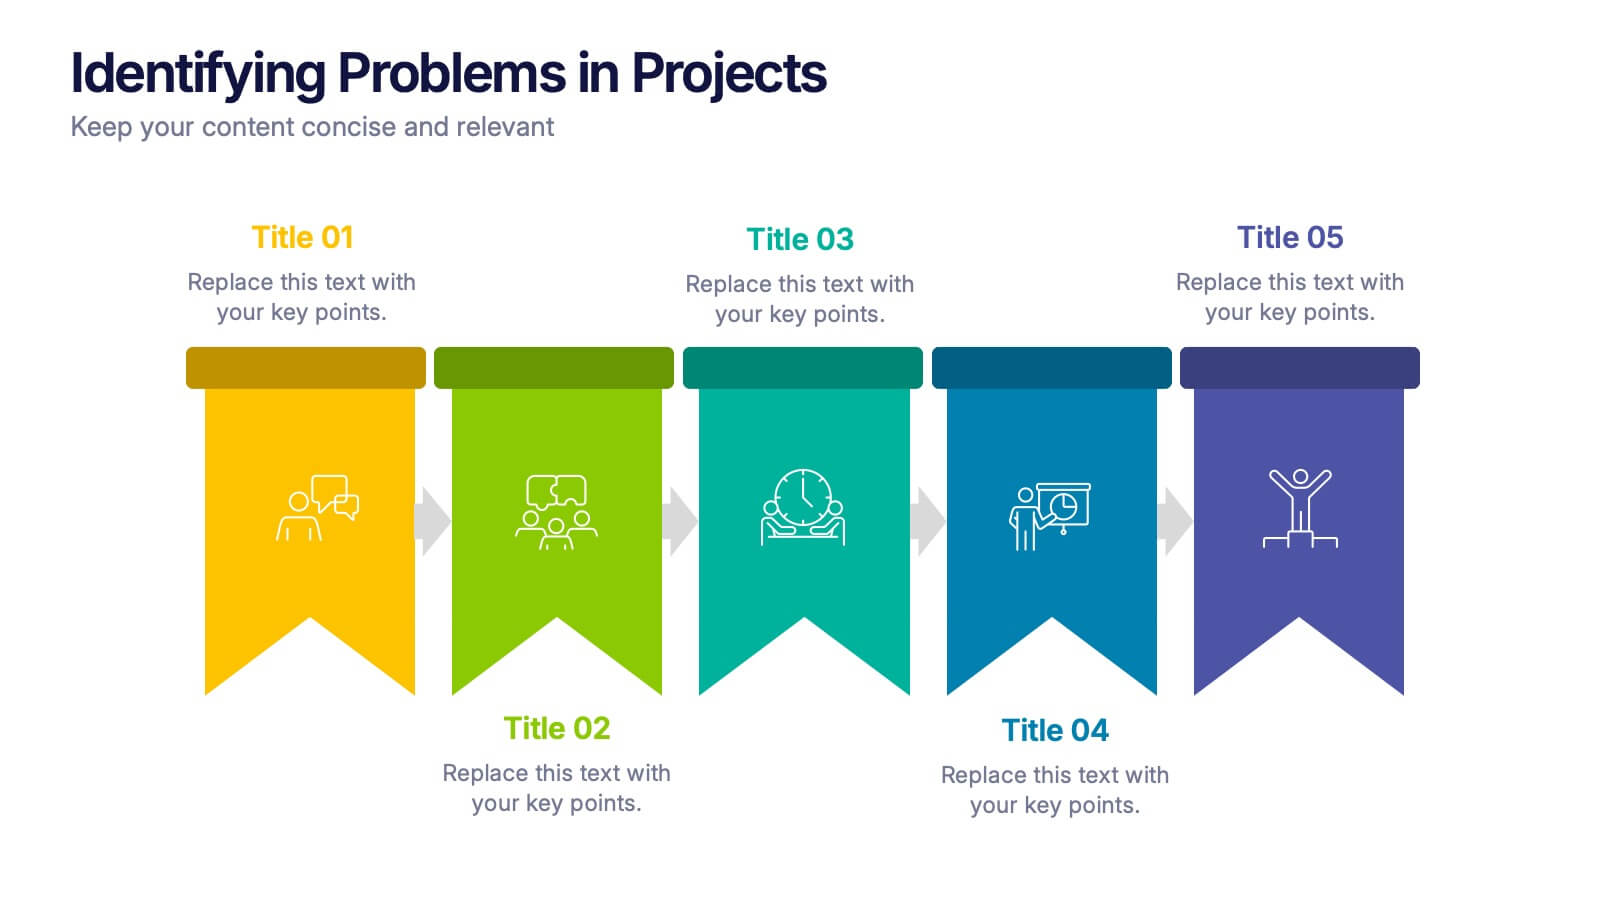
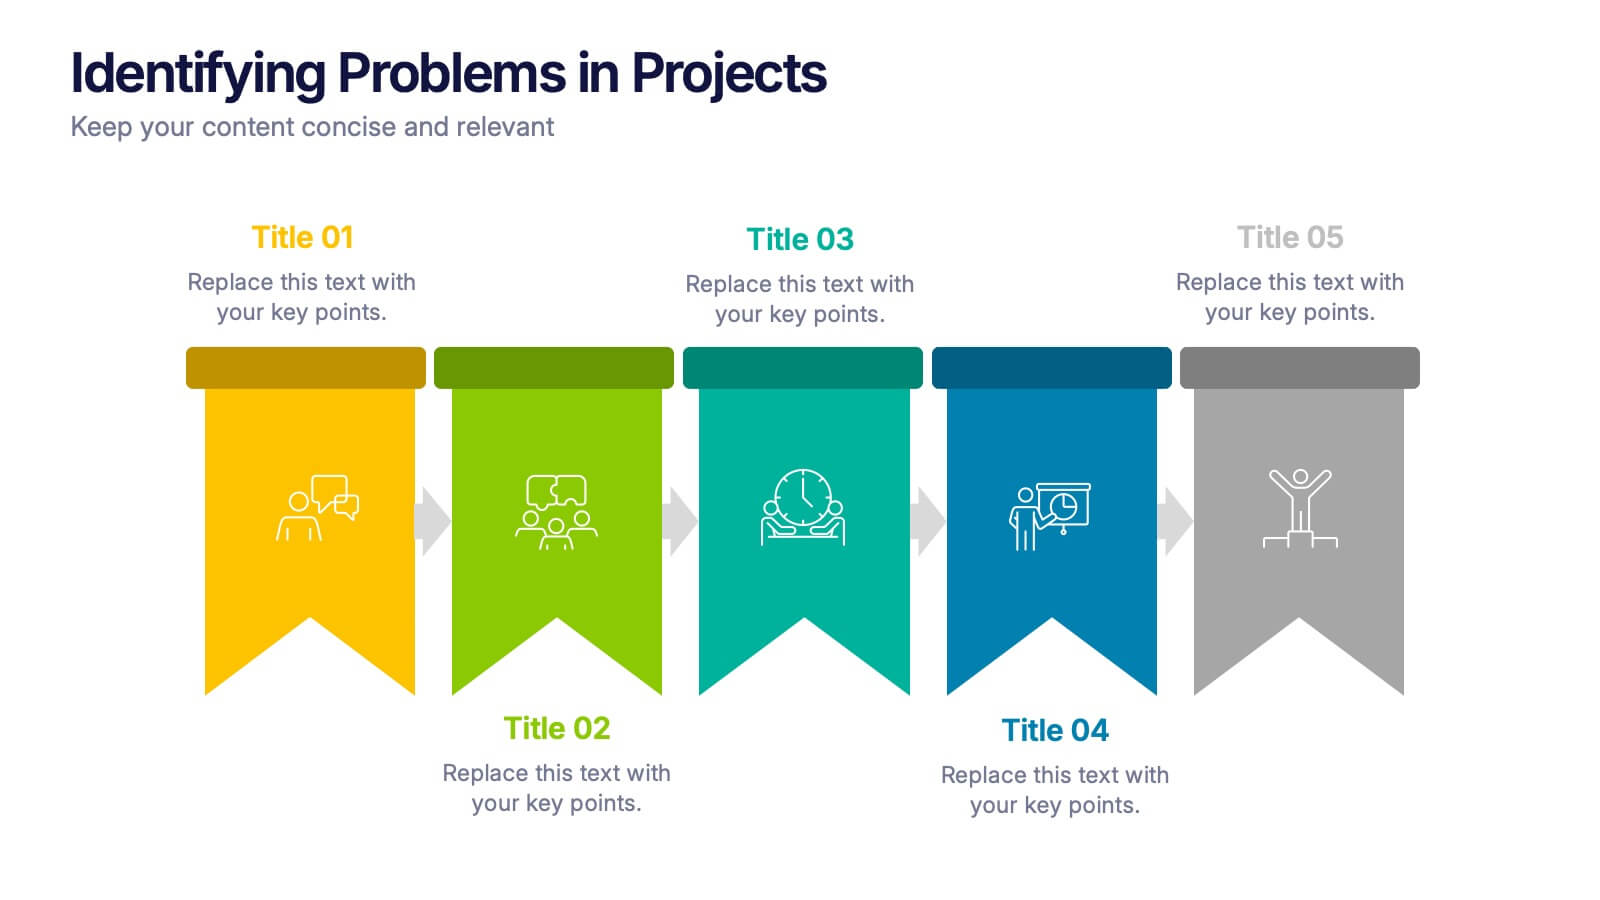
Identifying Problems in Projects Presentation
Kickstart your analysis with a bold, colorful layout that makes uncovering project issues feel clear and structured. This presentation helps you outline challenges, compare causes, and guide teams toward practical solutions using a simple, organized flow. Fully compatible with PowerPoint, Keynote, and Google Slides.
- Remove from favorites
Powerpoint Template
1 MB
Google Slides Template
External link
Keynote Template
1 MB
5 slides
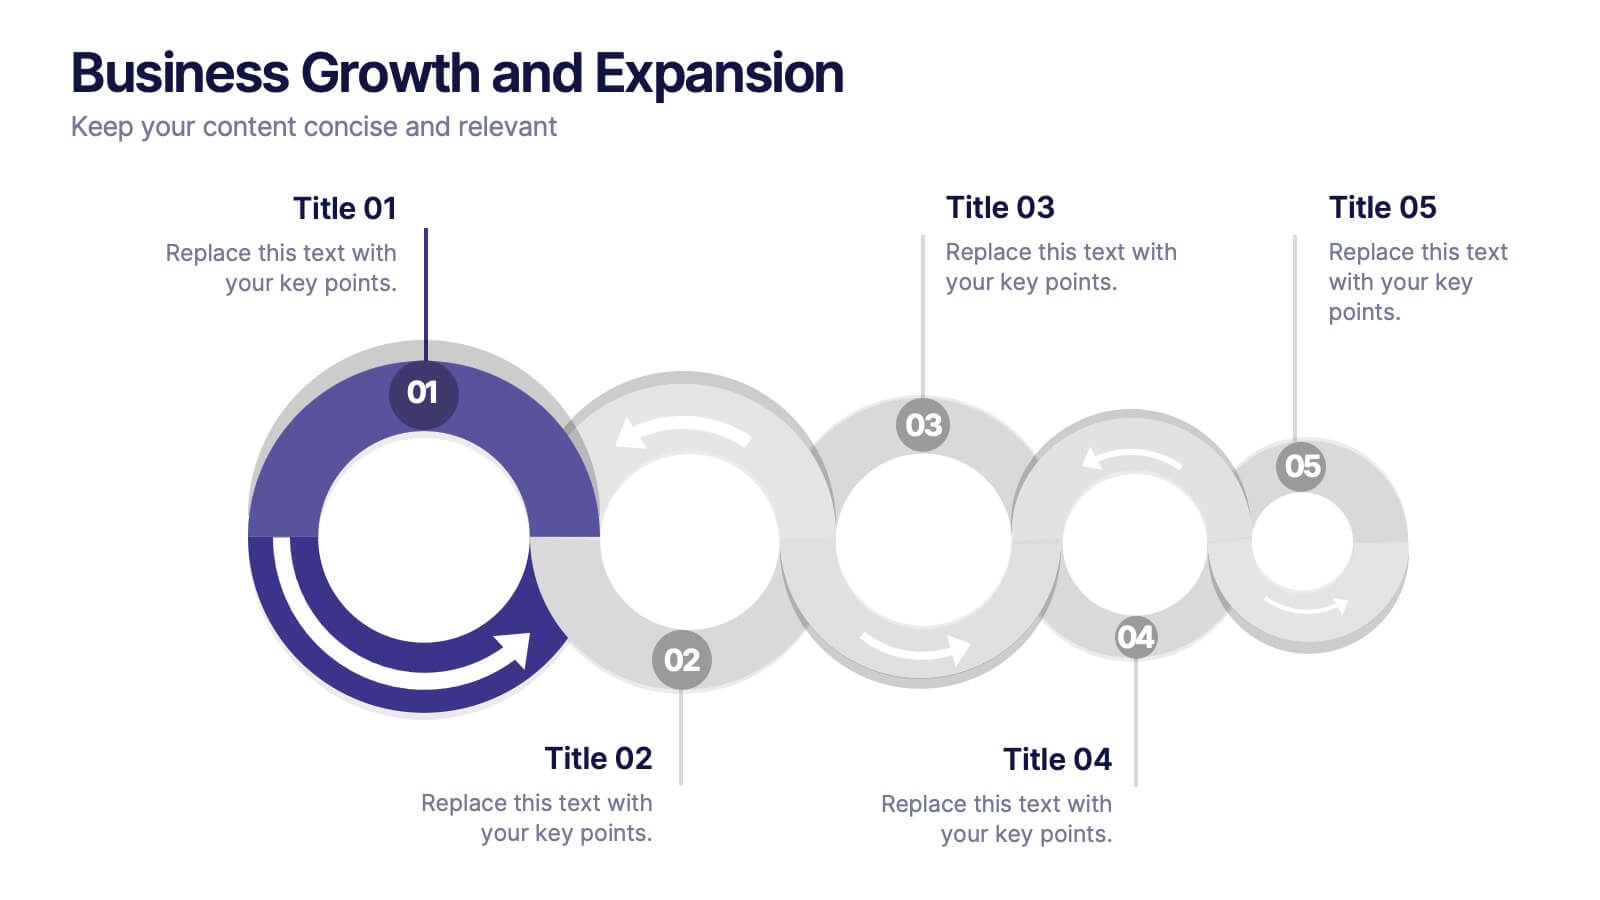
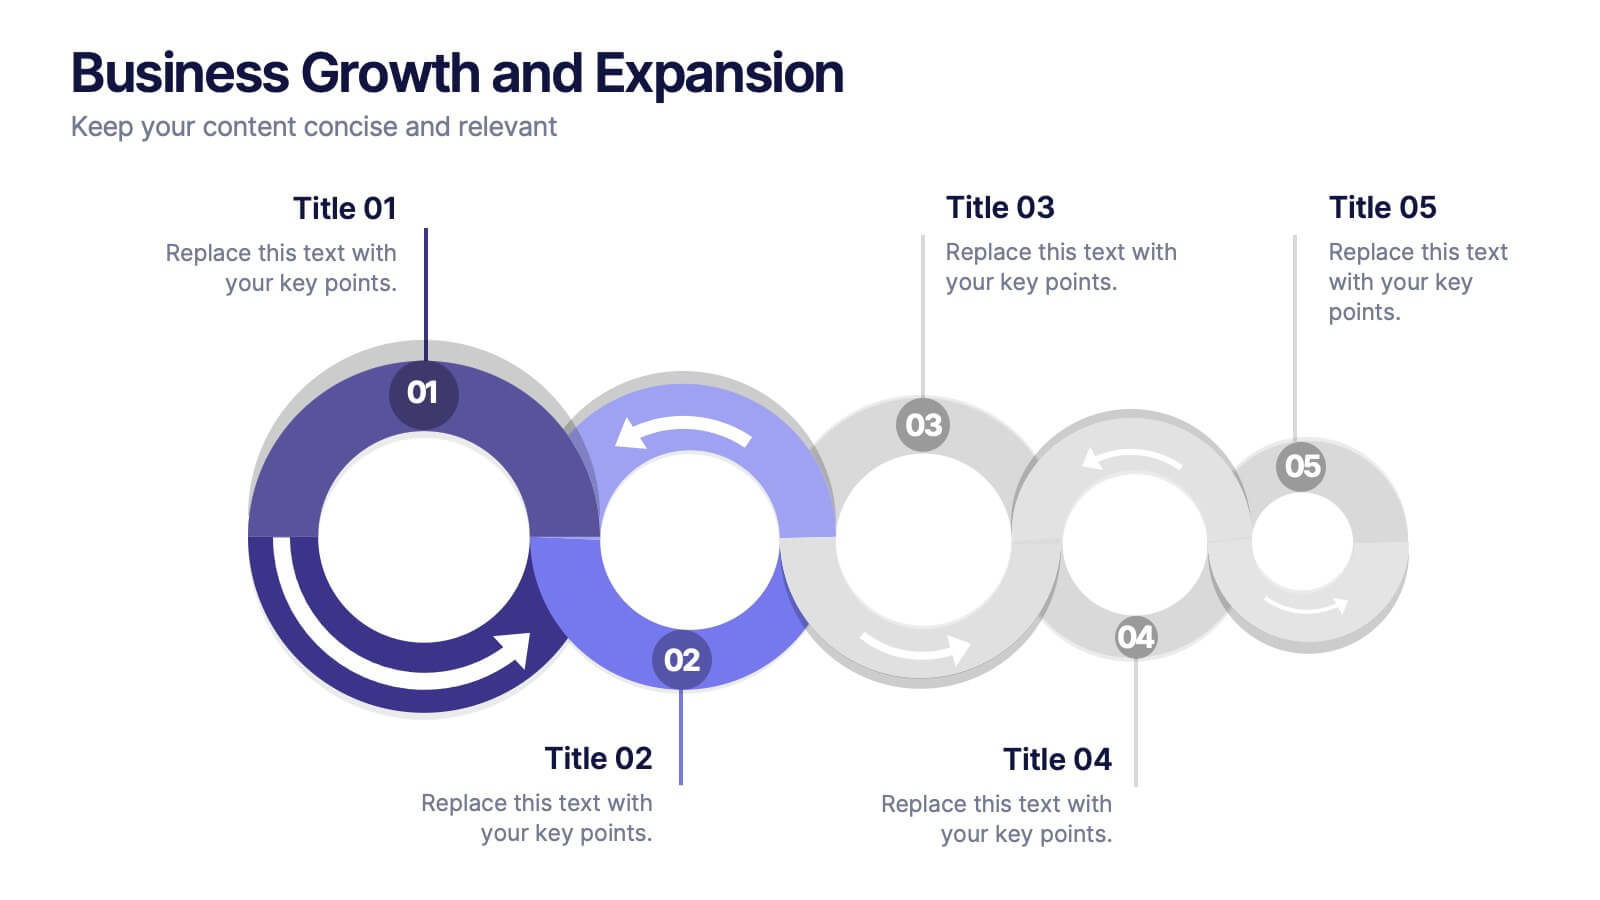
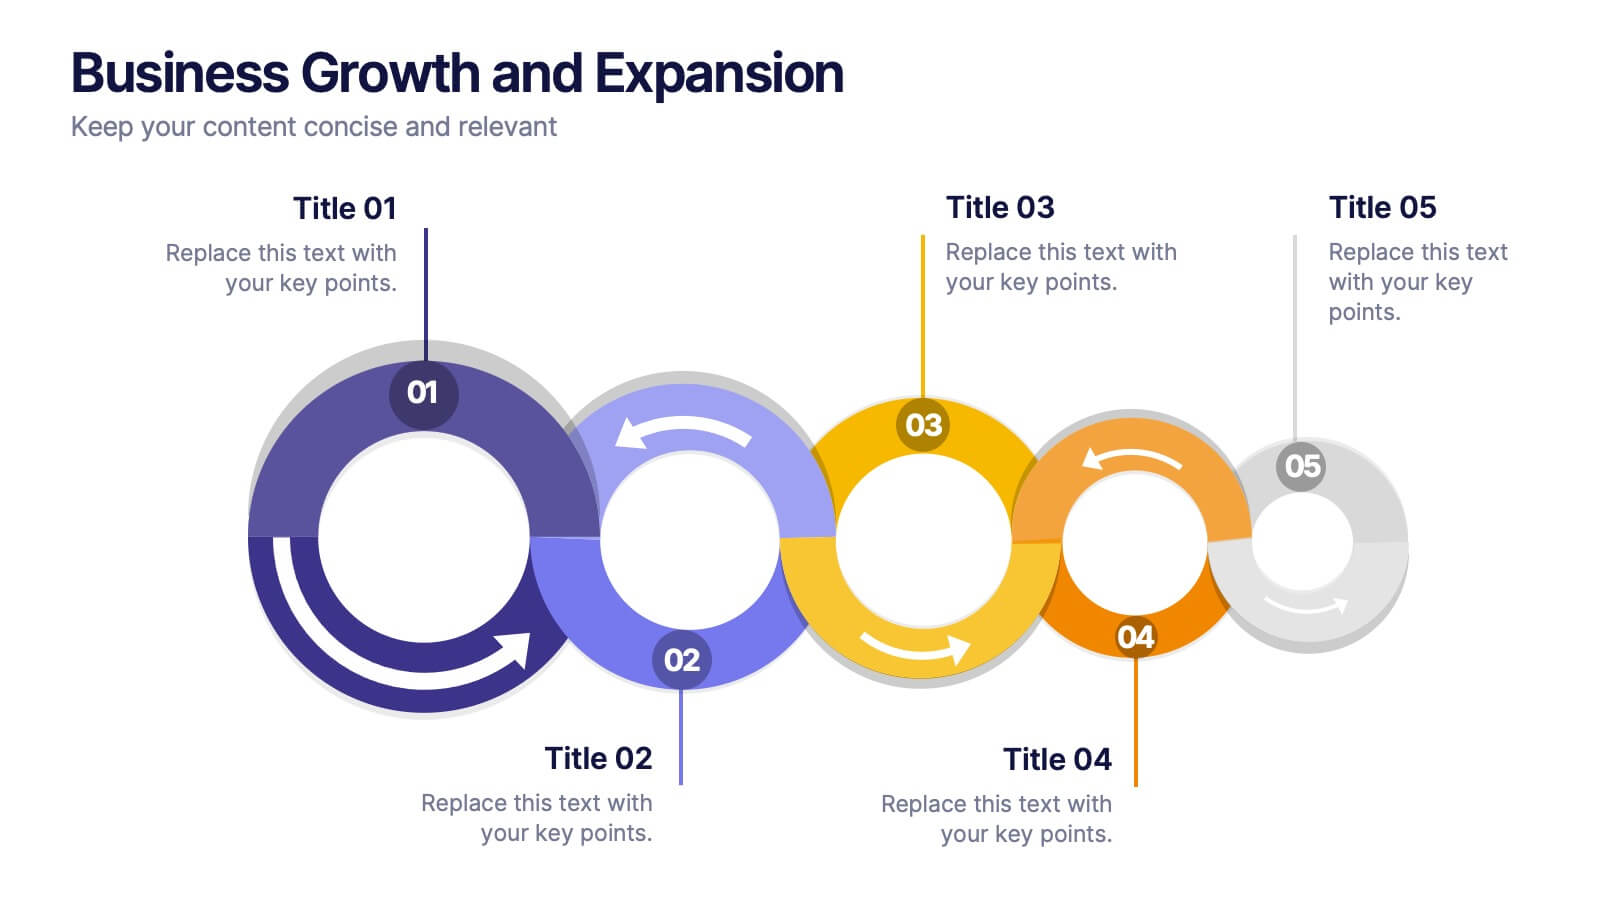
Business Growth and Expansion
Visually communicate each stage of business development with this Business Growth and Expansion diagram. Featuring a dynamic circular flow, this editable slide is perfect for showcasing progress, scaling strategies, or roadmap milestones. Fully compatible with PowerPoint, Keynote, and Google Slides—ideal for business plans and strategic presentations.
- Remove from favorites
Powerpoint Template
1 MB
Google Slides Template
External link
Keynote Template
1 MB
5 slides
Circular Process Cycle Presentation
Visualize continuous workflows or recurring processes with this Circular Process Cycle slide. Featuring five distinct steps arranged around a central loop, each stage is clearly labeled with icons and color-coded titles for seamless comprehension. Perfect for project management, product development, or strategic planning cycles. Fully customizable and compatible with PowerPoint, Keynote, and Google Slides.
- Remove from favorites
Powerpoint Template
1 MB
Google Slides Template
External link
Keynote Template
1 MB
5 slides
HIV Awareness Programs Infographics
HIV awareness programs are initiatives aimed at educating individuals and communities about HIV (human immunodeficiency virus), it’s transmission, prevention, and the importance of testing and treatment. These vertical infographics are designed to raise awareness about HIV/AIDS and promote education about prevention, testing, and support. This presentation is suitable for organizations, healthcare professionals, educators, or anyone interested in spreading awareness about HIV and its impact on individuals and communities. This incorporates visually engaging infographics and statistics to present key information and data related to HIV/AIDS.
- Remove from favorites
Powerpoint Template
1 MB
Google Slides Template
External link
Keynote Template
1 MB
5 slides
Corporate Framework and Structure
Visualize governance, compliance, and assurance in a streamlined framework. This structured slide is ideal for outlining business functions, responsibilities, and reporting lines across departments. Fully editable in PowerPoint, Keynote, and Google Slides for seamless customization.
- Remove from favorites
Powerpoint Template
1 MB
Google Slides Template
External link
Keynote Template
1 MB
8 slides
Team OKRs Planning and Monitoring Presentation
Foster alignment across teams with the Team OKRs Planning and Monitoring Presentation. This creative hand-shaped visual helps illustrate collaboration between objectives, key results, and responsibilities. Ideal for performance check-ins, OKR workshops, and team planning meetings. Fully customizable in PowerPoint, Canva, Keynote, and Google Slides for seamless integration.
- Remove from favorites
Powerpoint Template
10 MB
Google Slides Template
External link
Keynote Template
7 MB
7 slides
Watercolor Plan Infographic
A watercolor plan infographic refers to an infographic design or style that incorporates elements of watercolor painting. Dive into the world of dreams and aspirations with our watercolor plan infographic template. This artistic and visually captivating infographic guides you through your plans and goals with the fluidity and creativity of watercolors. This infographic is a visually stunning and inspiring template that transforms the process of goal setting into an artistic masterpiece, encouraging individuals to paint their dreams with vivid hues of determination and creativity.
- Remove from favorites
Powerpoint Template
1 MB
Google Slides Template
External link
Keynote Template
1 MB
6 slides
Business Performance Dashboard
Enhance your business presentations with our "Business Performance Dashboard" template. This comprehensive infographic provides a detailed overview of crucial business metrics, structured within a user-friendly dashboard layout. It includes financial data like total orders and cash on hand, operational stats such as project updates, and engagement metrics including views and follows. Each section is visually distinct, with icons and color blocks that make data easy to read and analyze. Ideal for managers and analysts, this template offers a snapshot of company performance, facilitating informed decision-making and efficient reporting. Compatible with PowerPoint, Keynote, and Google Slides, it's an essential tool for any business analysis.


