


Features
- 4 Unique slides
- Fully editable and easy to edit in Microsoft Powerpoint, Keynote and Google Slides
- 16:9 widescreen layout
- Clean and professional designs
- Export to JPG, PDF or send by email


Do you have any questions?
Recommend


4 slides
Agricultural Market Trends Presentation
Highlight industry insights with this Agricultural Market Trends presentation template, featuring tractor and landscape graphics for a modern, rural-inspired look. Perfect for market reports, crop production analysis, or agribusiness proposals. Fully editable in Canva, PowerPoint, and Google Slides, allowing you to customize icons, text, and colors to match your brand.


3 slides
Key Stats and Market Figures Slide Presentation
Communicate comparisons clearly with the Key Stats and Market Figures Slide presentation. This template uses a balanced scale graphic to visually contrast two data sets—ideal for weighing pros and cons, competitor benchmarks, or before-and-after scenarios. Fully customizable in PowerPoint, Keynote, and Google Slides.


4 slides
Current vs Future State Gap Presentation
Take your audience on a journey of progress with this dynamic slide, designed to clearly compare where things stand today and where they’re headed next. It helps highlight key gaps, improvement areas, and strategic opportunities with a simple, visual flow. Fully compatible with PowerPoint, Keynote, and Google Slides.


7 slides
6-Part Hexagon Layout Presentation
Give your ideas a geometric edge with a clean, balanced design that brings structure to complex information. This presentation visually organizes six key elements in a connected, circular layout—perfect for processes, strategies, or frameworks. Fully customizable and compatible with PowerPoint, Keynote, and Google Slides for professional presentations.


7 slides
AIDA Model Infographic Presentation Template
The AIDA model is the most commonly used marketing communication formula. It describes how people are influenced by advertising, and how brands can use this to their advantage. The AIDA model of marketing is a well-known strategy for organizations to use when presenting products and services. With this template you will be sure you have every element of the AIDA model covered in your presentation. This template will provide you with a perfect and easy way to create your ideal AIDA model presentation. This includes a comprehensive overview of the AIDA marketing funnel and how it works.


7 slides
Milestones Infographic Presentation Template
Our milestones infographic template includes a professional background and imagery to create a high-quality presentation that’s sure to grab your audience’s attention. This template is full of visual and engaging elements that will draw your audience in. It's a great starting point to make your own presentation, or to use as a template for future presentations. All slides are fully editable in PowerPoint so you can add and change text and images as desired, It's very easy to edit and customize the shapes and colors. Use this high-resolution template to present your topic in a professional way!


10 slides
Customer Survey Feedback Insights Presentation
Highlight key takeaways from your reviews with the Customer Survey Feedback Insights Presentation. This sleek layout uses a vertical timeline with icons and star ratings to present customer input clearly and professionally. Ideal for showcasing survey results, testimonials, or product improvement insights. Fully editable in Canva, PowerPoint, Google Slides, and Keynote.


26 slides
Arana Presentation Template
Arana is a minimal and stylish template to create stunning presentations. This template is perfect for training your business staff or team on how to use various services or products. It's easy to use, resulting in high quality presentations that look great to your clients or customers. Its slide designs can be used with each other to make more elaborate presentations complete with charts, images and text boxes. Arana simple yet stylish design makes it easy for anyone to use. With the large amount of information included, your presentation will look lighter, appealing, and easy to understand.


7 slides
Decision Points Infographic
Decision points are specific moments or junctures within a process, project, or any situation where a decision needs to be made. This infographic template is designed to illuminate the path of choices, empowering you to make informed decisions and steer towards success. Compatible with Powerpoint, Keynote, and Google Slides. This infographic symbolizes the diverse options one encounters in their journey, and the importance of choosing wisely. The graphs and charts depicting the dilemmas encountered, emphasize the analytical process of weighing pros and cons to arrive at the best decision.


5 slides
Startup Business Pitch Deck Presentation
Impress investors with this clean and modern pitch deck slide, designed to showcase business growth and funding stages. Featuring a sleek stacked ring graphic with a rocket icon for visual impact, this layout is perfect for presenting milestones, KPIs, or financial progress. Fully editable in PowerPoint, Keynote, and Google Slides.


8 slides
Business Strategy Alternatives
Present multiple strategic paths with this creative 4-way arrow infographic. Designed to clearly display four different options or directions, it’s ideal for scenario analysis, strategic planning, or decision-making meetings. Each path is paired with an icon and description for easy interpretation. Fully editable in PowerPoint, Keynote, and Google Slides.


6 slides
Building Strong Business Relationships Presentation
Forge successful partnerships with the Building Strong Business Relationships template, crafted to effectively communicate the key elements of corporate collaboration and networking. With structured content areas and dynamic graphic elements, this template effectively presents business strategies. It's compatible with PowerPoint, Keynote, and Google Slides, making it versatile for various professional settings.


7 slides
Porter's Five Forces Analysis Infographic
Unveil the key elements influencing your industry with Porter's Five Forces Analysis Infographic. Drenched in vibrant shades of yellow, blue, and white, this template offers a lucid visualization of the five crucial forces that determine the competitive intensity in the market. Ideal for business analysts, strategy planners, or management students, it offers a nuanced understanding of market dynamics. Its engaging design captures attention while facilitating comprehensive discussions on potential opportunities or threats. With compatibility across PowerPoint, Keynote, and Google Slides, it promises smooth transitions during presentations.


20 slides
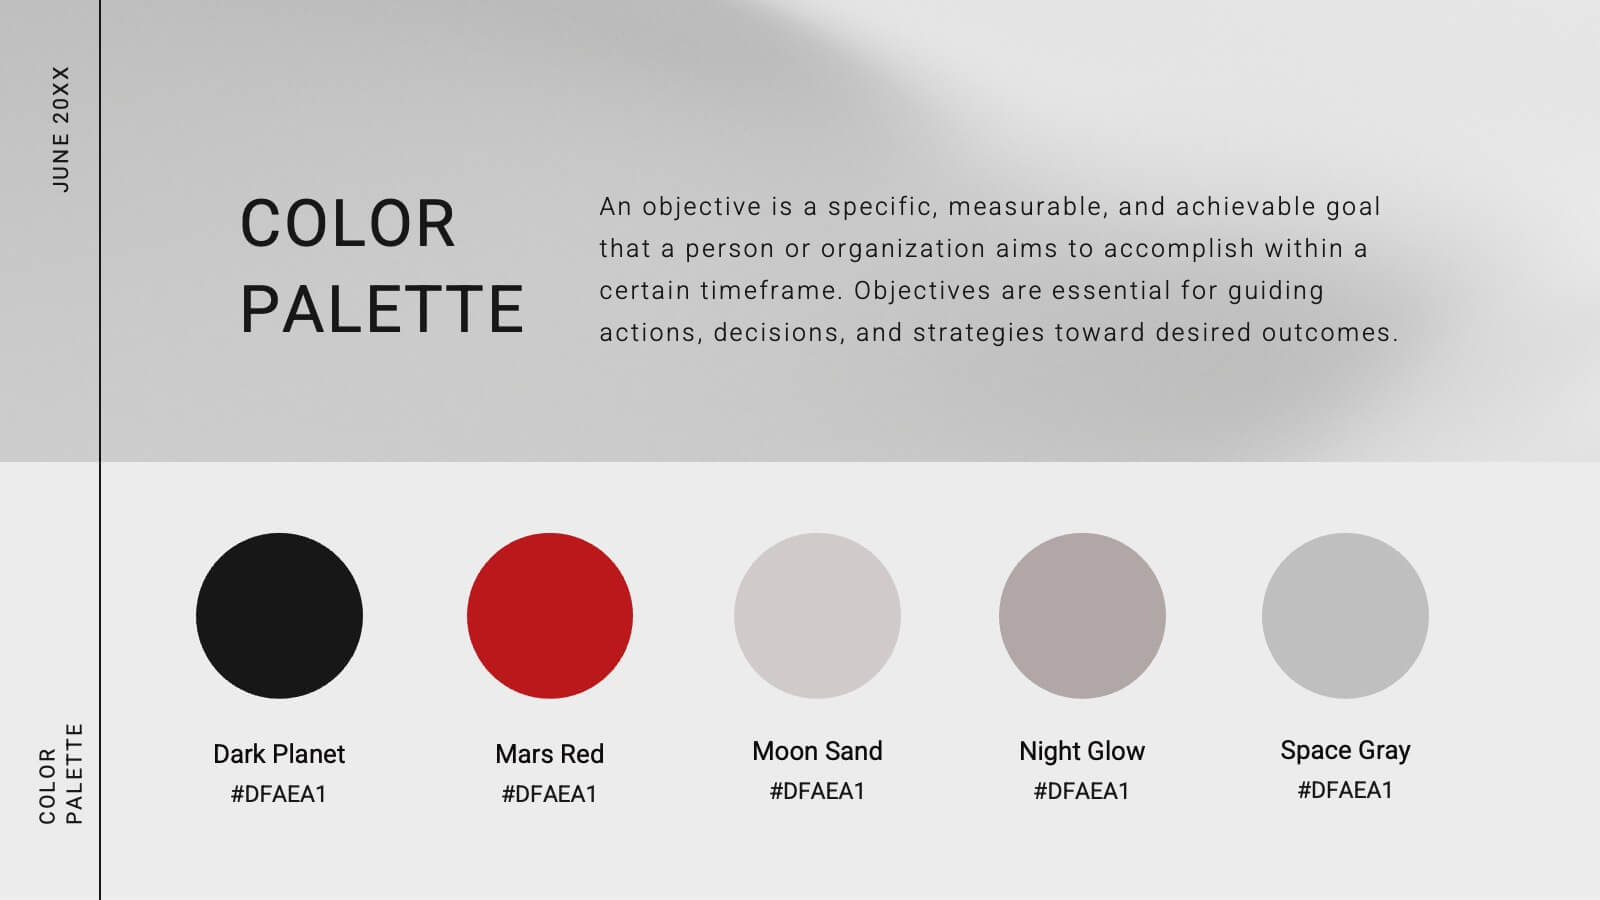
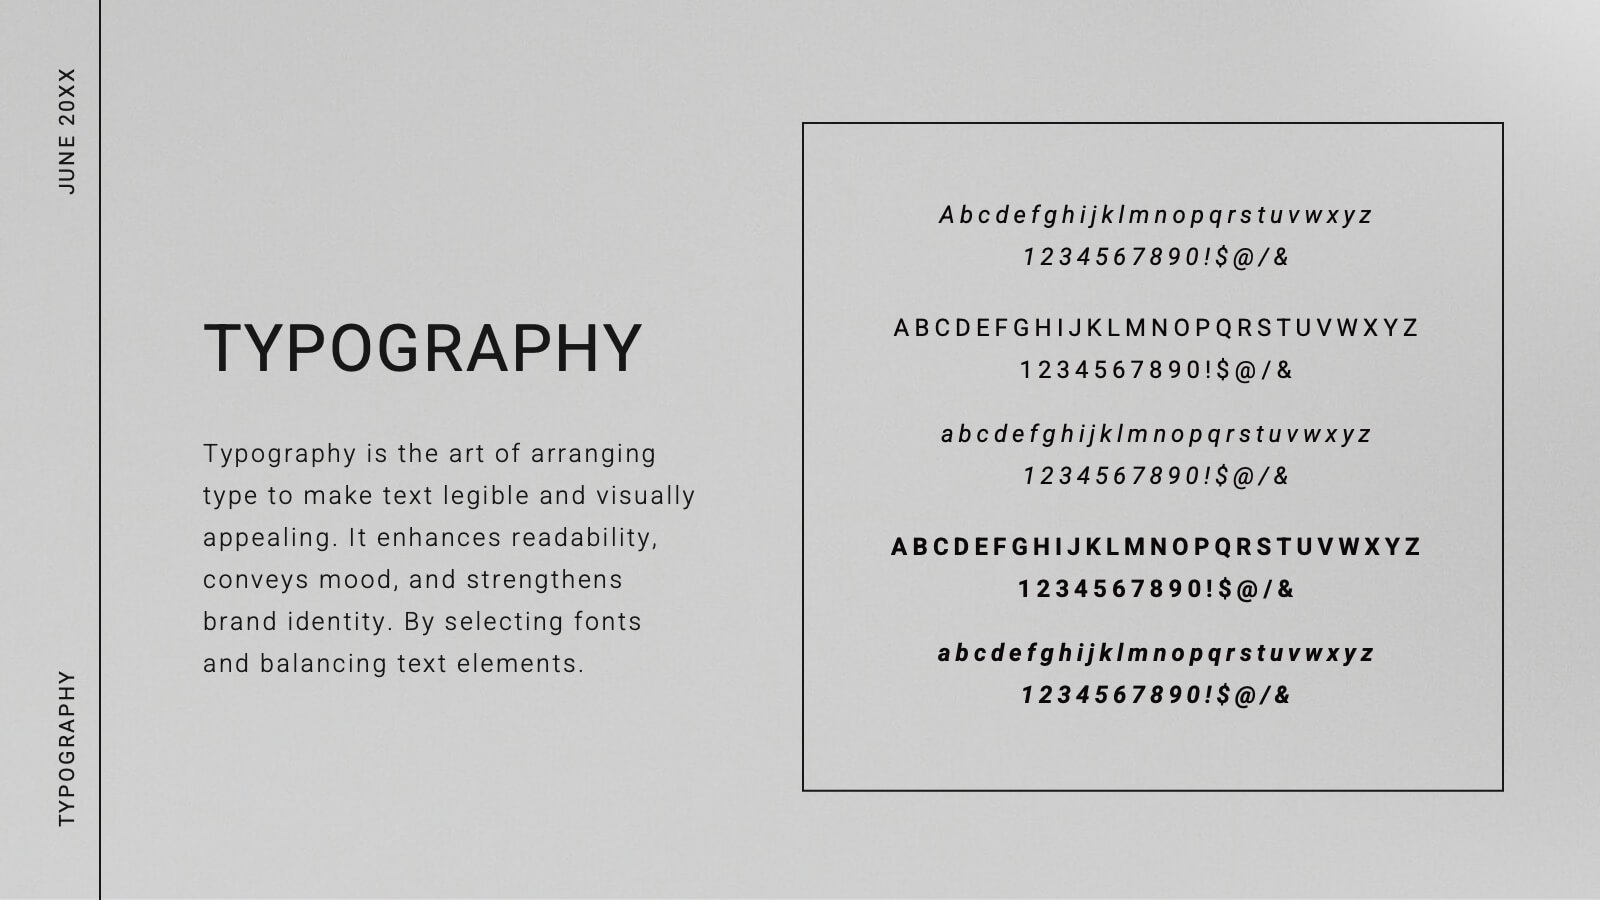
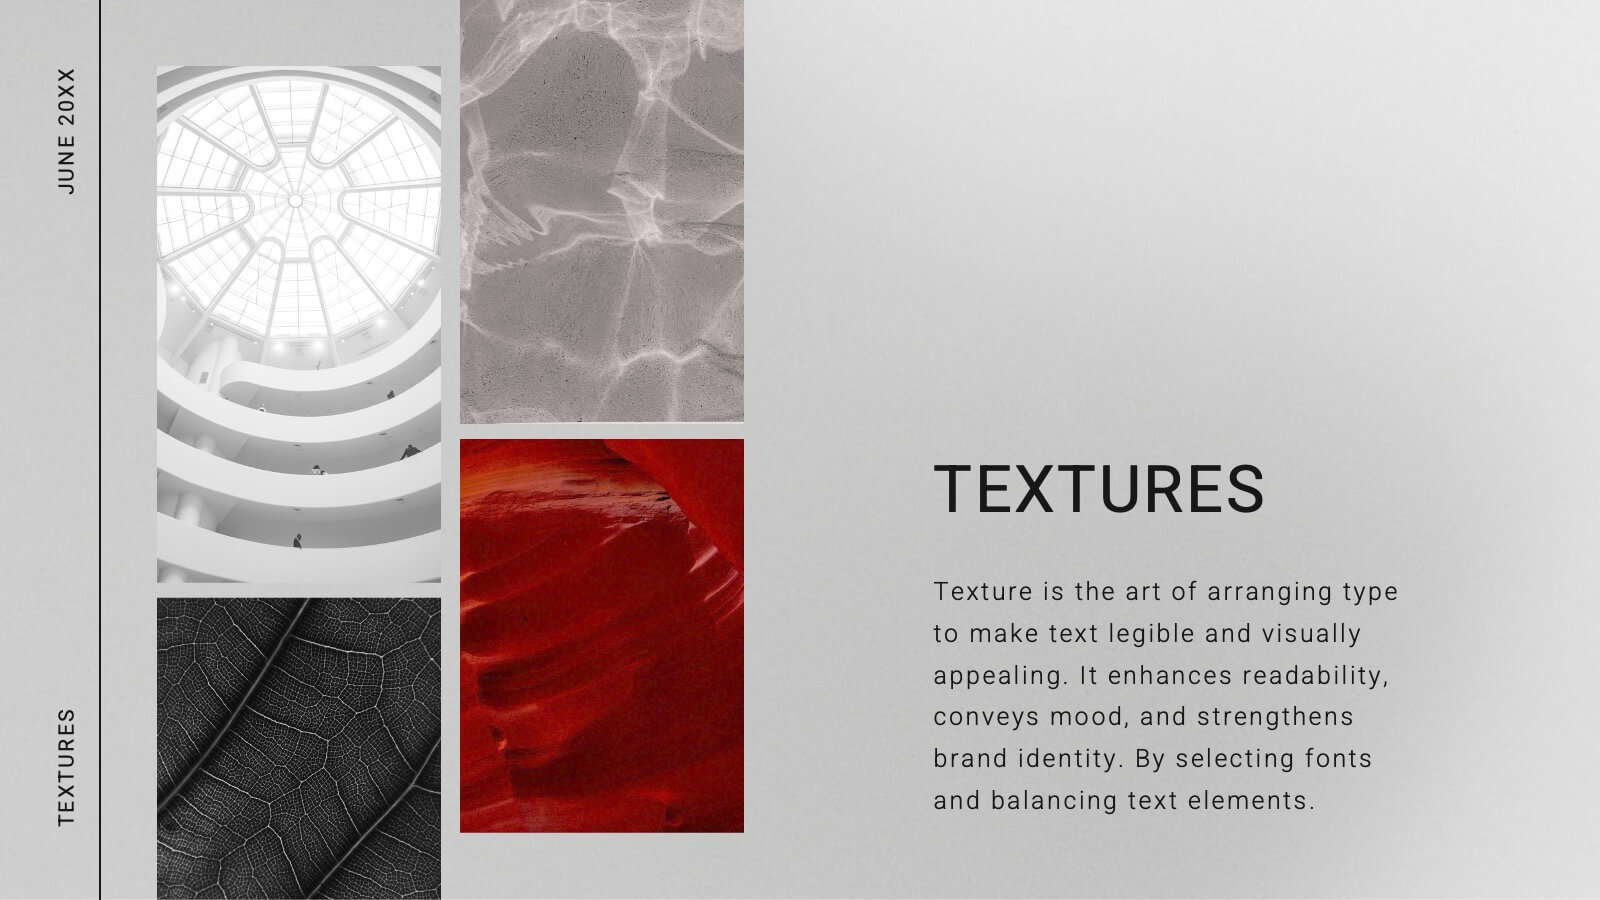
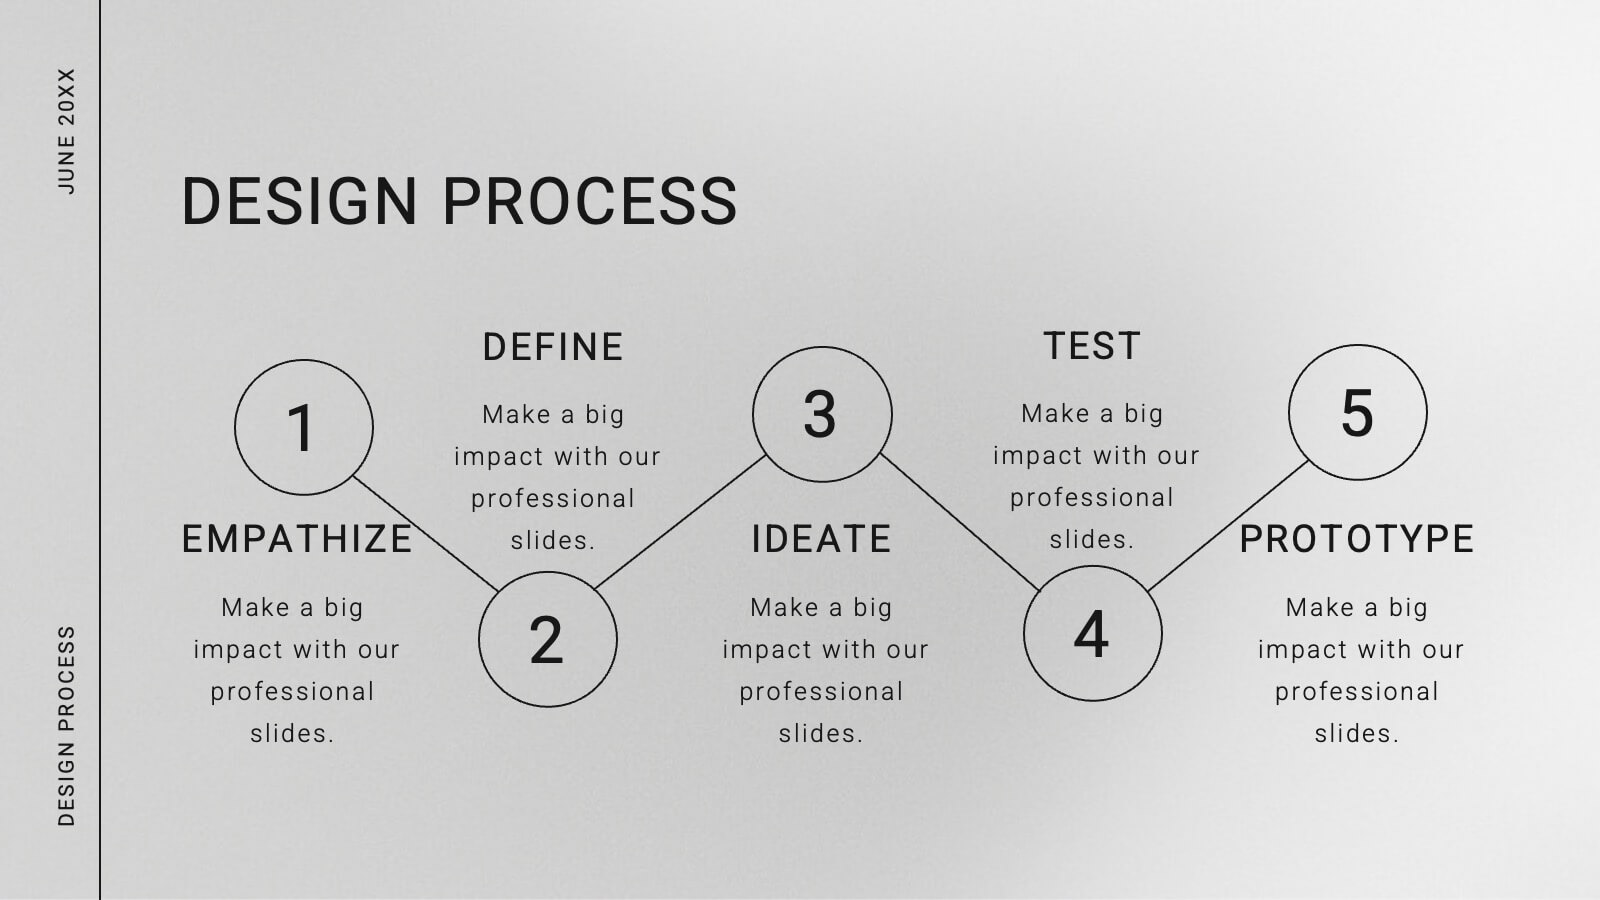
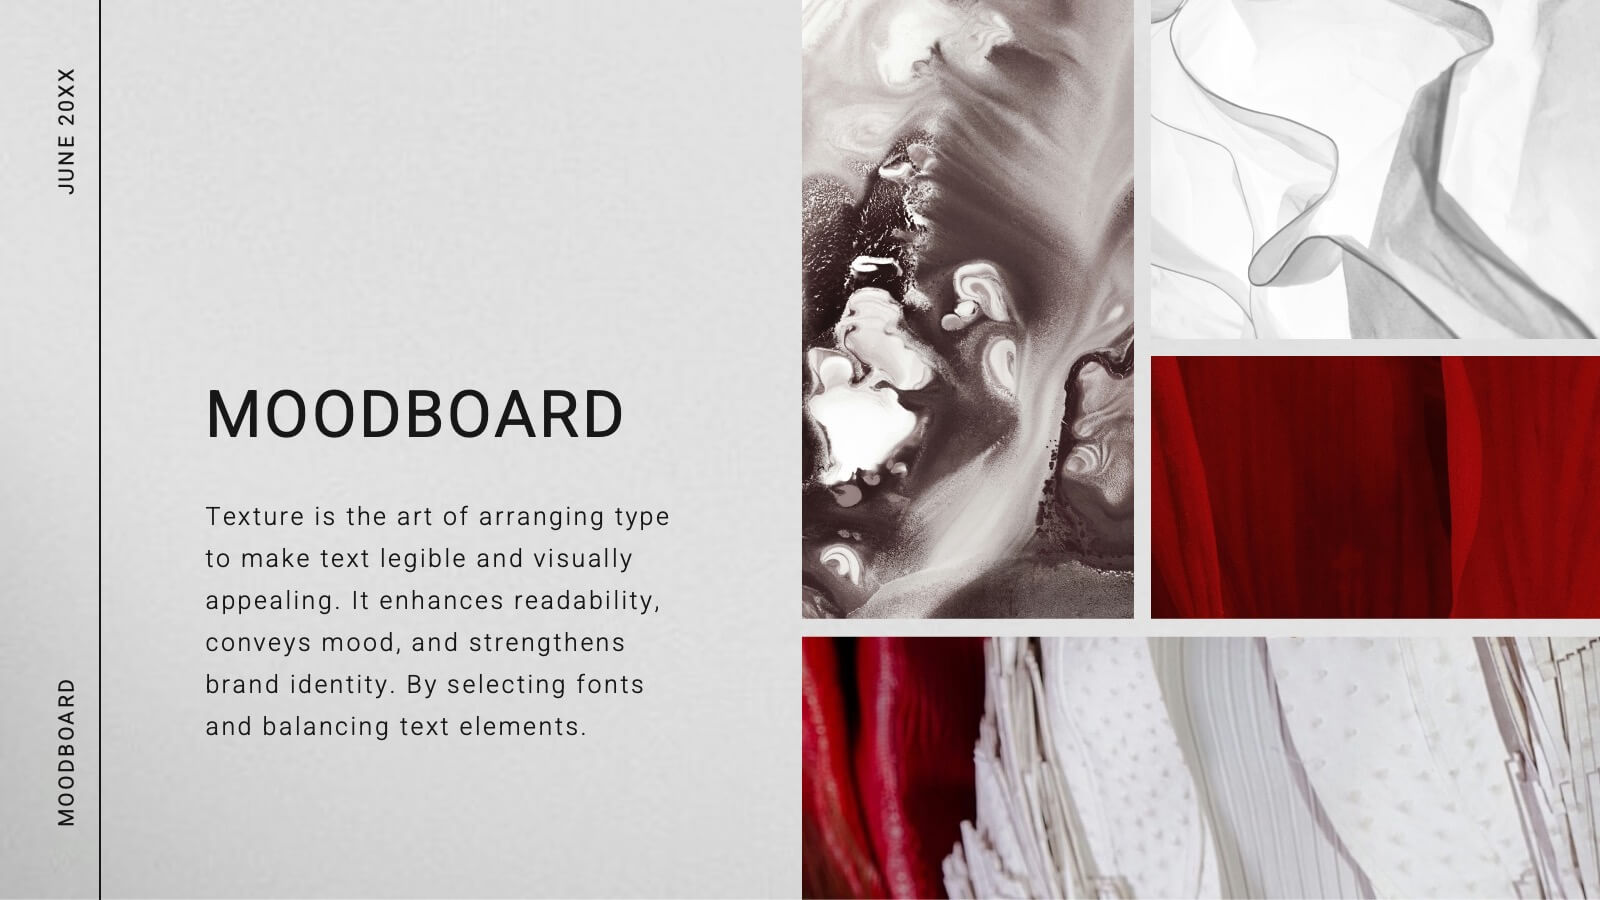
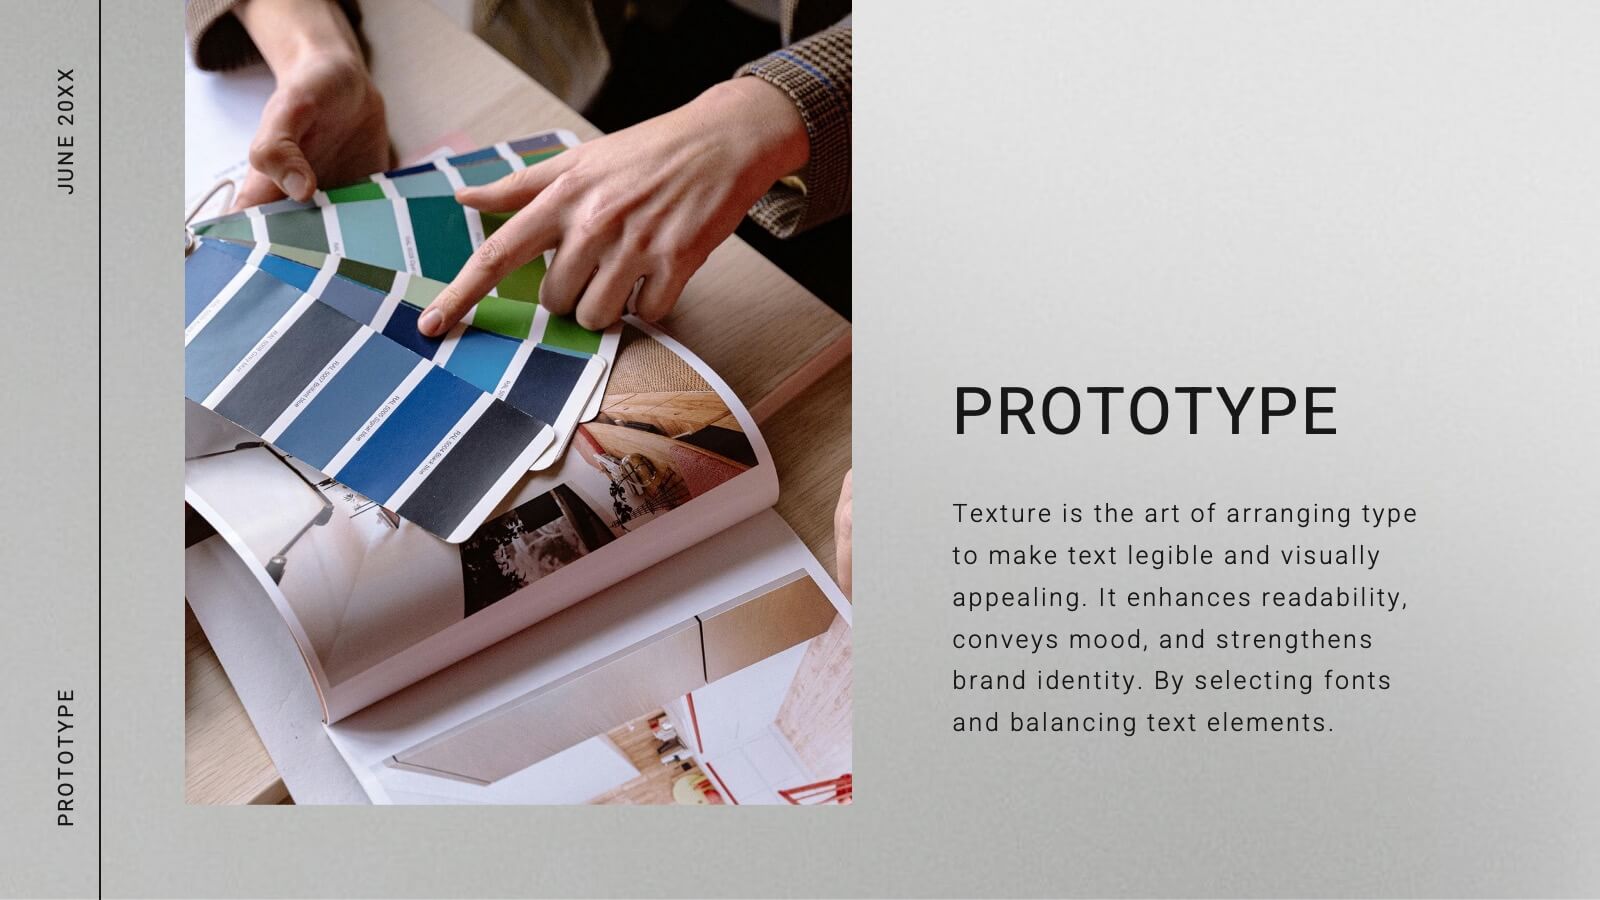
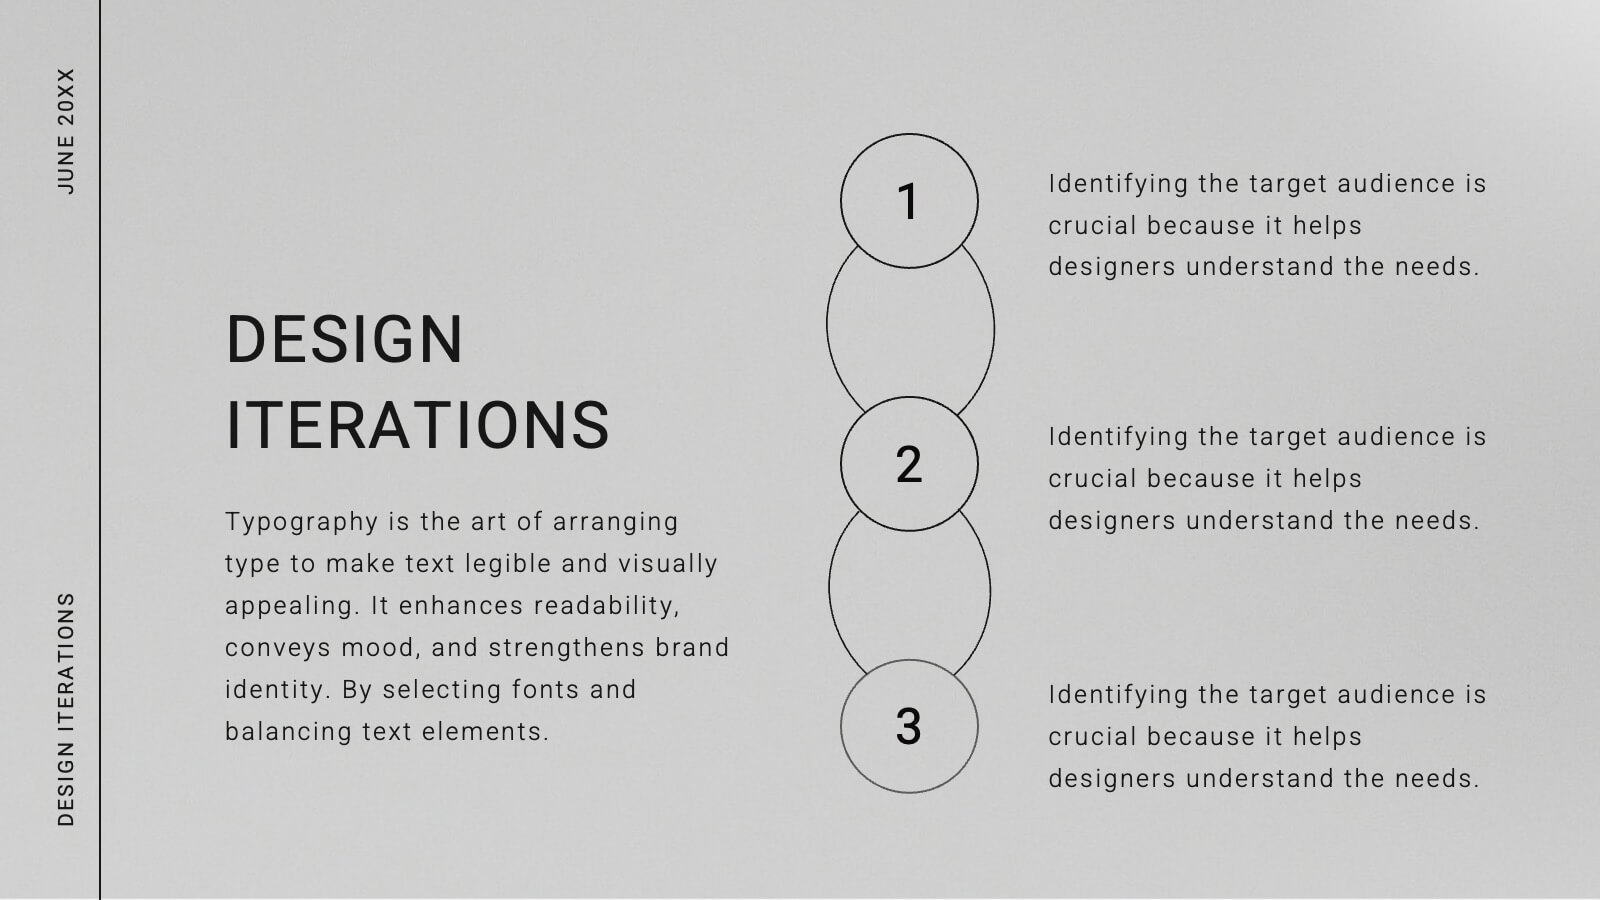
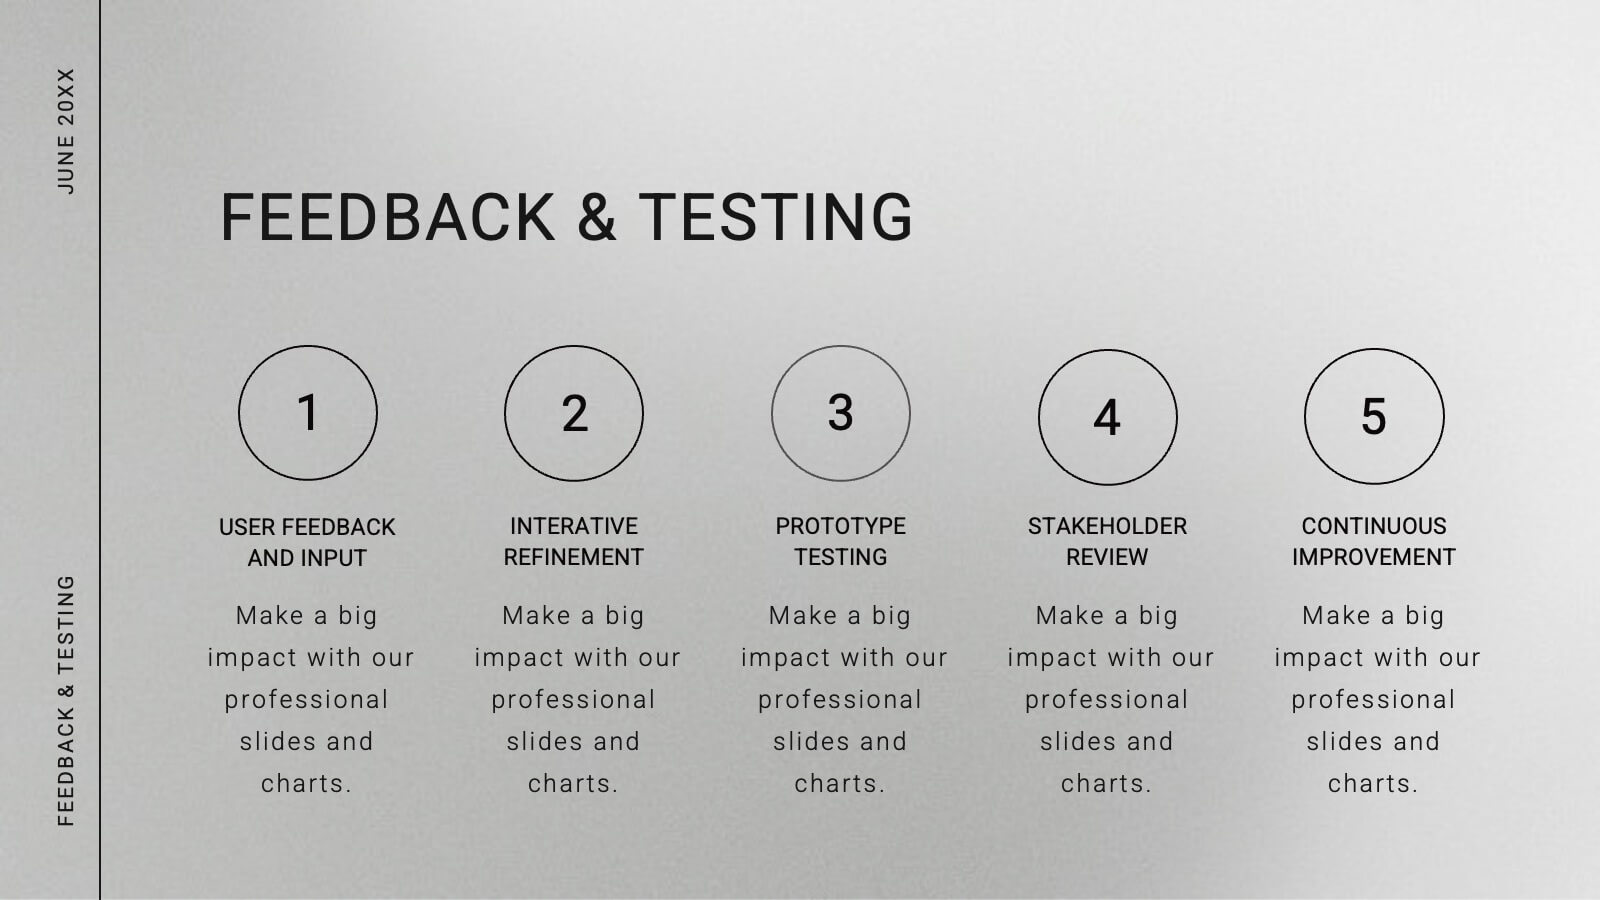
Comet Graphic Design Project Plan Presentation
Craft stunning design project presentations with this elegant template. Showcase objectives, processes, mood boards, and final designs effectively. Ideal for creative teams and clients. Fully compatible with PowerPoint, Keynote, and Google Slides.


12 slides
Quarterly Status Report Presentation
Crafted for clarity and impact, the Quarterly Status Report presentation template efficiently summarizes a period's achievements and insights. The opening slide immediately captivates the audience, clearly setting the stage for a comprehensive review. Subsequent slides meticulously organize critical data points, from financial forecasts to project milestones, allowing for a granular examination of past performance. The report not only reflects on the quarter's outcomes but also offers a well-defined path forward, with strategic recommendations and a thoughtful action plan. Concluding on a note of gratitude, the template acknowledges the audience's time and consideration, while the final credits slide ensures due recognition of all informational sources used throughout the presentation.


6 slides
E-Learning Industry Infographic
E-learning, short for "electronic learning," refers to the use of digital technologies to deliver educational content and programs to learners via the internet or other digital platforms. This infographic template is a visual representation that provides key information and insights about the e-learning industry. This encompasses a wide range of online learning methods, tools, and resources that cater to various educational needs and goals. This template serves as a valuable tool to educate viewers about the e-learning landscape, its benefits, and its potential for transforming education and training.


8 slides
Interactive Digital Learning Experience Presentation
Make your content more engaging with the Interactive Digital Learning Experience Presentation. This layout blends quiz-style visuals and educational icons, helping you present learning modules, assessments, or training checkpoints in a fun and intuitive way. Use it to simplify information, boost audience interaction, or highlight multiple-choice content. Fully editable in Canva, PowerPoint, Keynote, and Google Slides.