


Features
- 5 Unique slides
- Fully editable and easy to edit in Microsoft Powerpoint, Keynote and Google Slides
- 16:9 widescreen layout
- Clean and professional designs
- Export to JPG, PDF or send by email


Do you have any questions?
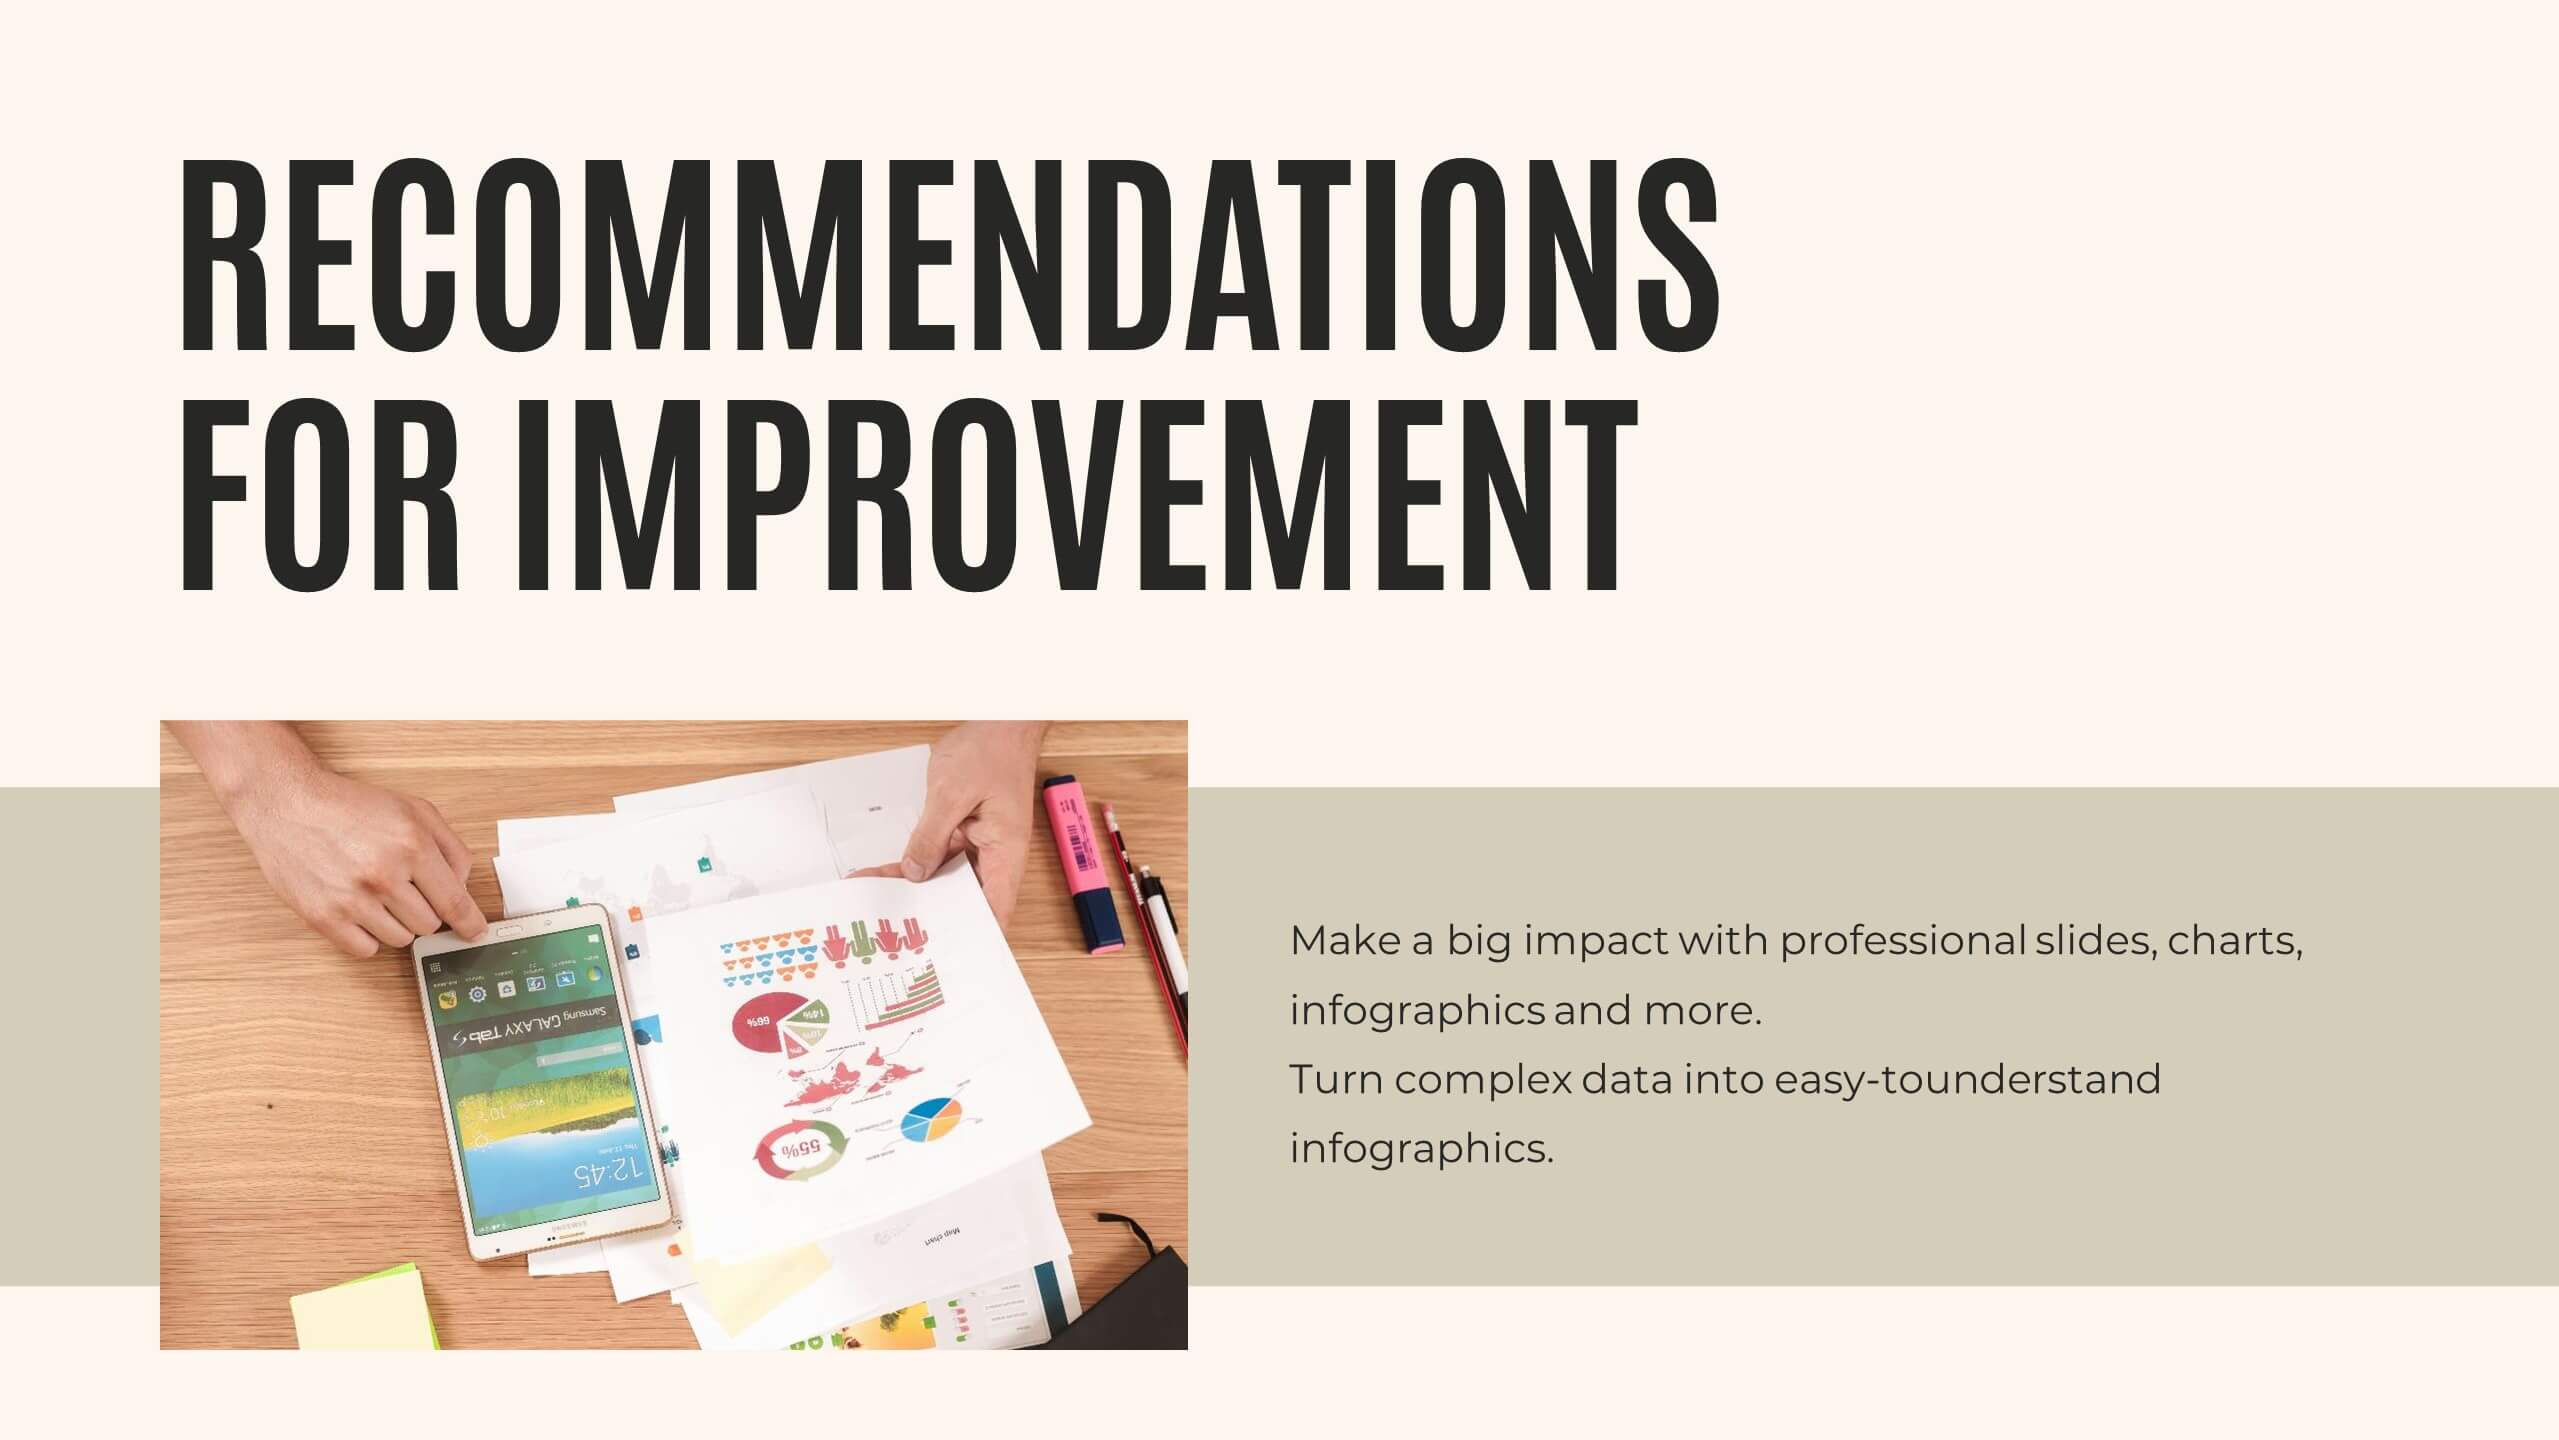
Recommend


5 slides
Manufacturing Insights Infographics
Manufacturing insights refer to valuable information, analysis, and observations derived from the manufacturing industry. These vertical set of infographics are designed to provide valuable insights and data related to the manufacturing industry. This template is ideal for manufacturing companies and researchers looking to present complex data in an engaging manner. The template includes infographics that break down the manufacturing process into easily understandable steps, using simple graphics and icons. This template is easily editable, allowing users to adjust colors, charts, and data to match their specific manufacturing insights.
3 slides
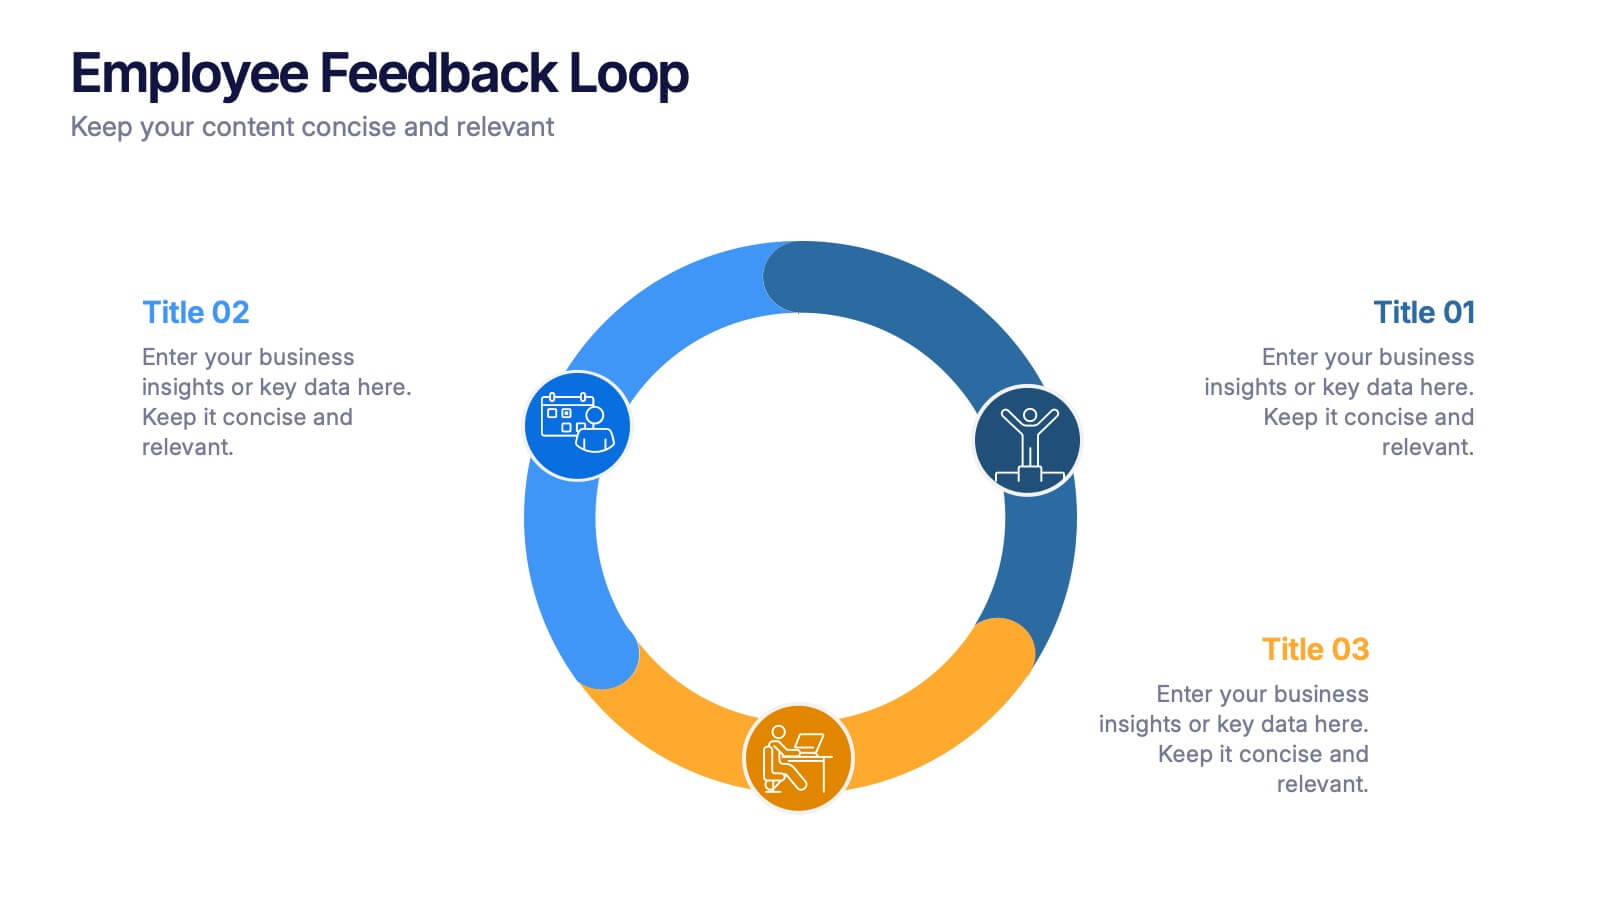
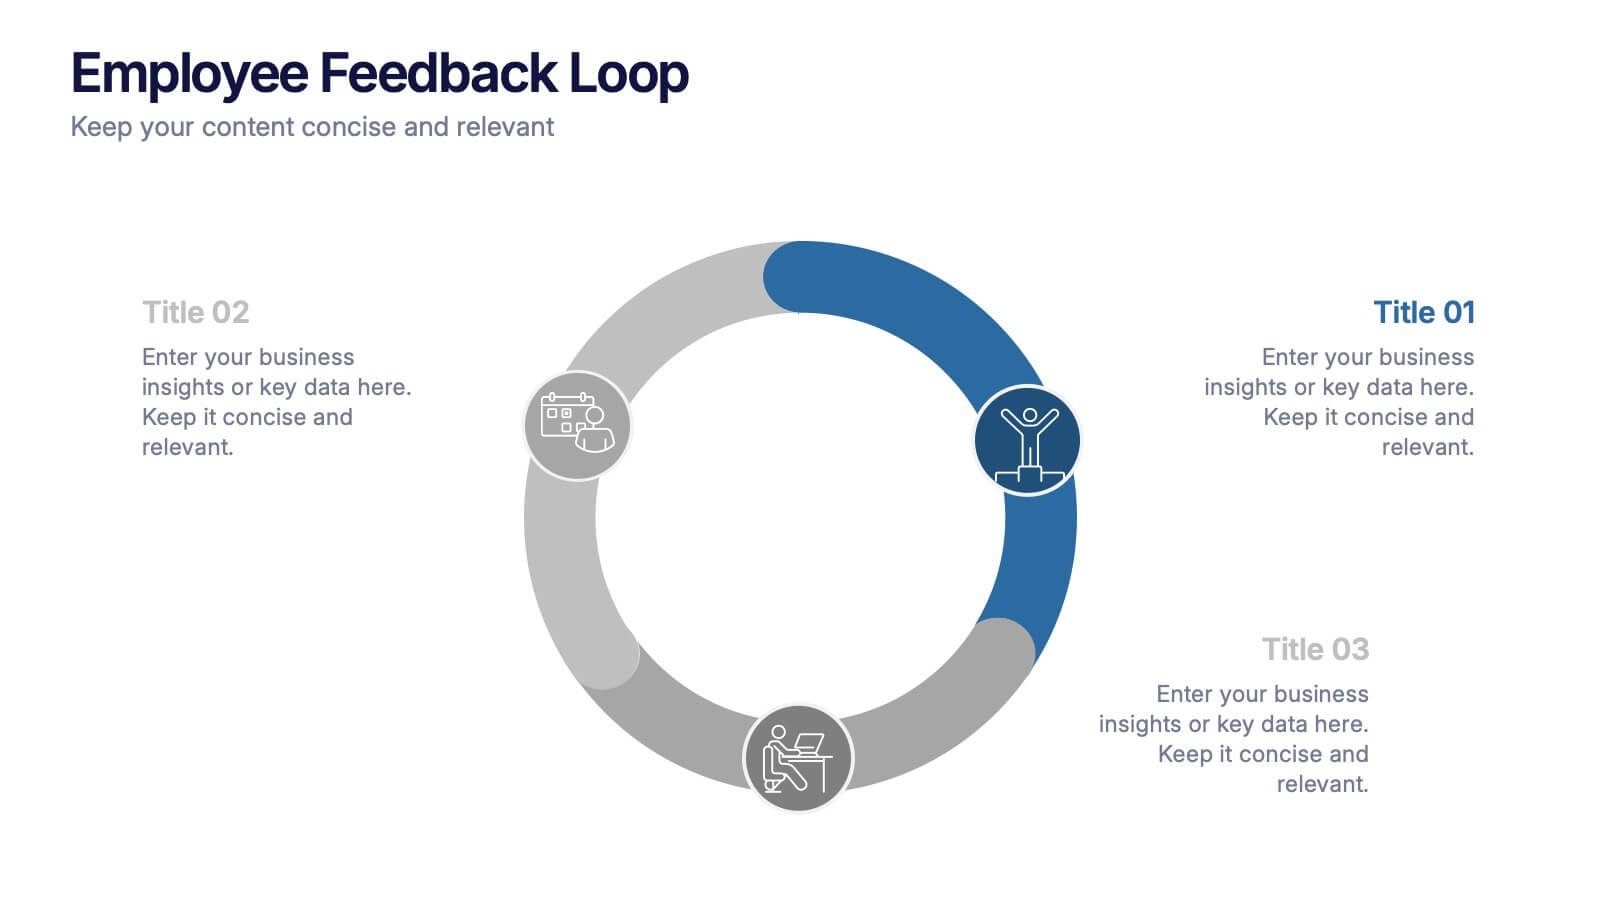
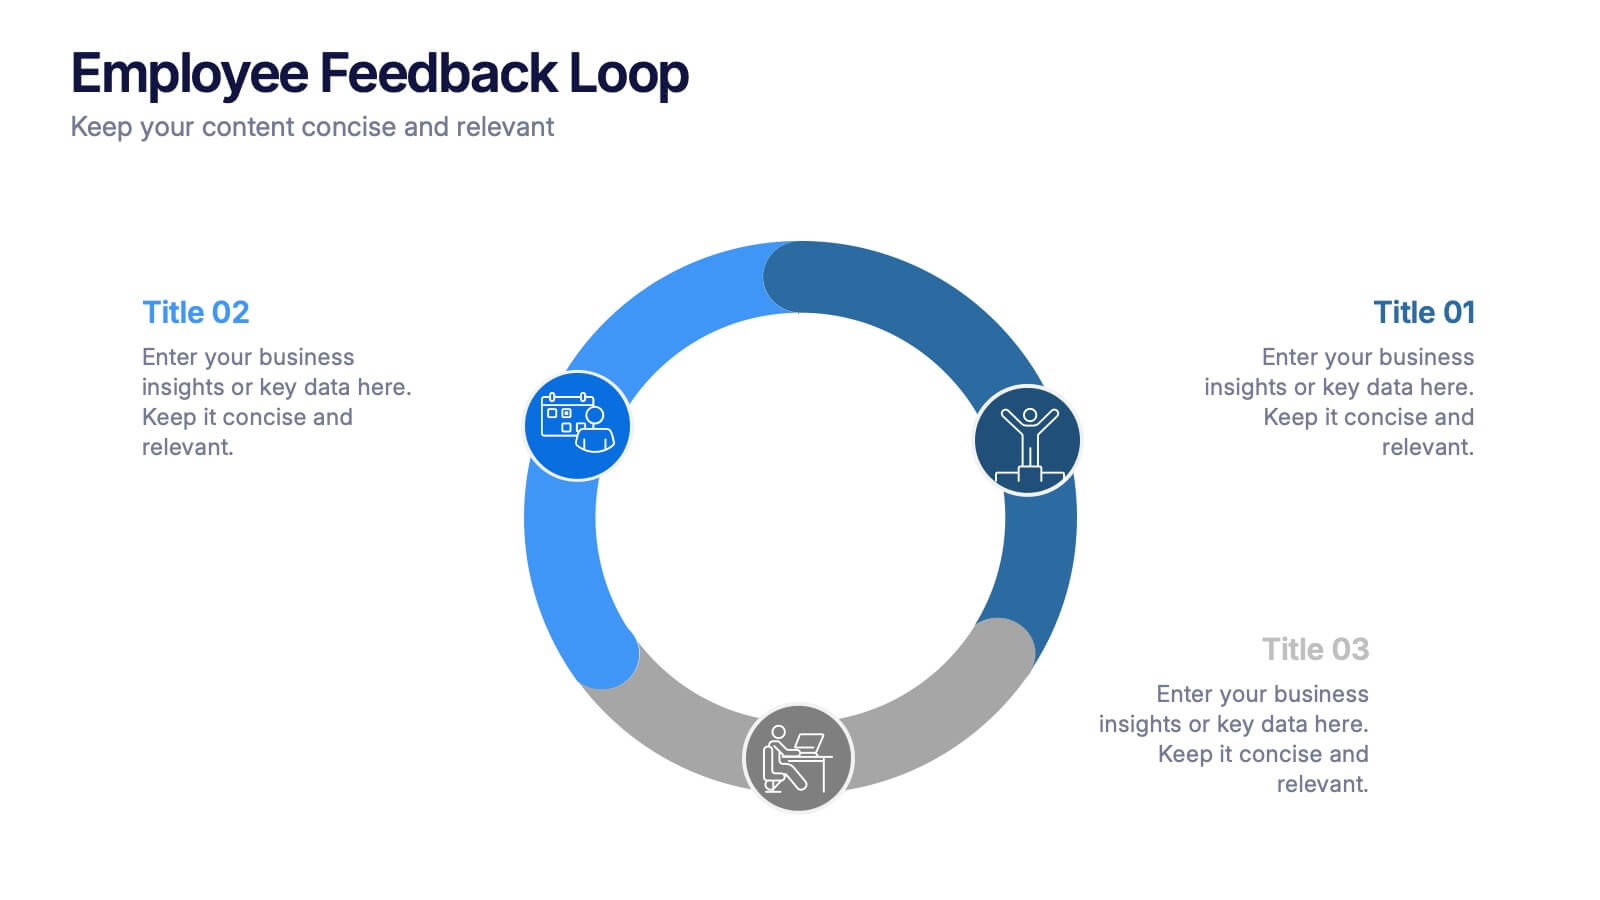
Employee Feedback Loop Presentation
Keep your team connected and continuously improving with this engaging presentation design. Ideal for showcasing communication strategies, feedback cycles, and performance insights, it helps visualize the process of collecting and acting on employee input. Fully customizable and compatible with PowerPoint, Keynote, and Google Slides for effortless, professional presentations.


7 slides
Product Roadmap Infographic Presentation
A well-designed Roadmap infographic can be a powerful tool used to communicate your vision. This template highlights important dates, objectives and milestones to achieve over a period of time. The roadmap provides a clear view of what needs to be done, and when it needs to be done. This template is fully editable in PowerPoint, Keynote and Google Slides, making it easily personalized and customized to suit your project needs. Use this roadmap infographic to help you display a plan for accomplishing a long-term goal, and communicate your vision in an appealing and memorable way!


7 slides
Transportation and Logistics Services Infographic
Transportation and logistics are critical to the functioning of modern economies, facilitating the movement of goods, people, and services from one place to another. This template is a professional infographic focusing on the main topics of transportation, logistics and their relationships. Use this template to illustrate the bustling world of transportation and logistic solutions from around the globe. It comes with a variety of diagrams and illustrations, which will make your presentation more appealing. This template is fully editable and compatible with Powerpoint, keynote and google slides.


4 slides
Human Anatomy Visual Guide Presentation
Visualize body systems with clarity using the Human Anatomy Visual Guide Presentation. Featuring a simplified female silhouette with highlighted organs, this slide layout is perfect for medical education, wellness topics, or anatomy-focused data. Each labeled section (A–D) includes space for concise insights. Fully editable in Canva, PowerPoint, Keynote, and Google Slides.


21 slides
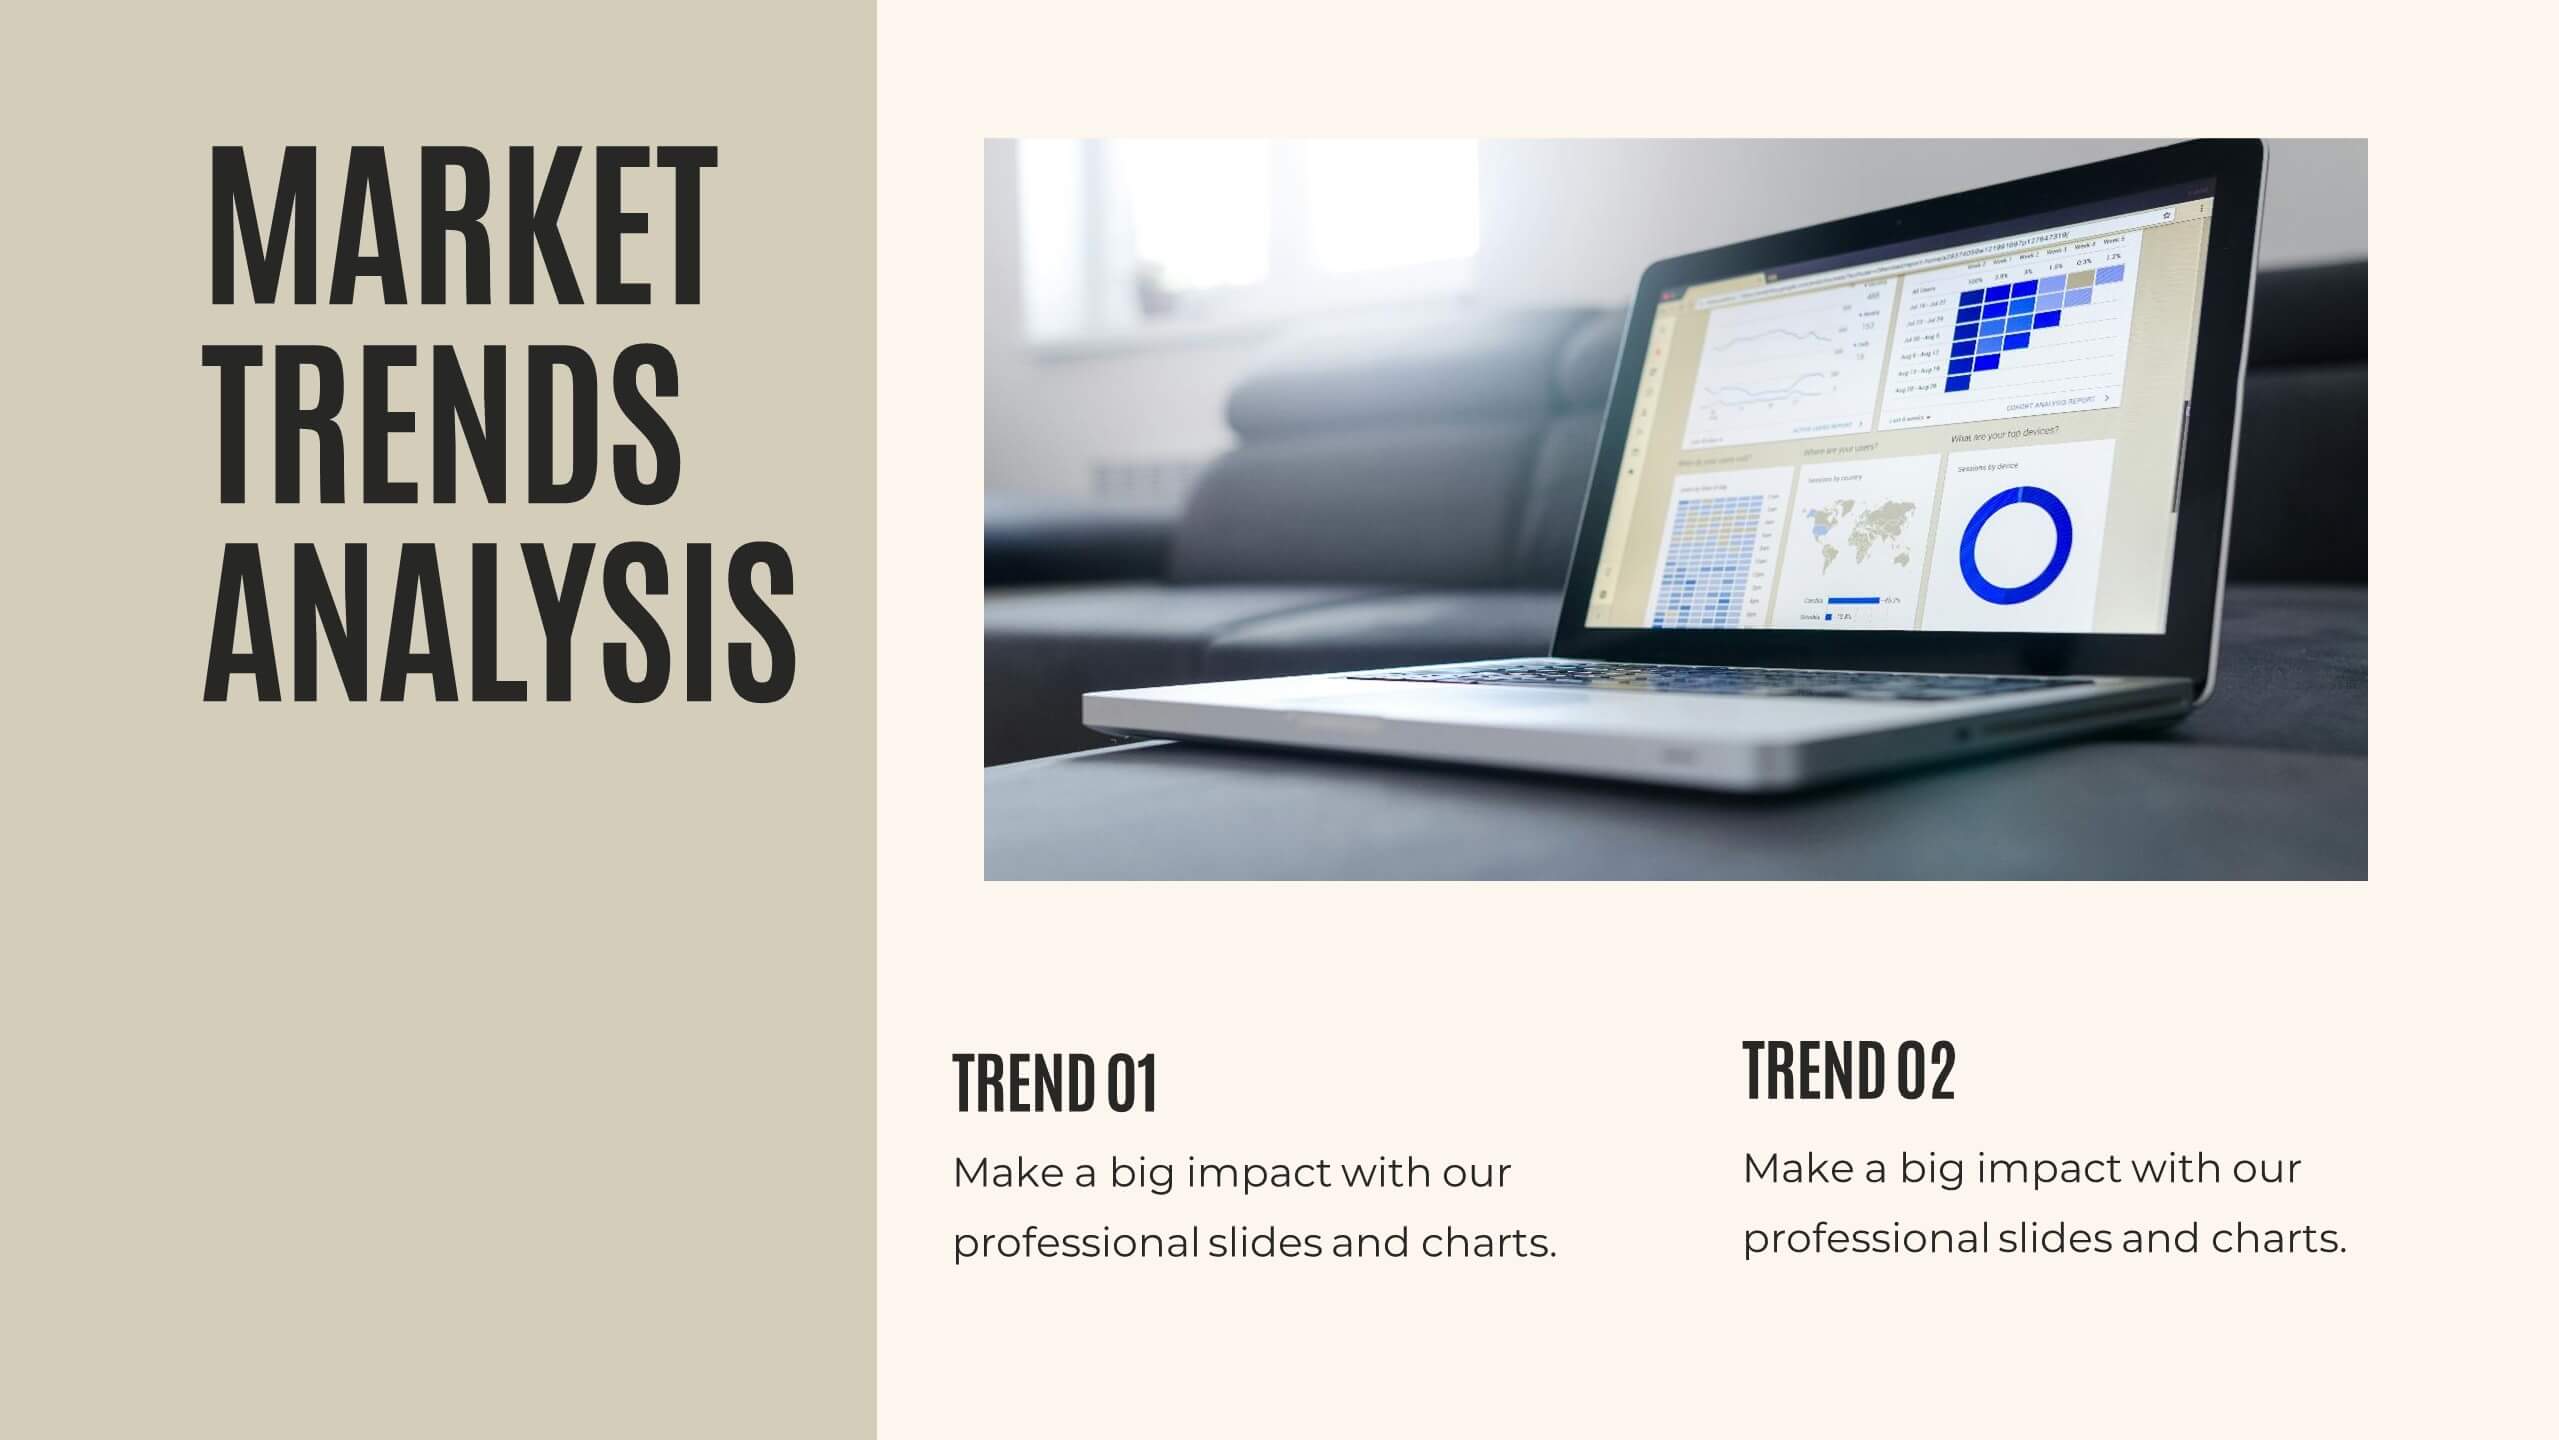
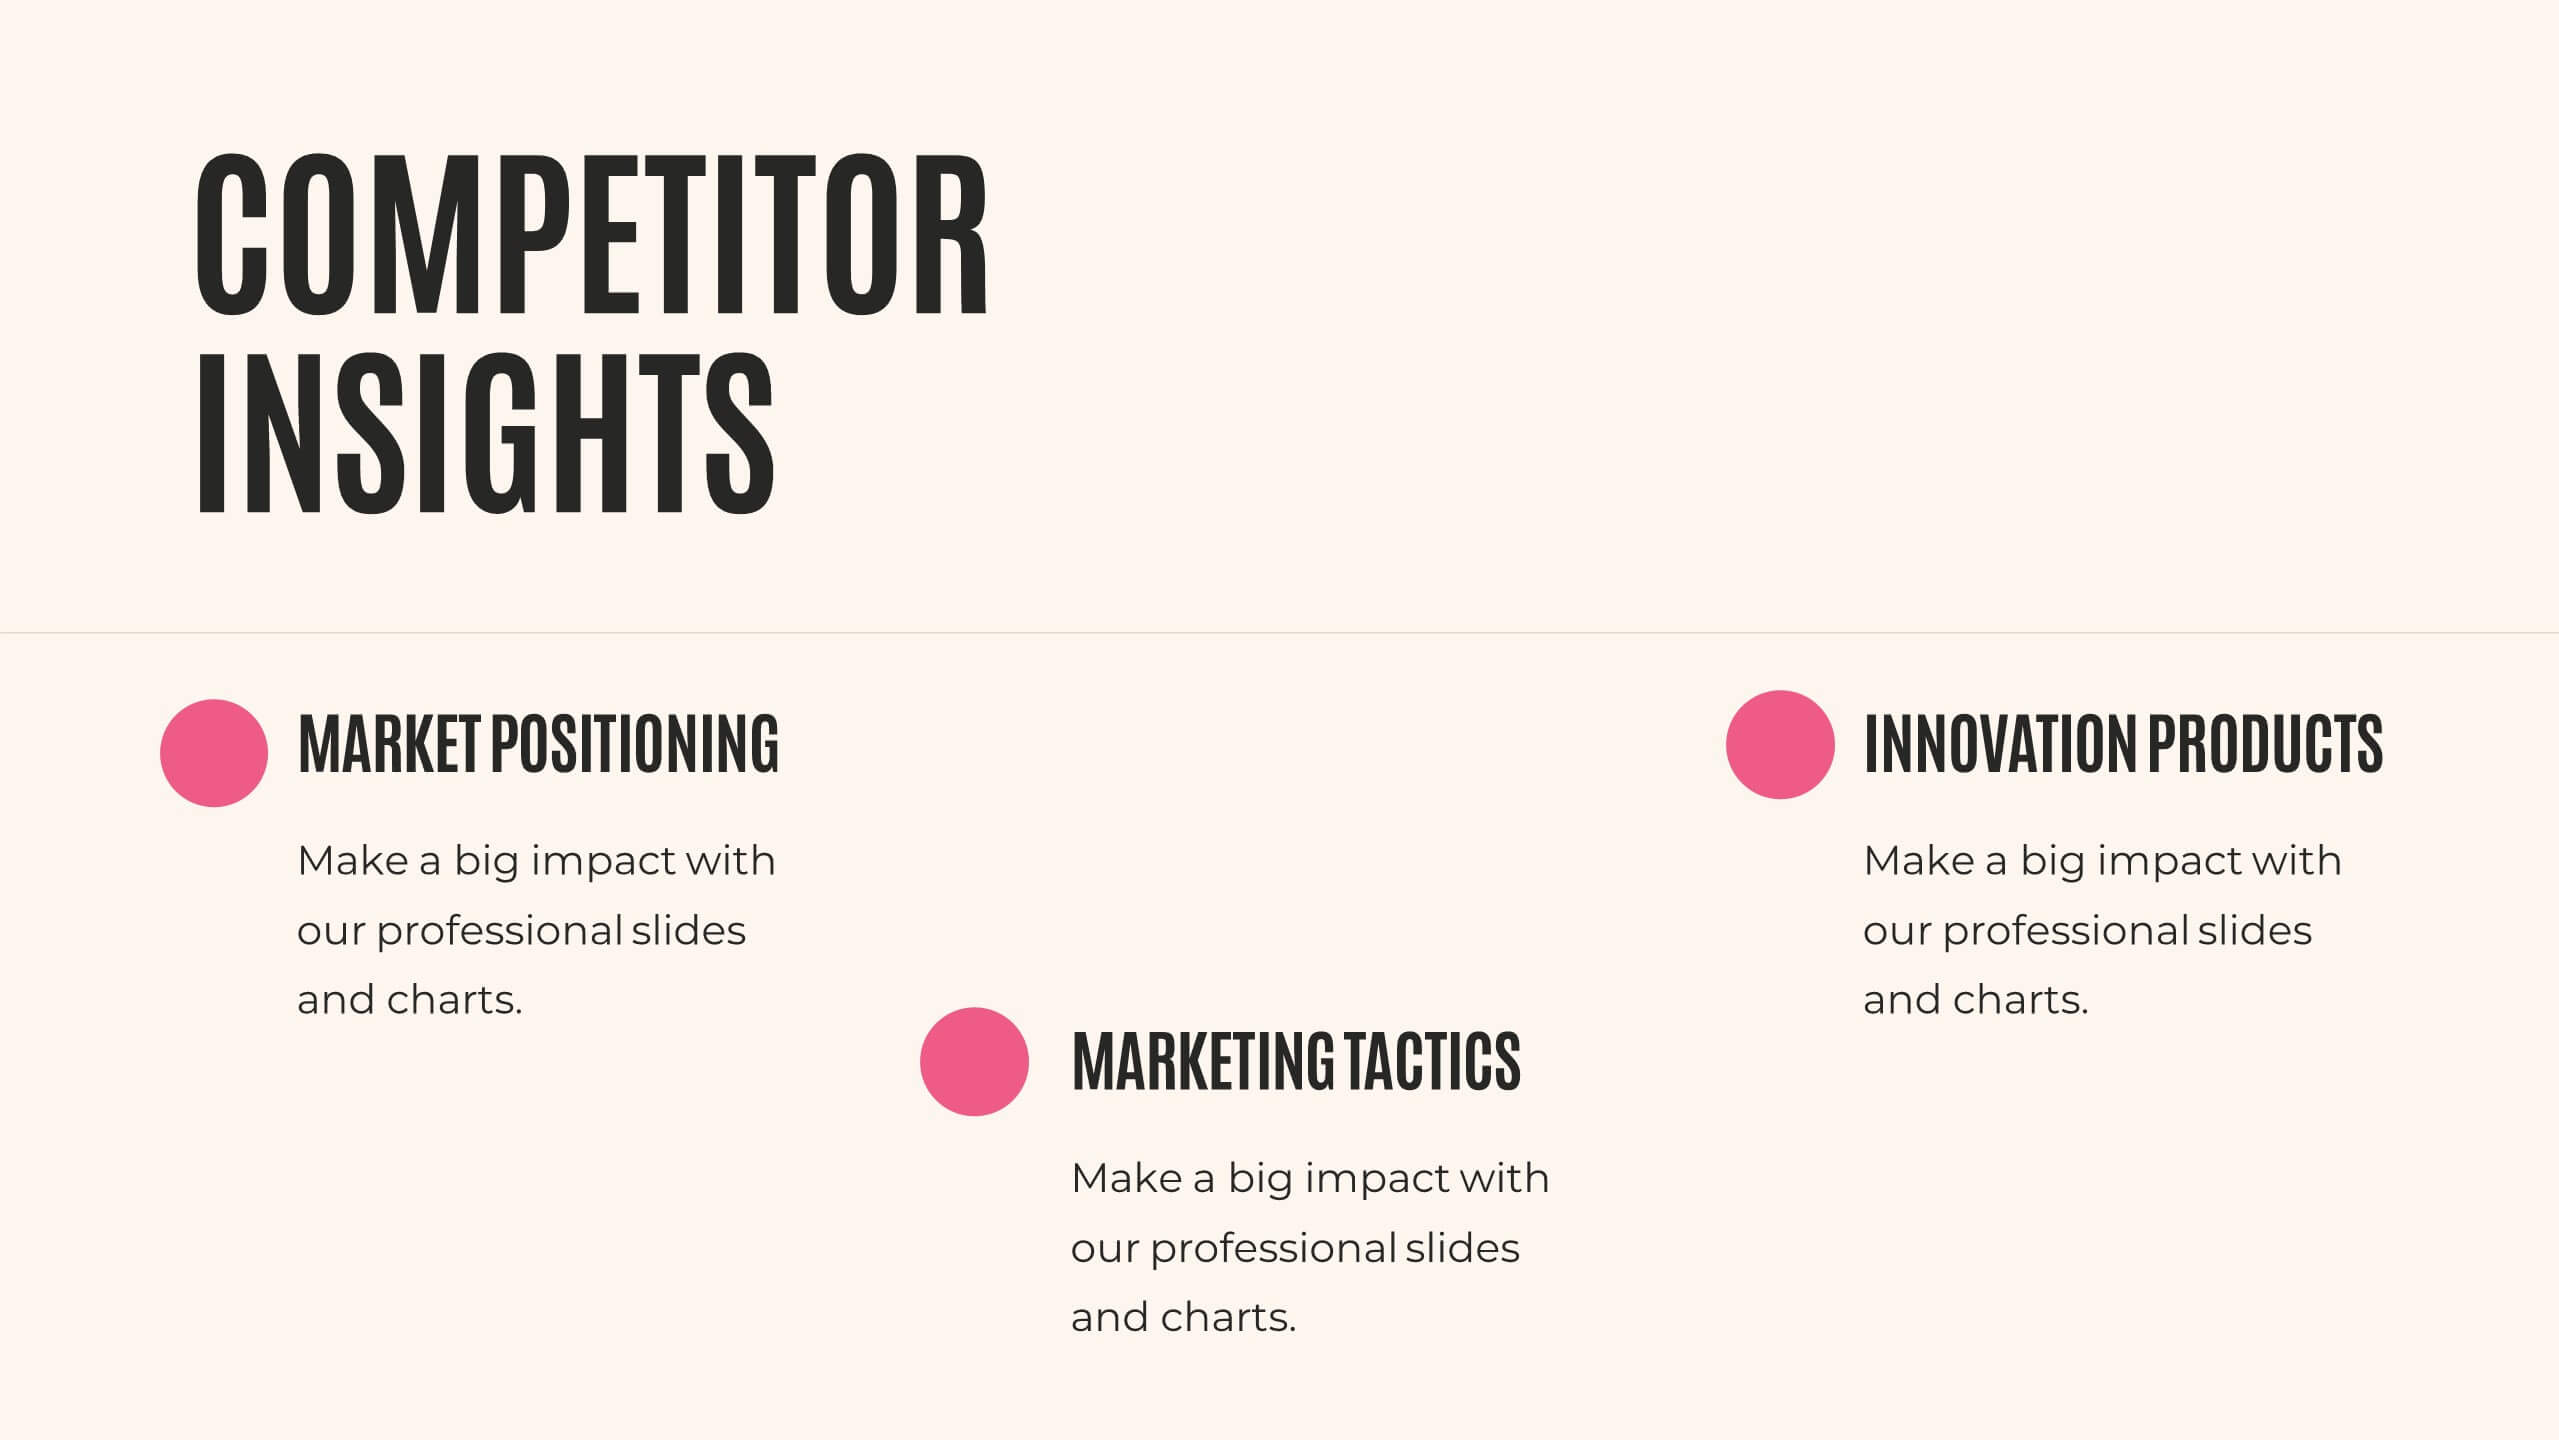
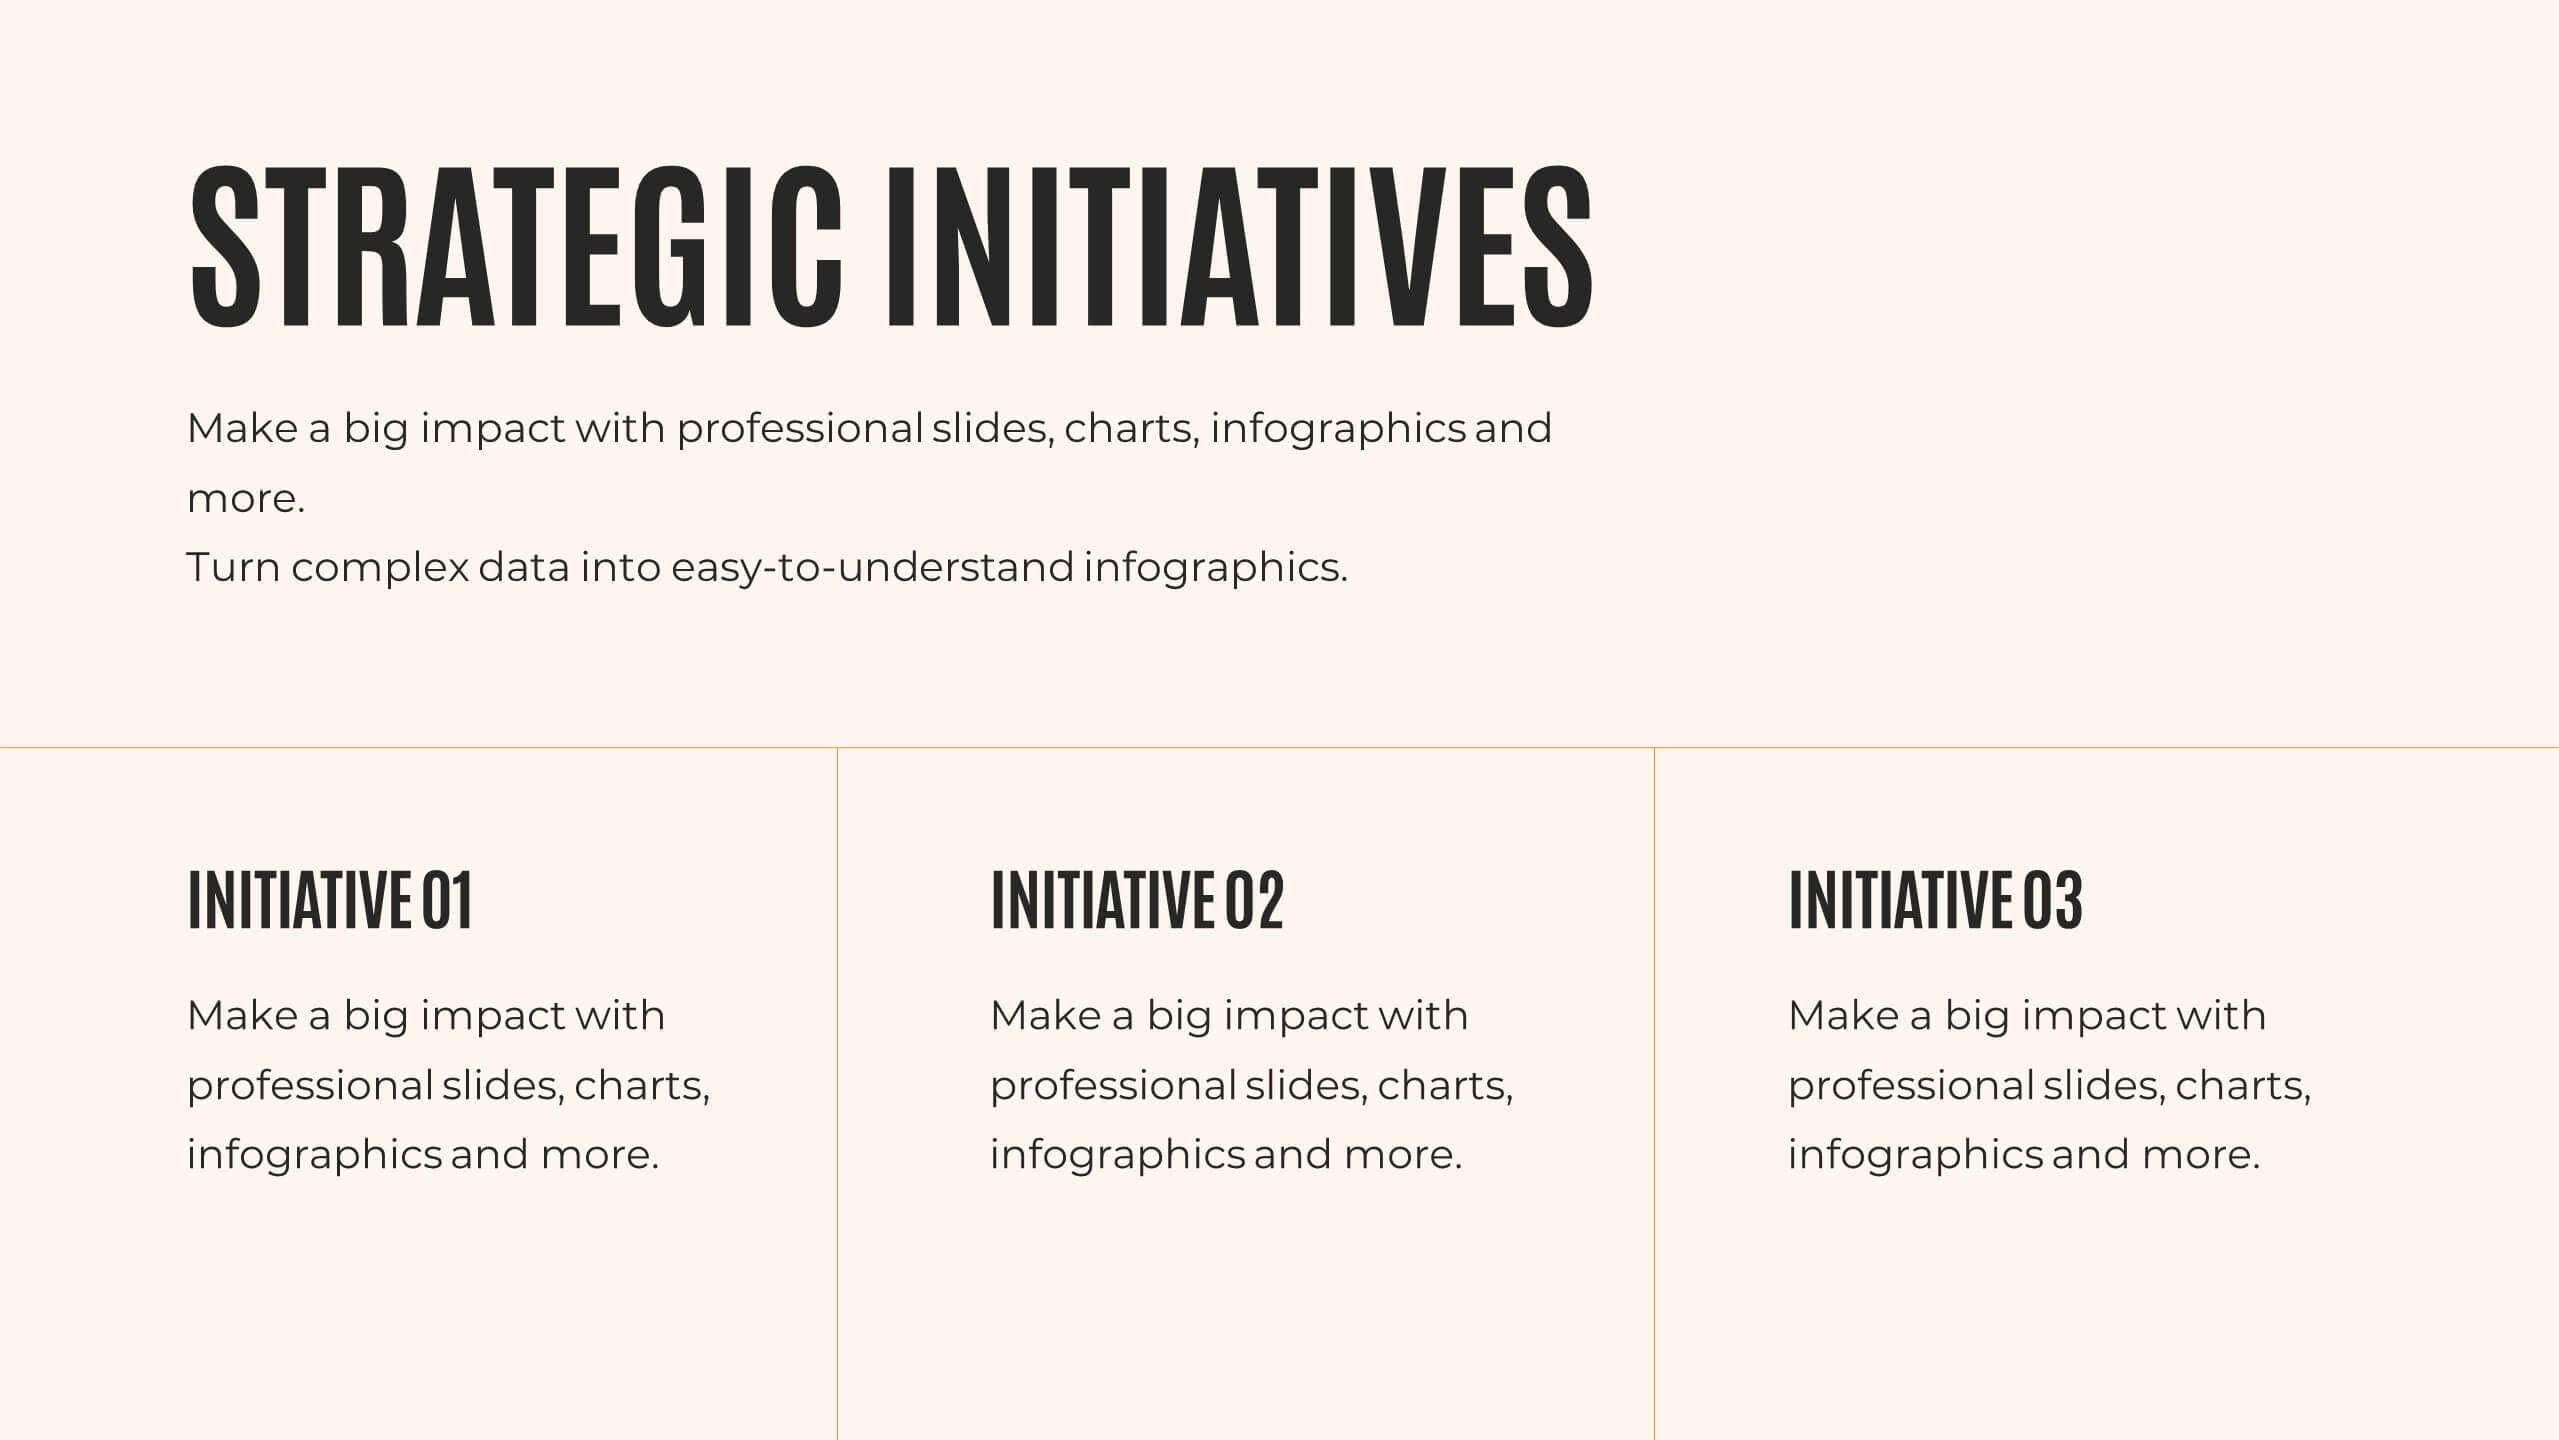
Techne Strategic Planning Report Presentation
Streamline your strategic planning process with this meticulously crafted presentation template, designed for professionals seeking clarity and structure. Featuring slides dedicated to market trends, SWOT analysis, target audience profiling, and competitive insights, this template ensures your strategy is well-rounded and impactful. The clean and modern design accommodates sections for defining objectives, key challenges, and resource allocation, allowing your team to focus on actionable solutions. Performance metrics and risk management slides help you track progress and address uncertainties effectively. Whether presenting to stakeholders or internal teams, this tool simplifies complex data into easily digestible visuals. Fully editable and compatible with PowerPoint, Google Slides, and Keynote, this template provides the flexibility to adapt to various needs. Perfect for organizations aiming to communicate strategic initiatives and actionable plans with precision and professionalism. Take your strategic planning reports to the next level with this essential template.


7 slides
Milestones Infographic Presentation Template
Our milestones infographic template includes a professional background and imagery to create a high-quality presentation that’s sure to grab your audience’s attention. This template is full of visual and engaging elements that will draw your audience in. It's a great starting point to make your own presentation, or to use as a template for future presentations. All slides are fully editable in PowerPoint so you can add and change text and images as desired, It's very easy to edit and customize the shapes and colors. Use this high-resolution template to present your topic in a professional way!


20 slides
Ascent Design Strategy Proposal Presentation
A minimalist and sleek template ideal for presenting design strategy and development. Includes sections for design brief, audience insights, concept development, design elements, prototyping, and feedback. Suitable for design professionals to showcase visual direction and project timelines. Fully customizable in PowerPoint, Keynote, and Google Slides for versatile presentations.


7 slides
Brain Structure Infographic
Unlock the marvels of the human mind with our brain structure infographic. Resting on a pristine white canvas and enriched by the calming green, profound blue, and enlightening yellow, this template meticulously dissects the intricacies of brain anatomy. Adorned with detailed infographics, illustrative icons, and specific image placeholders, it dives deep into the regions and functions of the brain. Impeccably tailored for Powerpoint, Keynote, or Google Slides. An indispensable resource for neuroscientists, educators, medical students, or anyone with an intrigue for cerebral wonders. Venture with insight; let each slide be your guide through the labyrinth of the human brain.


21 slides
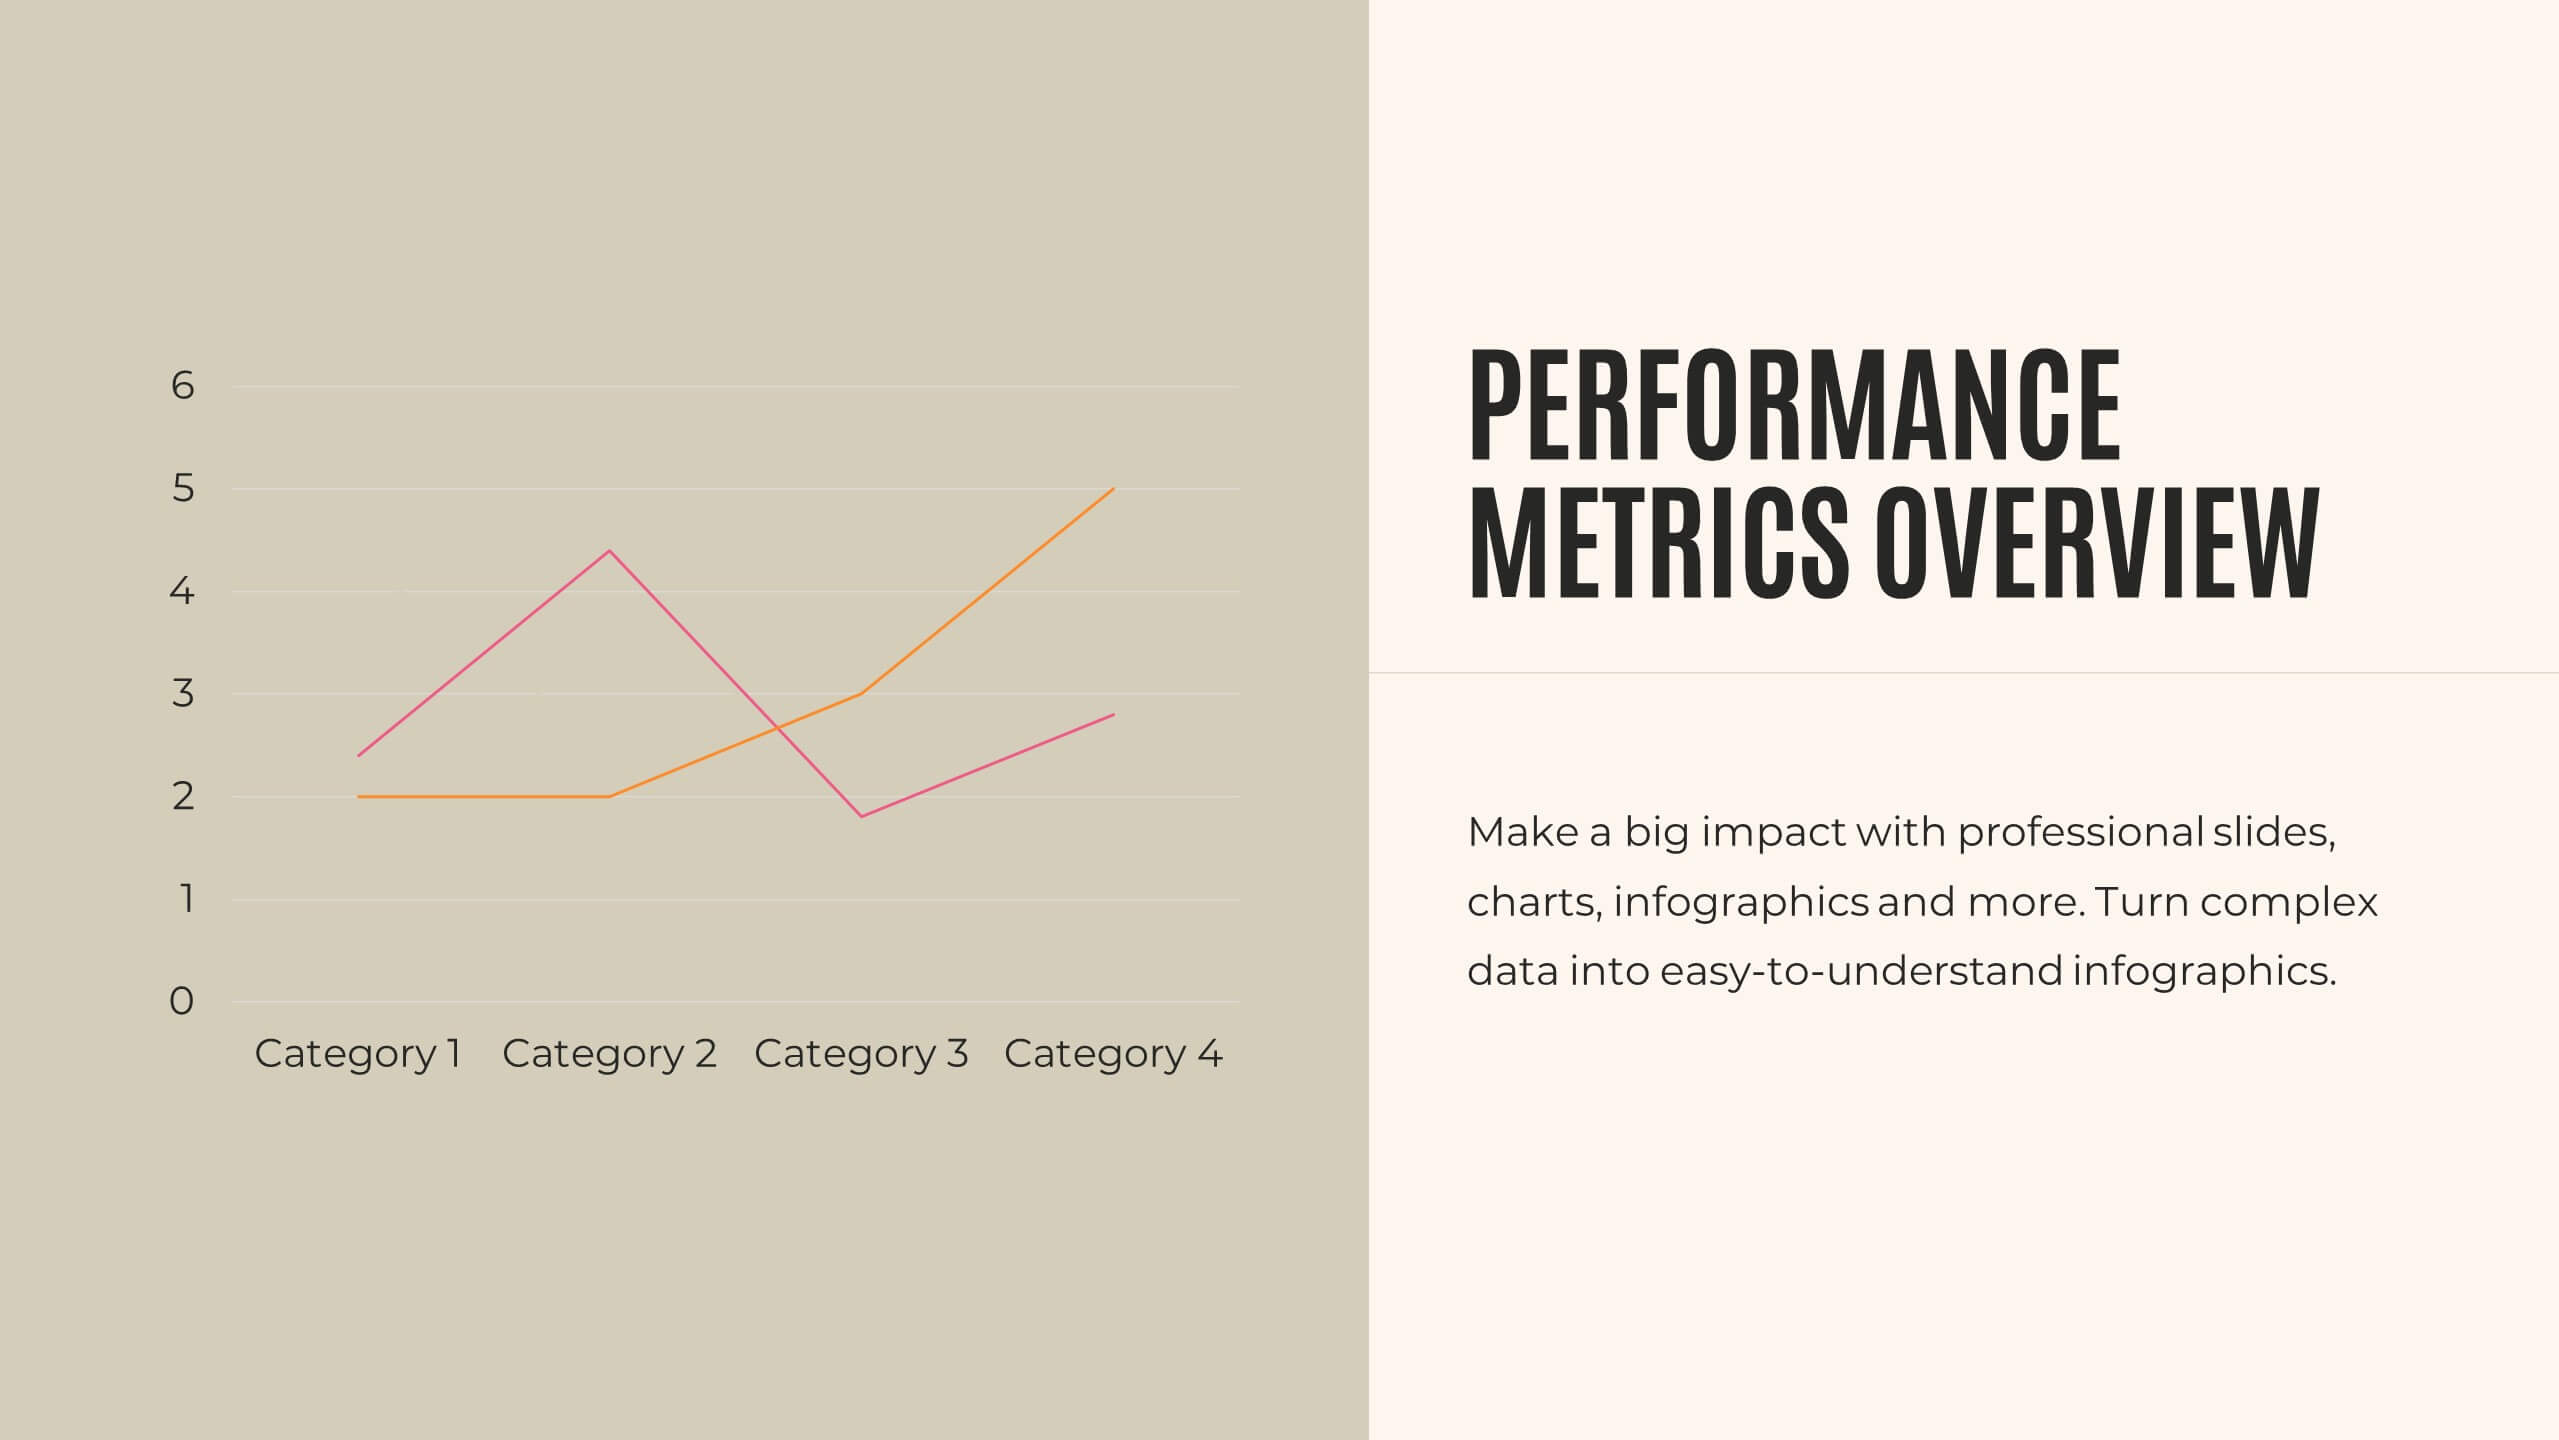
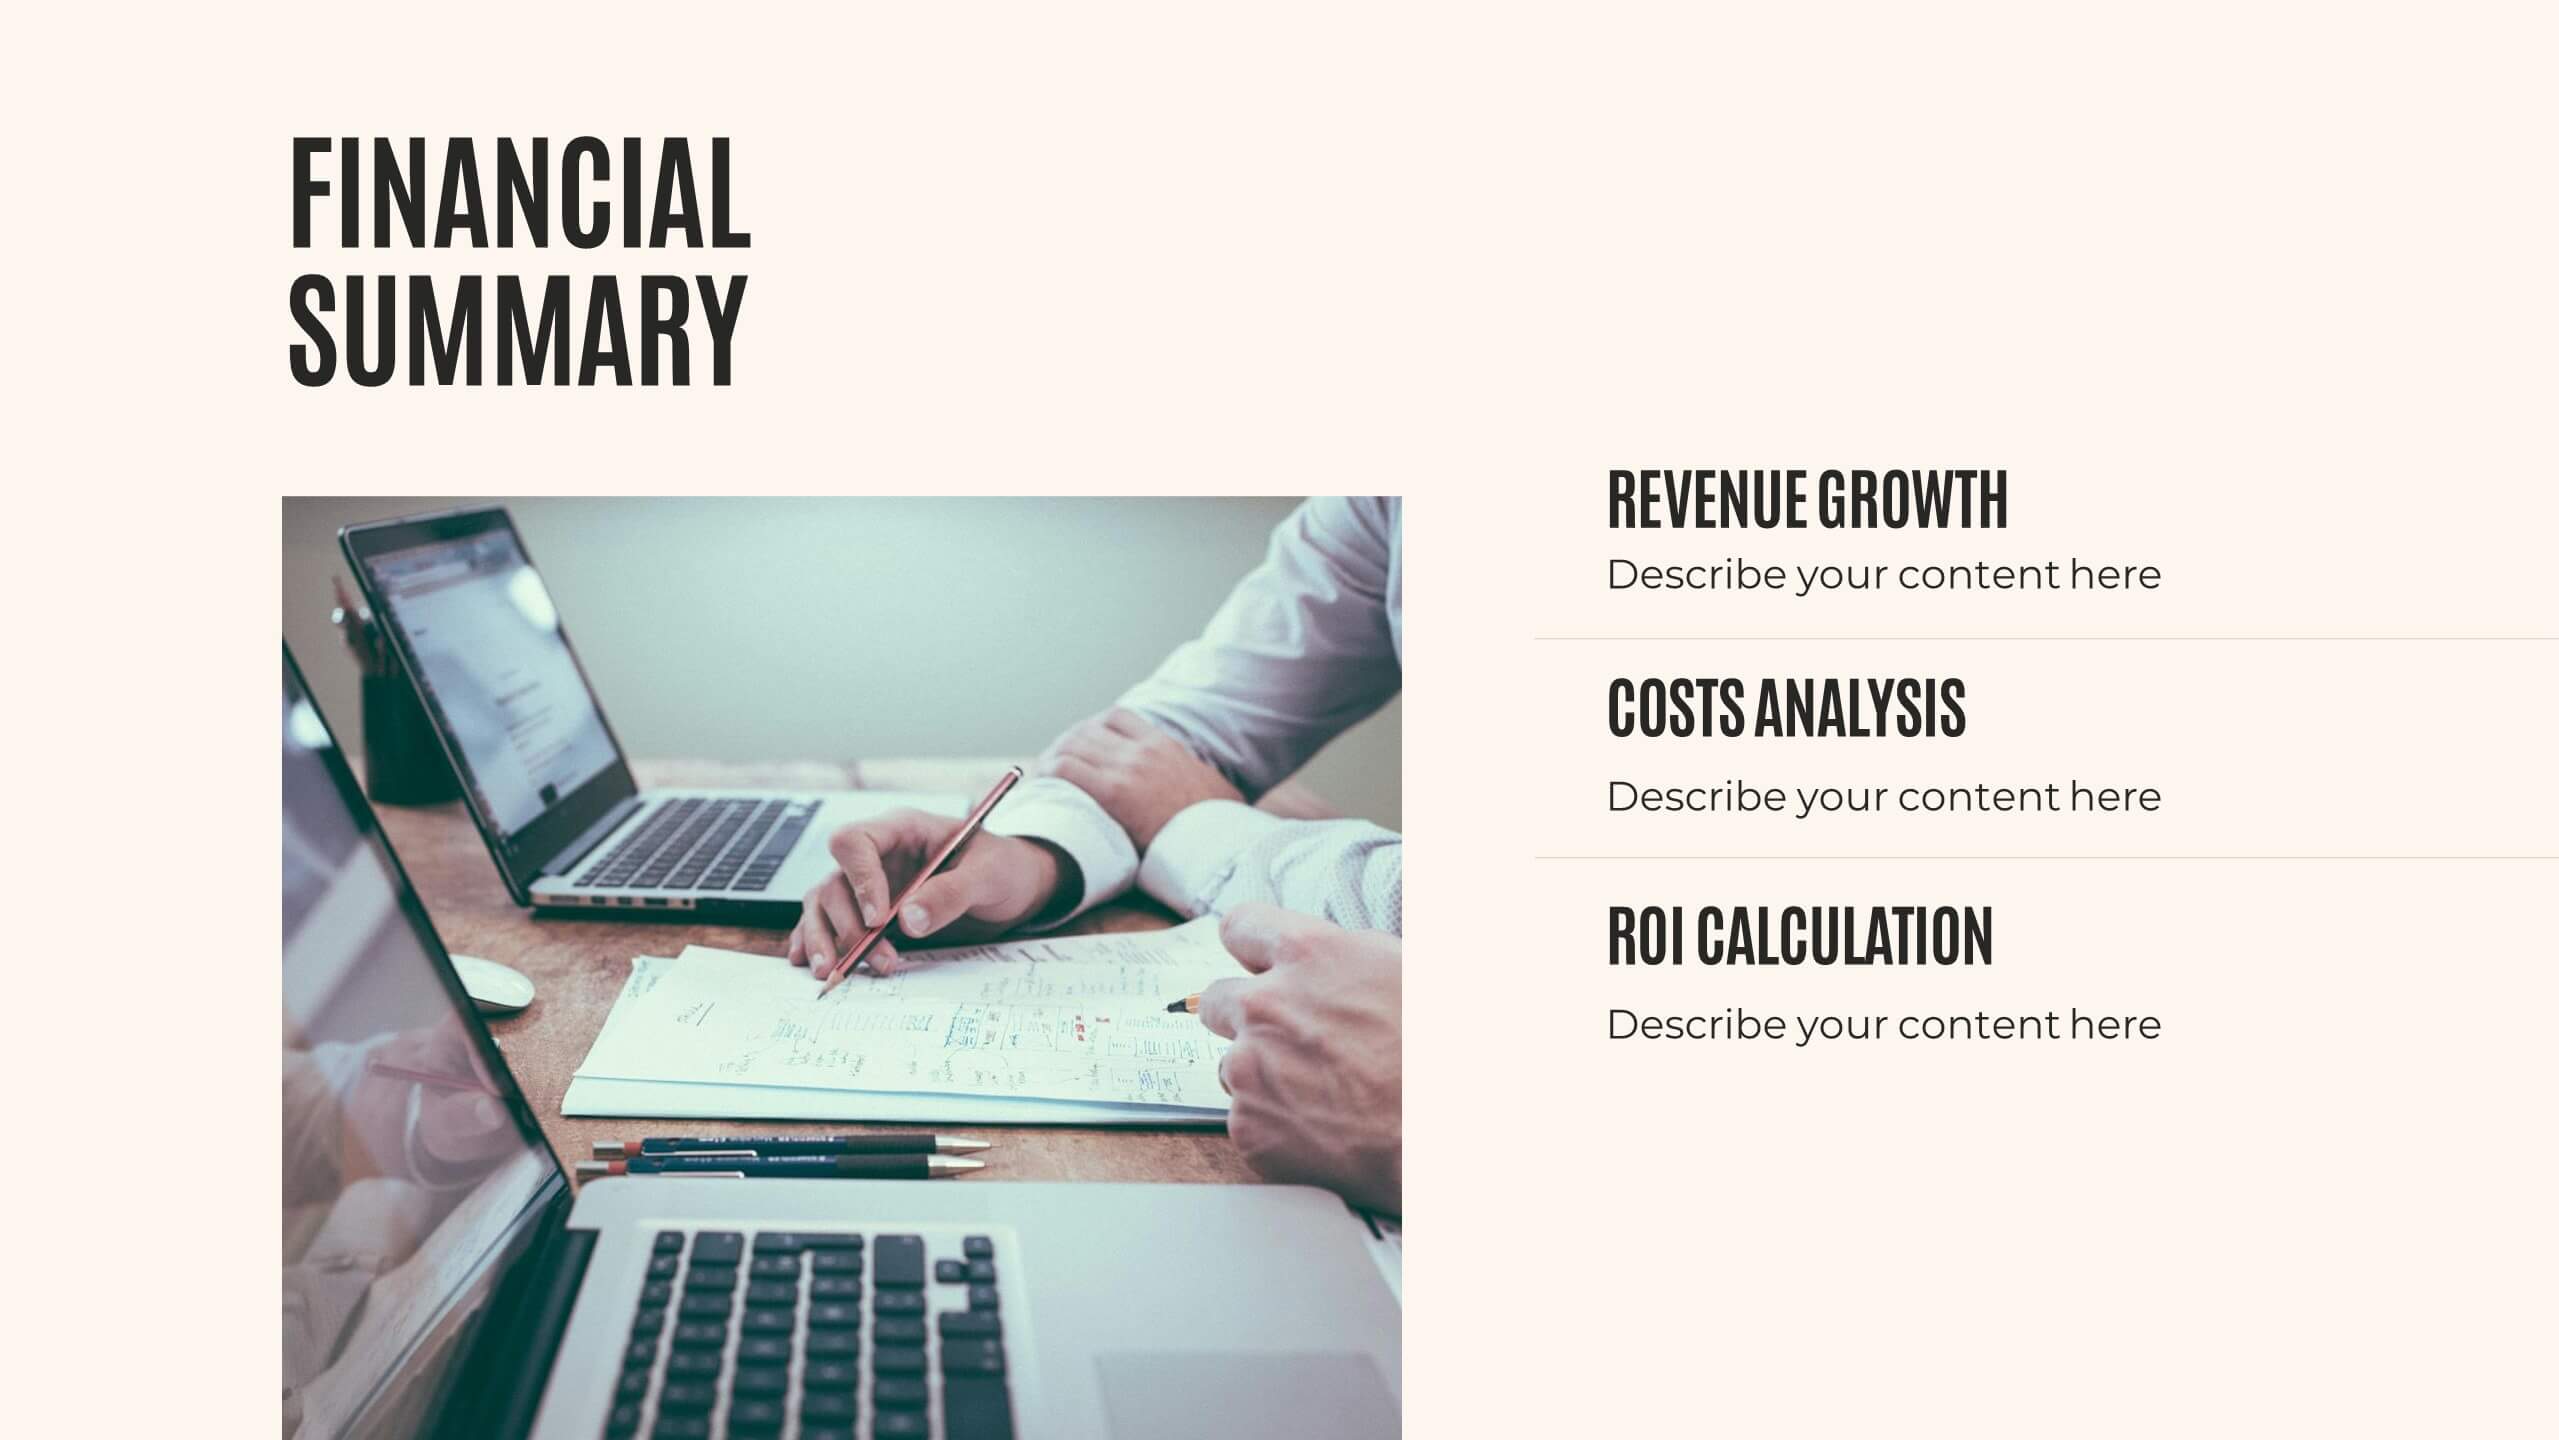
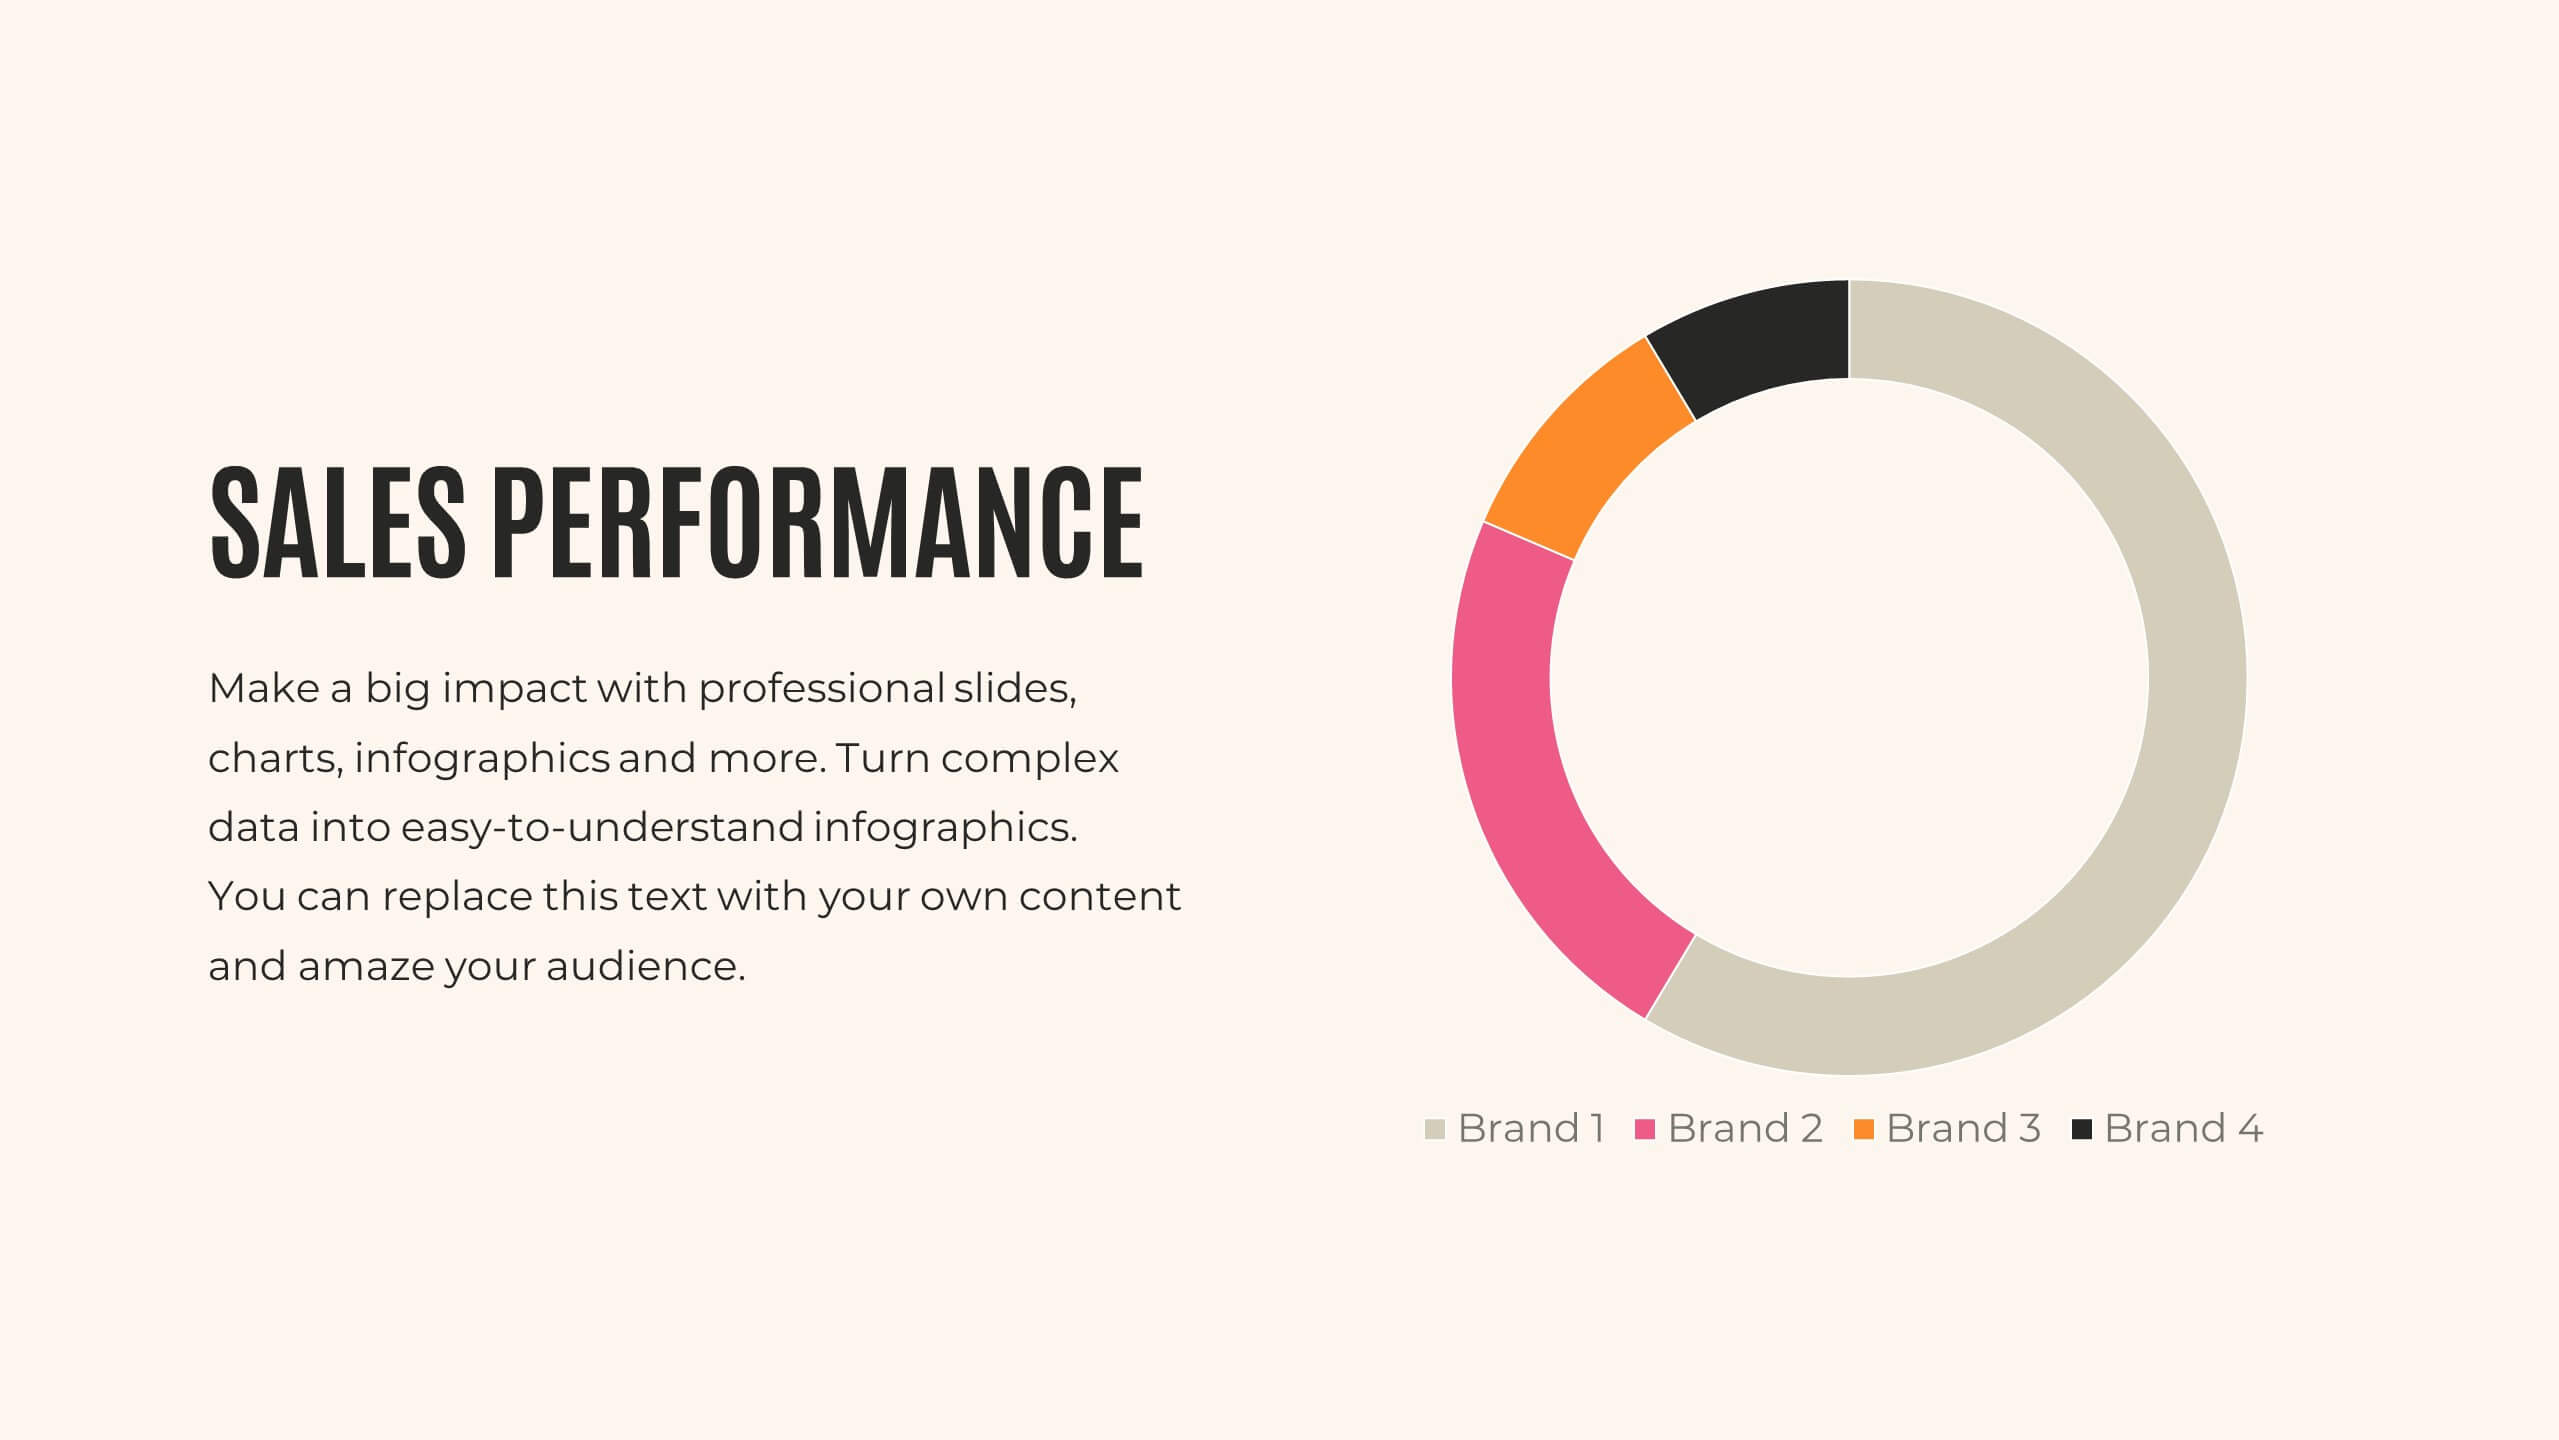
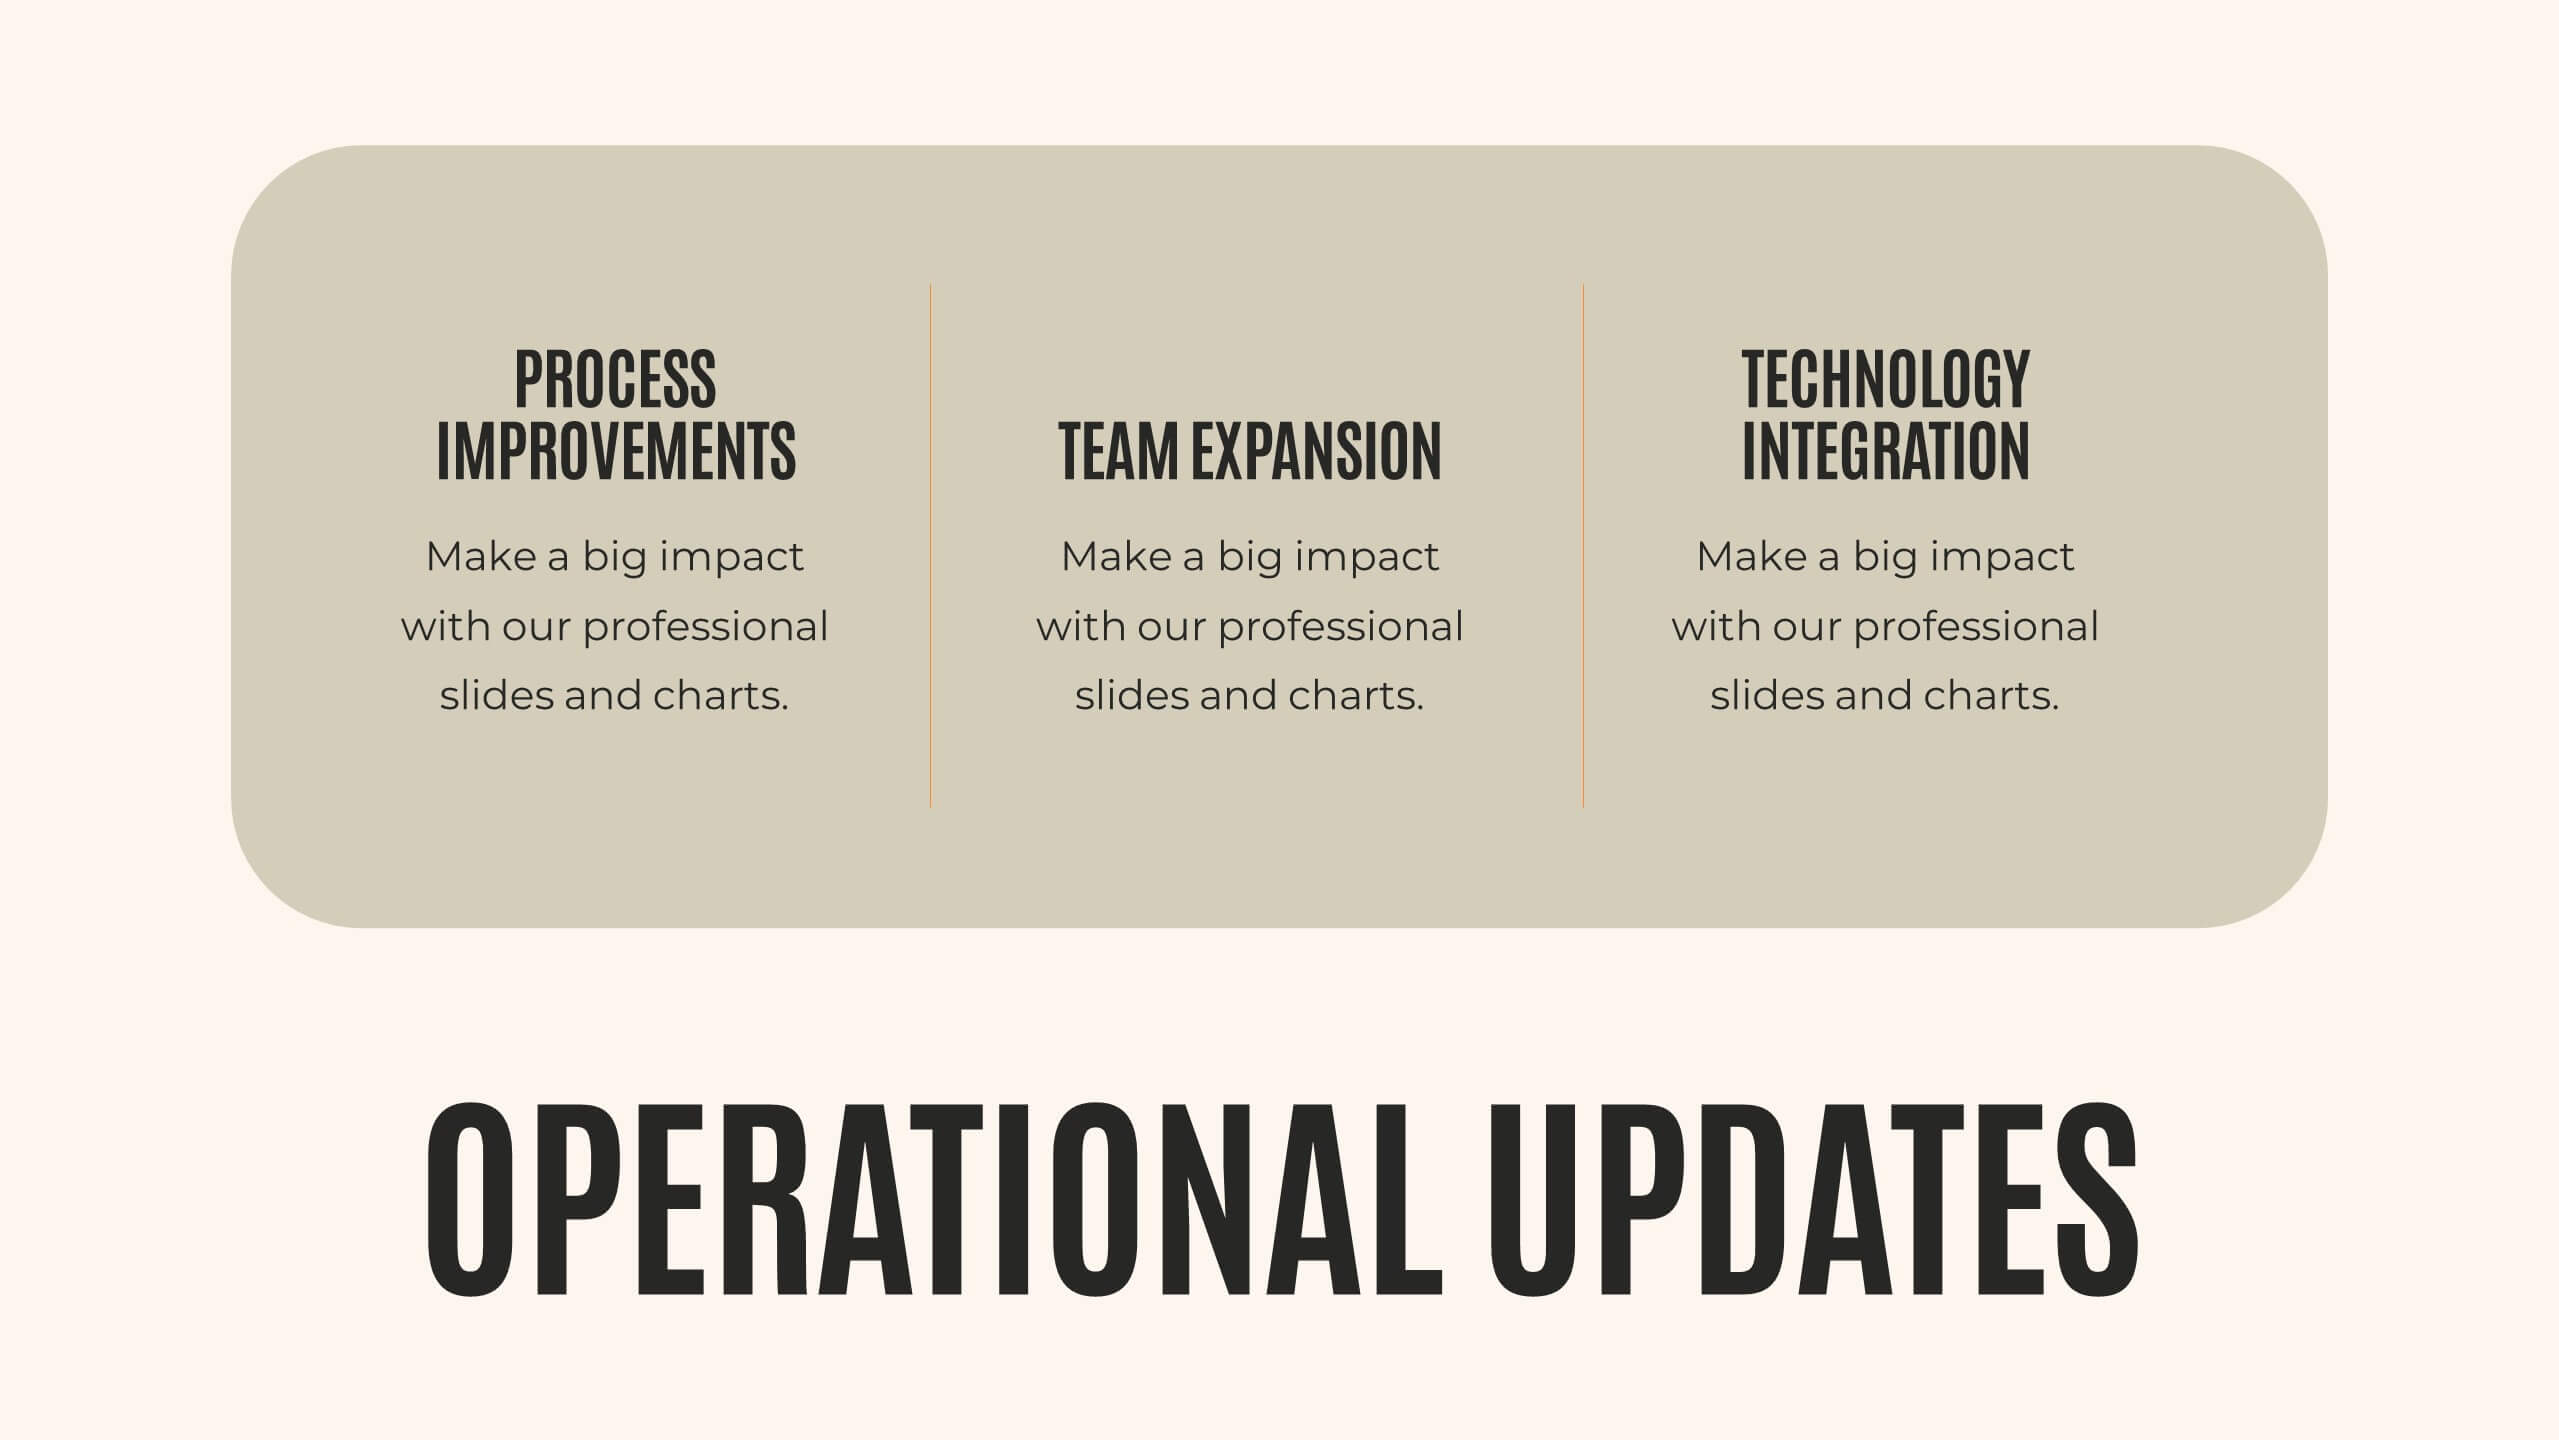
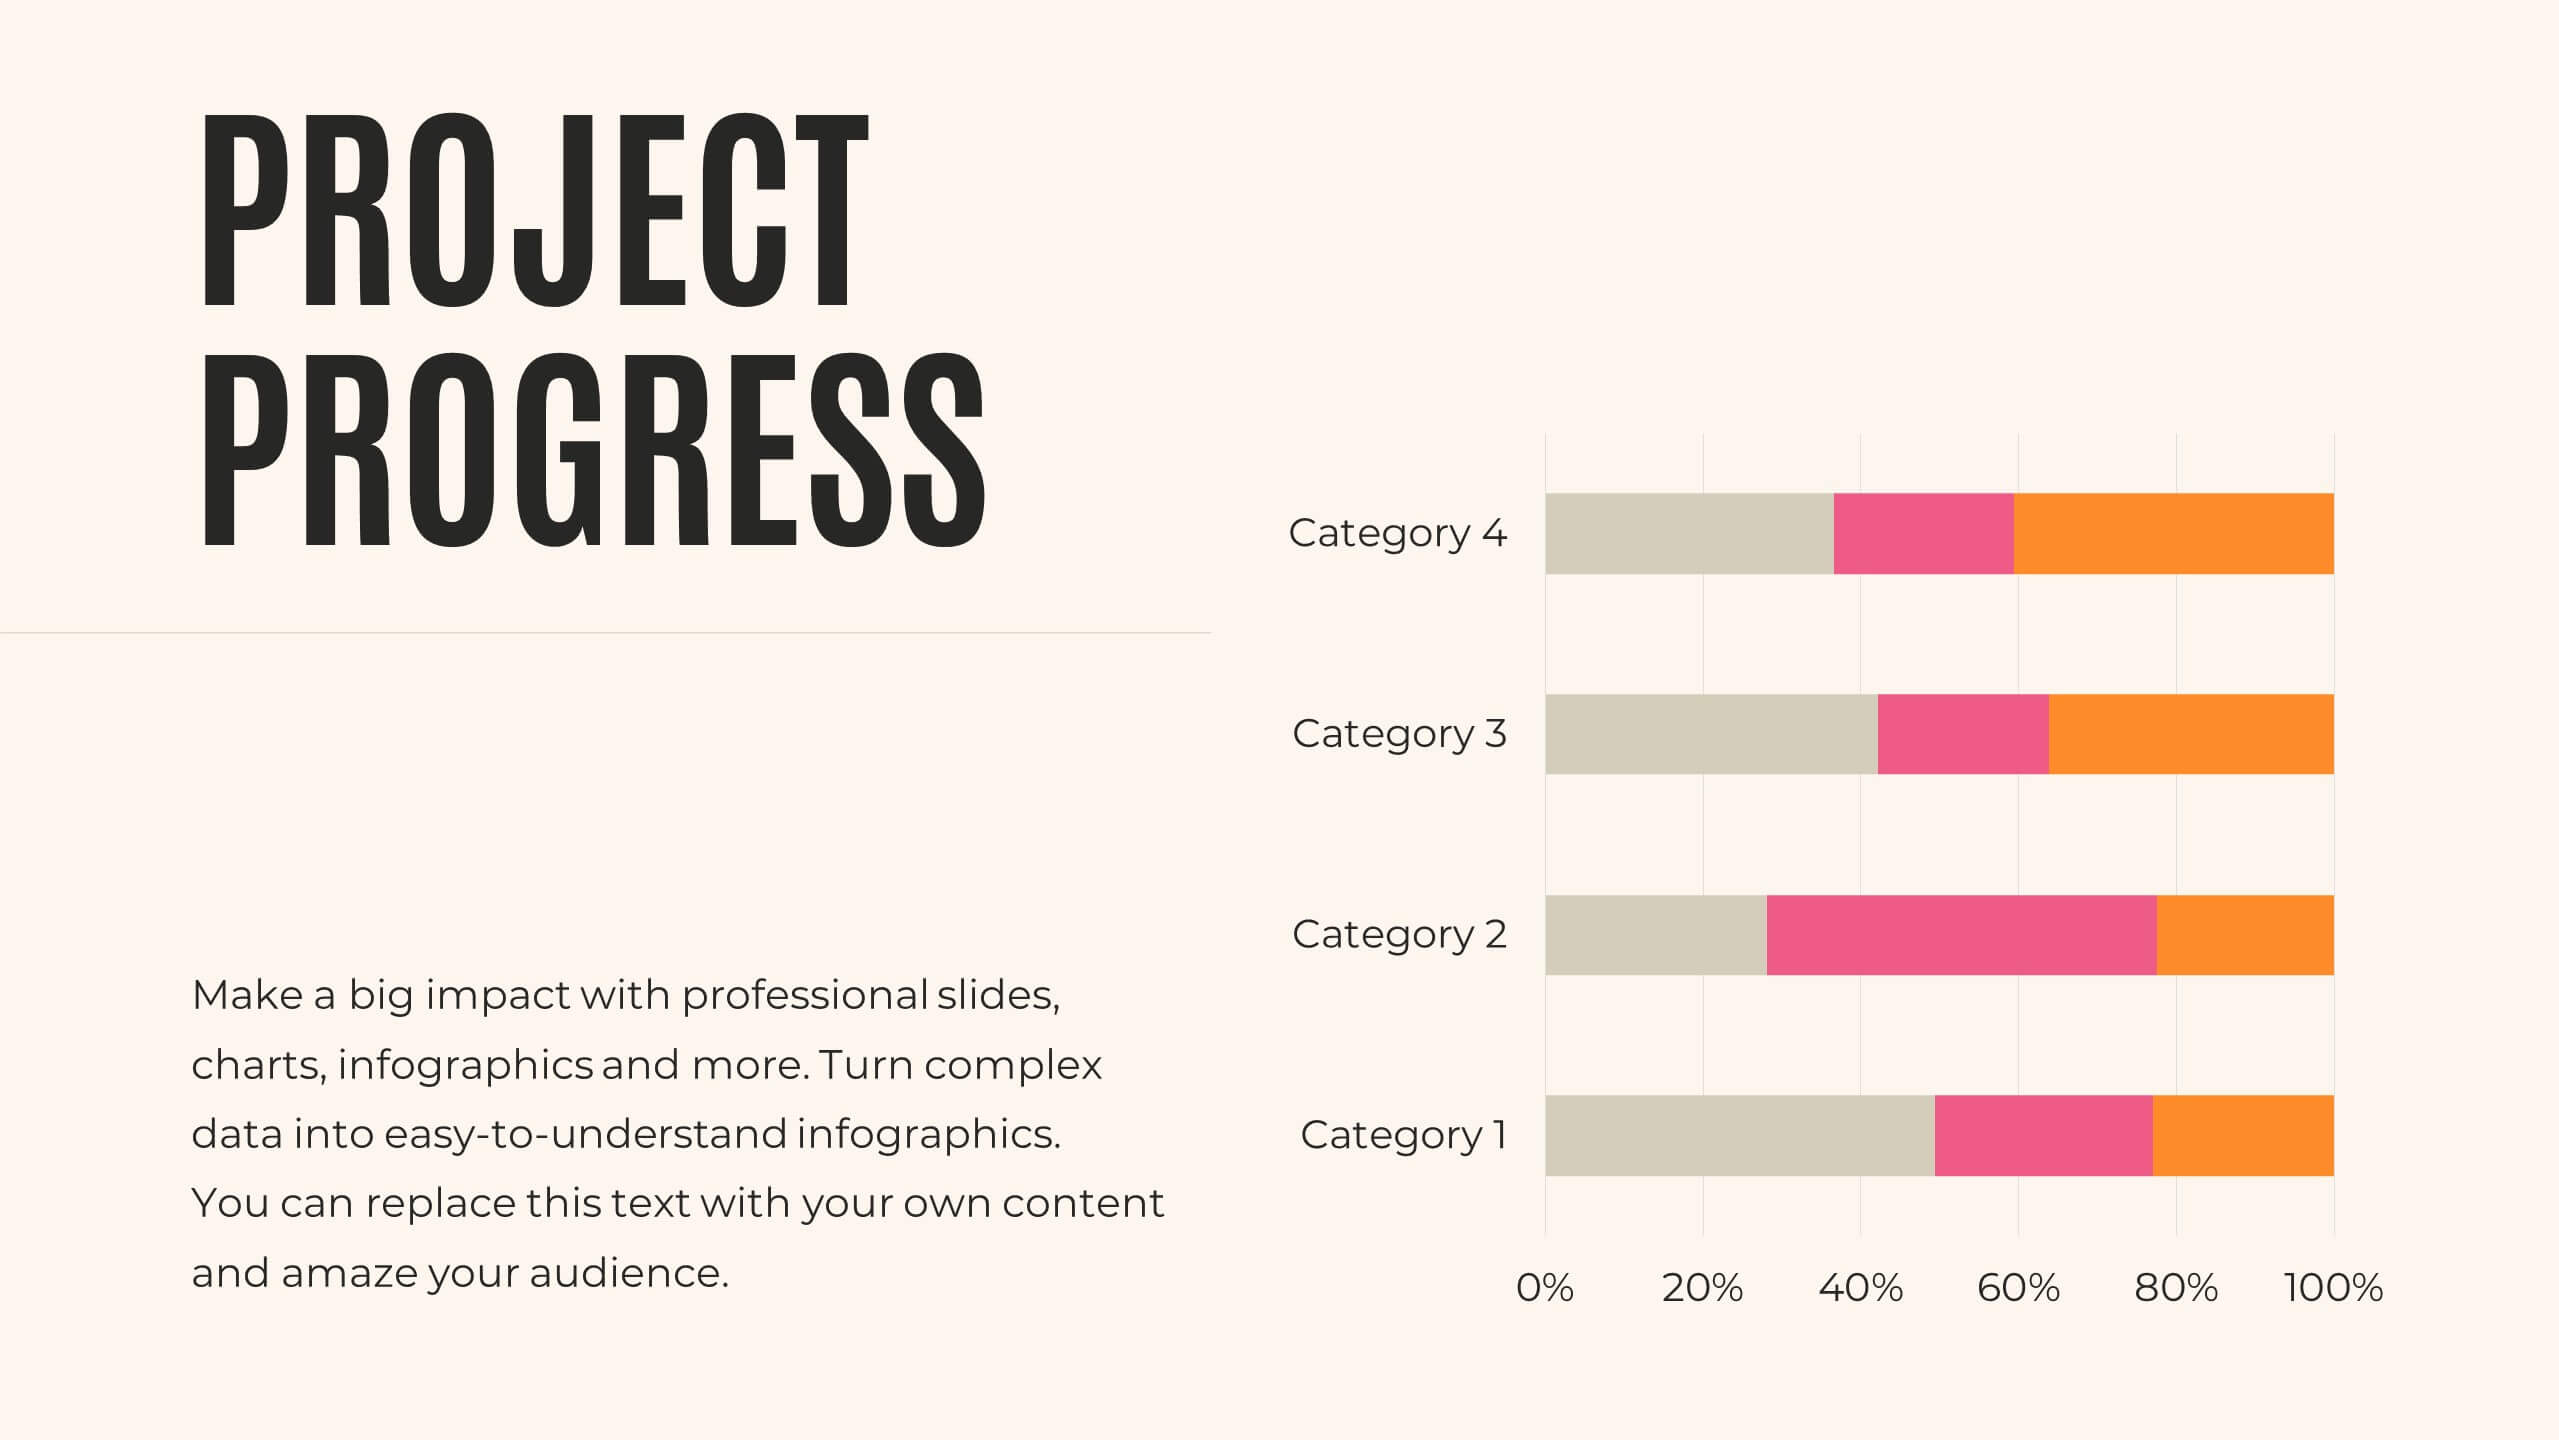
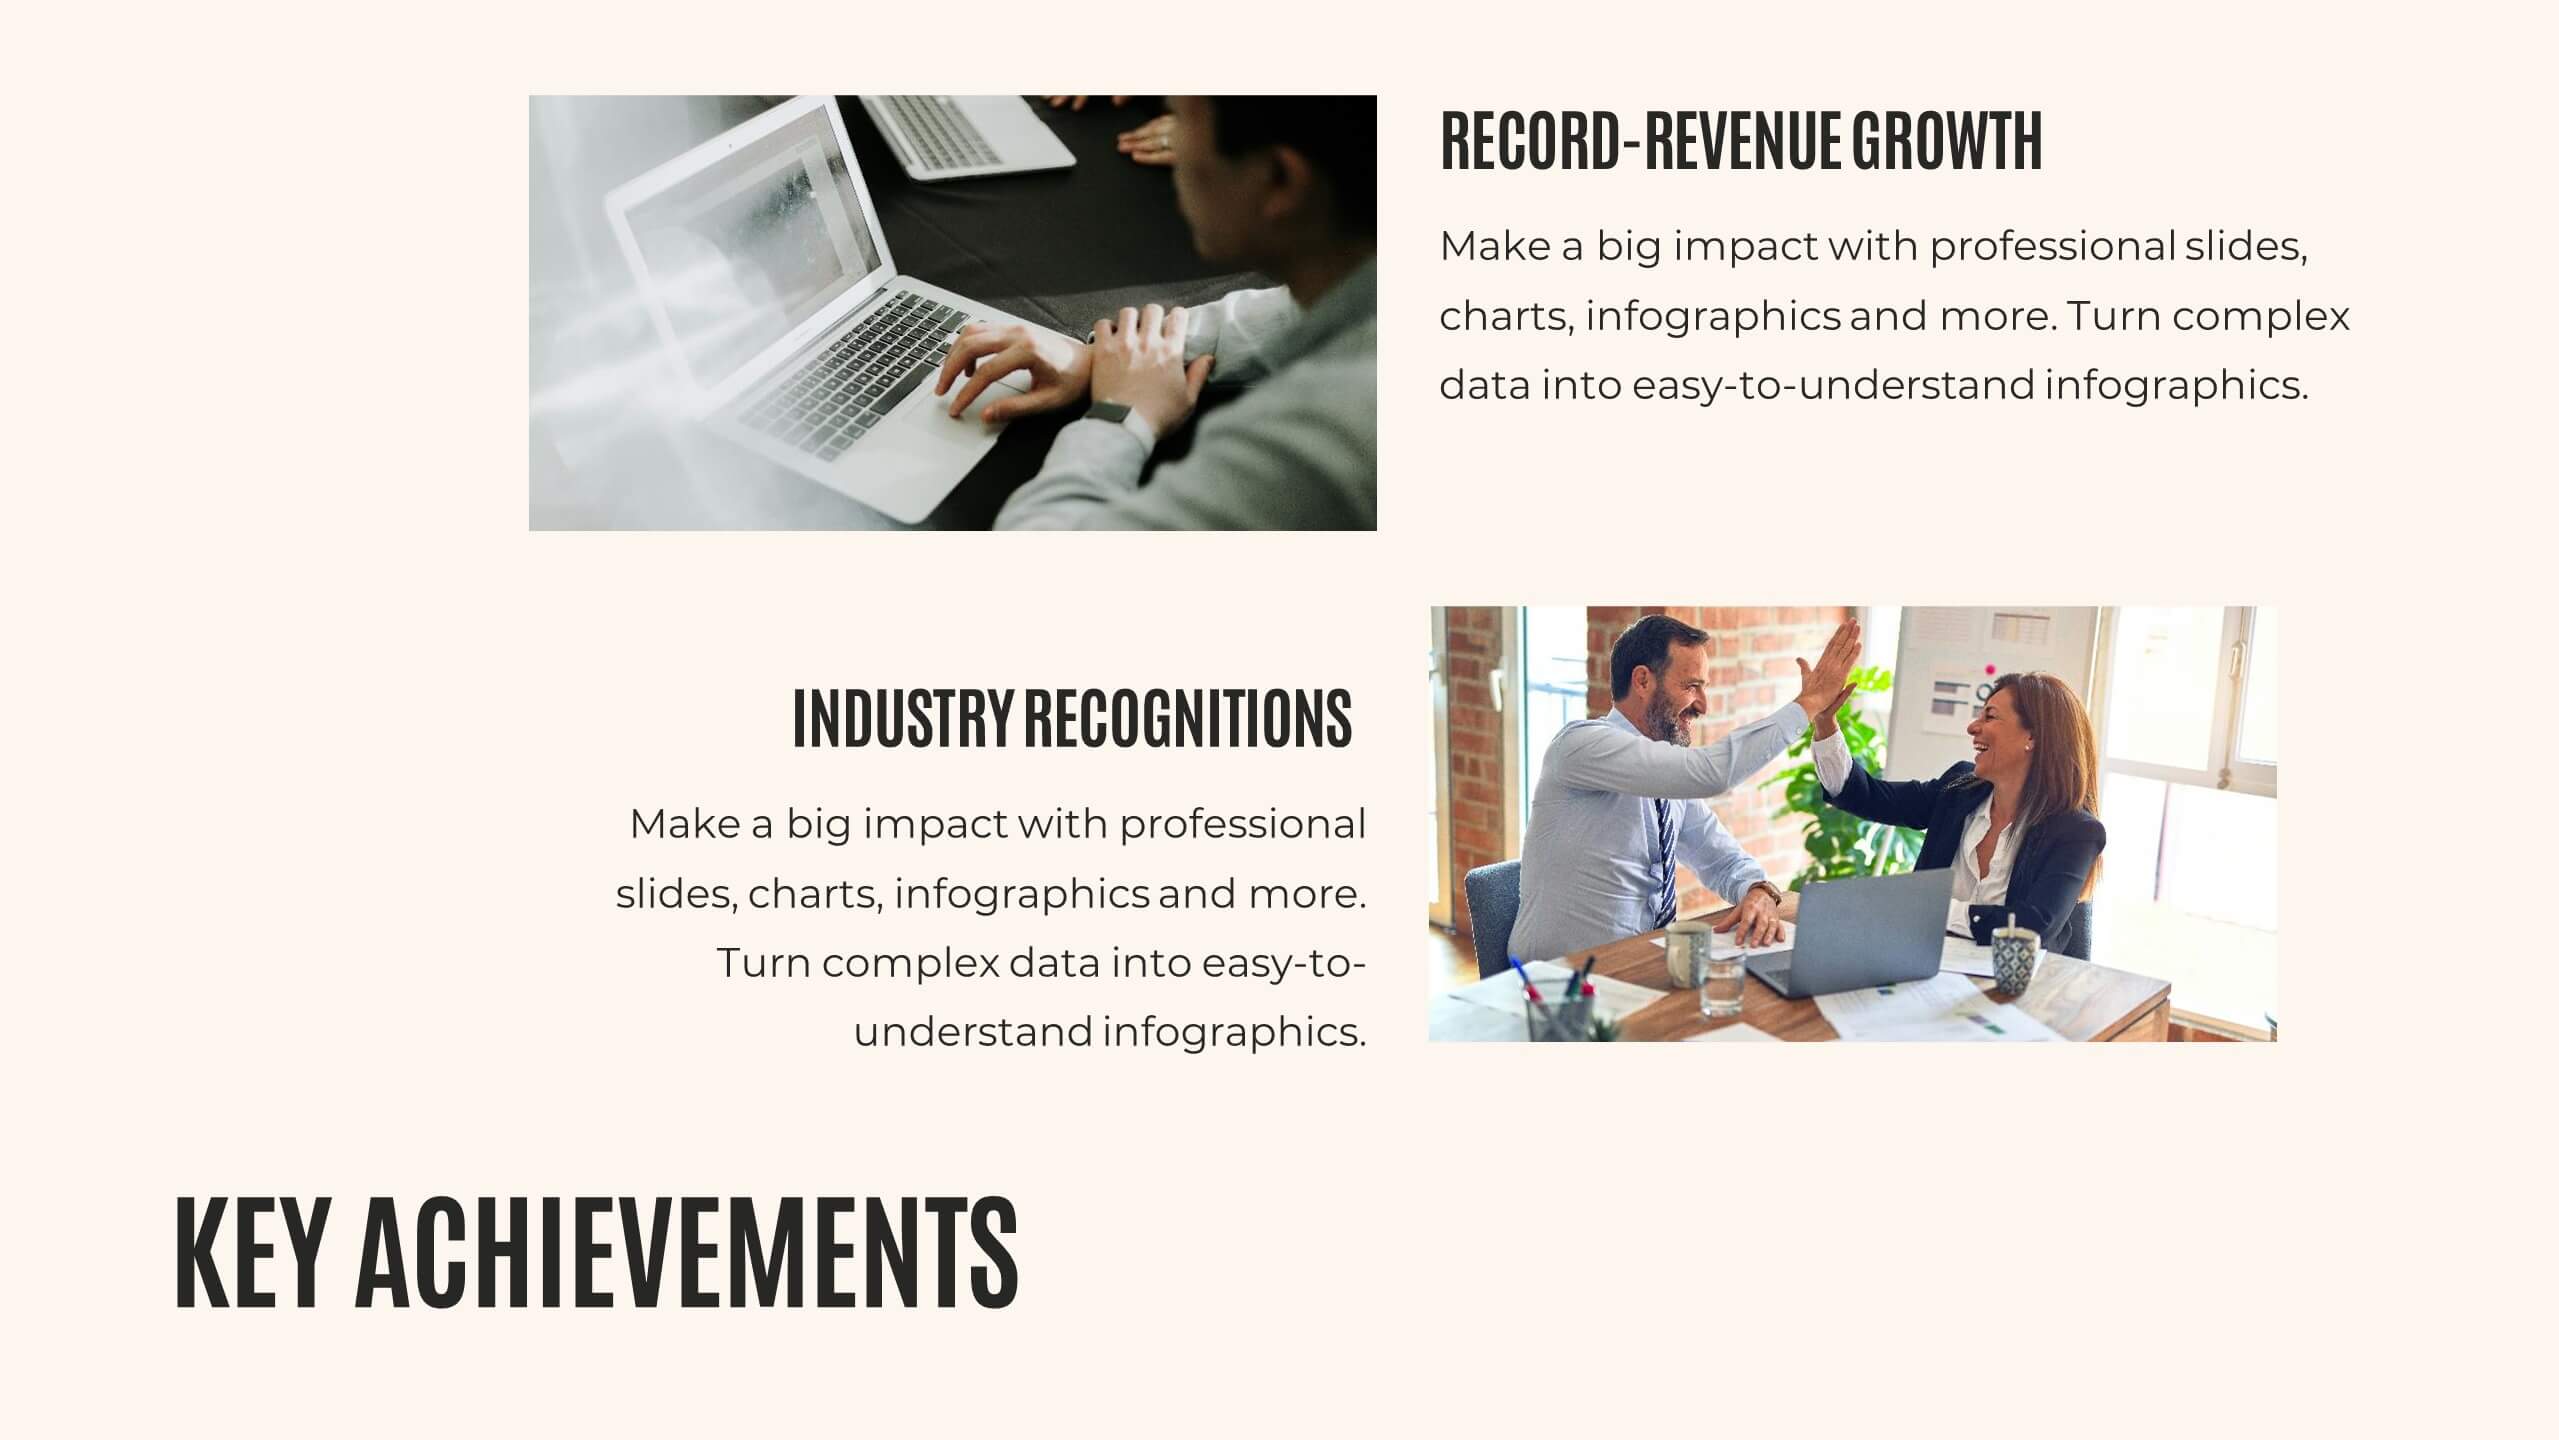
Journey Annual Report Presentation
Present your annual report with clarity and impact! This template covers agenda, key highlights, financial summary, sales performance, and project progress. Ideal for detailing achievements, insights, and future priorities. Compatible with PowerPoint, Keynote, and Google Slides, it ensures your data is visually compelling and easy to understand. Showcase your success effortlessly!


6 slides
Business Development Strategy Infographic
Business Strategy refers to a set of planned actions and decisions designed to achieve specific goals and objectives within an organization. This infographic template is designed to showcase the key elements and steps involved in a business development strategy. Ideal for entrepreneurs and marketing professionals, this template helps present the roadmap for business growth and success. The visuals showcase the market research and analysis conducted to identify target audiences, market trends, and competitors. Graphs and charts represent market growth potential and opportunities. This template is fully compatible with Powerpoint, Keynote, and Google Slides.


7 slides
Solution Infographics Presentation Template
Featuring our solution Infographic template, We have a solution for your presentation problems. Give your next presentation the edge with this template, that allows you to present the perfect solutions to your audience. All the content is completely customizable and the built-in icons can be replaced with your own text and illustrations. Choose from the various themes available, and make it fit your needs. This template contains all the elements needed to make your infographic presentation pop! graphs, photos and a minimal style makes this design perfect for any kind of project.


26 slides
Adlyn Presentation Template
Making low-calorie foods a part of your daily diet protect against the risk of heart disease, diabetes, and cancer. They make you feel full while reducing the daily calorie intake, which can help with weight loss. The Adlyn template is a concise, easy-to-use template that’s designed to help you inform your audience on the importance of low-calorie foods. This template is perfect for site builders, food bloggers, and writers looking to create informative content on food facts and healthy living. Using Adlyn you can add daily tips about nutrition and exercise along with a list of healthy foods.


5 slides
Energy and Natural Resources Infographics
Energy and natural resources are essential components of modern societies and economies. These vertical infographics are designed to showcase key information about energy sources, natural resources, and their impact on the environment. This template is ideal for educational purposes, awareness campaigns, environmental organizations, and companies in the energy sector. The visuals display the different types of renewable energy, such as solar, wind, hydro, geothermal, and biomass, along with their benefits and growth potential. This is fully customizable and compatible with Powerpoint, Keynote, and Google Slides.


5 slides
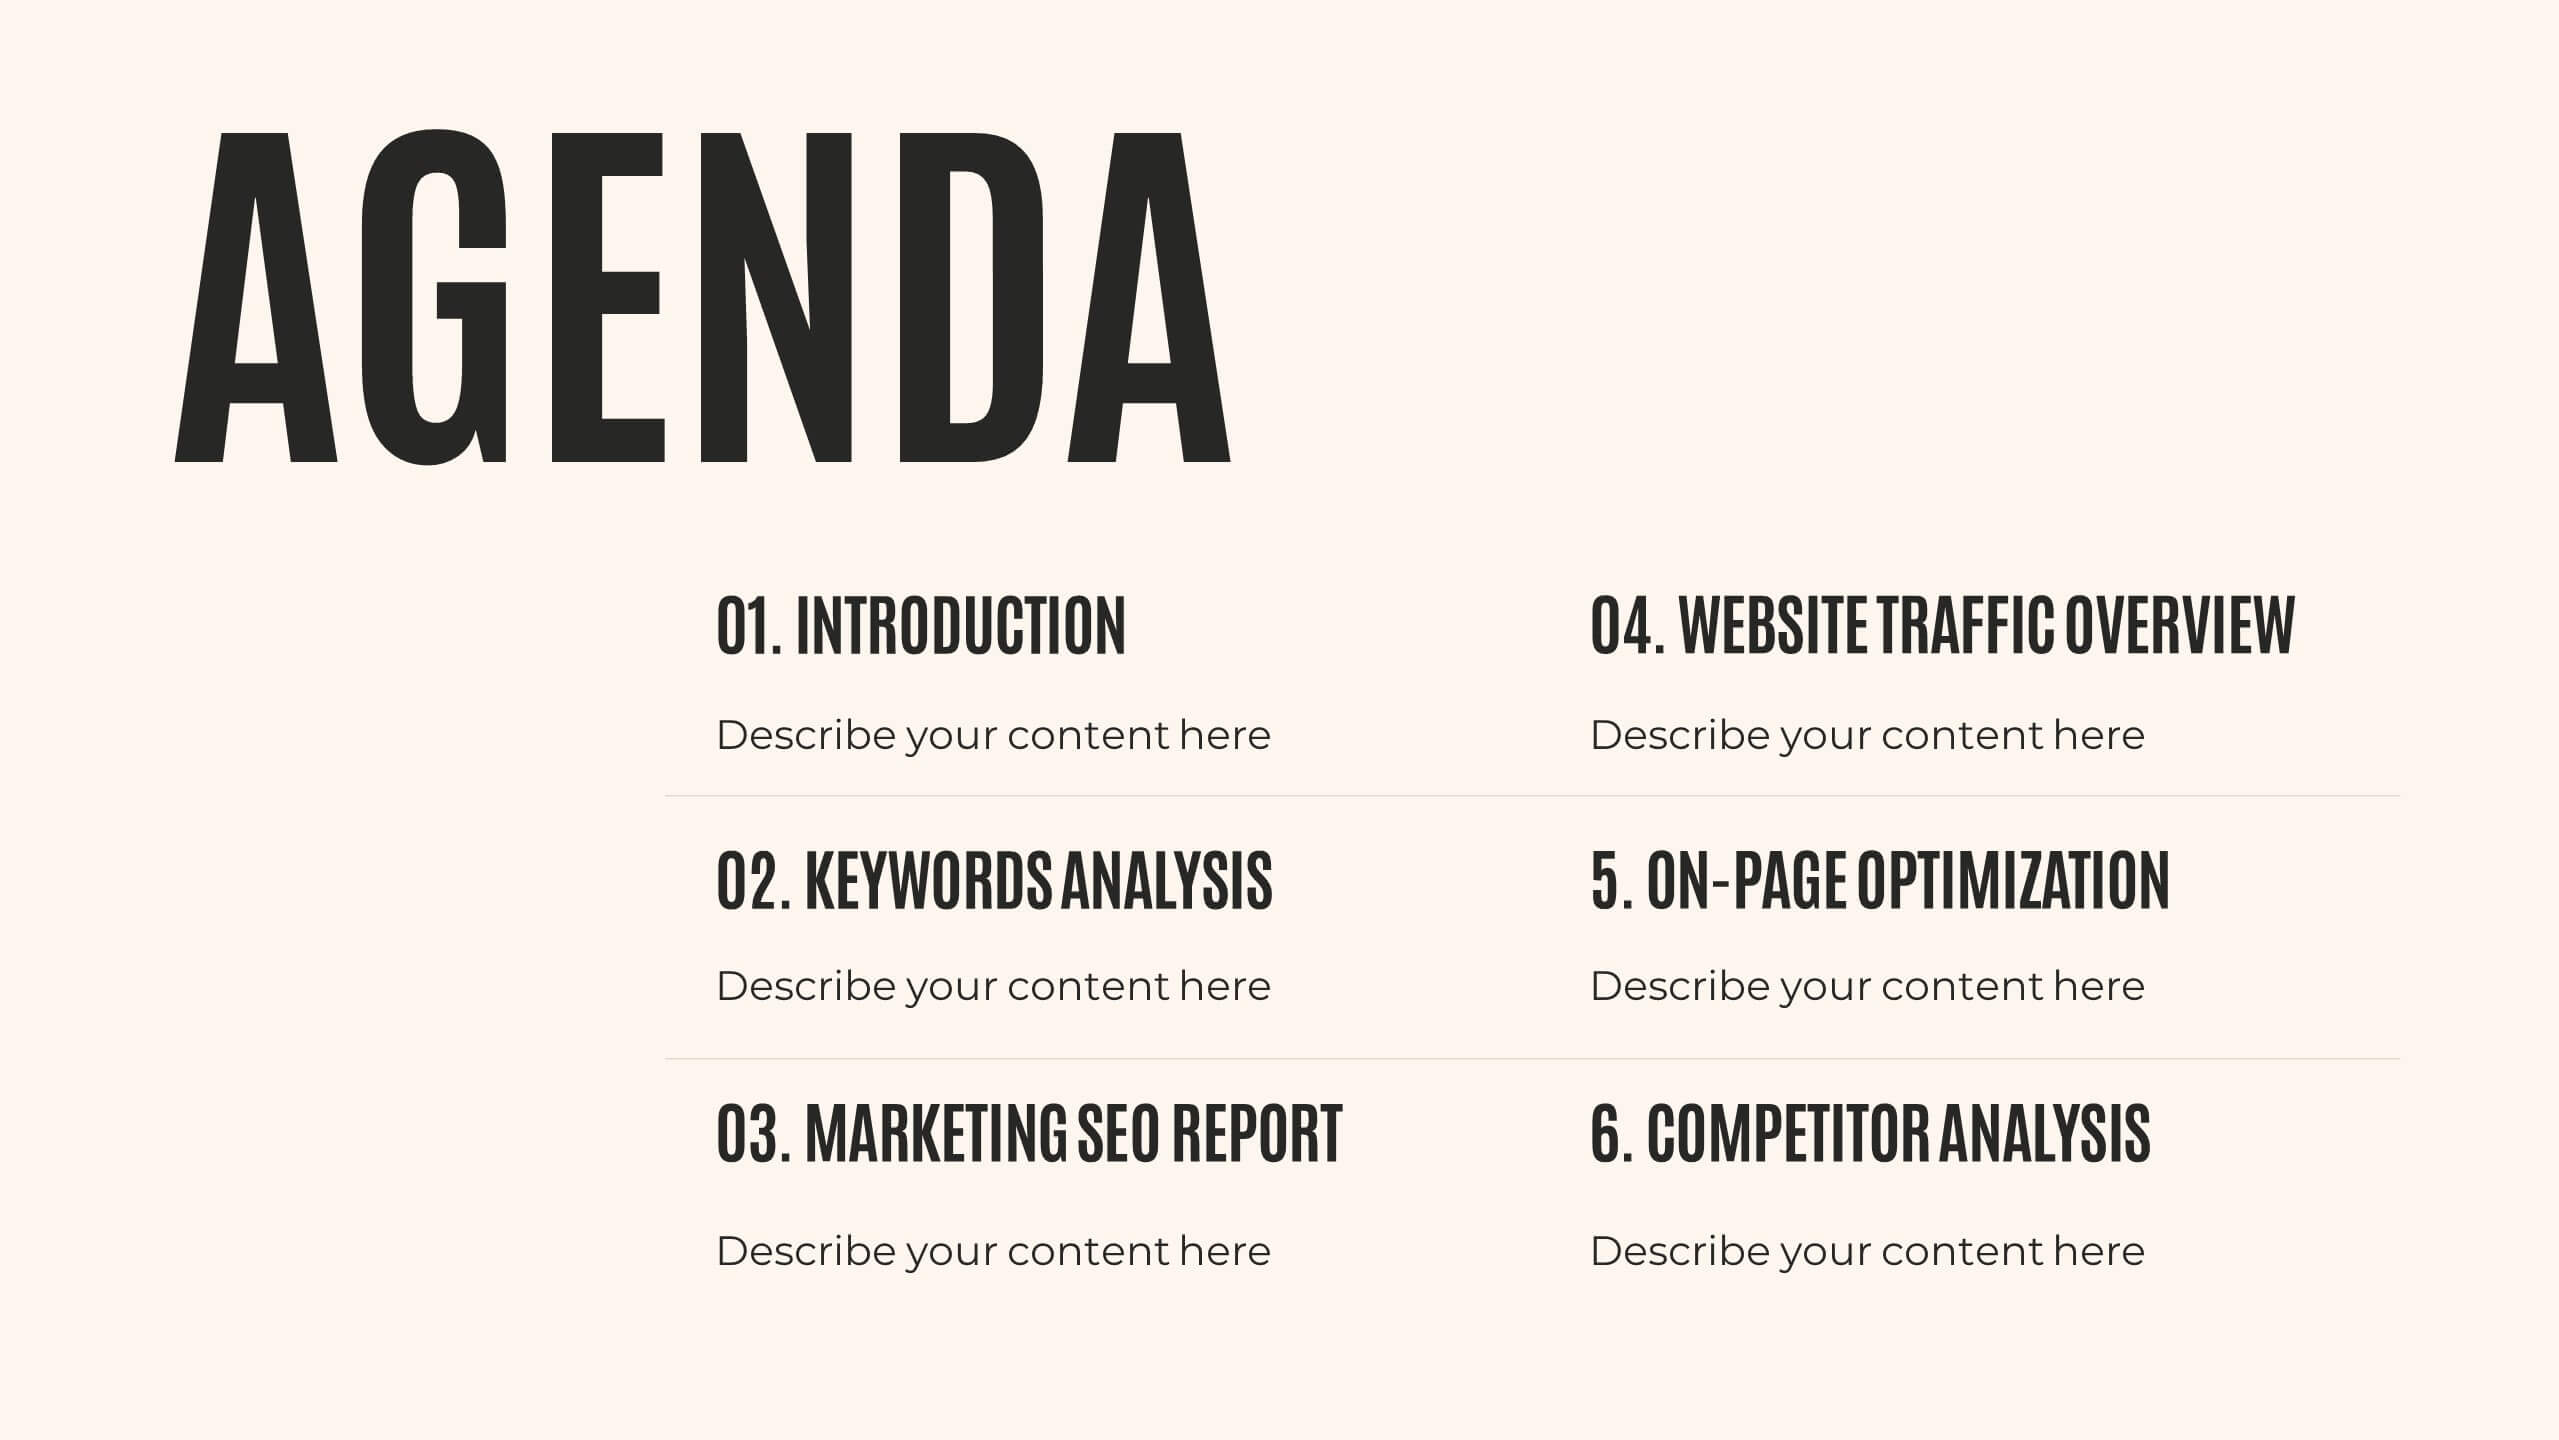
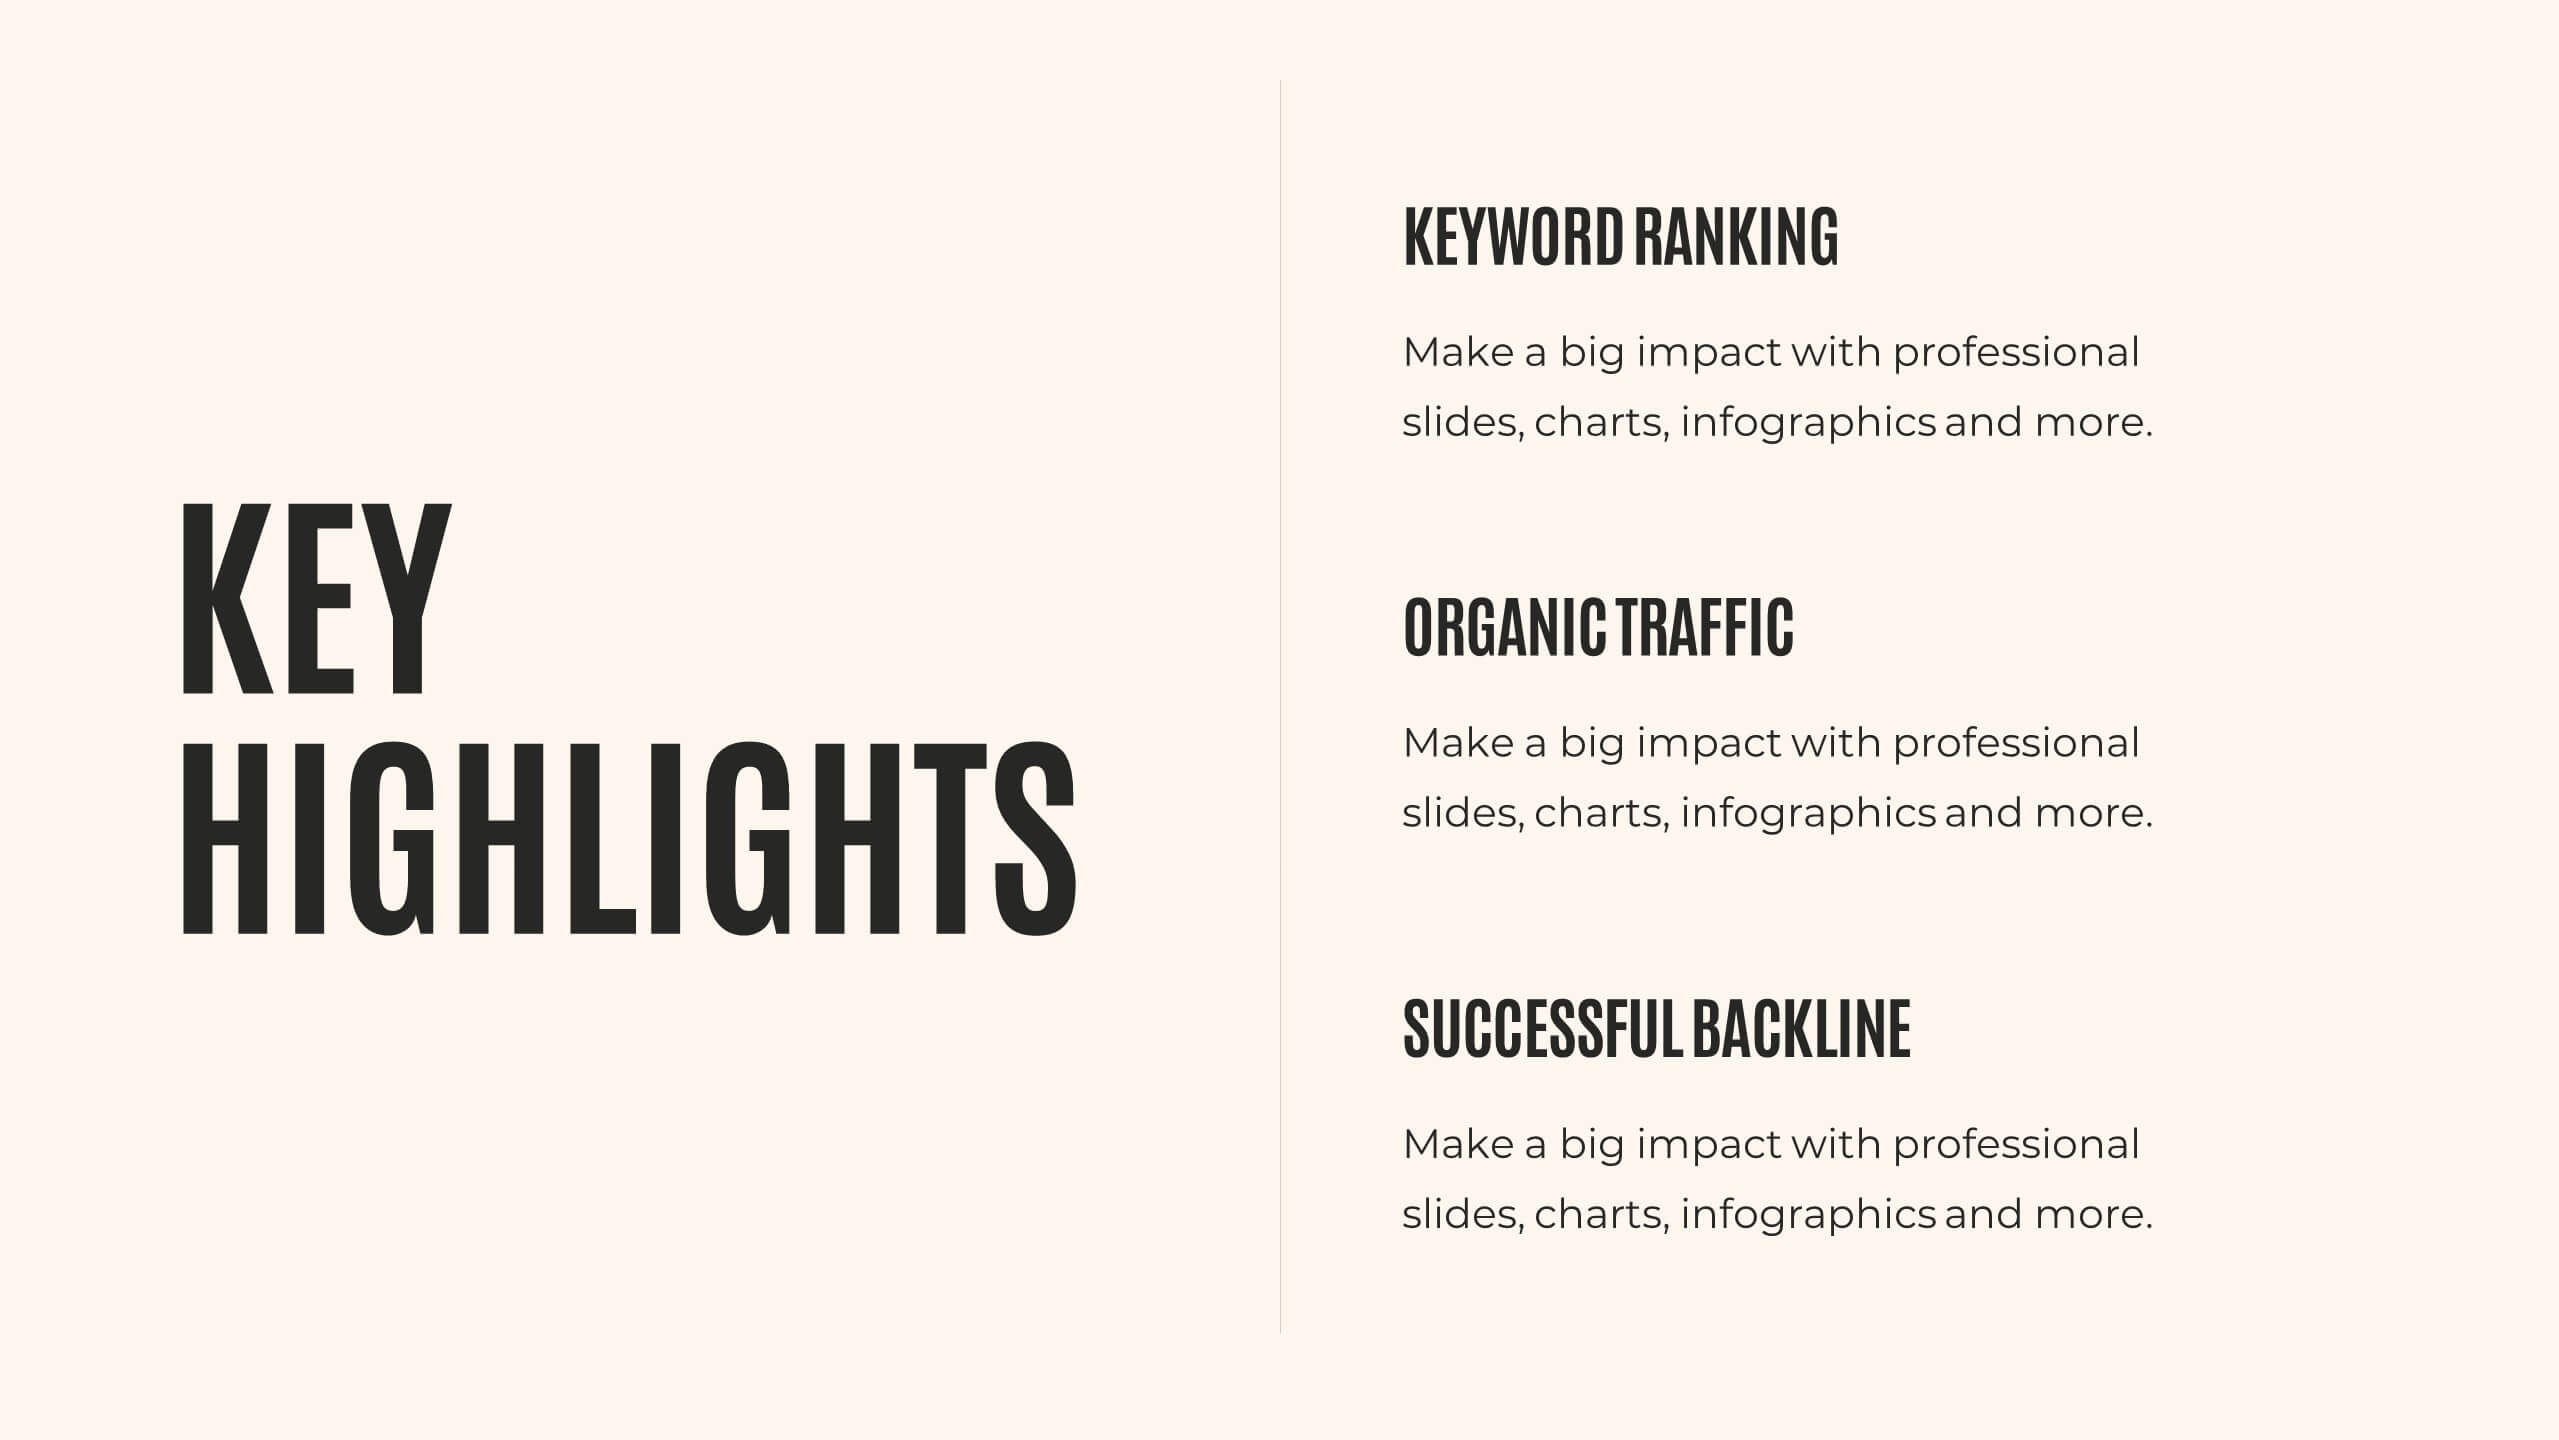
SEO and Funnel Tactics in Marketing Presentation
Showcase your digital strategy step-by-step with the SEO and Funnel Tactics in Marketing Presentation. Designed with a layered visual layout, this template helps you highlight up to five key stages of your marketing funnel—from awareness to conversion. Fully customizable in PowerPoint, Canva, Keynote, and Google Slides.


7 slides
Geometric Series Infographic
Geometric series have various applications in mathematics, physics, engineering, economics, and other fields. Get ready for a joyful expedition into the world of numbers, shapes, and patterns with our geometric series infographic. This template is a celebration of mathematical elegance, presented with a burst of enthusiasm to make learning a delightful adventure. This is fully customizable and compatible with Powerpoint, Keynote, and Google Slides. This allows you to paint a vivid picture by relating geometric series to real-life scenarios. Showcase how these mathematical visuals resonates in unexpected places.


22 slides
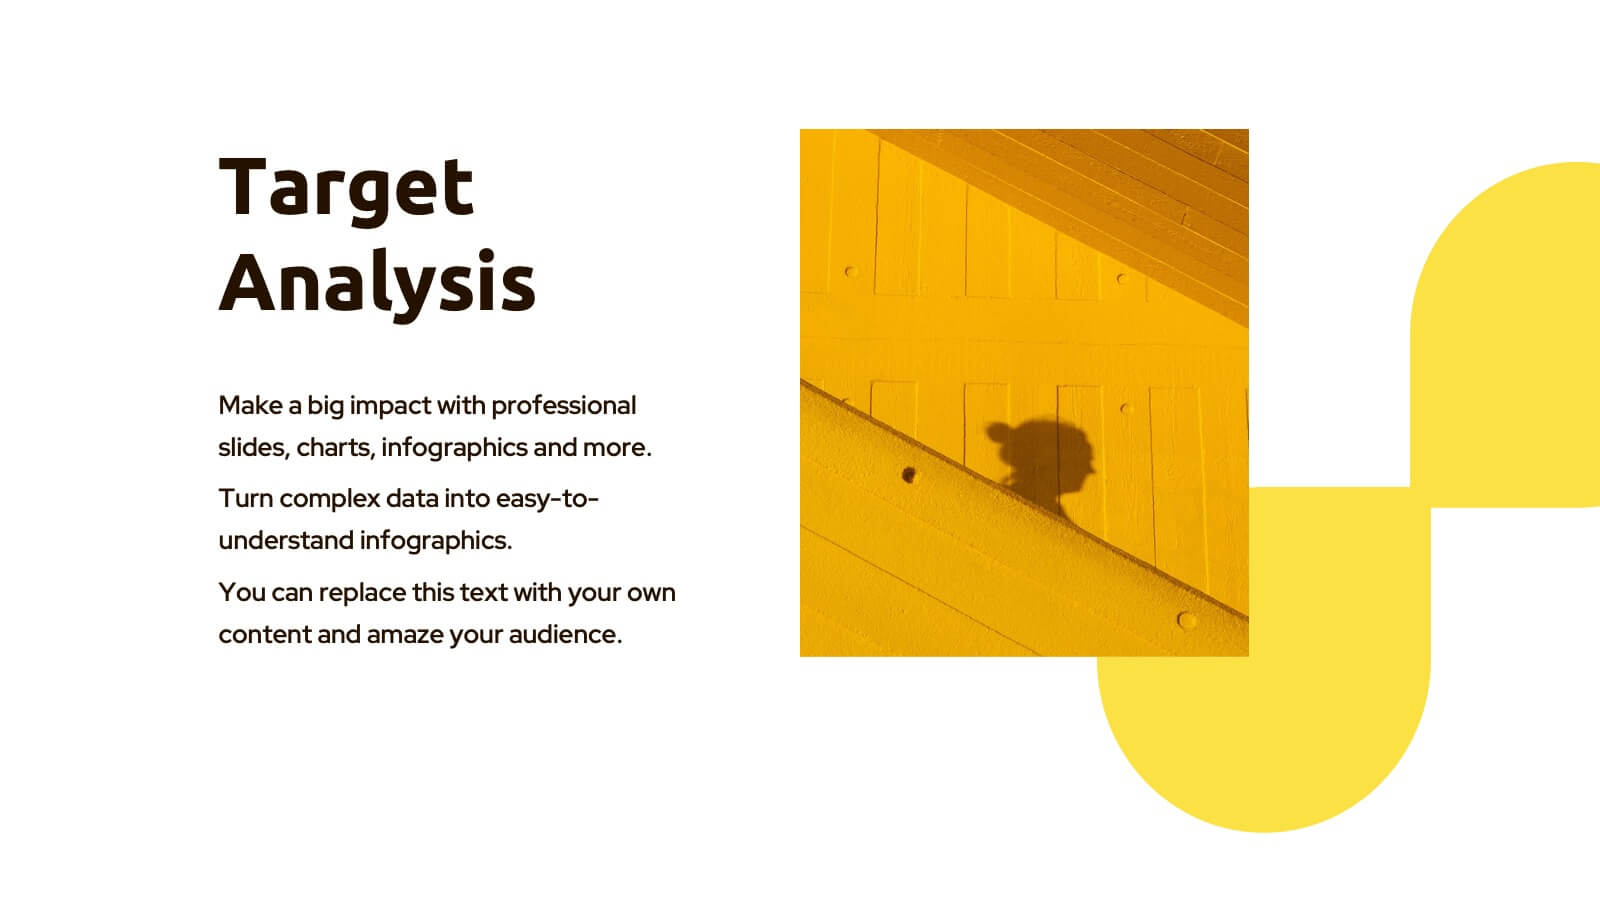
Cascade Brand Identity Presentation
Define and refine your brand with this brand identity presentation template, designed in deep blue tones. It covers all brand development aspects, from introduction to market analysis, brand values, and competitive landscape. Compatible with PowerPoint, Google Slides, and Keynote, it's ideal for creating a compelling brand narrative.