


Features
- 4 Unique slides
- Fully editable and easy to edit in Microsoft Powerpoint, Keynote and Google Slides
- 16:9 widescreen layout
- Clean and professional designs
- Export to JPG, PDF or send by email


Do you have any questions?
Recommend


8 slides
Professional Business Executive Summary Presentation
Make your insights stand tall with a bold, clean layout that feels like a data-driven story in motion. This executive summary slide is perfect for breaking down complex ideas into three clear steps, using sleek vertical bars to add visual rhythm. Compatible with PowerPoint, Keynote, and Google Slides for easy editing.


5 slides
Risk Analysis Bowtie Diagram Presentation
Visualize threats, controls, and consequences effectively with the Risk Analysis Bowtie Diagram Presentation. This dynamic template illustrates cause-and-effect relationships using a bowtie structure, making it ideal for safety audits, project risk planning, or corporate strategy. Fully customizable in PowerPoint, Keynote, and Google Slides for any industry.


4 slides
Project Responsibility Assignment Matrix Presentation
Visualize team roles and task accountability at a glance with this Project Responsibility Assignment Matrix. This structured layout categorizes assignments using the RACI model—Responsible, Accountable, Consulted, and Informed—organized by team and position. Ideal for project managers, team leads, and operations planners, it helps ensure clarity, reduce overlap, and promote accountability across departments. Easily editable in PowerPoint, Keynote, and Google Slides for seamless customization and cross-platform use.


5 slides
Innovation with Design Thinking Framework
Boost creativity and problem-solving with the Innovation with Design Thinking Framework Presentation. This slide features a vertically stacked rocket diagram symbolizing the five key phases of design thinking—perfect for illustrating iterative innovation processes. Each level includes editable text and icons, helping you align stakeholders around empathy, ideation, and prototyping. Ideal for workshops, innovation teams, educators, or product development presentations. Fully customizable in PowerPoint, Keynote, and Google Slides.


3 slides
Company Meeting Summary Presentation
Bring clarity and focus to your post-meeting reports with this modern, professional layout. Designed to highlight discussion points, decisions, and next steps, it helps teams stay aligned and informed. Perfect for corporate updates or project recaps, this template works seamlessly with PowerPoint, Keynote, and Google Slides for quick, easy customization.


4 slides
Product Launch and Roadmap Milestones Presentation
Highlight every phase of your product journey with this Product Launch and Roadmap Milestones presentation. Designed with a winding roadmap layout and colorful milestone markers, this template is perfect for visualizing launch plans, key deliverables, and development stages. Fully editable in Canva, PowerPoint, and Google Slides for easy customization.


5 slides
Leadership and Team Management
Showcase roles, responsibilities, and the structure of your team with this clear and engaging leadership diagram. Ideal for HR professionals, team leads, and project managers to explain reporting lines and team composition. Easily editable in PowerPoint, Keynote, and Google Slides—customize colors, icons, and content in minutes.


22 slides
Event Agenda Presentation
Organize your event with precision using this Event Agenda presentation template. Designed for clarity and impact, it includes slides for conference overviews, speaker introductions, session descriptions, and networking opportunities. Perfect for business conferences or workshops, this template is compatible with PowerPoint, Keynote, and Google Slides, ensuring your event runs smoothly and professionally.


6 slides
Identifying Market Challenges Presentation
Stay ahead of the competition by breaking down market challenges with this dynamic presentation template! Designed for business strategists, marketers, and analysts, this layout helps you visually structure key obstacles and opportunities. Perfect for market research and competitive analysis. Fully customizable and compatible with PowerPoint, Keynote, and Google Slides.


5 slides
Business Problem Statement Presentation
Clarify challenges and drive solutions with this business problem statement template! Designed for strategic planning, this structured layout helps you define key issues, analyze root causes, and communicate insights effectively. Ideal for business leaders, consultants, and project managers. Fully customizable and compatible with PowerPoint, Keynote, and Google Slides for seamless use.


7 slides
Core Business Values Slide Presentation
Show what your company stands for with a bold, structured layout that highlights the principles driving your success. This presentation is ideal for communicating organizational values, culture, and goals in a professional, visually balanced way. Fully editable and compatible with PowerPoint, Keynote, and Google Slides for easy customization.


22 slides
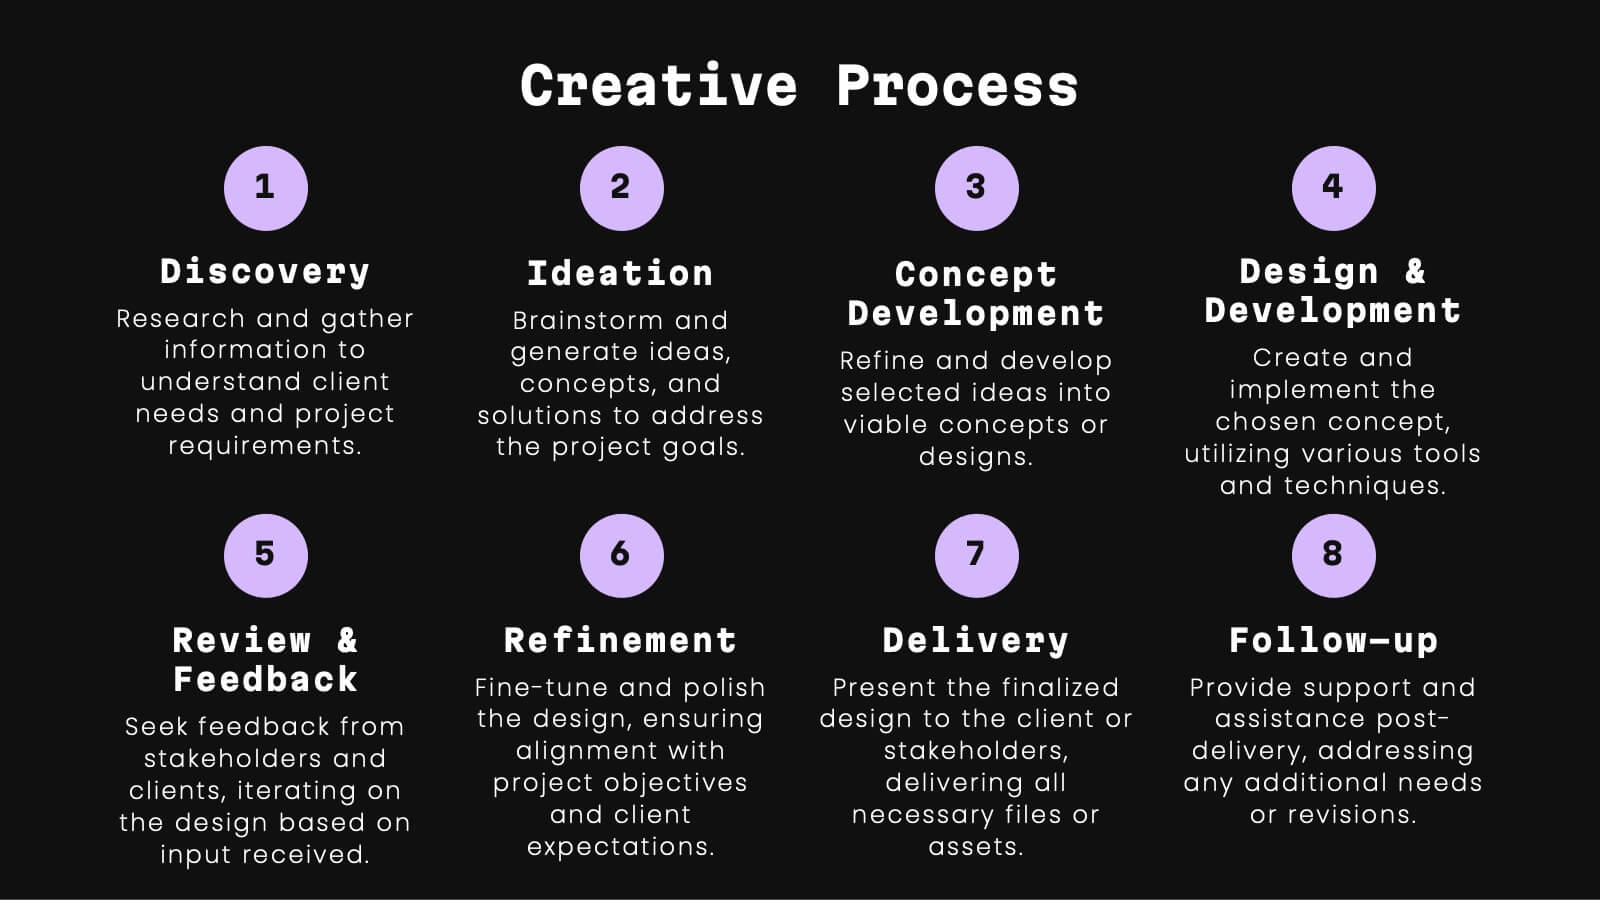
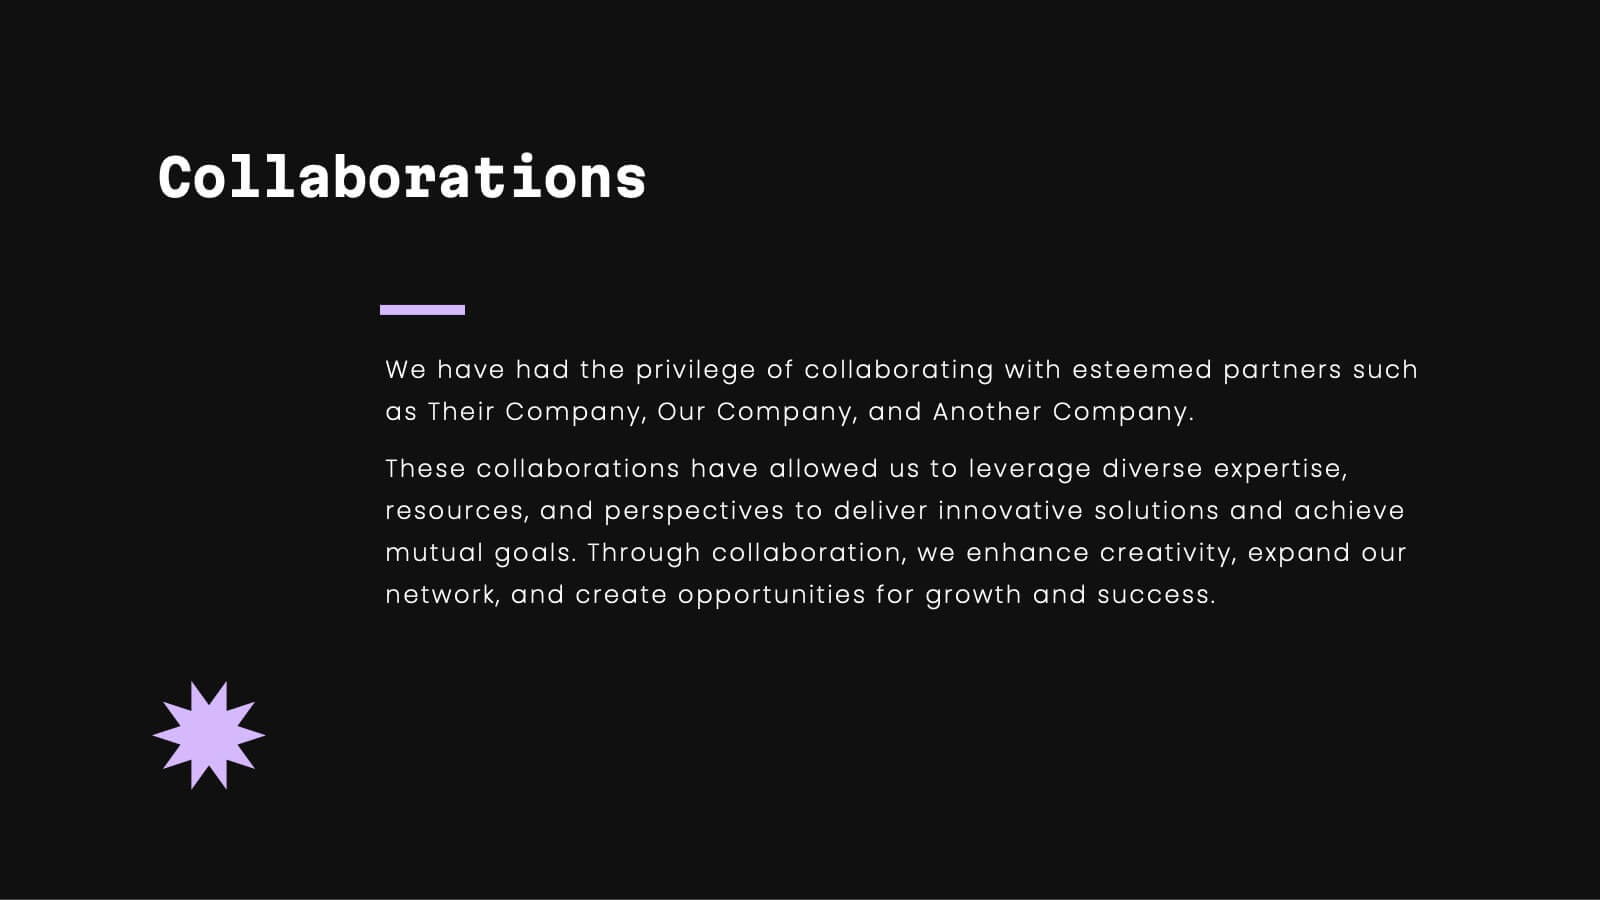
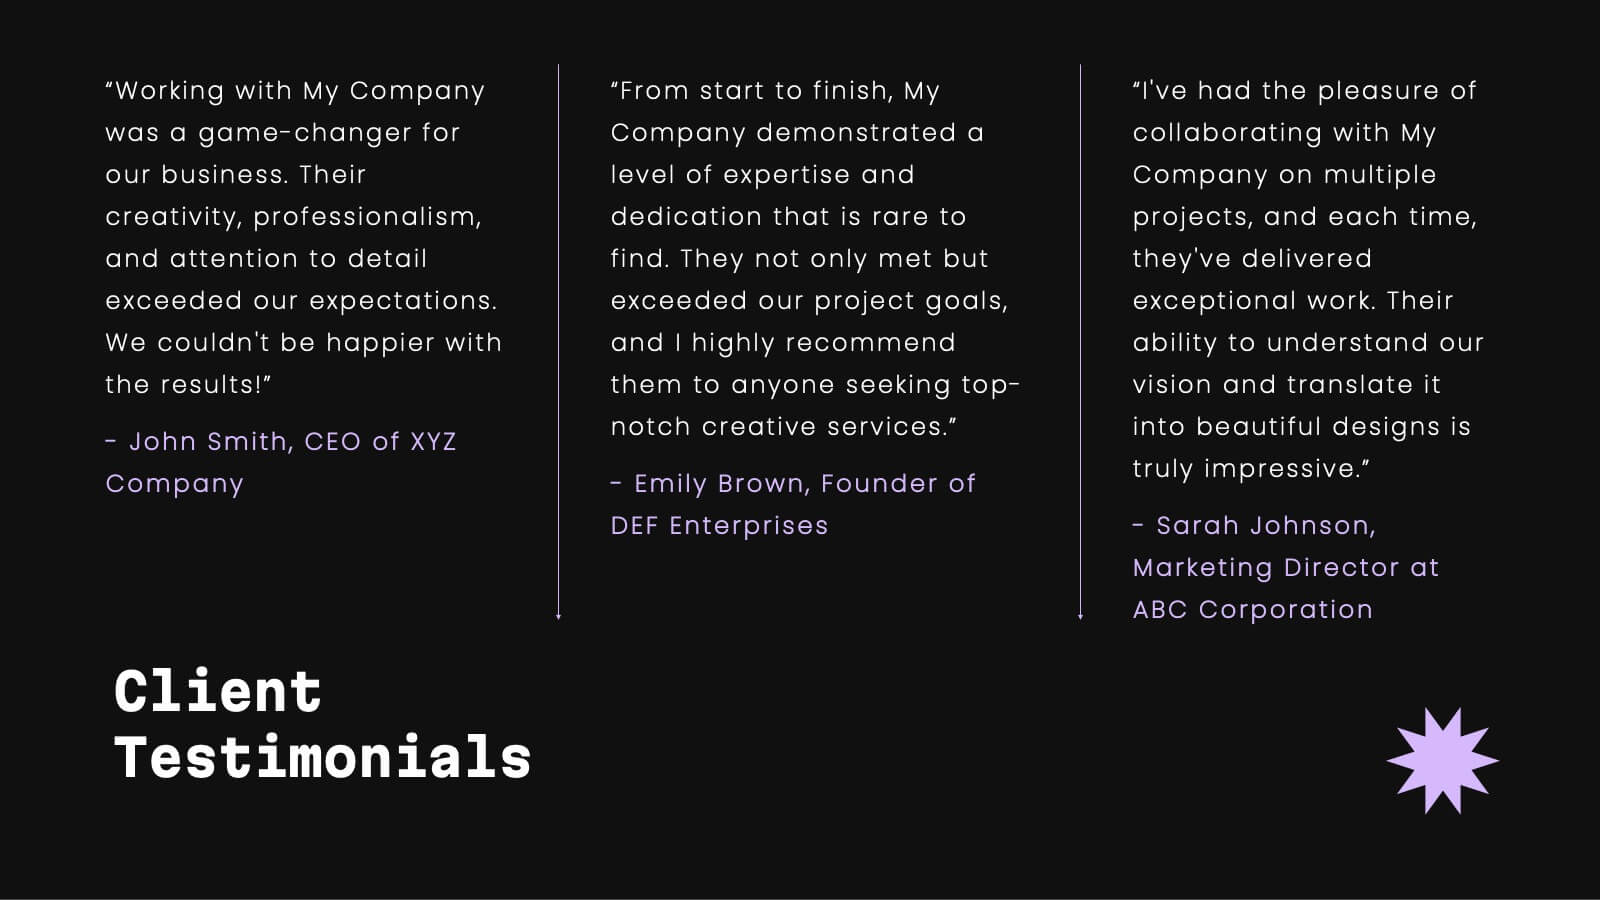
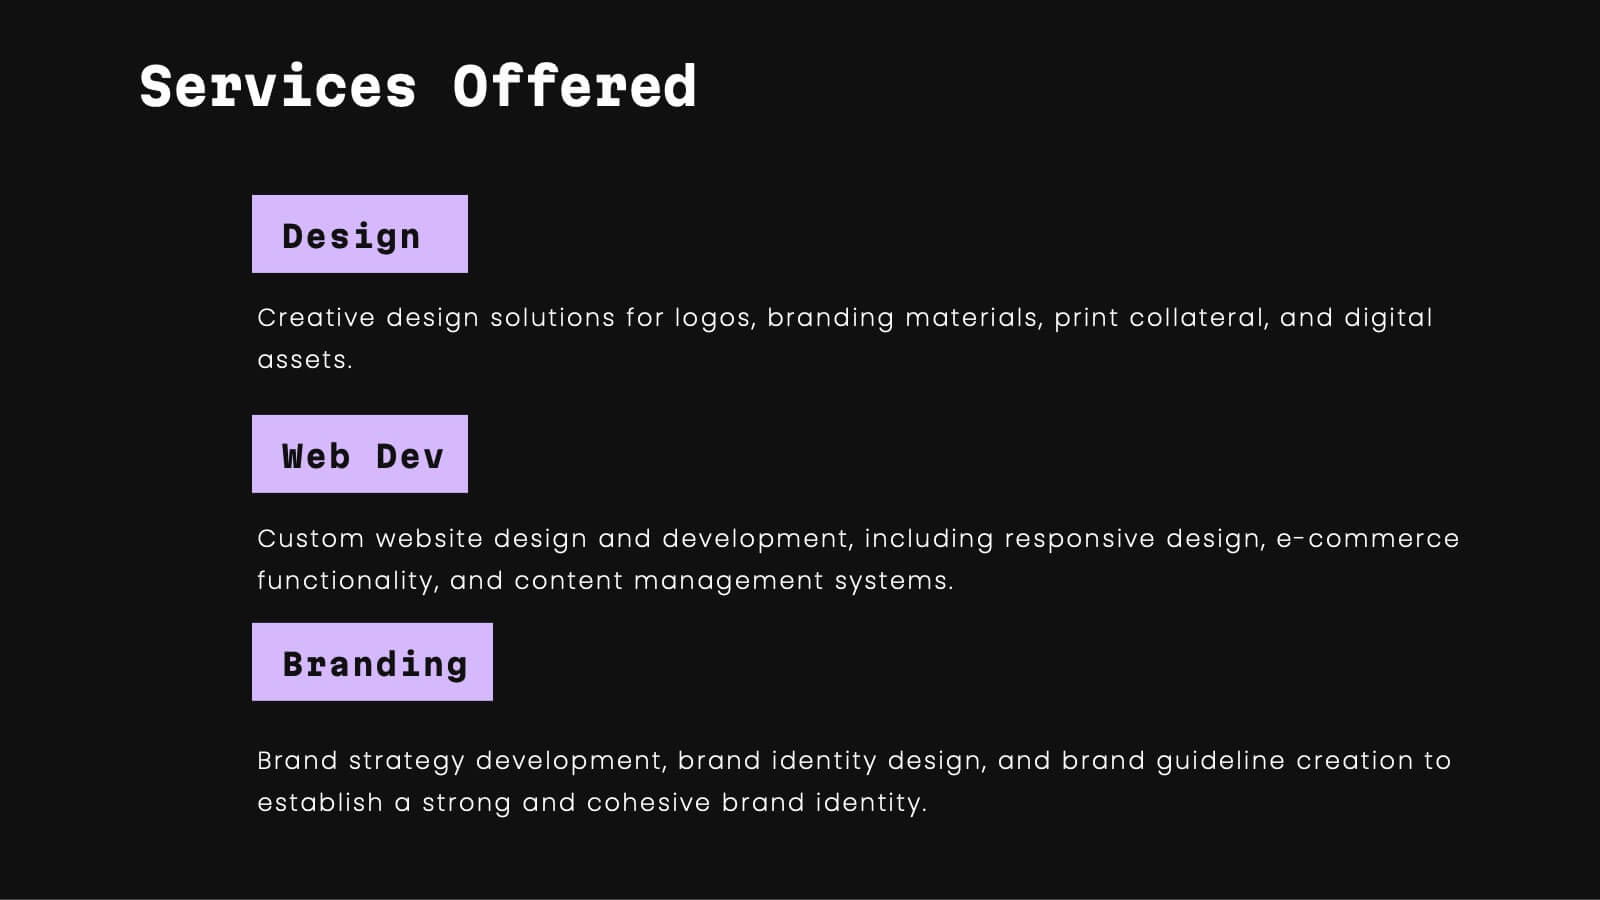
Celeste Professional Portfolio Showcase Presentation
Impress with style using this sophisticated portfolio presentation template. Perfect for showcasing featured projects, creative processes, and client testimonials, this template enhances the visual appeal of your work. Its modern, dark-themed design ensures your content stands out, making a lasting impression. Compatible with PowerPoint, Keynote, and Google Slides, it's versatile for any platform.


4 slides
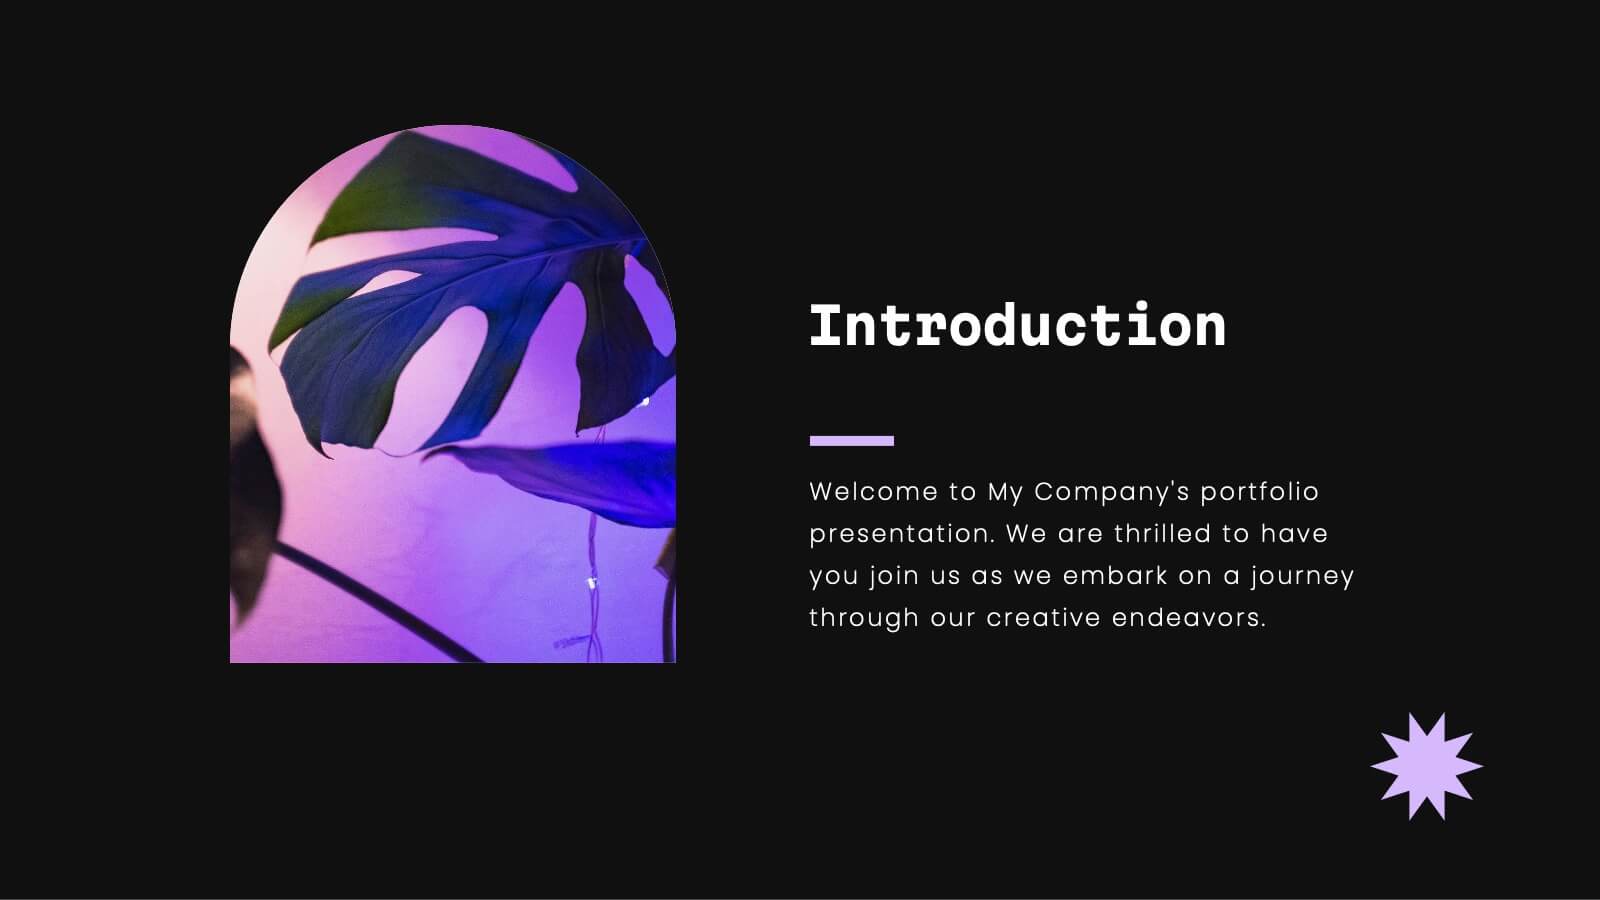
Welcome and About Us Introduction Presentation
Start strong with the Welcome and About Us Introduction Presentation, designed to deliver a polished, professional first impression. This clean layout features bold typography and geometric side visuals, perfect for introducing your company, brand values, or strategic vision. Easily customize the content to suit corporate profiles, startup decks, or team intros. Compatible with Canva, PowerPoint, Google Slides, and Keynote.


5 slides
Contemporary History Timeline Infographics
Immerse your audience in a visual journey through time with the contemporary history timeline infographics template. Rendered in a sophisticated blue and white palette, this resource is designed to add a creative twist to historical chronology, making it an educational yet captivating. History educators, academic students, and researchers will find this vertical-style infographic ideal for distilling complex timelines into engaging visual narratives. Compatible with Powerpoint,Keynote, and Google Slides. This template is equipped with sleek graphics, thematic icons, and dedicated image placeholders specifically tailored for historical content.


21 slides
Eureka Startup Growth Plan Presentation
Present your startup growth plan effectively with this sleek, dynamic presentation template designed for innovators and entrepreneurs. With its vibrant color scheme and streamlined layout, it simplifies complex data, ensuring your audience stays engaged. The template offers slides for showcasing your mission, market analysis, business strategies, and revenue projections. Dedicated sections highlight team profiles, target audience insights, and funding goals, providing a comprehensive view of your growth trajectory. Use the timeline slides to map out milestones and visually articulate your progress. Fully customizable in PowerPoint, Google Slides, and Keynote, it adapts effortlessly to your specific needs, enabling you to communicate your vision with clarity. Ideal for pitching to investors, presenting at conferences, or internal strategic planning, this template equips you with the tools to drive home your ideas with professionalism and style. Empower your growth journey with a presentation that reflects your startup’s potential.


6 slides
Branching Structure Tree Chart Presentation
Visualize ideas, processes, or team structures with the Branching Structure Tree Chart Presentation. This elegant tree diagram layout allows you to display six key points or stages branching out naturally from a central concept. Ideal for organizational charts, decision flows, or brainstorming visuals. Fully editable in PowerPoint, Keynote, and Google Slides.


5 slides
Climate Change Impacts Infographics
Climate Change refers to long-term shifts in temperature, precipitation patterns, wind patterns, and other aspects of the Earth's climate system. These infographic templates are perfect to educate and raise awareness about the impacts of climate change on our planet. These templates are suitable for environmental organizations, educators, or anyone seeking to convey the urgency and significance of addressing climate change. The compelling visuals, data-driven content, and clear messaging, in these templates aims to educate and inspire individuals to contribute to global efforts to address climate change and protect our planet's future.