


Features
- 5 Unique slides
- Fully editable and easy to edit in Microsoft Powerpoint, Keynote and Google Slides
- 16:9 widescreen layout
- Clean and professional designs
- Export to JPG, PDF or send by email


Do you have any questions?
Recommend


22 slides
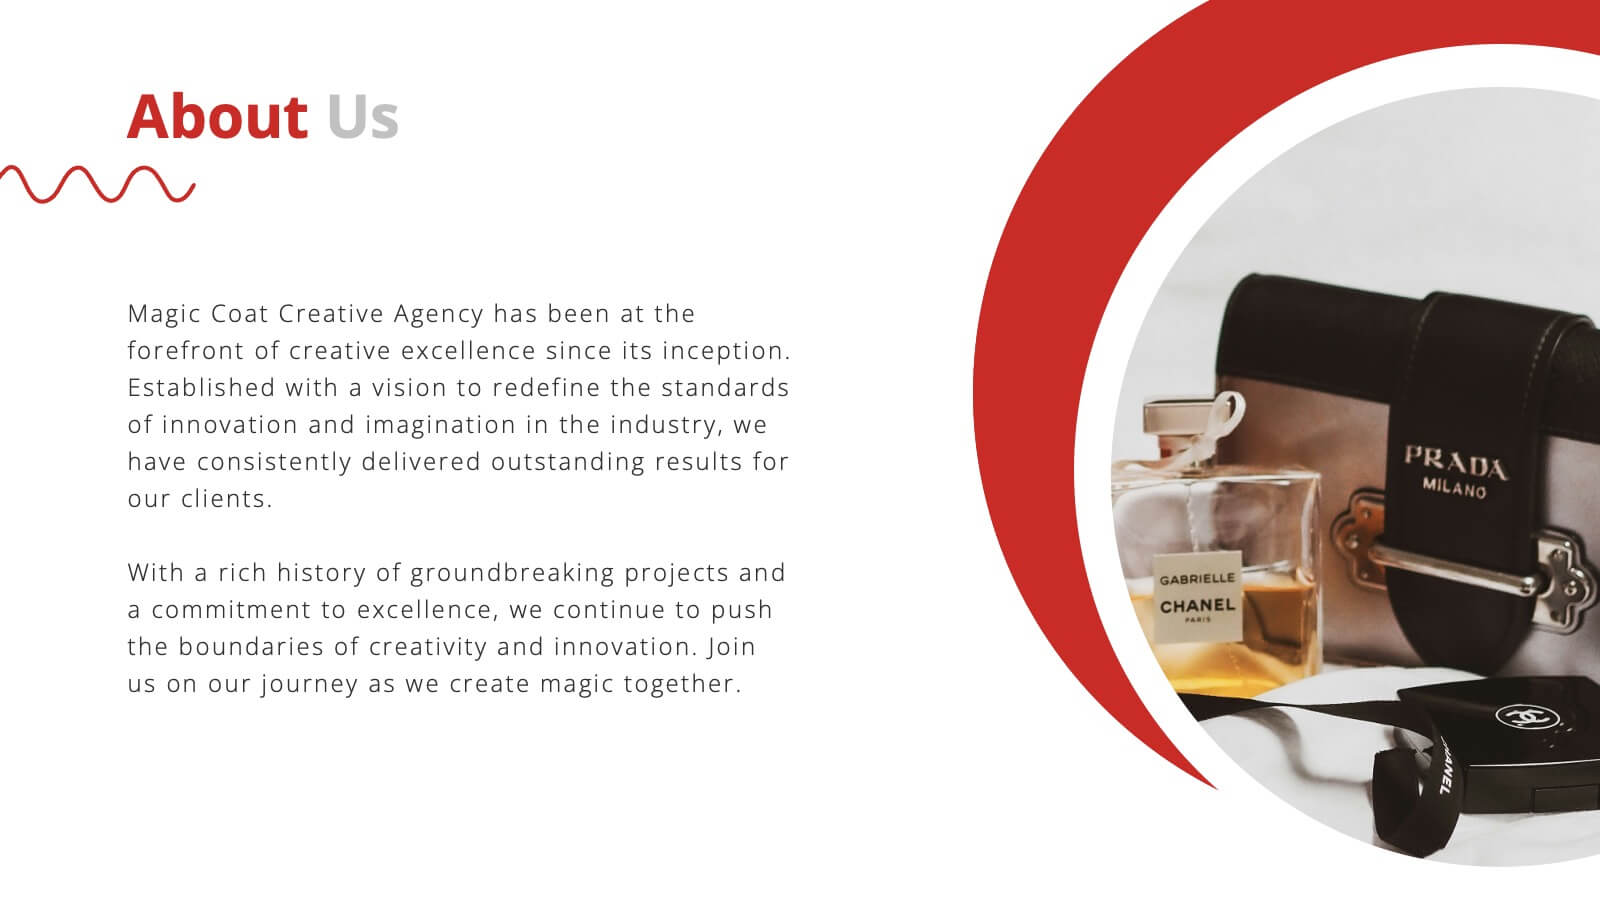
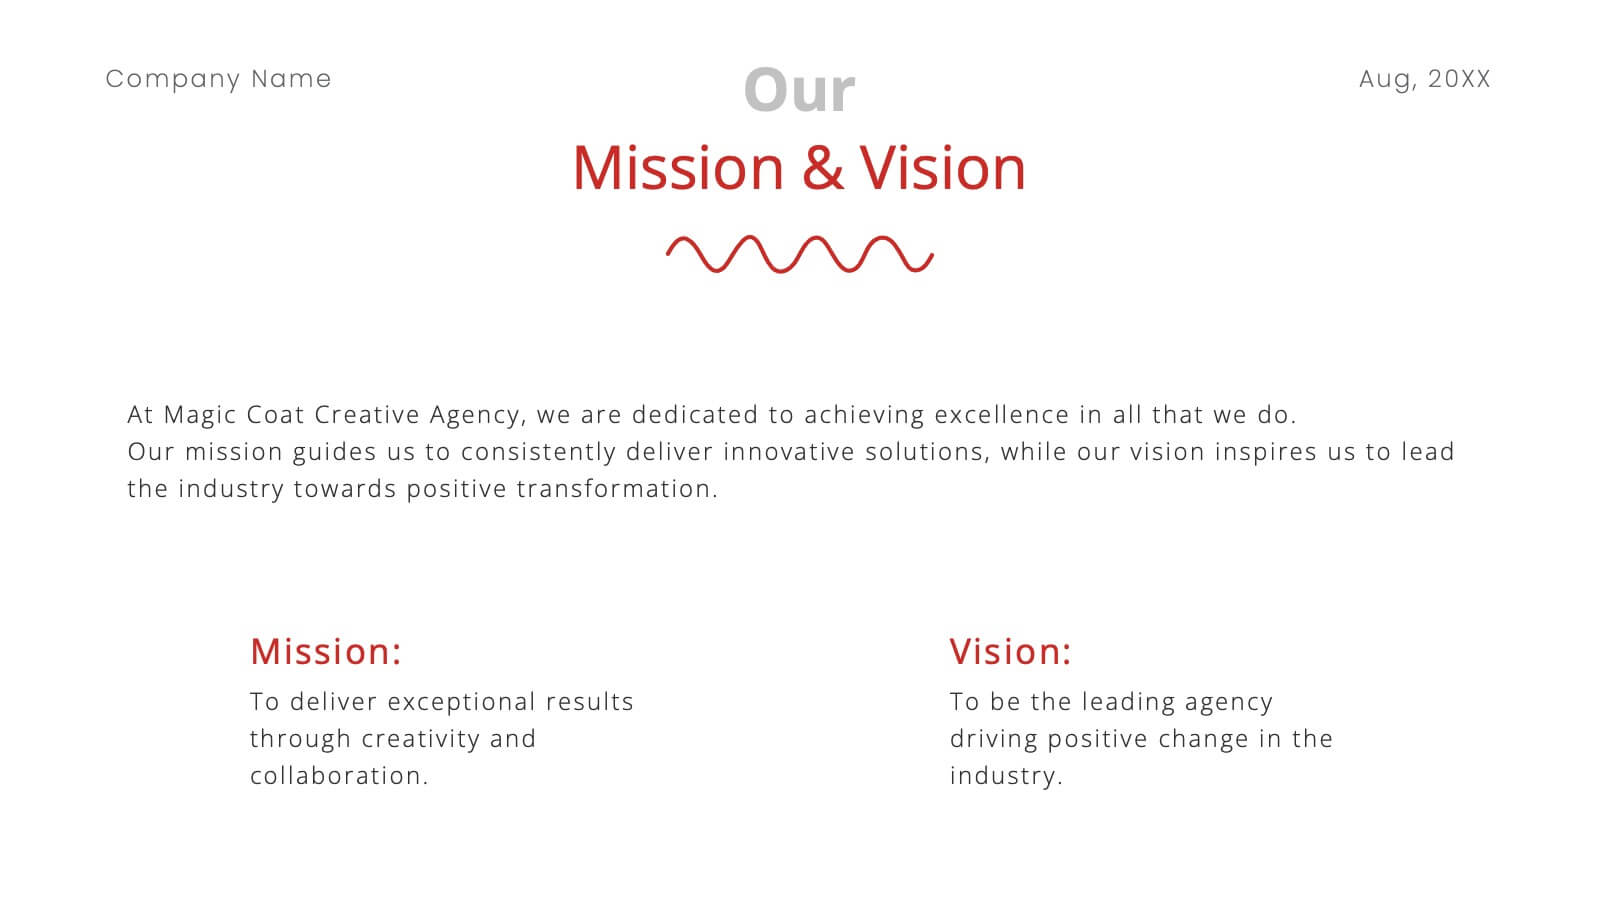
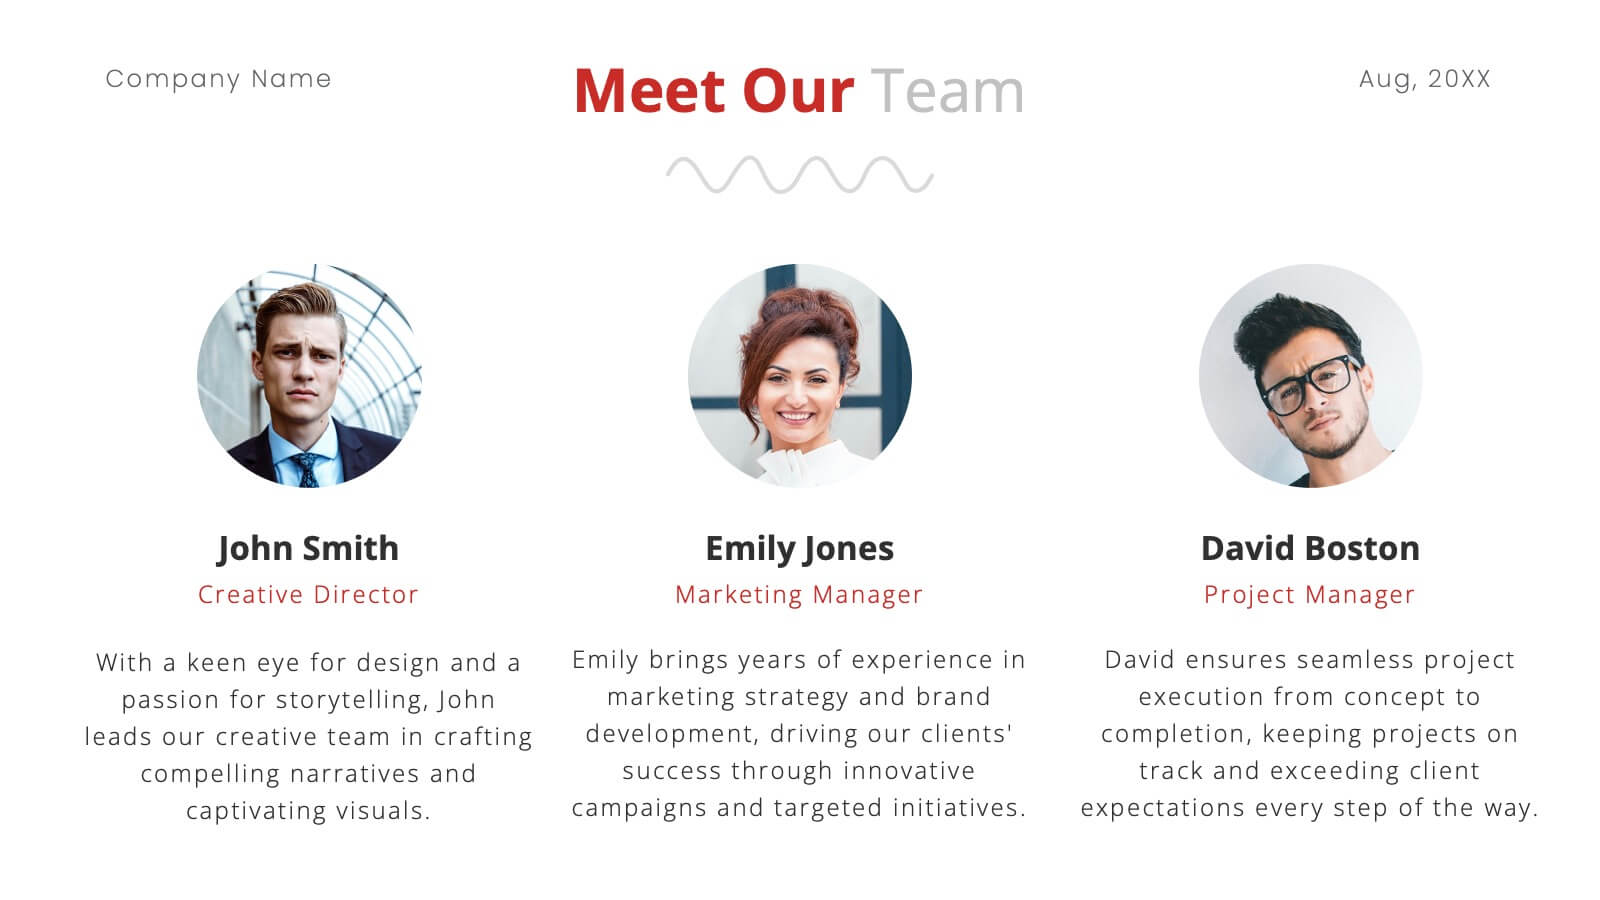
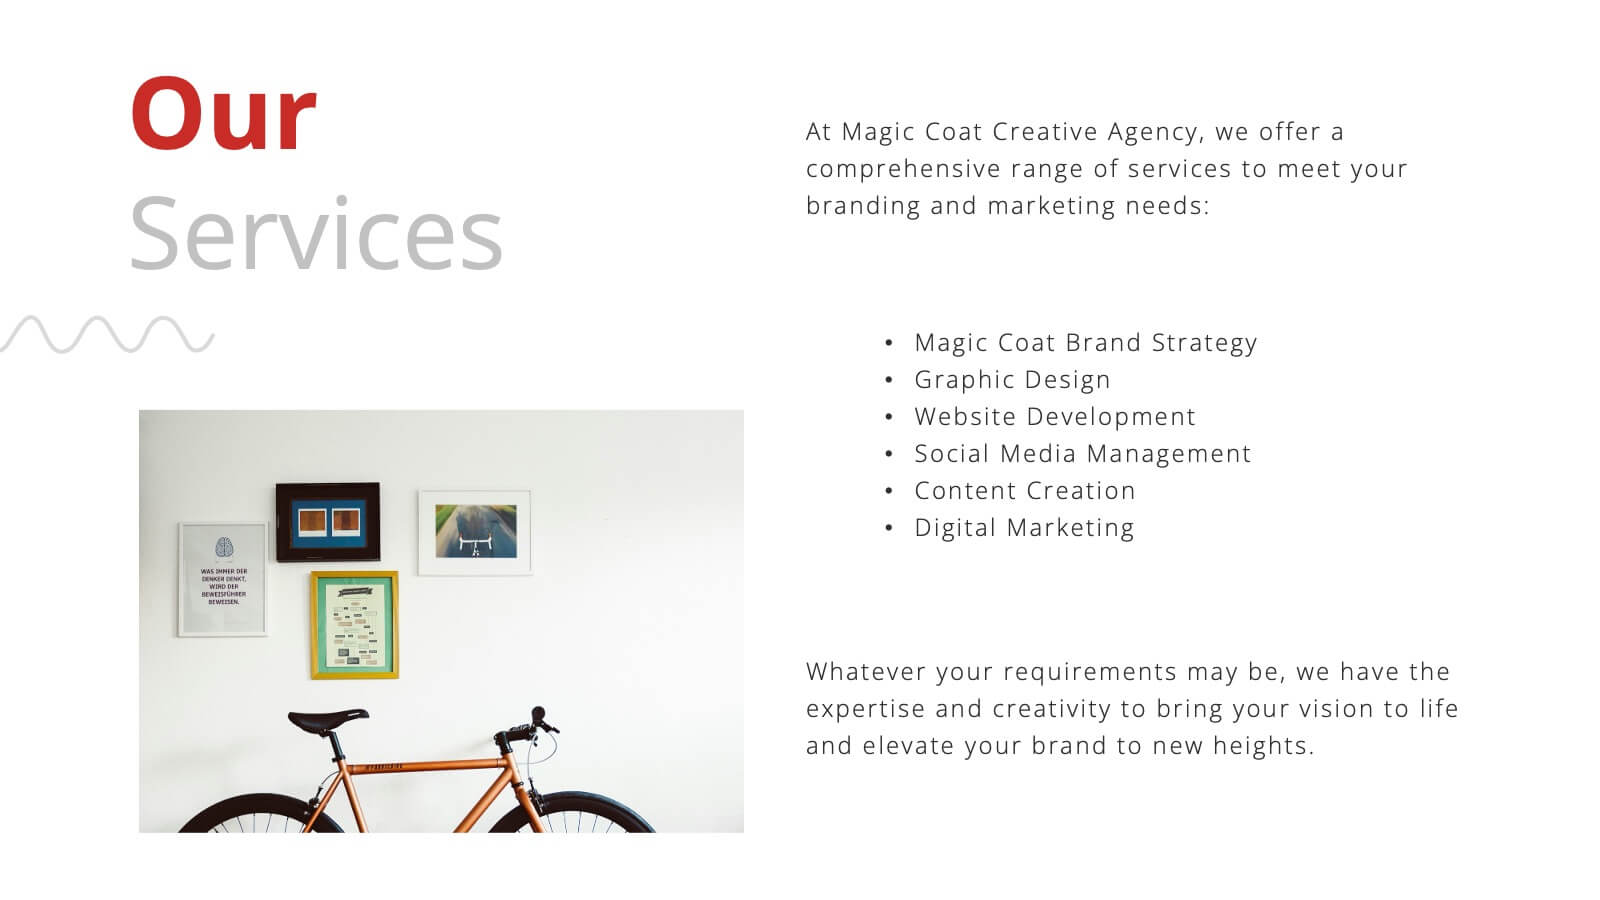
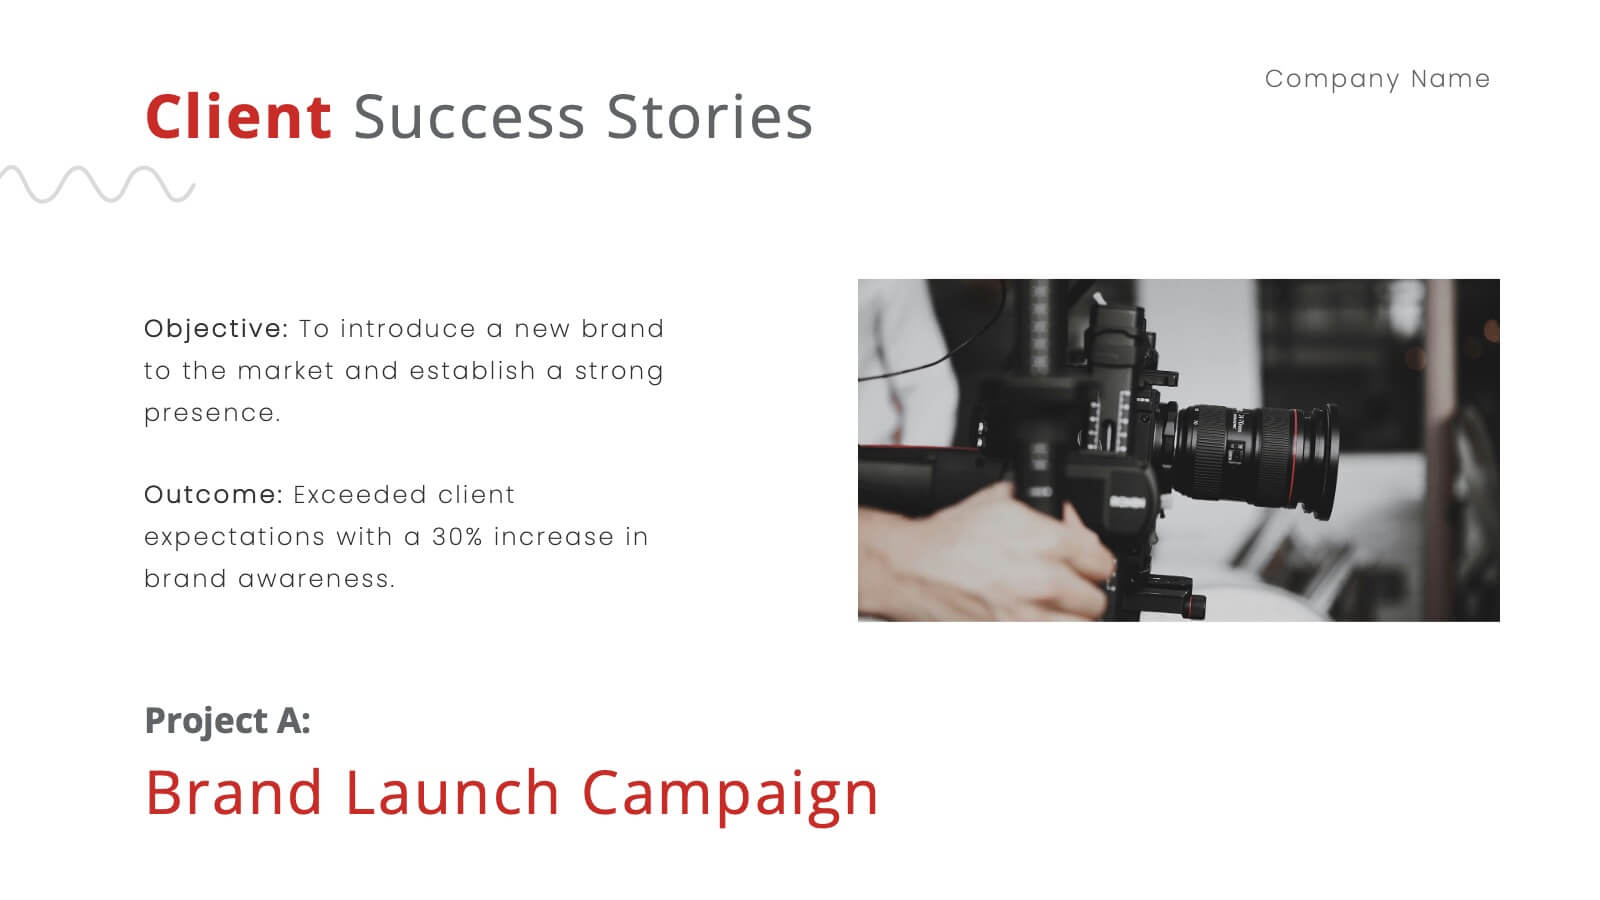
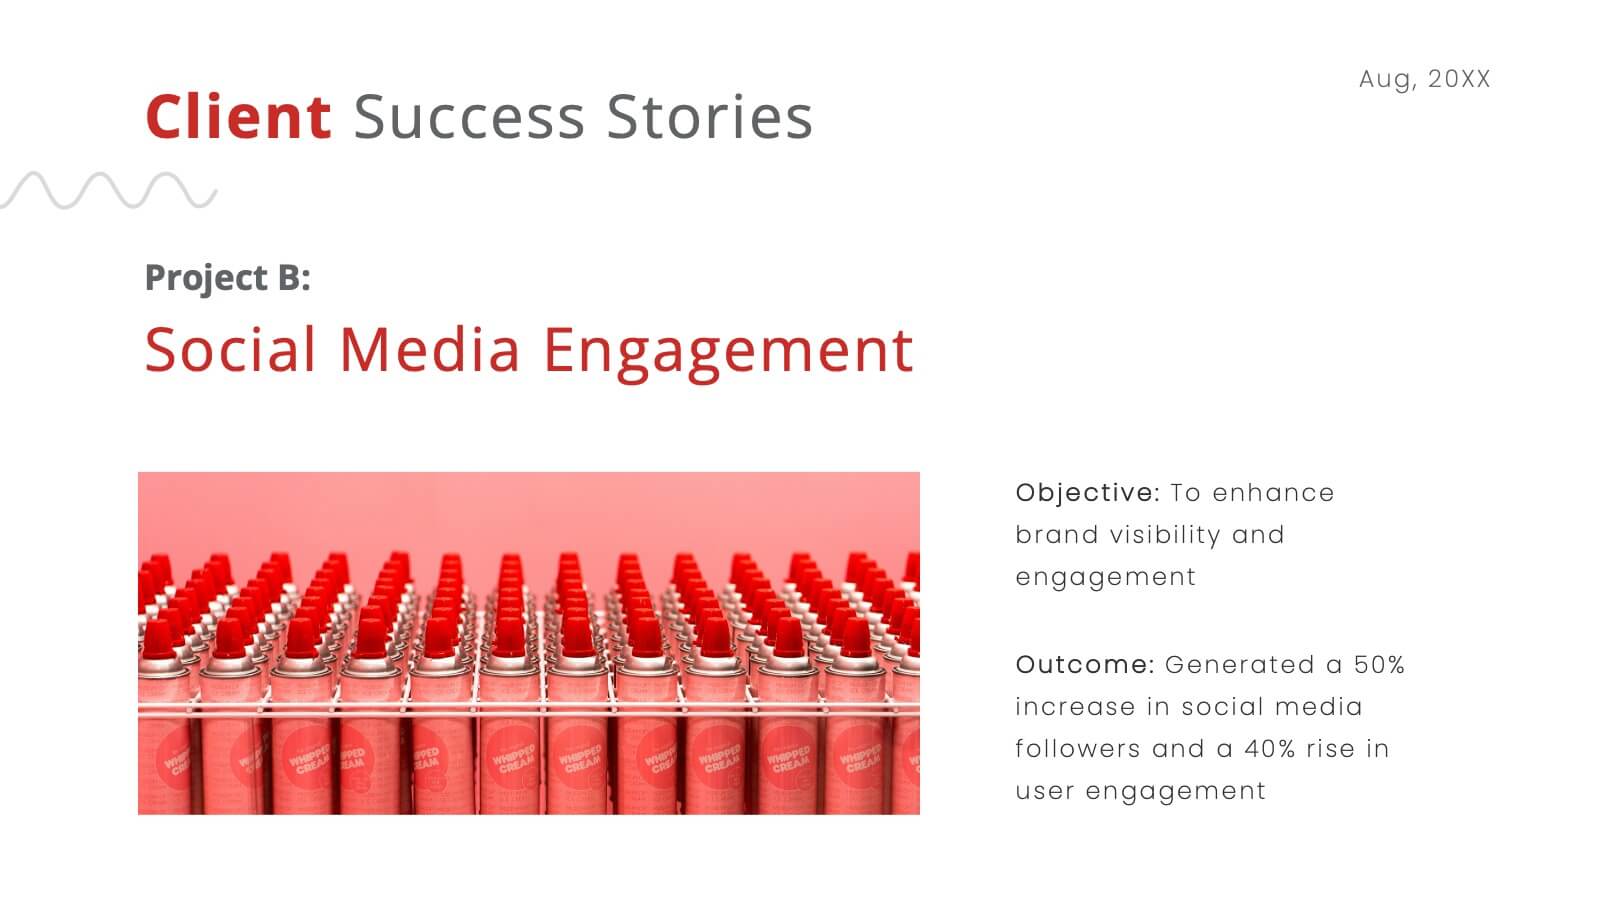
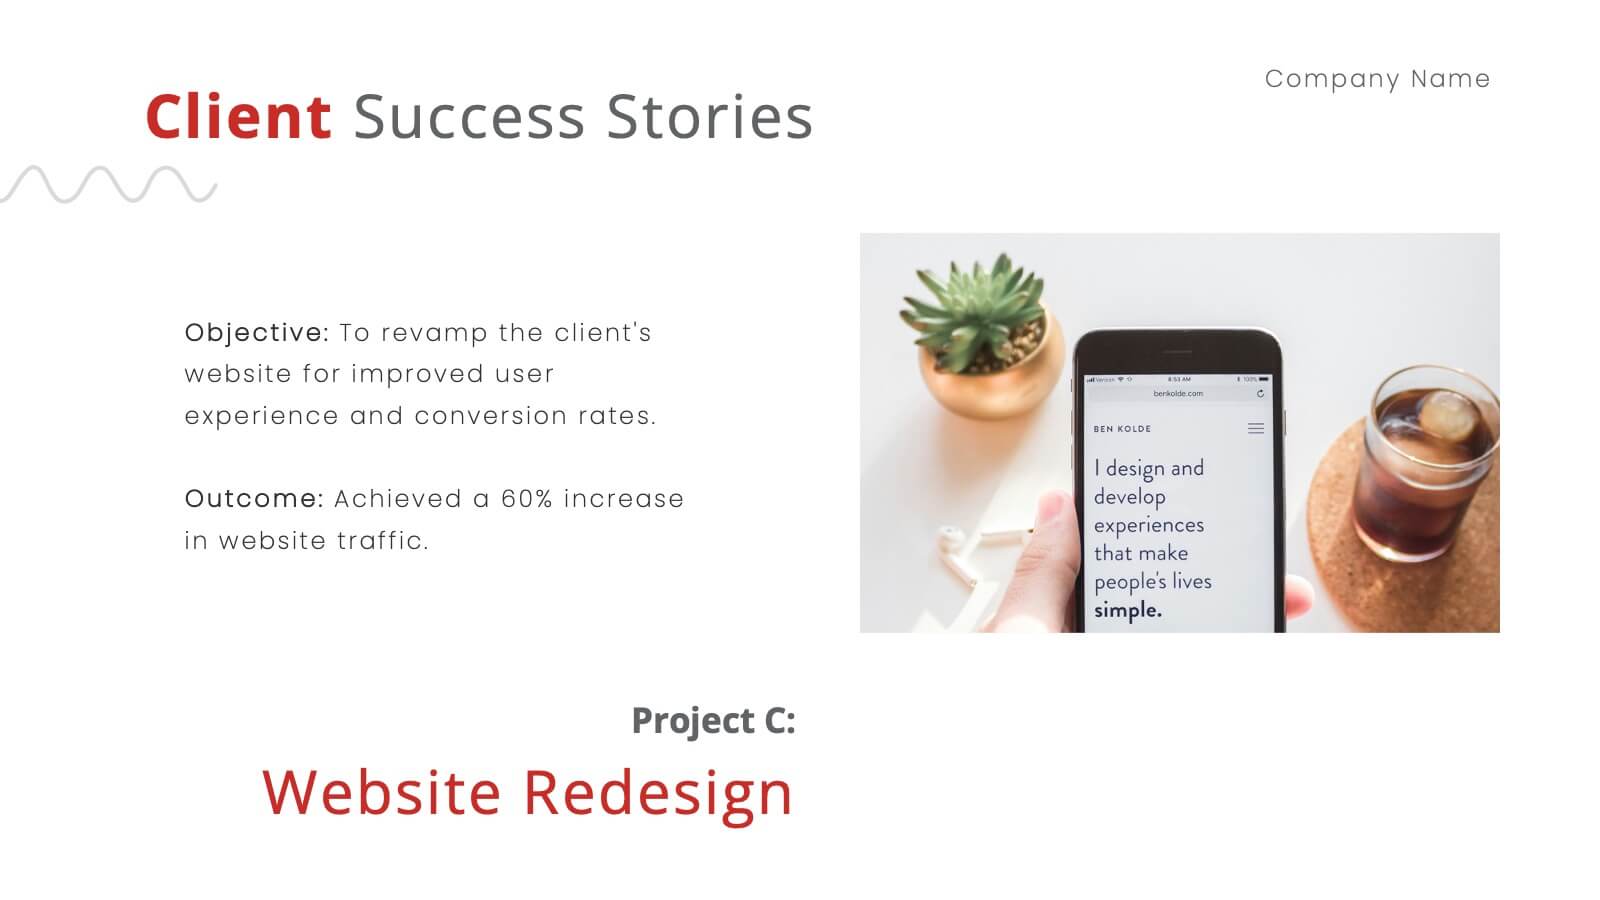
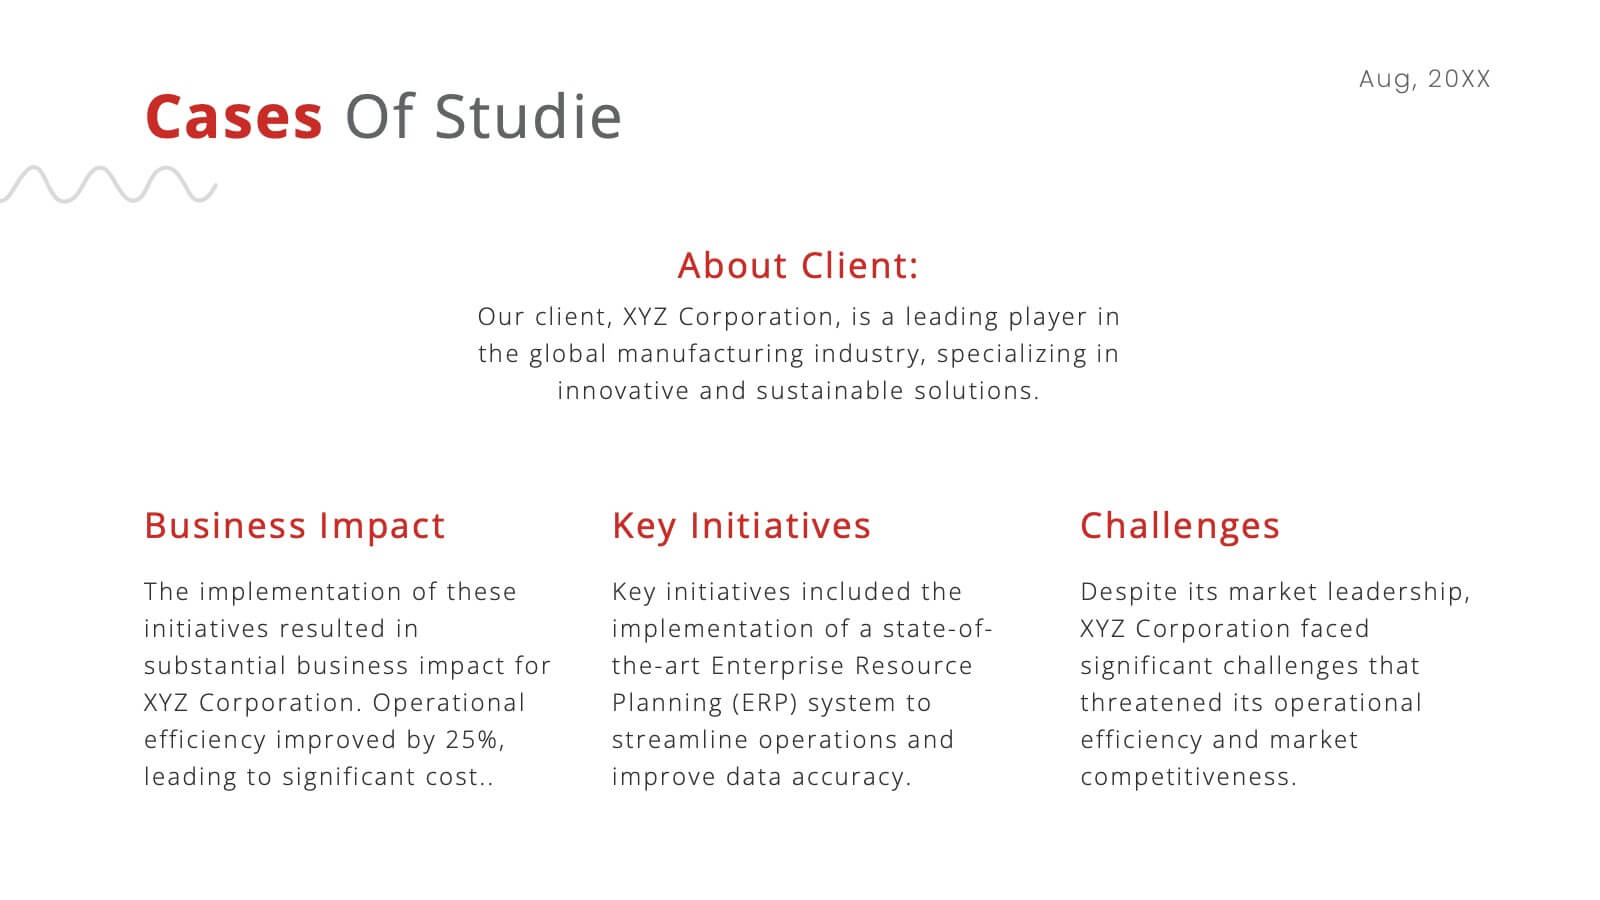
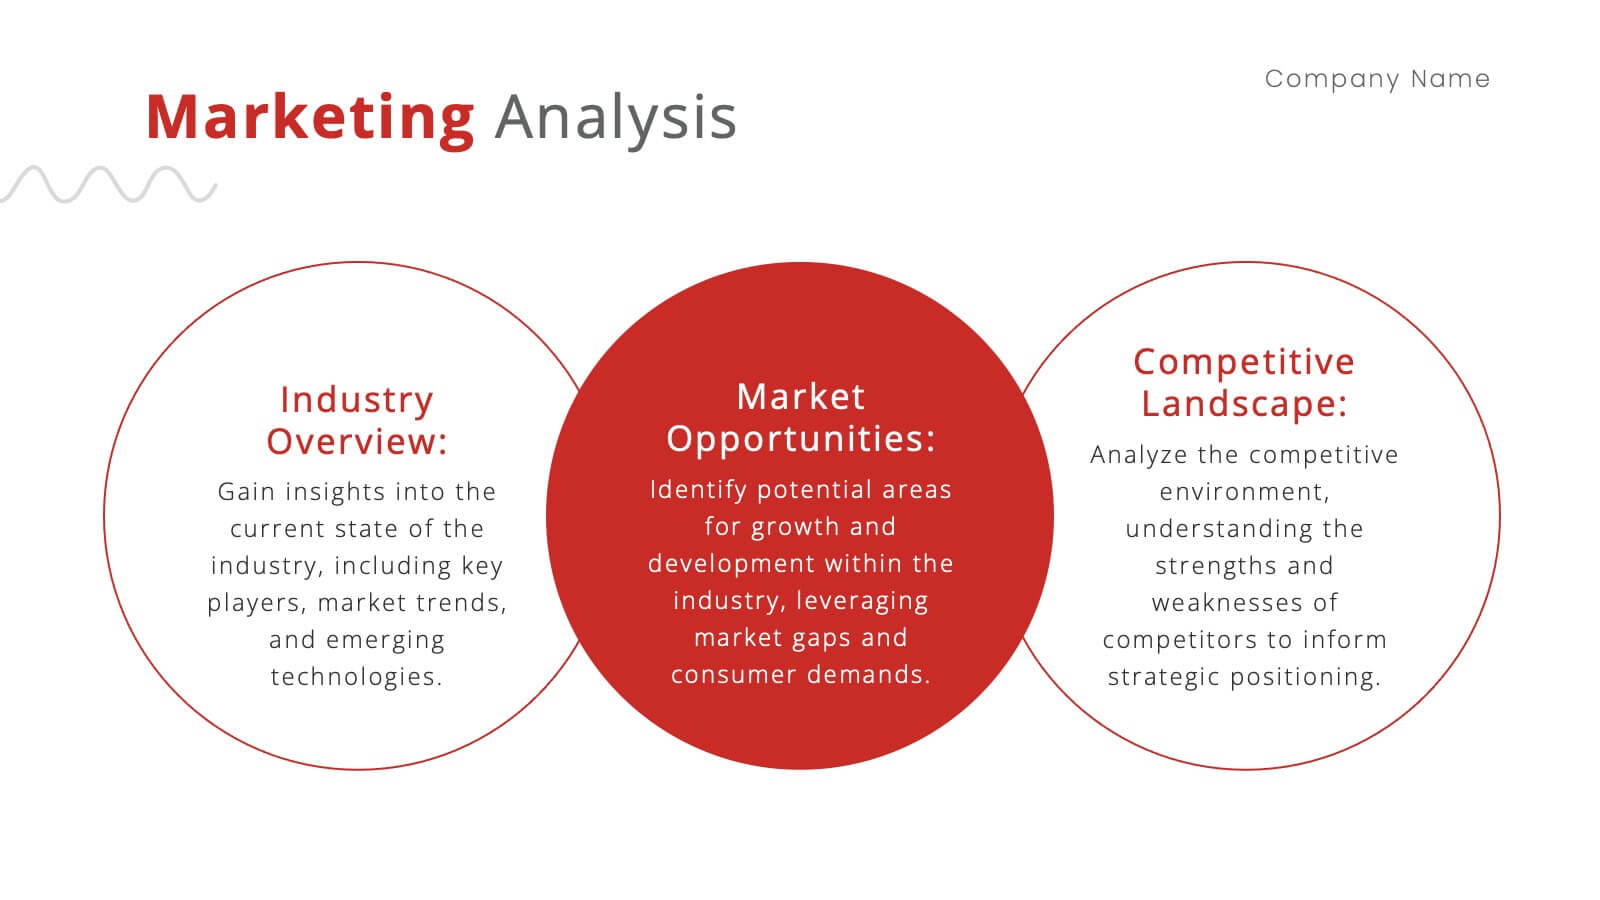
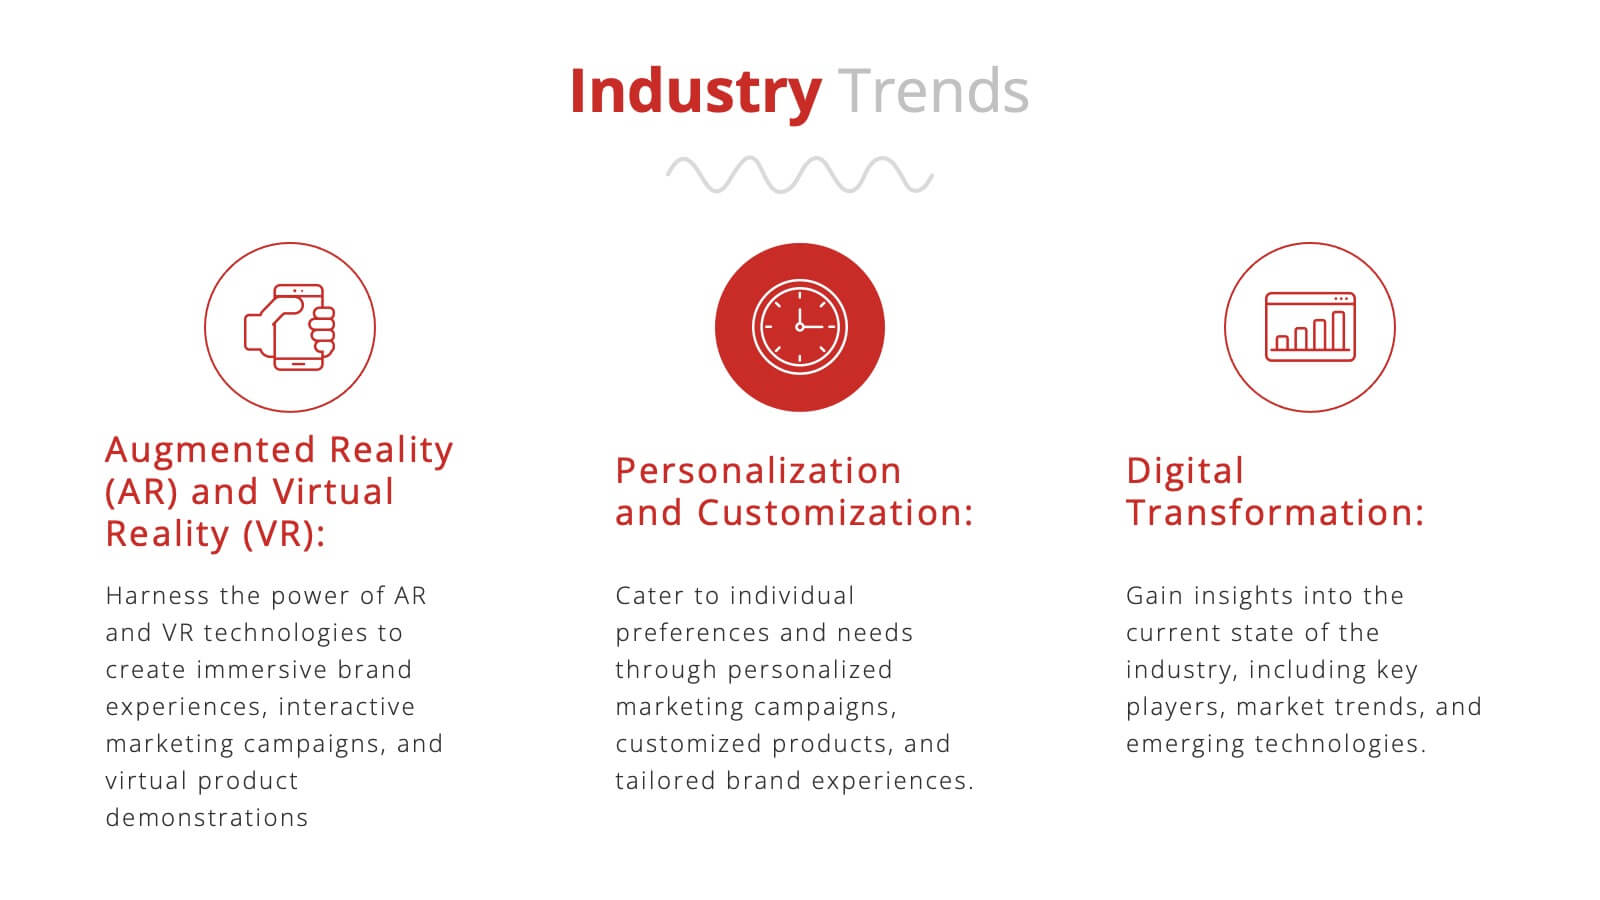
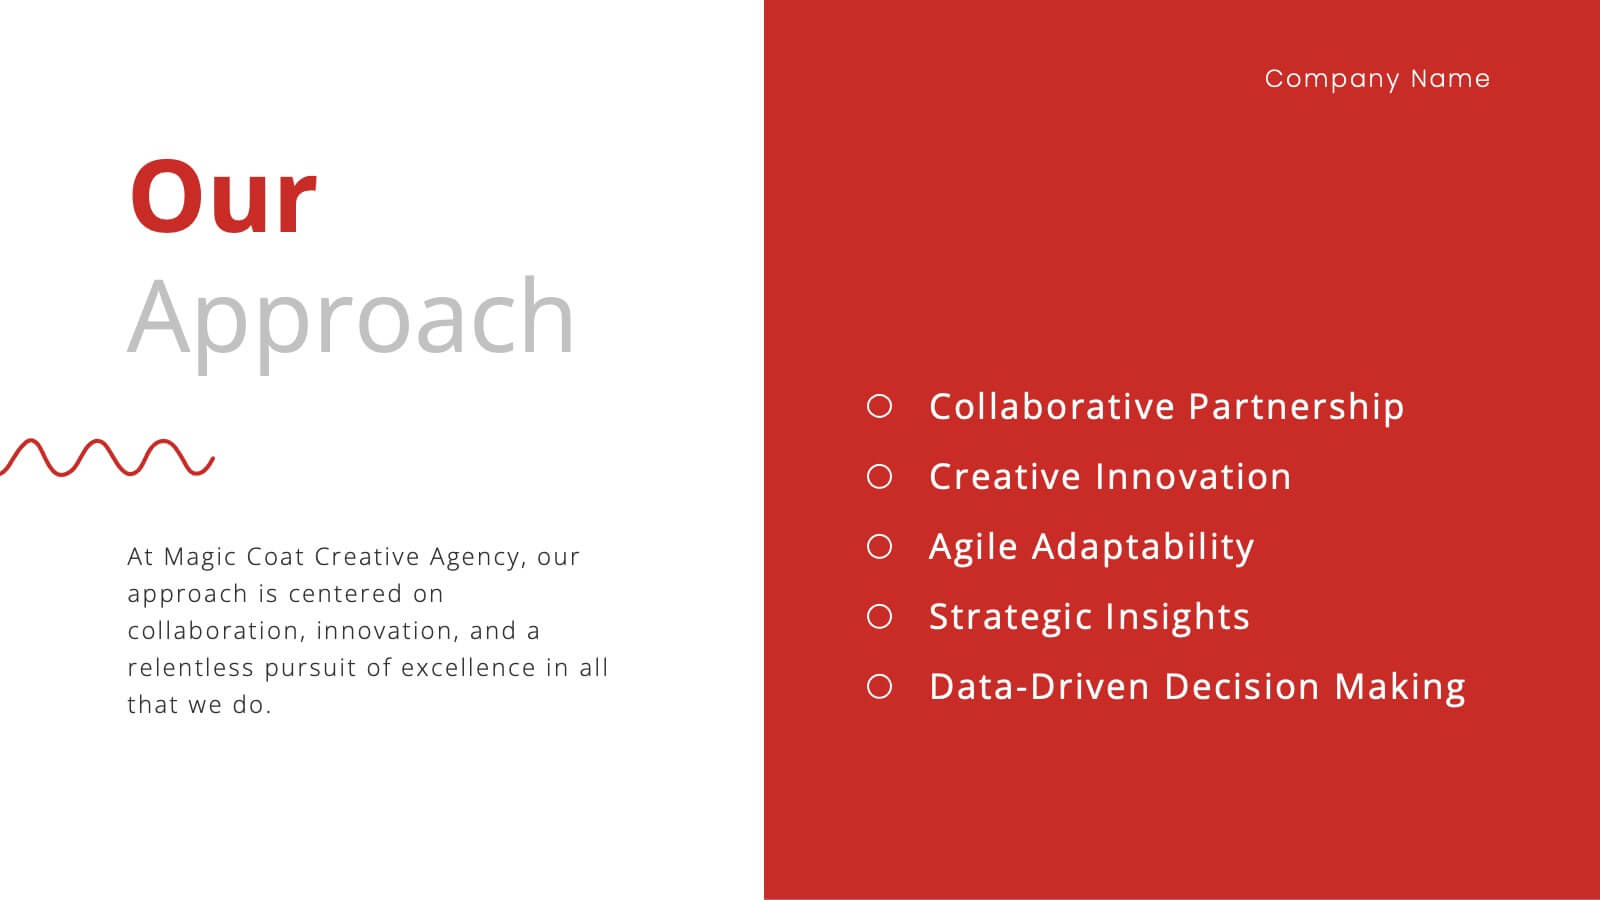
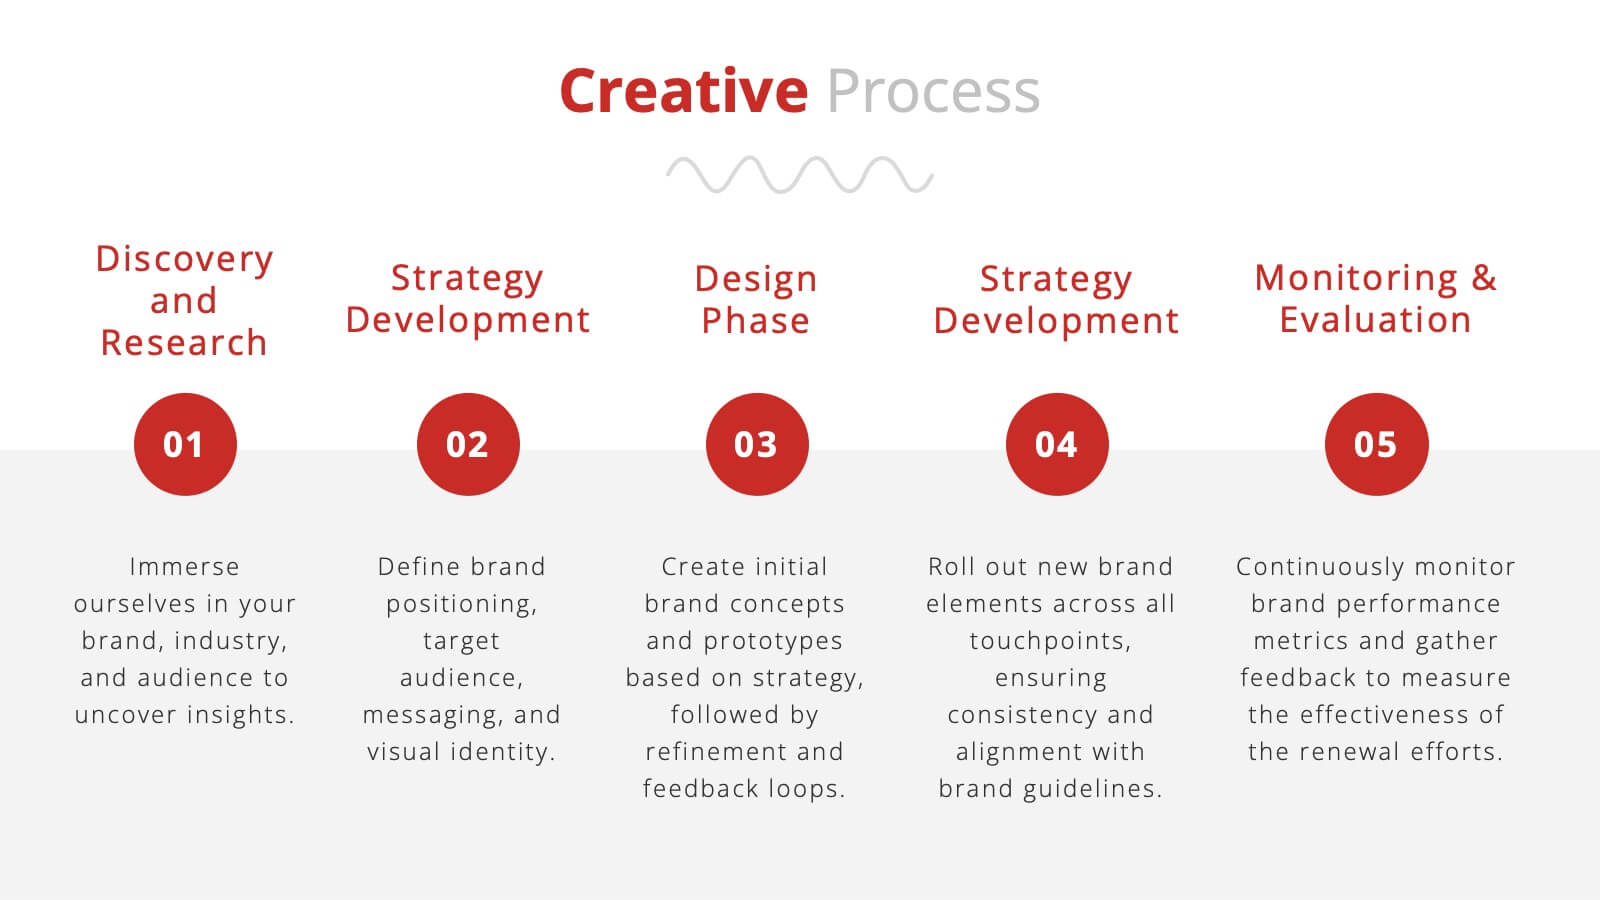
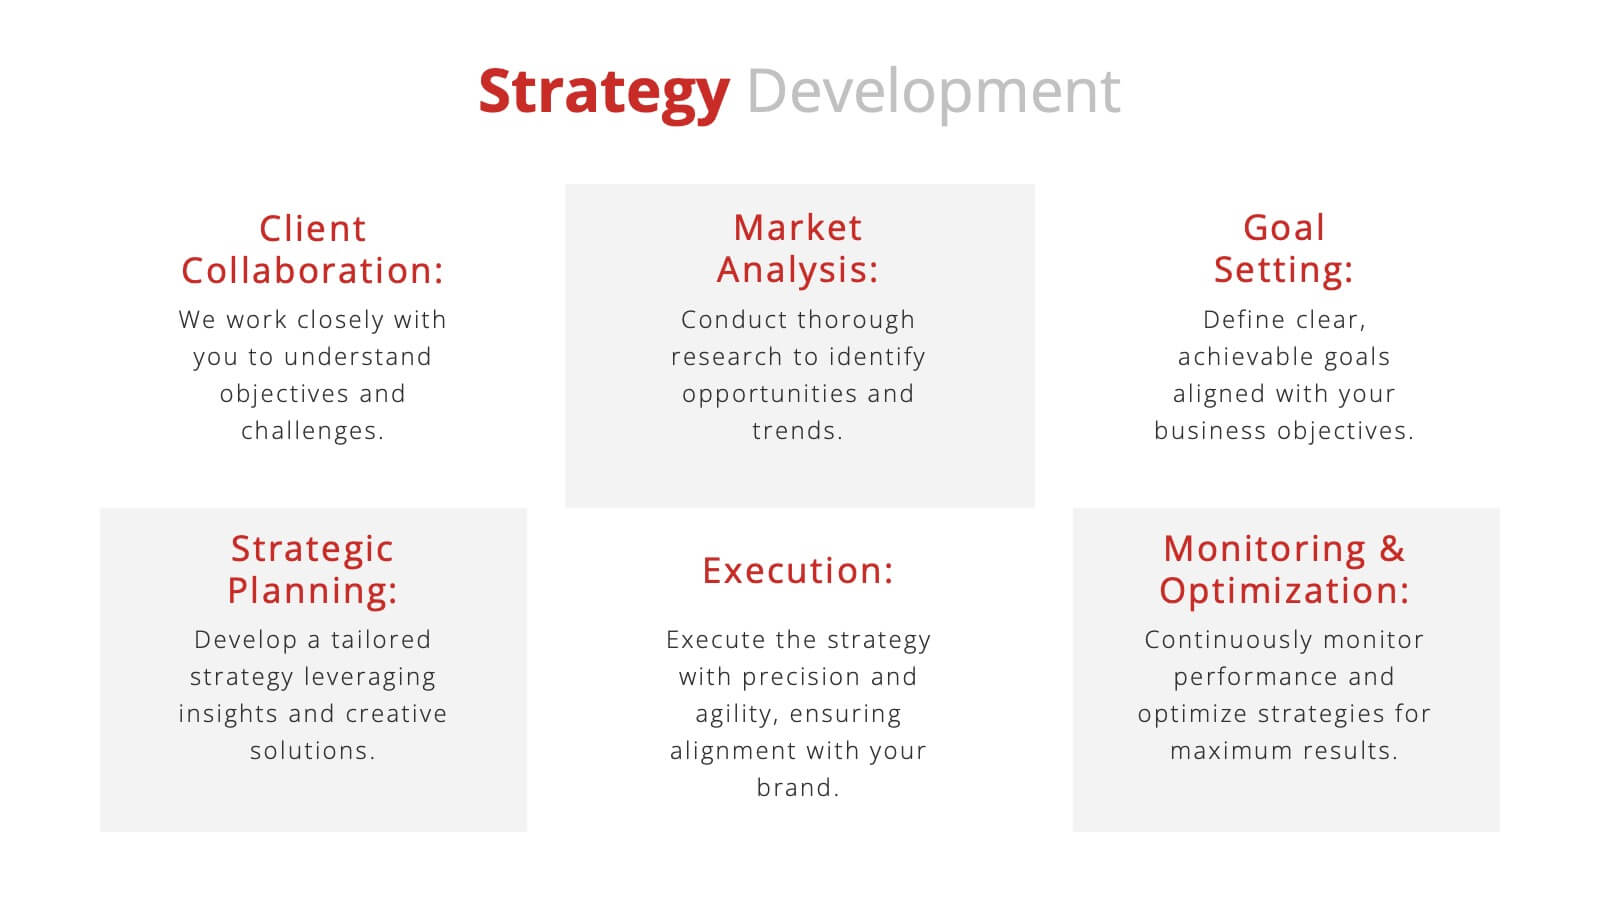
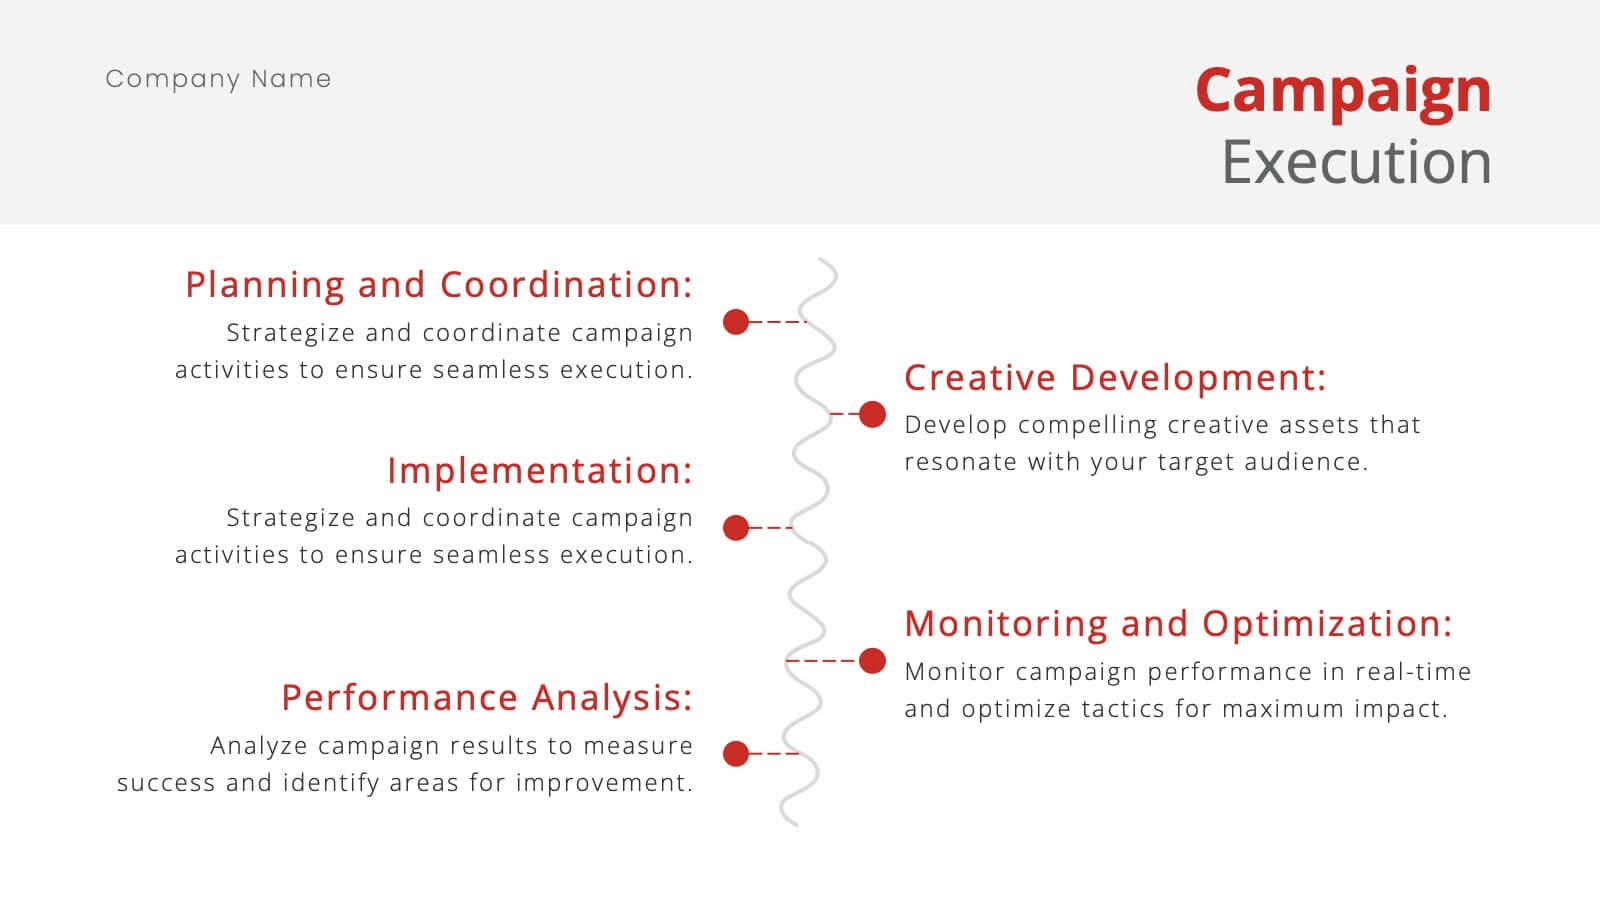
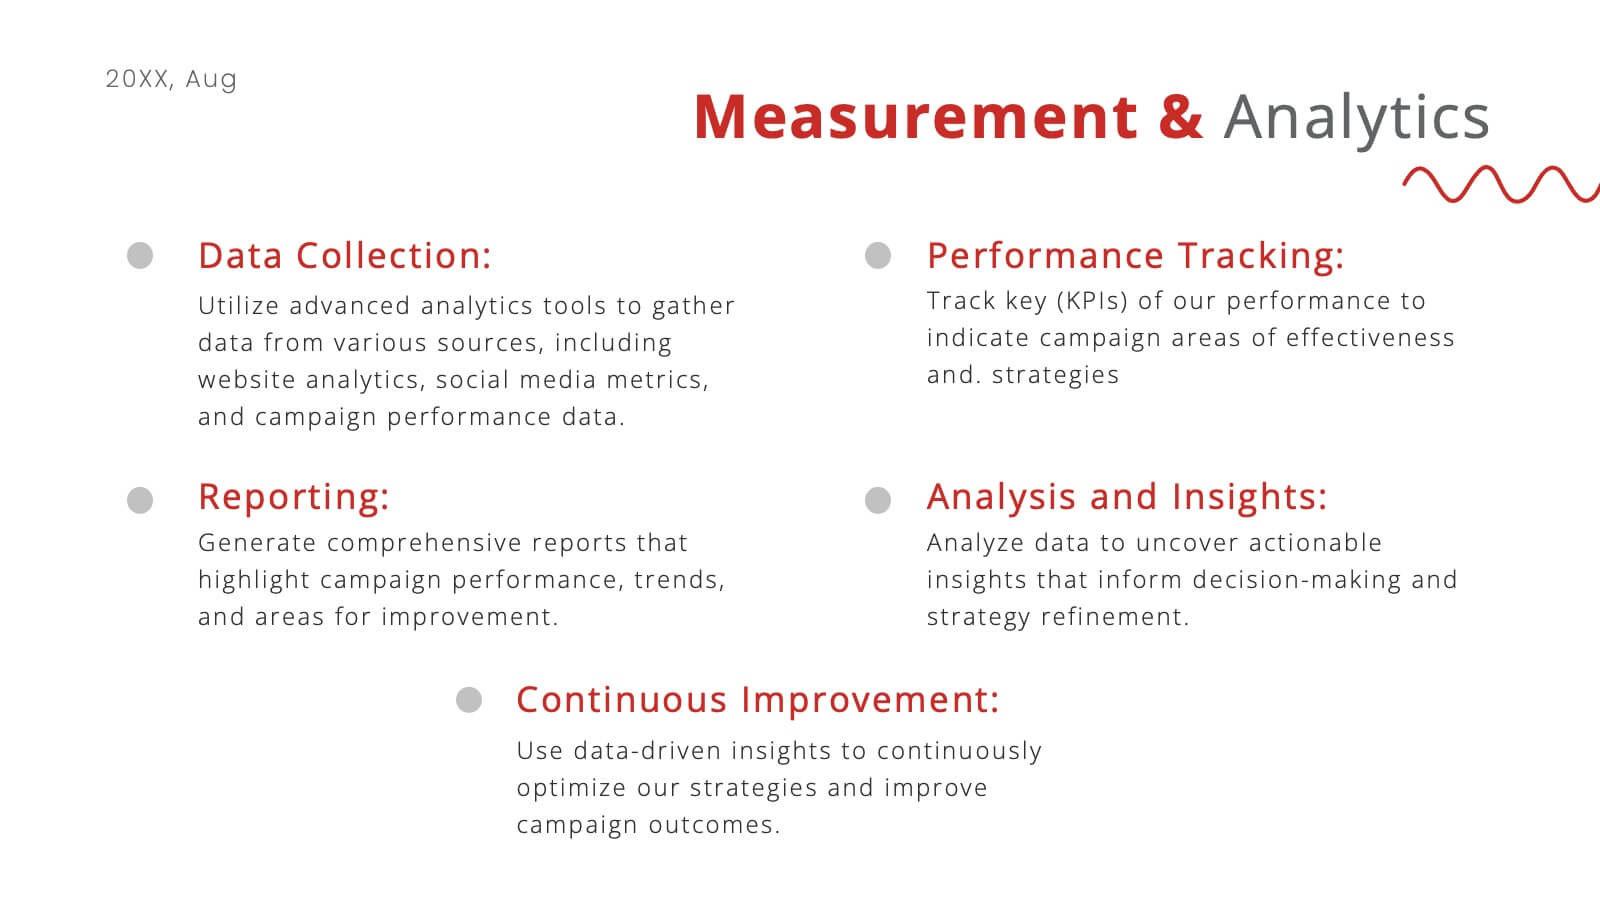
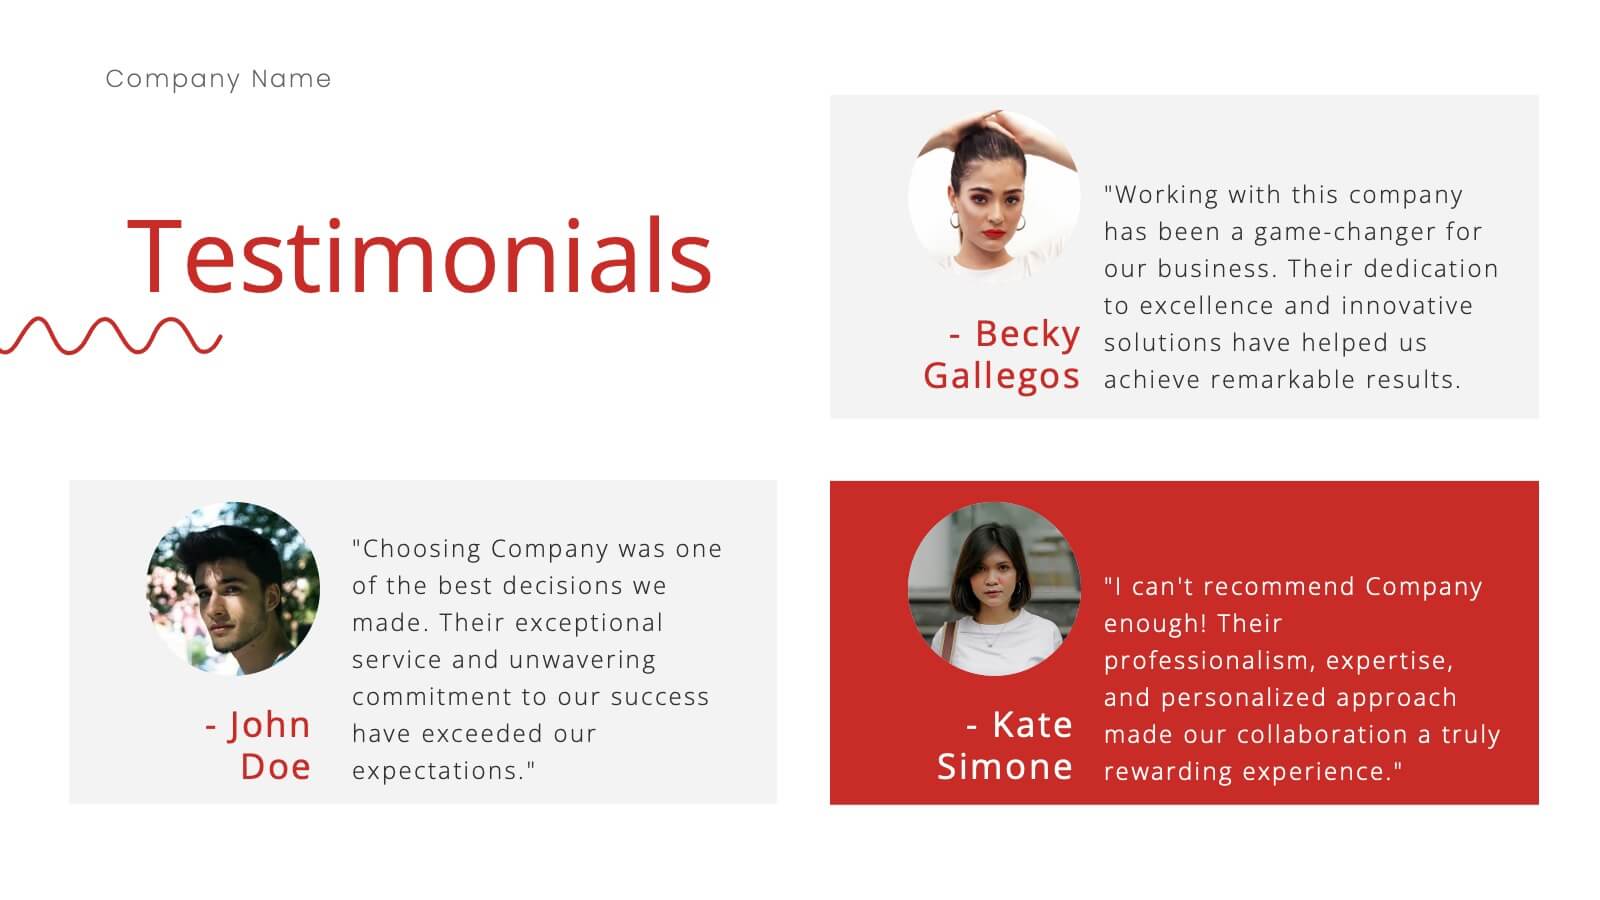
Metaphor Advertising Agency Proposal Presentation
The Advertising Agency Proposal Presentation Template offers a polished structure to present your agency's expertise. With slides covering mission, case studies, services, and market analysis, it’s designed to leave a lasting impression. Perfect for securing new clients, it’s fully editable and works seamlessly with PowerPoint, Keynote, and Google Slides.


4 slides
Illustrated Office Environment Templates Presentation
Bring your data to life with a fun, illustrated spin! This presentation template uses vibrant office-themed visuals to explain workplace stats, tasks, or organizational breakdowns with clarity. Perfect for showcasing team roles, resource allocation, or workflow insights. Fully compatible with PowerPoint, Keynote, and Google Slides for seamless customization.


22 slides
Mystic Startup Strategy Presentation
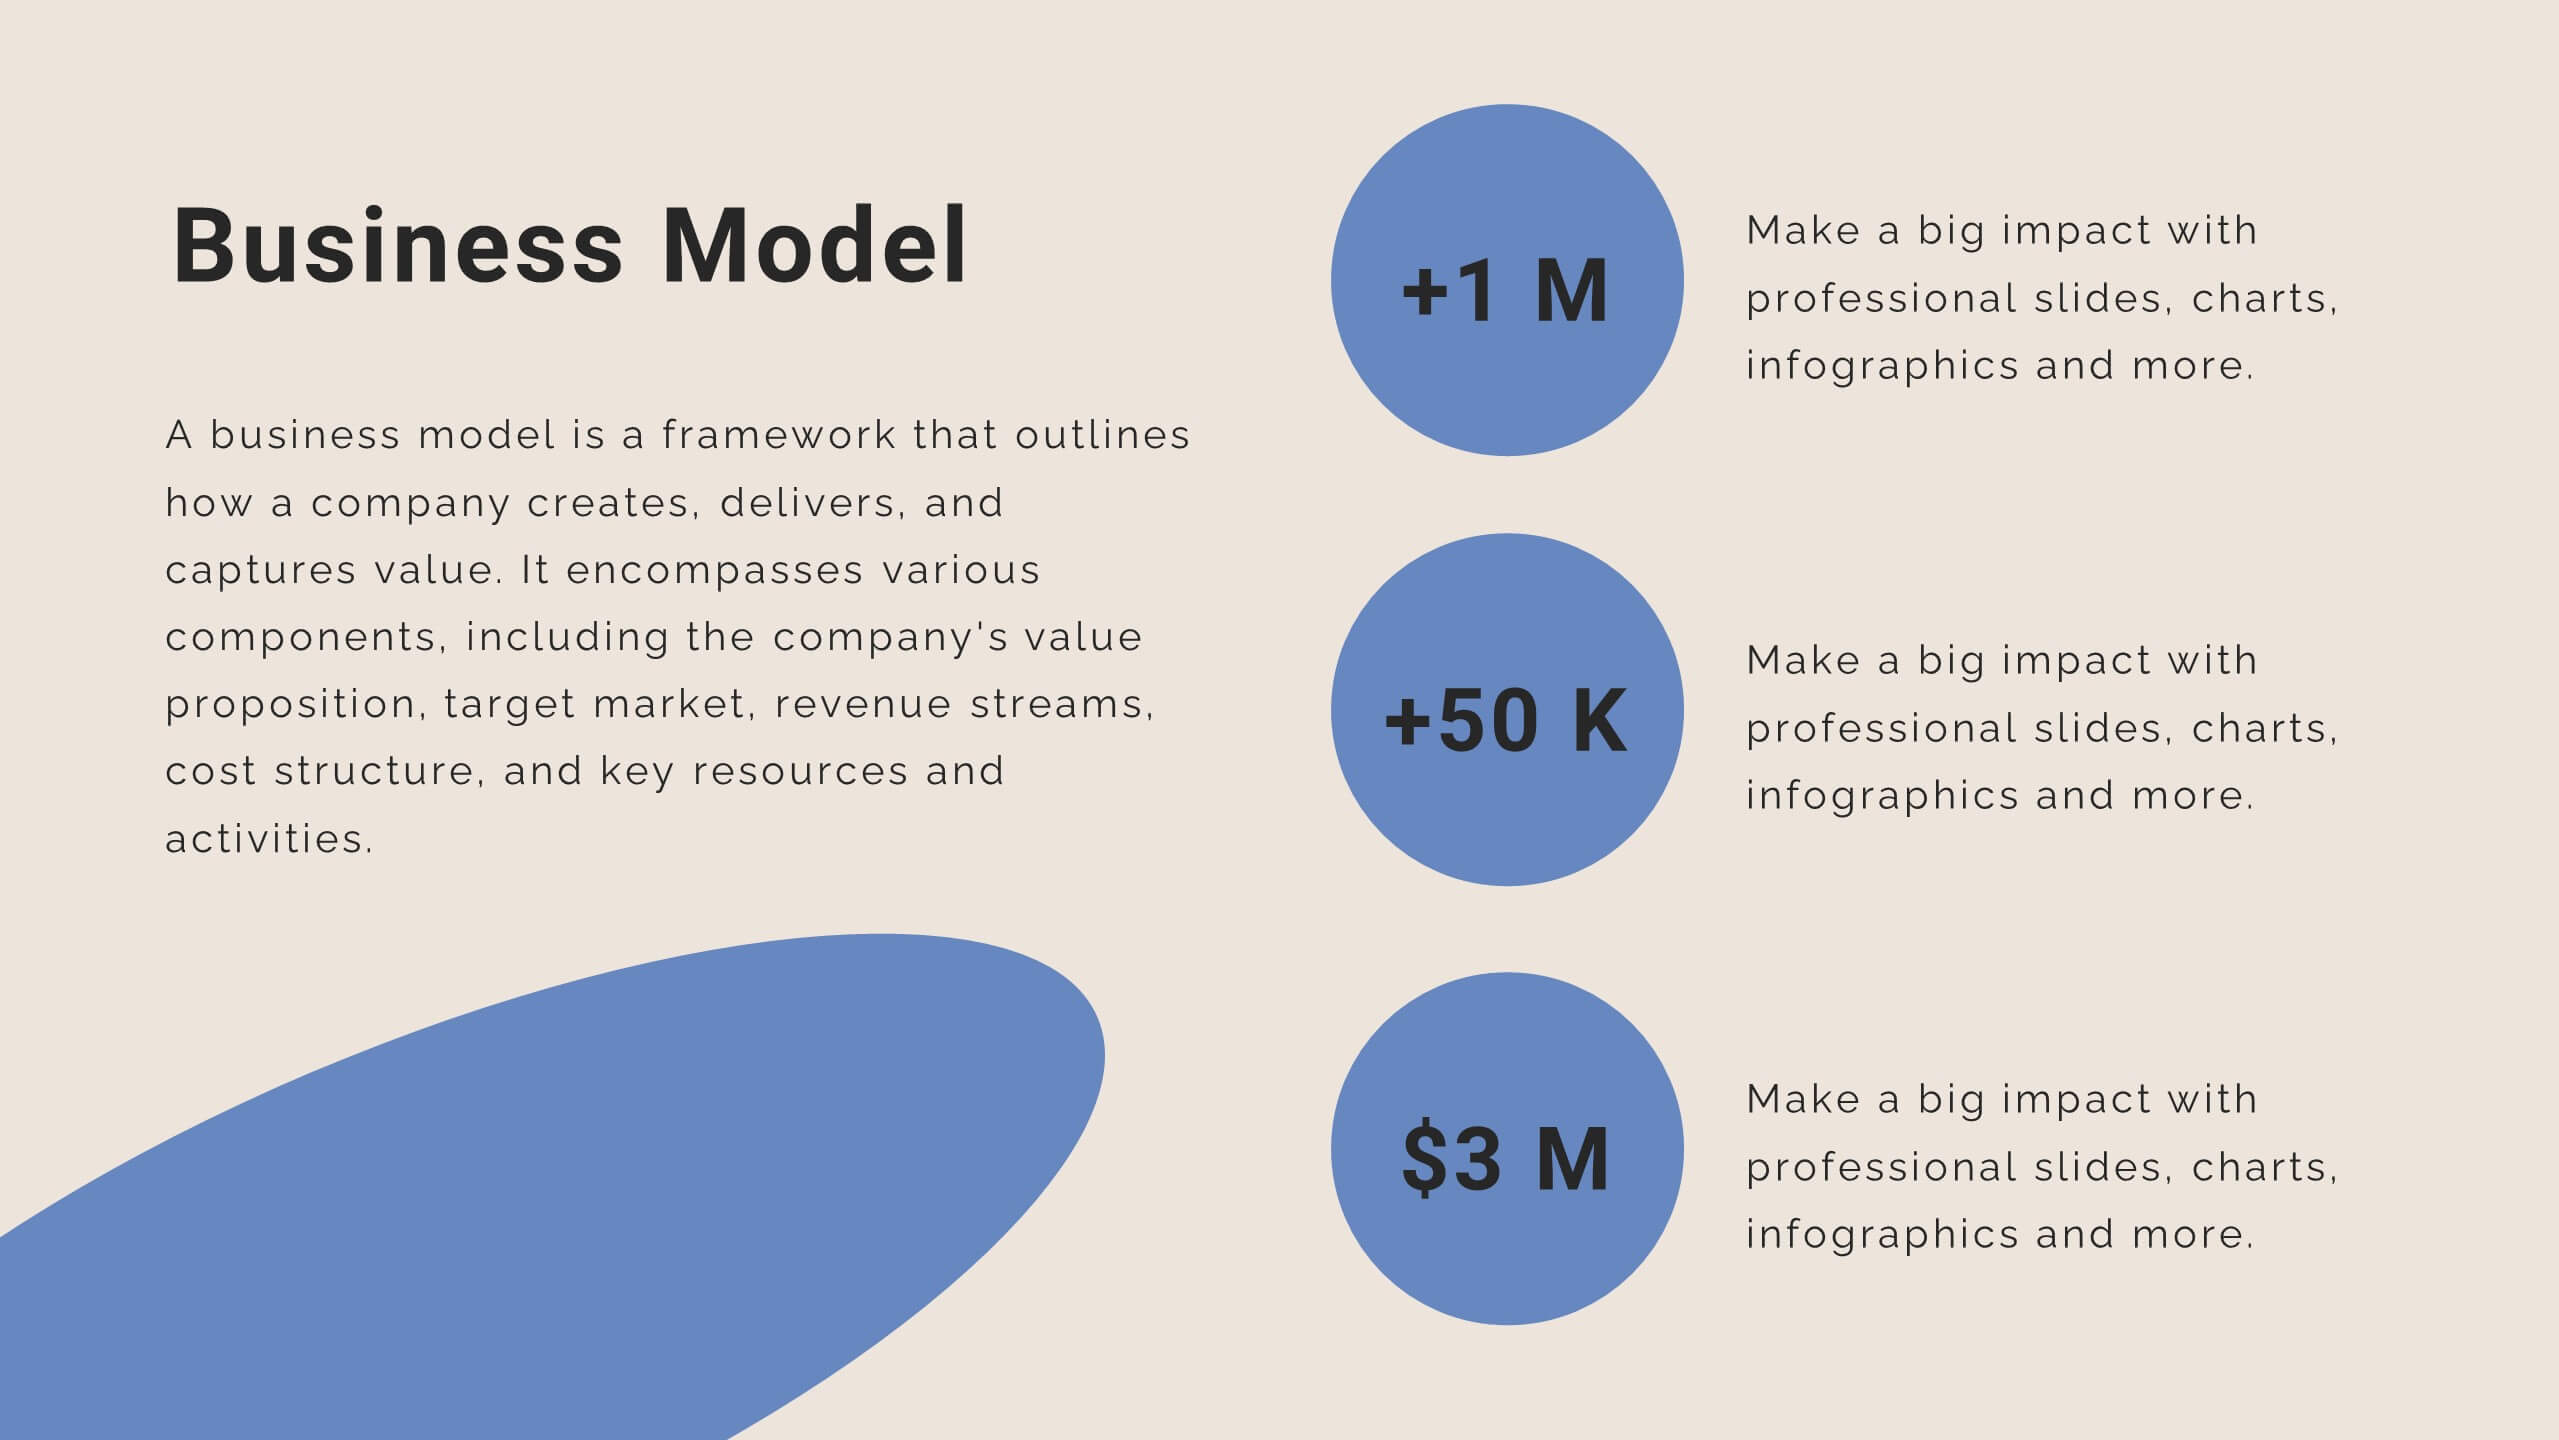
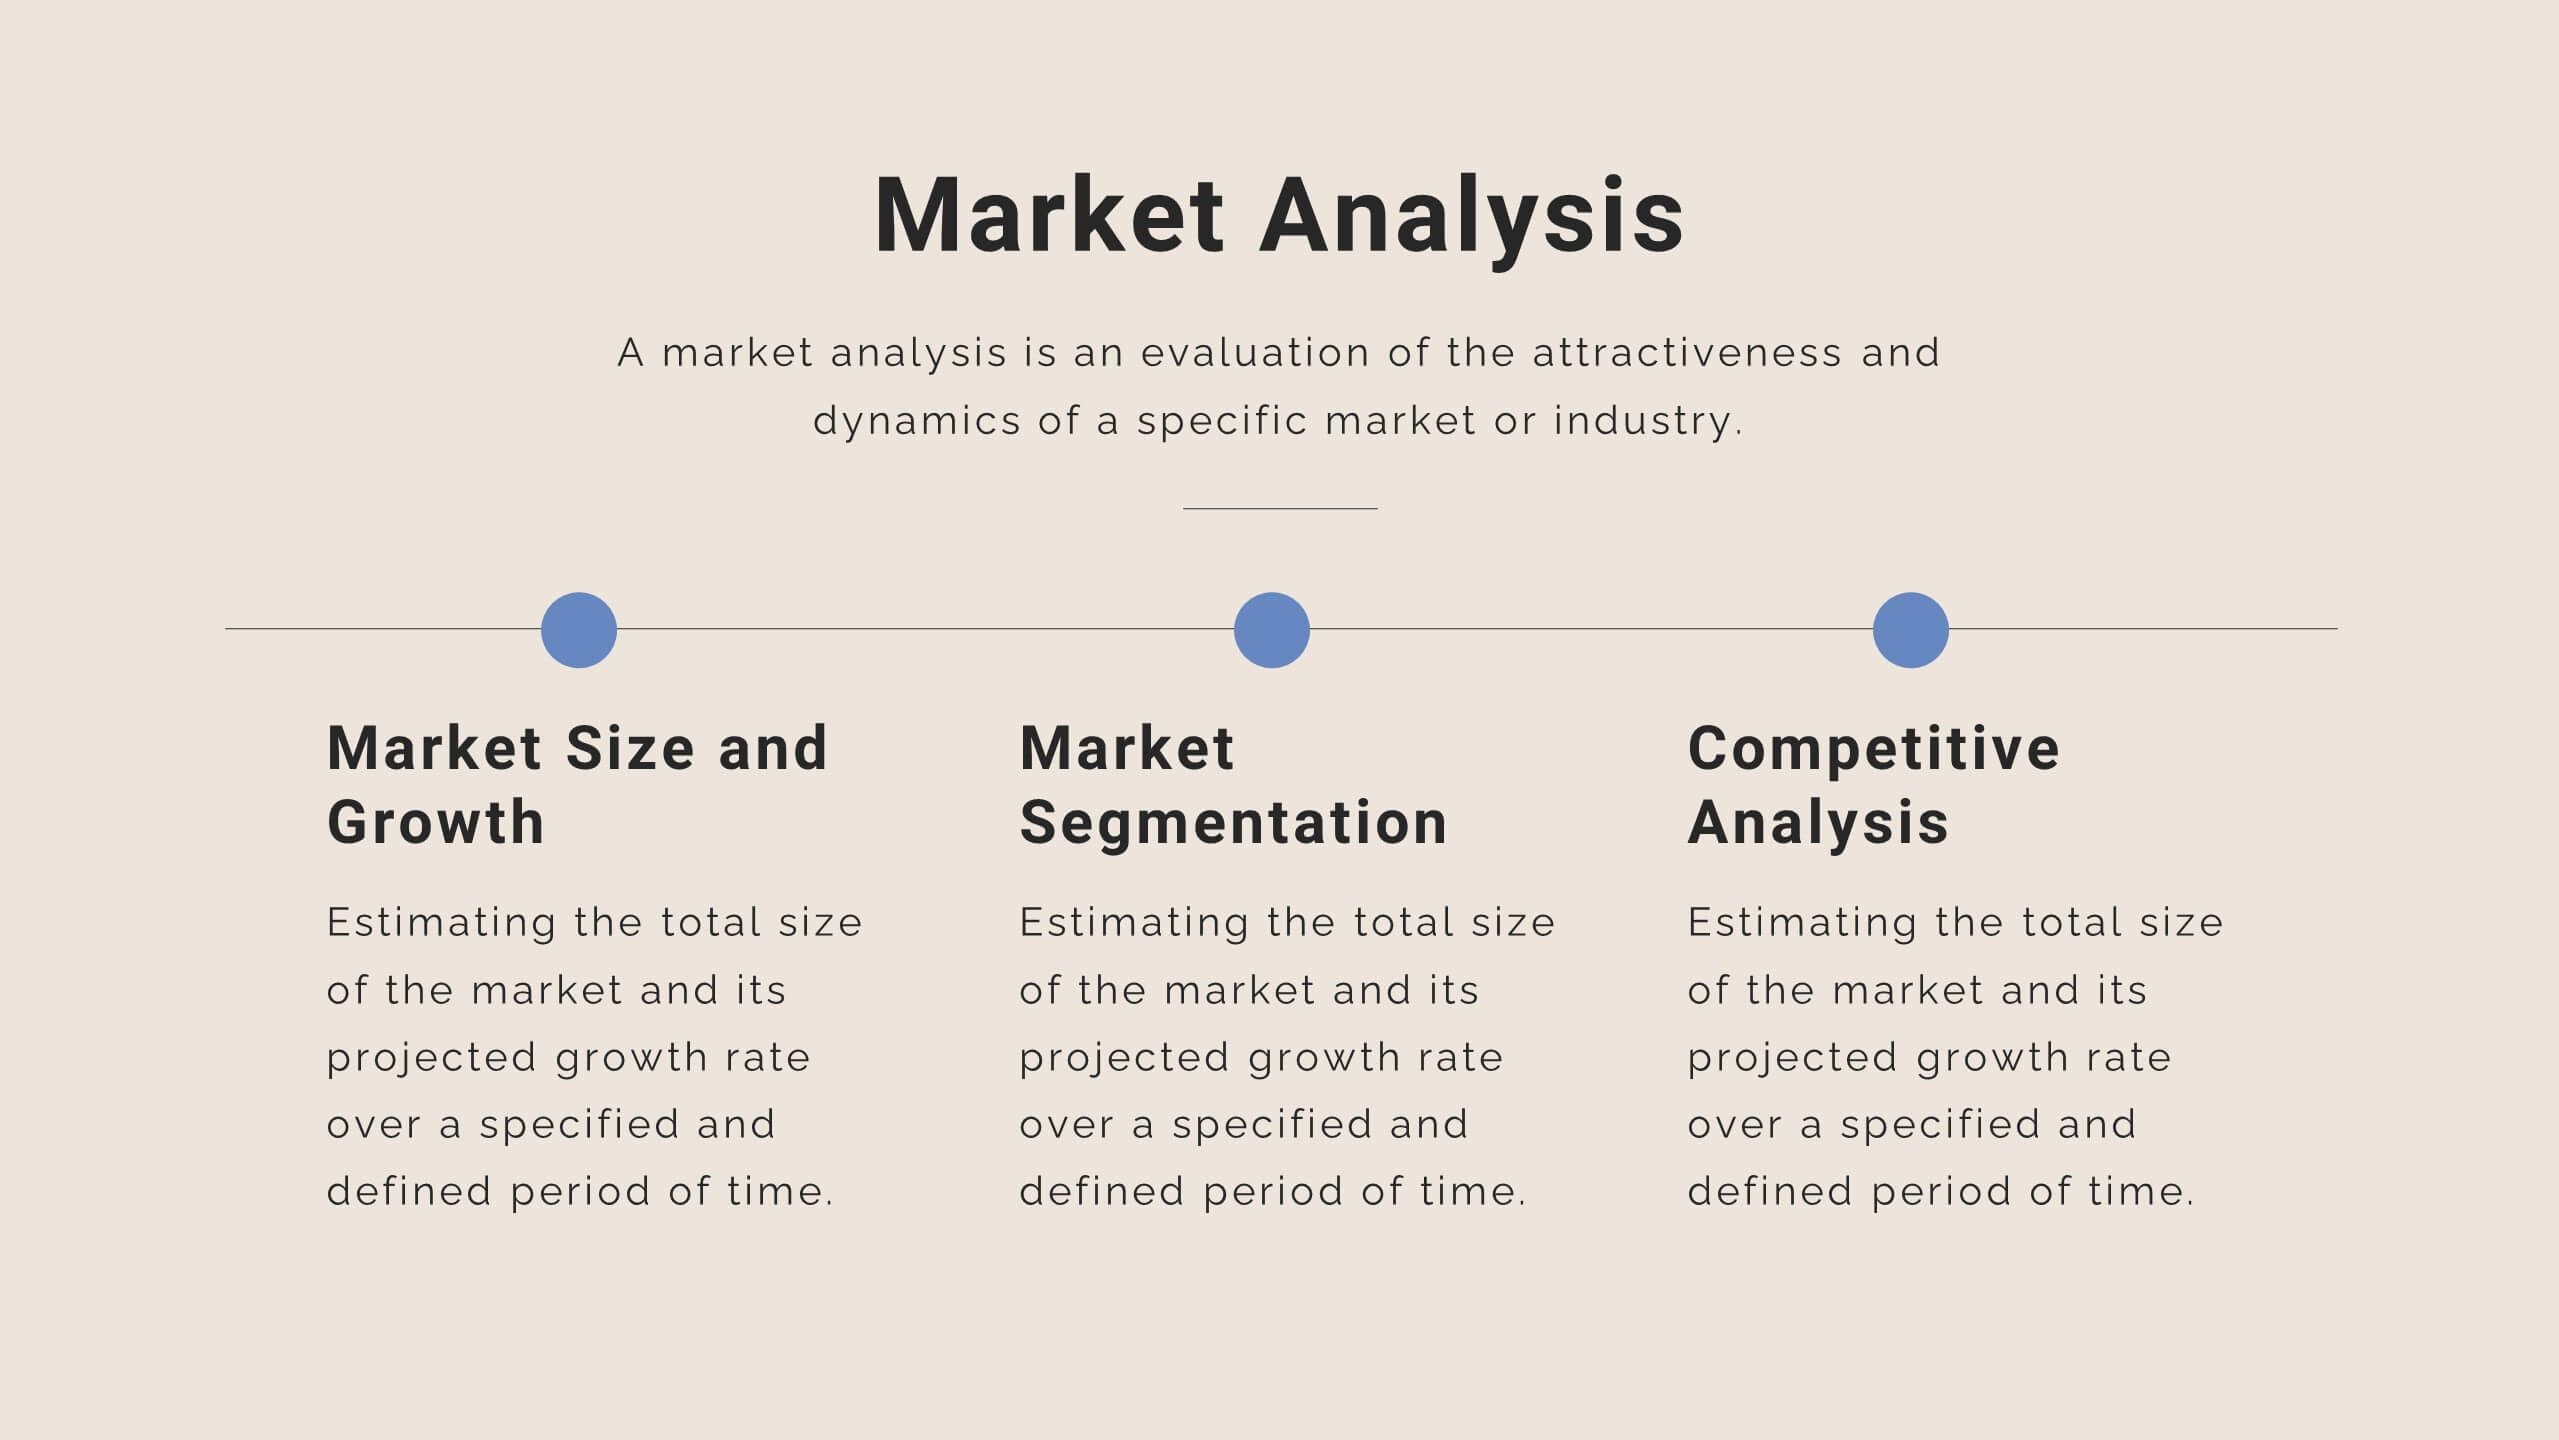
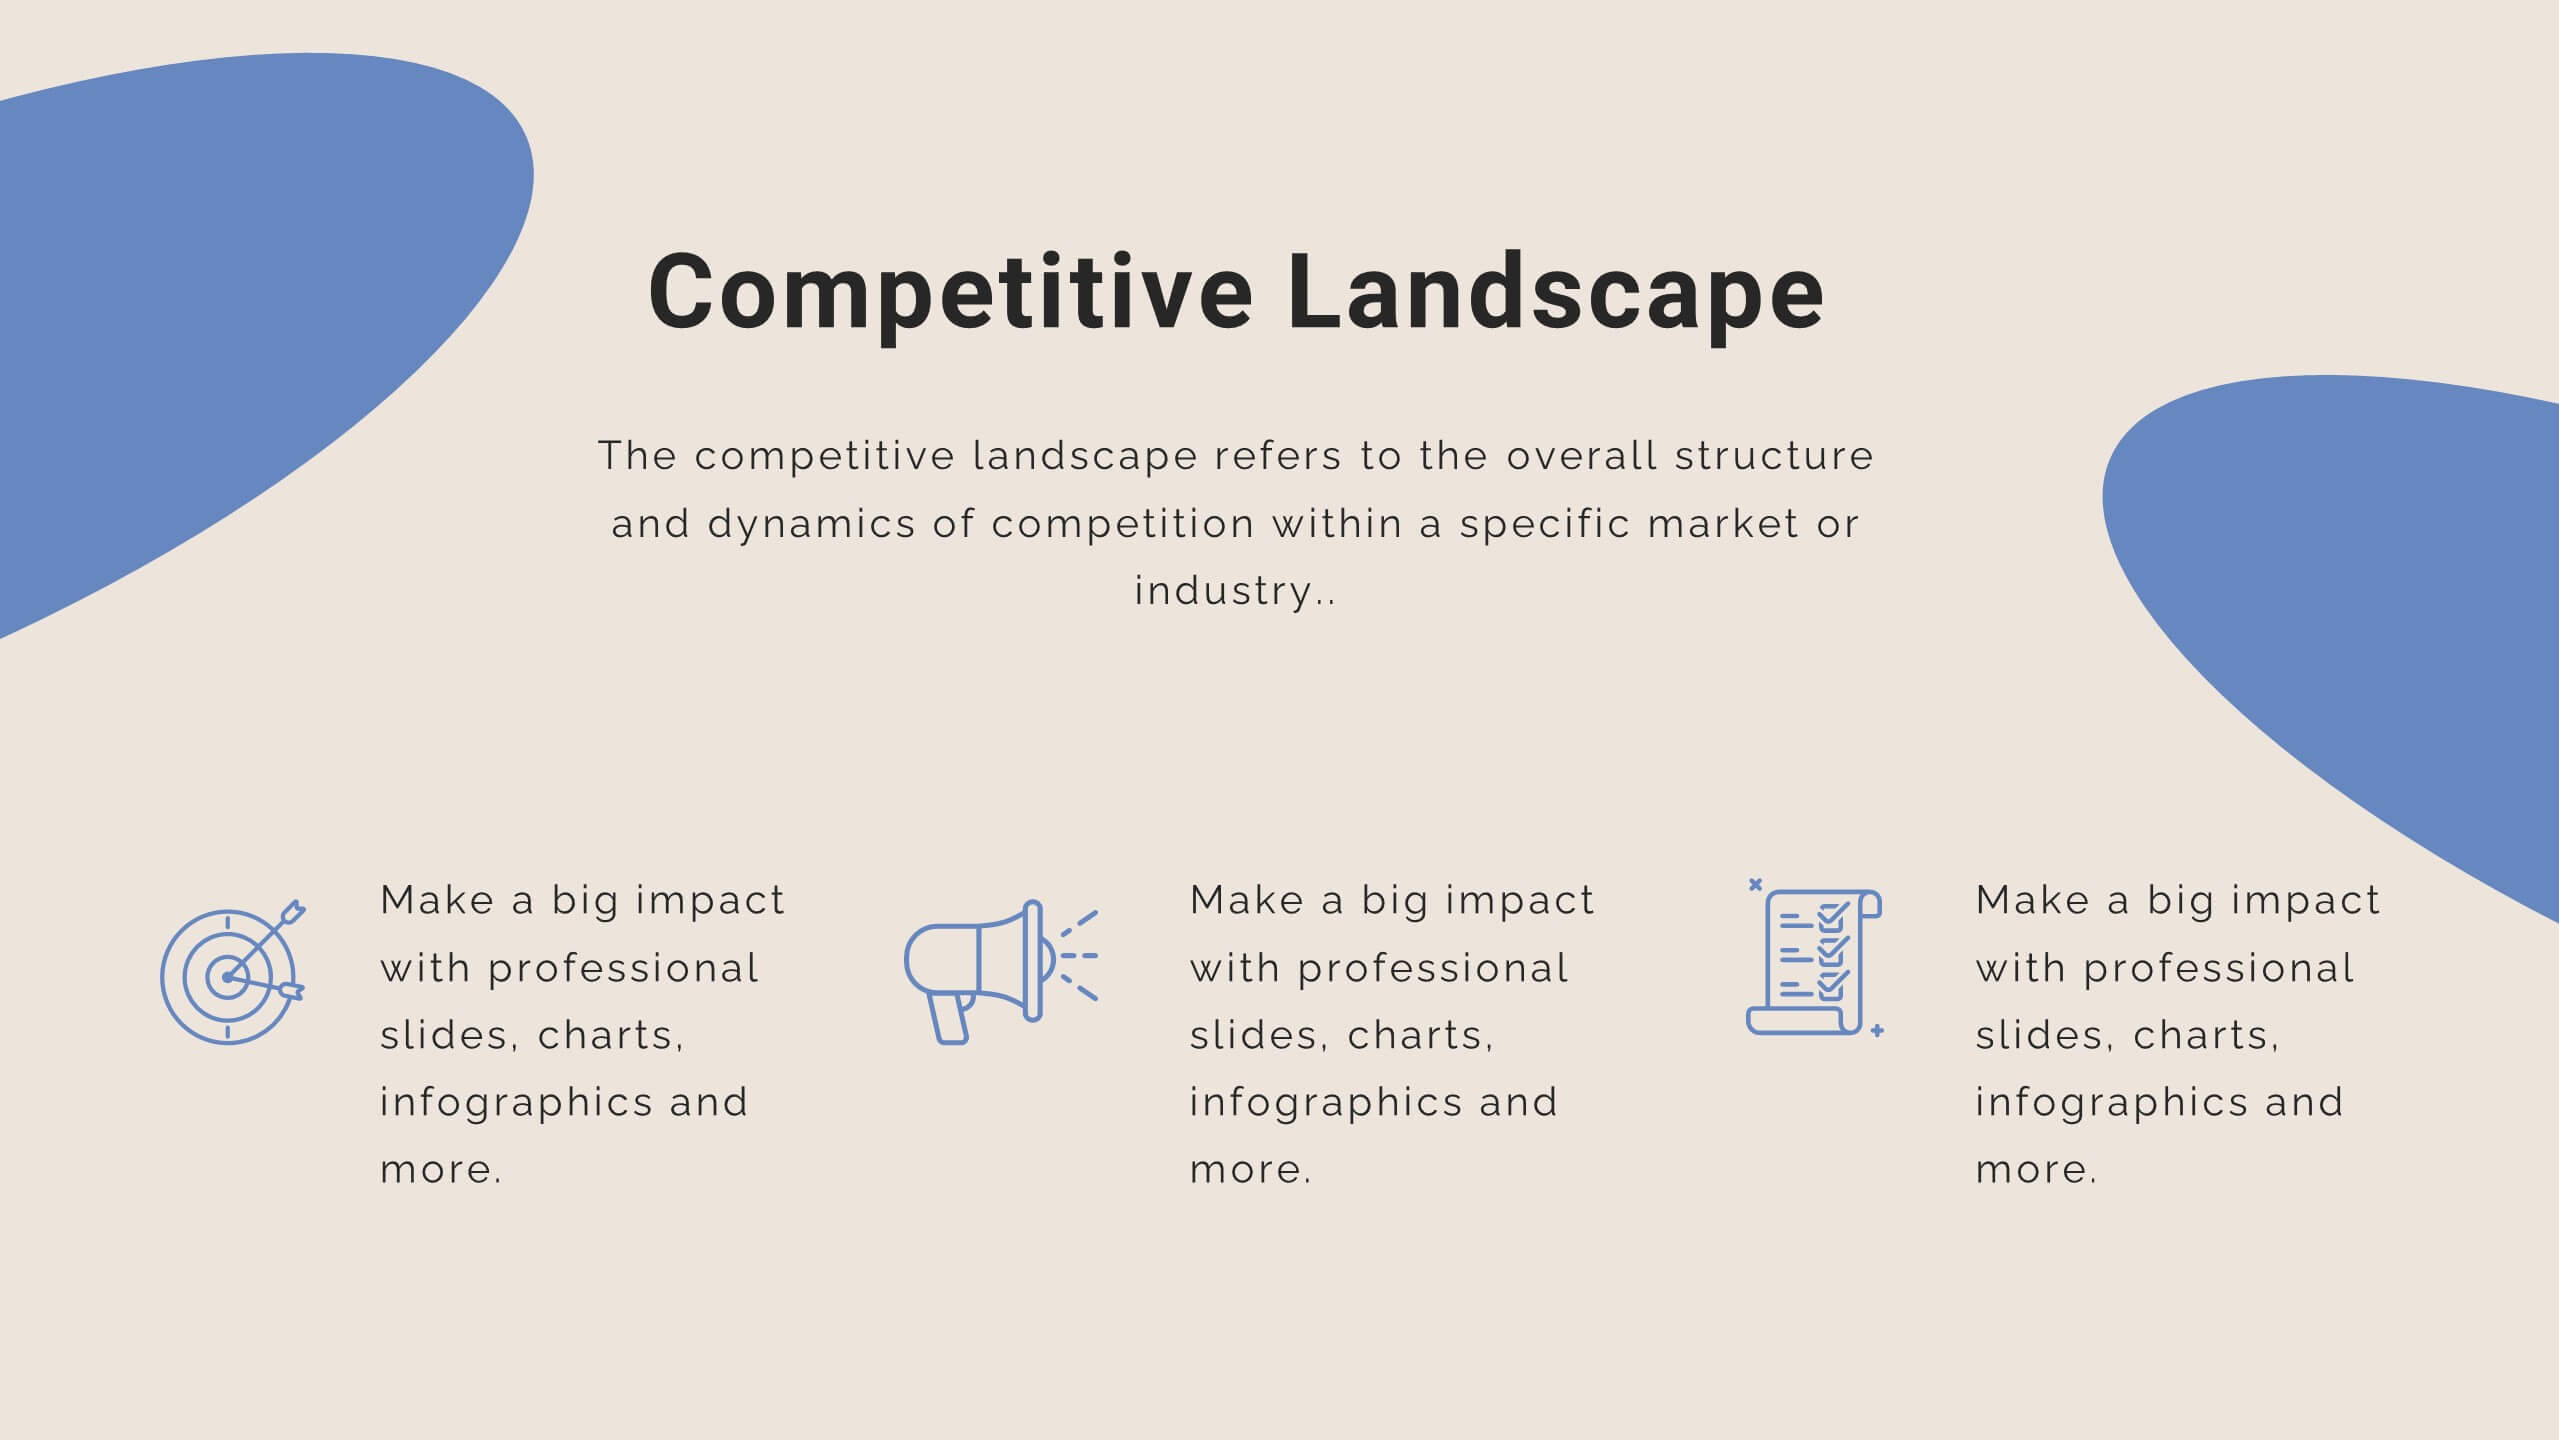
Launch your startup with confidence using this comprehensive funding proposal template! Perfect for showcasing your mission, vision, and business model to potential investors. Highlight your unique value proposition and growth plan with style. Compatible with PowerPoint, Keynote, and Google Slides, this template ensures your pitch stands out and secures the funding you need.


5 slides
Quarterly Revenue and Sales Strategy Presentation
Present your financial focus with clarity using the Quarterly Revenue and Sales Strategy Presentation. This template features a modern donut chart in the center with five labeled segments, making it easy to highlight sales goals, performance metrics, or revenue streams. Ideal for quarterly reviews, growth plans, or stakeholder updates. Fully editable in Canva, PowerPoint, and Google Slides.


6 slides
Target Market Breakdown Presentation
Turn audience data into a visual story with a clean, layered design that highlights market potential and audience segmentation. Perfect for startups and marketing teams, this layout simplifies complex data for impactful communication. Fully compatible with PowerPoint, Keynote, and Google Slides for seamless editing and professional presentation results.


4 slides
Action Plan and Next Phase Outline Presentation
Stay organized and move forward with confidence using the Action Plan and Next Phase Outline Presentation. This slide features a clear four-step vertical roadmap with alternating color-coded blocks and icons, perfect for project milestones, implementation steps, or strategic priorities. Easily editable in PowerPoint, Keynote, and Google Slides.


6 slides
Customer Journey Map Infographic
A customer journey map is a visual representation of the steps and touchpoints that a customer goes through when interacting with a product, service, or brand. This infographic template is designed to illustrate the customer journey and enhance understanding of the customer's experience with a product or service. It offers a comprehensive visualization of the various touchpoints and emotions experienced by customers throughout their interaction. This template illustrates the entire end-to-end experience from the customer's perspective. Each stage is visually represented with icons and brief descriptions to provide a clear understanding of the customer's progression.


6 slides
Market Differentiation with Blue Ocean Strategy
Position your brand uniquely with this Market Differentiation slide based on Blue Ocean Strategy principles. Featuring a clean, strategic layout with a blend of visuals and text, this template is ideal for competitive analysis, innovation roadmaps, and strategic marketing plans. Fully customizable in PowerPoint, Keynote, and Google Slides.


24 slides
Nickel Advertising Agency Proposal Presentation
Take your advertising agency to the next level with this sleek and modern presentation template! Highlighting your services, team, success stories, and marketing strategies, it’s the perfect tool to showcase your agency’s strengths and capabilities. Fully customizable and compatible with PowerPoint, Keynote, and Google Slides, this template is ideal for impressing potential clients and partners.


5 slides
Organizational Change Management Plan Presentation
Lead transformation with confidence using this layered pyramid visual designed for change management plans. Each tier clearly outlines steps, roles, or phases within your organizational shift—perfect for guiding teams through the process. Ideal for strategic presentations, leadership briefings, and operational planning. Fully compatible with PowerPoint, Keynote, and Google Slides.


6 slides
IT Operations Workflow Presentation
Visualize your IT processes with a sleek, structured flow that highlights every operational step from start to finish. Ideal for presenting systems management, network operations, or support frameworks, this presentation brings clarity to technical workflows. Fully compatible with PowerPoint, Keynote, and Google Slides for easy customization and seamless presentation delivery.


30 slides
Quintara Rebranding Project Plan Presentation
Revamp your brand with confidence using this dynamic rebranding project plan presentation. Covering key aspects like brand positioning, market analysis, visual identity, and unique selling propositions, this template helps you craft a compelling brand strategy. Fully customizable and compatible with PowerPoint, Keynote, and Google Slides for a seamless, professional presentation experience.


6 slides
3D Technologies Infographics
Dive into the world of 3D Technologies with our customizable infographic template. This template is fully compatible with popular presentation software like PowerPoint, Keynote, and Google Slides, allowing you to easily customize it to showcase various aspects and applications of 3D technologies. The 3D Technologies infographic template provides a visually engaging platform to explore and explain the world of three-dimensional technology, from 3D printing and modeling to virtual reality and augmented reality. Whether you're an enthusiast, educator, or industry professional, this template offers a user-friendly canvas to create informative presentations and educational materials. Elevate your understanding of 3D Technologies with this SEO-optimized infographic template, thoughtfully designed for clarity and ease of use. Customize it to highlight the key principles, applications, and innovations within the 3D technology landscape, making complex concepts accessible to your audience. Start crafting your personalized infographic today to delve into the exciting realm of 3D Technologies.


7 slides
Performance Summary Infographic
Boost your reporting capabilities with our Infographic Templates, designed to deliver exceptional clarity and impact. This series is perfectly suited for professionals seeking to present performance data compellingly and concisely. With a variety of designs including radial graphs, tiered lists, and comparative bars, these templates allow for an informative and aesthetically pleasing showcase of critical metrics. Each template is customizable, letting you adjust the color schemes and text to fit your corporate style, enhancing both visual appeal and brand consistency. Whether used in PowerPoint, Google Slides, or Keynote, these tools are vital for anyone looking to articulate achievements, assess comparative results, and plan based on solid data insights. They are indispensable for consultants, managers, and team leaders who require clear, persuasive presentation resources to drive decisions and highlight successes.


8 slides
Investment and Risk Business Case Presentation
Assess investment risks with confidence using this dynamic business case template. Designed for clear visualization, it categorizes risk levels from high to low, helping professionals analyze financial decisions effectively. Perfect for finance, business strategy, and market evaluation, this template is fully compatible with PowerPoint, Keynote, and Google Slides.


5 slides
Management Framework Structure Presentation
Bring your ideas to life with a dynamic slide that maps out clear stages of leadership, planning, and execution. This layout helps you break down complex management structures into simple, visual steps that any audience can follow. Fully editable and easy to customize in PowerPoint, Keynote, and Google Slides.


8 slides
Statistical Data Visualization Presentation
Bring Your Data to Life! The Statistical Data Visualization Presentation transforms complex information into clear, engaging visuals. Designed for professionals who need to showcase trends and insights, this template uses dynamic graphs and color-coded sections for clarity. Fully editable and compatible with PowerPoint, Keynote, and Google Slides for effortless customization.