


Features
- 4 Unique slides
- Fully editable and easy to edit in Microsoft Powerpoint, Keynote and Google Slides
- 16:9 widescreen layout
- Clean and professional designs
- Export to JPG, PDF or send by email


Do you have any questions?
Recommend


7 slides
Business Strategy Plan Infographic
A Business Strategy Infographic shows you how to create a business plan that will help you achieve your goals. This infographic is designed to help you understand how your company and competitors are going to win in the marketplace by showing how all of their moves fit together. This template is a beautiful combination of data visualization, charts, and graphics to help you see what's going on in your business. This is the perfect tool for anyone who wants to understand the current state of their operations and make informed decisions about how to move forward. Fully customizable and compatible with Powerpoint, Keynote, and Google Slides.


6 slides
Market Trends and Insights Year in Review Presentation
Analyze seasonal shifts with clarity using the Market Trends and Insights Year in Review Presentation. This quarterly layout lets you break down key trends, data, and highlights by month, helping stakeholders visualize market behavior throughout the year. Ideal for analysts, marketers, and strategy teams. Fully customizable and works seamlessly with PowerPoint, Keynote, and Google Slides.


6 slides
Modern Agriculture Industry Trends
Highlight key data and insights with this visually engaging agriculture-themed slide. Designed with circular data visuals and crop illustrations, it's perfect for showcasing percentages, trends, or growth stats in modern farming, agri-tech, and sustainability initiatives. Fully editable in PowerPoint, Keynote, and Google Slides.


10 slides
Post-Pandemic Business Strategy Presentation
Help your team adapt to the new normal with this sleek and professional slide layout. Featuring a sanitizer bottle graphic as a central metaphor, the design visually supports your content on strategic recovery, operational safety, or workflow changes. Includes four editable text sections, each with modern icons. Ideal for HR, leadership updates, or business continuity plans. Compatible with PowerPoint, Keynote, and Google Slides.


6 slides
Risk Management in Insurance Presentation
Ensure Stability and Security with this Risk Management in Insurance Presentation template. Featuring a shield-themed layout, this slide effectively communicates key risk assessment strategies, mitigation plans, and compliance measures in the insurance sector. Ideal for insurance professionals, financial risk analysts, and compliance teams, this fully editable template is compatible with PowerPoint, Keynote, and Google Slides, allowing you to tailor the content to your specific risk management needs.


7 slides
Environmental Planning Infographic Presentation
Environmental infographics are an essential tool in raising awareness about the state of the environment and the impact of human activities on the planet. This template presents a broad range of data text on the environment for you to input. Use this eye-catching infographic design to educate and raise awareness about the environment. This template is ideal to give an overview of the topic, its importance and the main issues. Stay on track using facts and figures, good visuals and data visualizations. This presentation is easy to use and can be edited in Powerpoint, Keynote or Google Slides.


21 slides
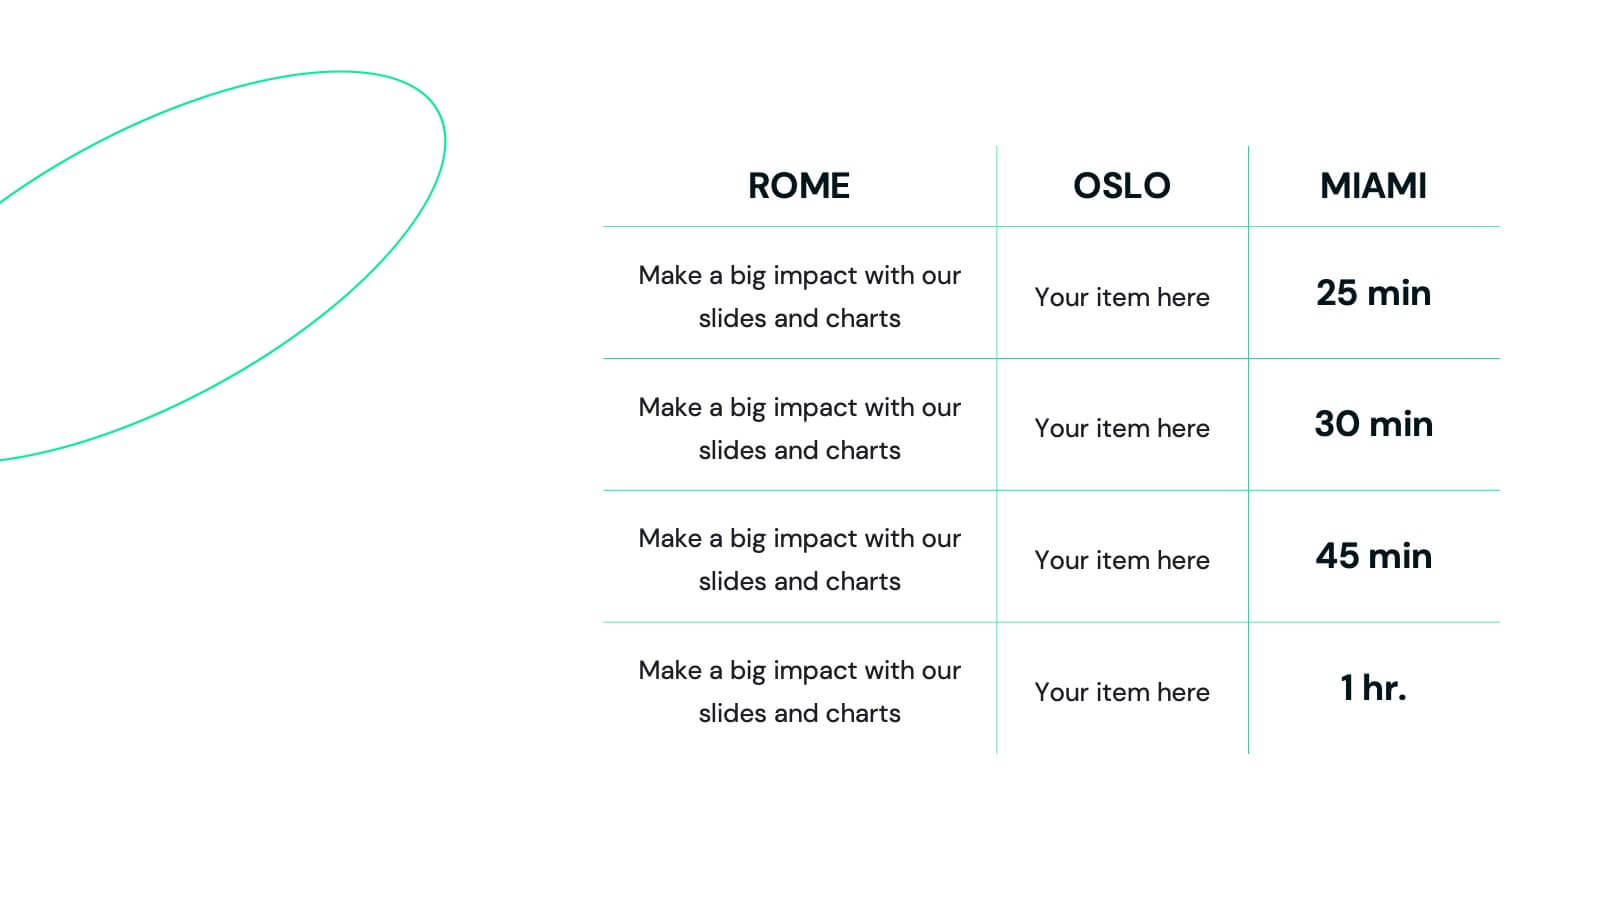
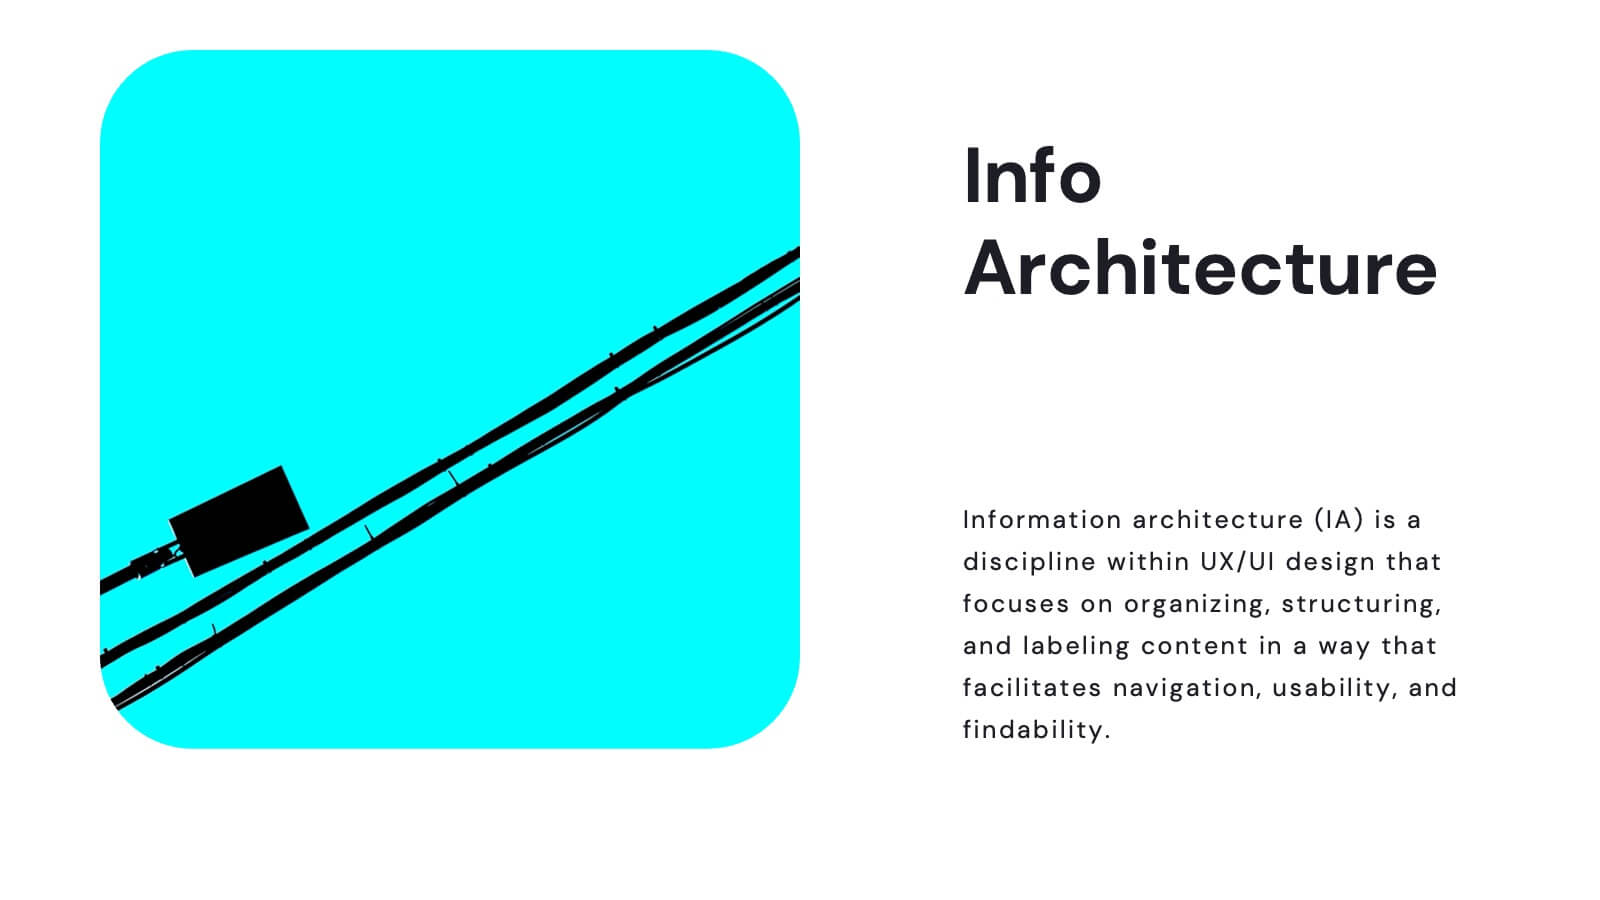
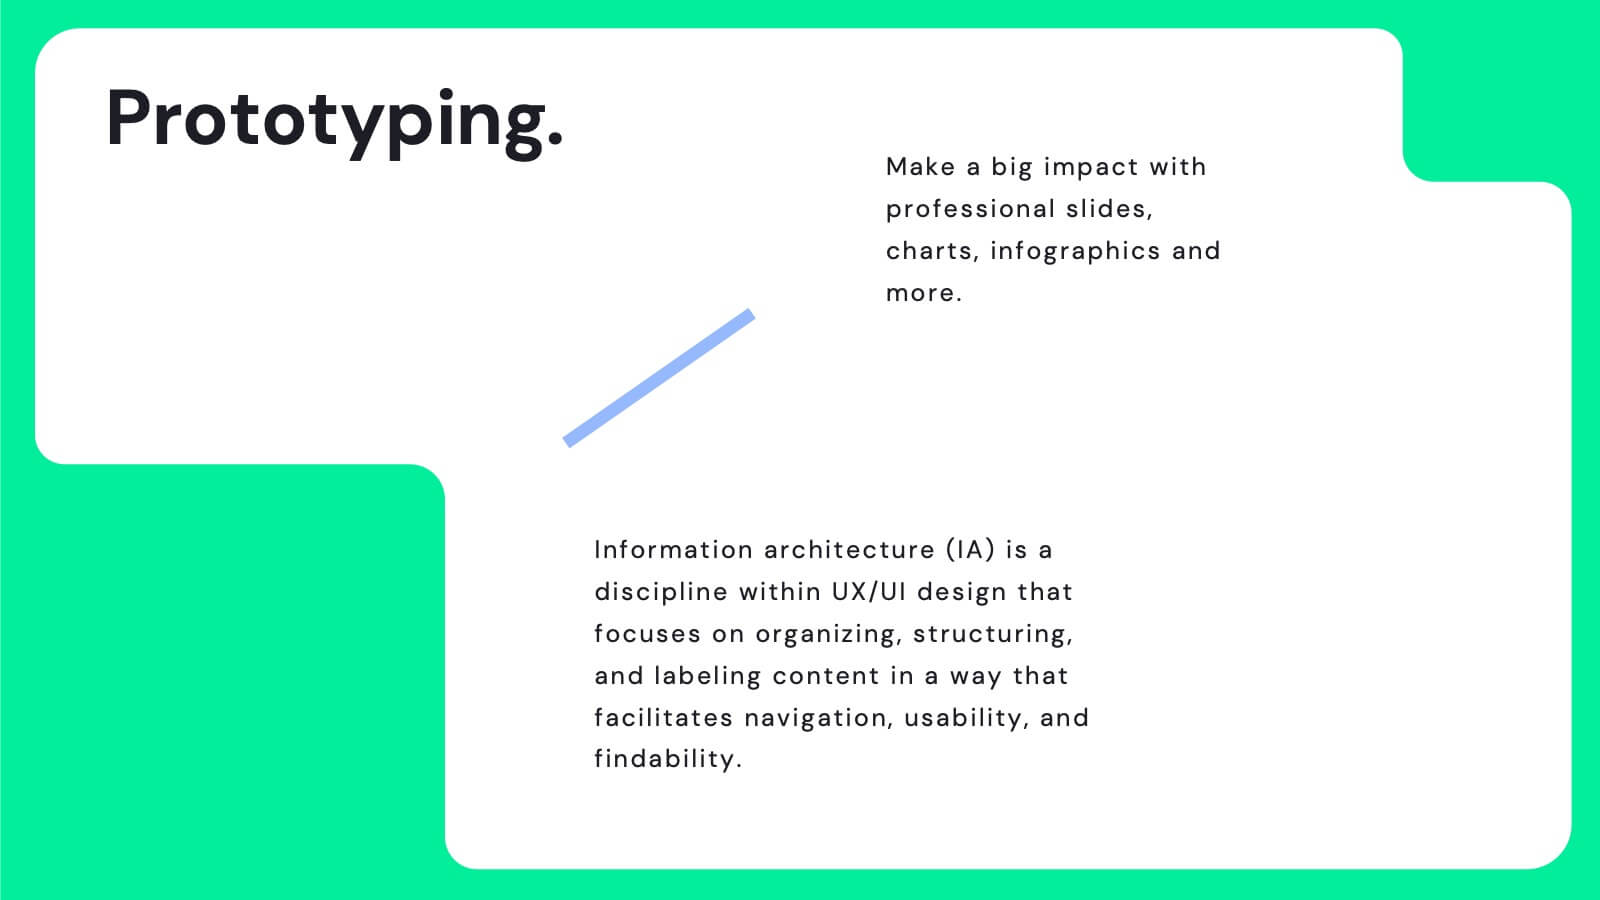
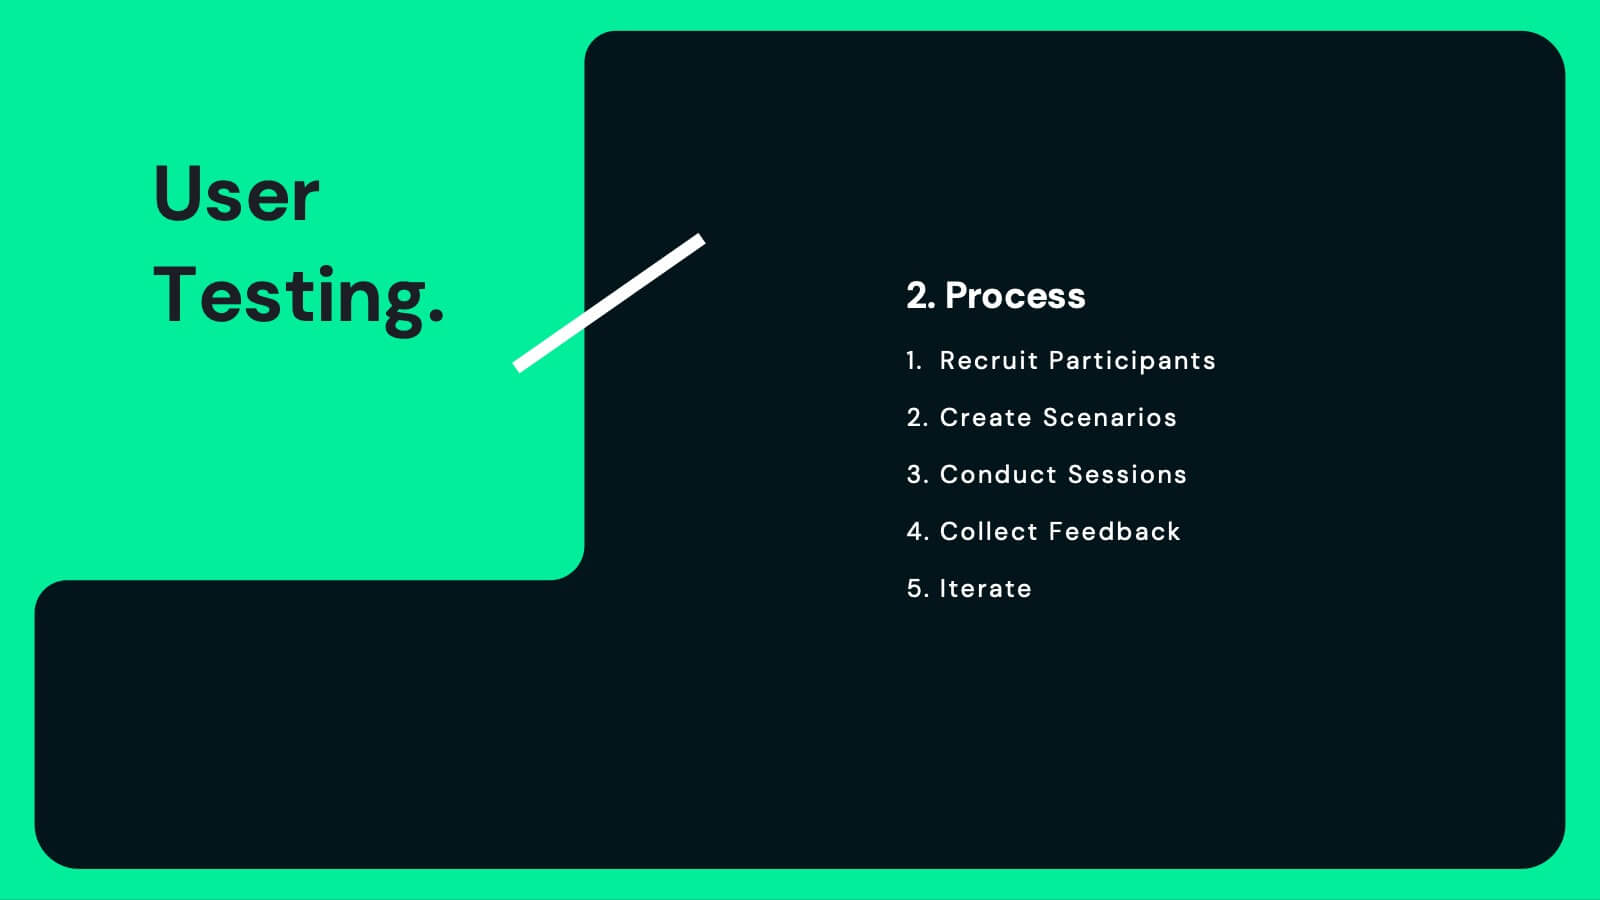
Juno UX Case Study Presentation
Enhance your UX presentations with this sleek, user-friendly template designed for showcasing detailed case studies and user research. With a modern layout and clear sections for user journey mapping, prototyping, and usability guidelines, this template ensures a professional and engaging presentation. Compatible with PowerPoint, Keynote, and Google Slides, it's perfect for any platform.


12 slides
Creative Alphabet Infographic
Add a bold twist to your data with this Creative Alphabet Infographic slide, featuring a stylized letter “B” puzzle layout. Ideal for branding breakdowns, step-by-step processes, or topic segmentation, each puzzle piece aligns with a customizable title and description. Fully editable in PowerPoint, Keynote, and Google Slides.


10 slides
Agile Scrum Framework Presentations
Kickstart your workflow with a clear, energetic layout designed to simplify complex processes and highlight each stage of your agile cycle. This presentation explains how iterative teamwork, transparency, and fast delivery shape efficient project management. Clean visuals guide viewers through structured steps. Compatible with PowerPoint, Keynote, and Google Slides.


6 slides
Deluxe Loyalty Program Infographics
Explore the Deluxe Loyalty Program with our customizable infographic template. This template is fully compatible with popular presentation software like PowerPoint, Keynote, and Google Slides, allowing you to easily customize it to showcase the features, benefits, and advantages of the Deluxe Loyalty Program. The Deluxe Loyalty Program infographic template offers a visually engaging platform to highlight the rewards, incentives, and exclusive offers available to members of the program. Whether you're a business owner, marketer, or customer relations specialist, this template provides a user-friendly canvas to create informative presentations and promotional materials for your loyalty program. Optimize your loyalty program's visibility and appeal with this SEO-optimized infographic template, thoughtfully designed for clarity and ease of use. Customize it to showcase program tiers, benefits, points accumulation, and member testimonials, ensuring that your audience understands the value of participating in the Deluxe Loyalty Program. Start crafting your personalized infographic today to promote customer loyalty and engagement effectively.


21 slides
Vespera Project Management Plan Presentation
This Project Management Plan Presentation template is a professional and well-structured tool to outline project goals, scope, timelines, and resources. It covers key elements like deliverables, budget breakdown, risk management, and stakeholder analysis. Fully customizable and compatible with PowerPoint, Keynote, and Google Slides for seamless collaboration.


26 slides
Creative Home Office Setups Presentation
Transform your workspace into an inspiring and productive haven with this engaging presentation on creative home office setups. Covering ergonomic design, aesthetic organization, tech essentials, and personalized decor, this template helps you present ideas that enhance efficiency and comfort. Fully customizable and compatible with PowerPoint, Keynote, and Google Slides for a seamless experience.


6 slides
Effective Leadership Skills Presentation
Build stronger teams with this effective leadership skills template, featuring a colorful building block design to represent key competencies. Ideal for leadership workshops, corporate training, and professional development, it visually organizes six core skills. Fully editable in Canva, PowerPoint, or Google Slides for easy customization to match your organization’s style.


6 slides
Sales Funnel Strategy Presentation
Clearly map your marketing efforts with this Sales Funnel Strategy Presentation. Featuring a bold, inverted funnel design with six customizable layers, this slide is perfect for illustrating your lead nurturing stages—from prospecting to conversion. Each segment includes editable titles and icons, making it ideal for PowerPoint, Keynote, or Google Slides. Great for sales teams, marketers, and strategists looking to drive results.


8 slides
Territorial Reach Map of United States Presentation
Showcase your national footprint with the Territorial Reach Map of United States Presentation. This slide visually highlights specific states and aligns them with key data points—perfect for illustrating market penetration, sales concentration, or operational presence. Designed for clarity and impact, it's fully customizable in Canva, PowerPoint, and Google Slides.


23 slides
Kale Market Research Presentation
Elevate your market research presentation with this sleek template! Includes sections for introduction, objectives, data collection, analysis, key findings, and recommendations. Perfect for presenting insights, implications, and future research directions. Compatible with PowerPoint, Keynote, and Google Slides, ensuring a visually appealing and professional look. Make your data shine!


3 slides
Clean Water Initiative Overview Presentation
Communicate sustainability goals with this clean, modern layout featuring water droplet and faucet visuals. Ideal for summarizing three core focus areas of your environmental or nonprofit program. The minimalist design keeps attention on your key points. Fully editable and compatible with PowerPoint, Keynote, and Google Slides for easy customization.