


Features
- 12 Unique slides
- Fully editable and easy to edit in Microsoft Powerpoint, Keynote and Google Slides
- 16:9 widescreen layout
- Clean and professional designs
- Export to JPG, PDF or send by email


Do you have any questions?
Recommend


5 slides
European Market Trends with Europe Map Presentation
Navigate market dynamics with the European Market Trends with Europe Map template, designed for business professionals analyzing key trends and opportunities across the region. It features an editable map, key data indicators, and graphical elements to represent market trends and opportunities. Compatible with PowerPoint and Google Slides, it's ideal for presentations on market analysis and growth strategies.


10 slides
Corporate Governance Model Presentation
Bring clarity and structure to complex leadership systems with this clean, modern slide, perfect for explaining how key responsibilities flow across an organization. It helps simplify roles, decisions, and oversight for any business audience. Fully editable and easy to use in PowerPoint, Keynote, and Google Slides.


5 slides
Marketing Wheel Strategy Presentation
Enhance your marketing presentations with our "Marketing Wheel Strategy Presentation" template. This infographic is designed to visually represent the interconnected components of a marketing strategy, organized in a wheel format for clarity. Each segment, color-coded for distinction, covers different aspects such as planning, execution, analysis, and optimization, demonstrating their interdependence. This layout is perfect for illustrating how each part contributes to the overall effectiveness of a marketing plan. Ideal for marketing professionals and strategists, it facilitates detailed strategy discussions and comprehensive planning sessions. Fully compatible with PowerPoint, Keynote, and Google Slides, this template is essential for delivering clear and effective marketing presentations.


21 slides
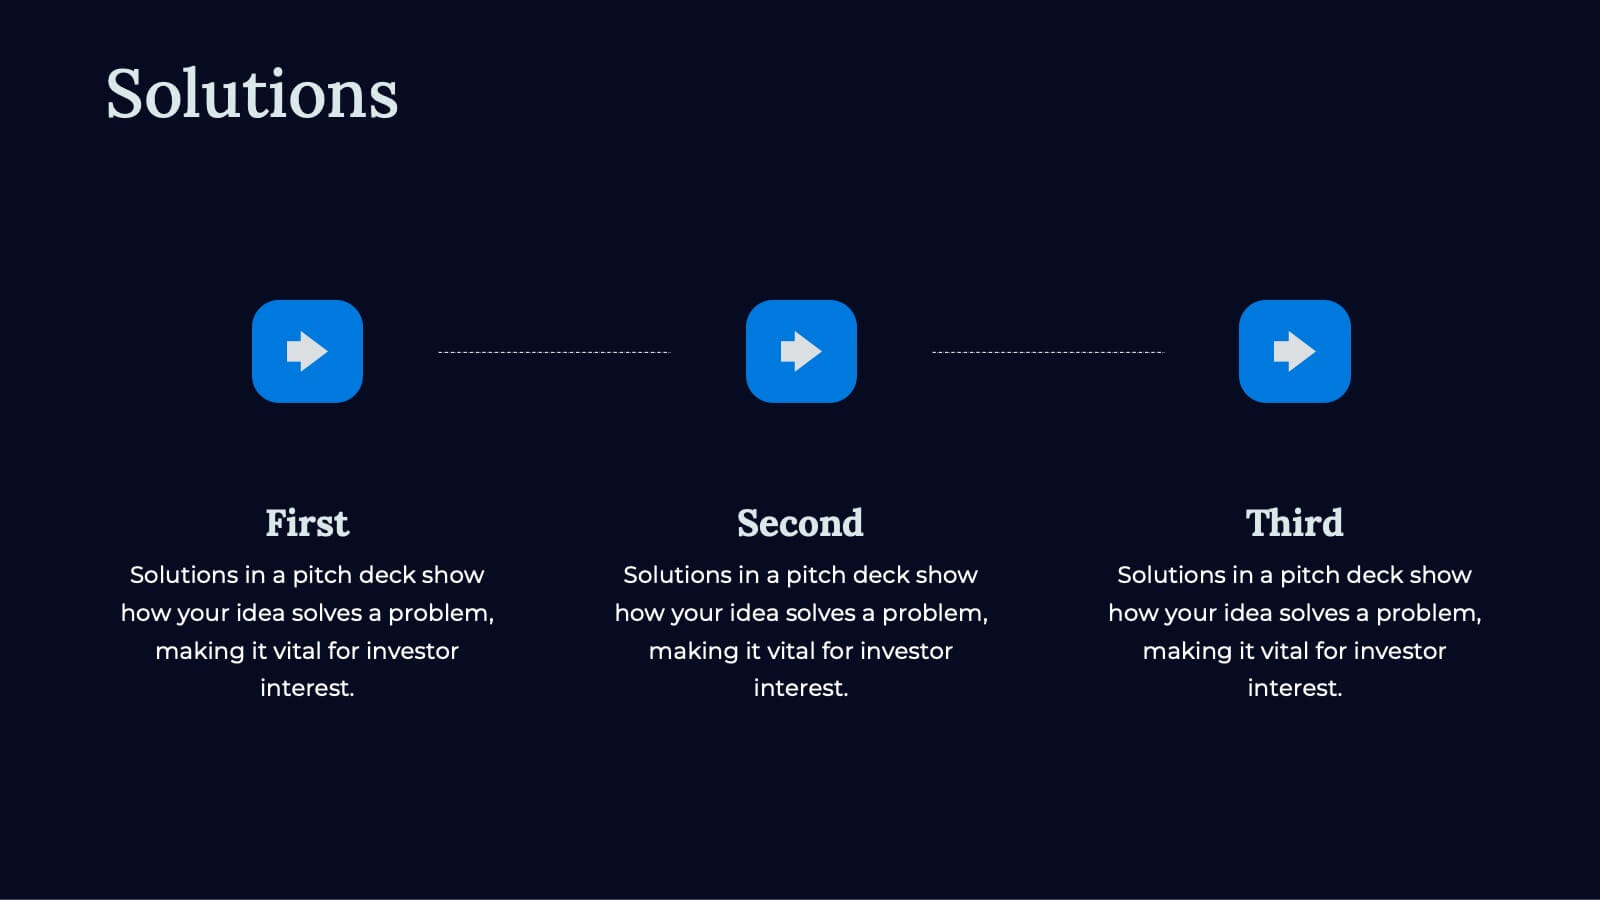
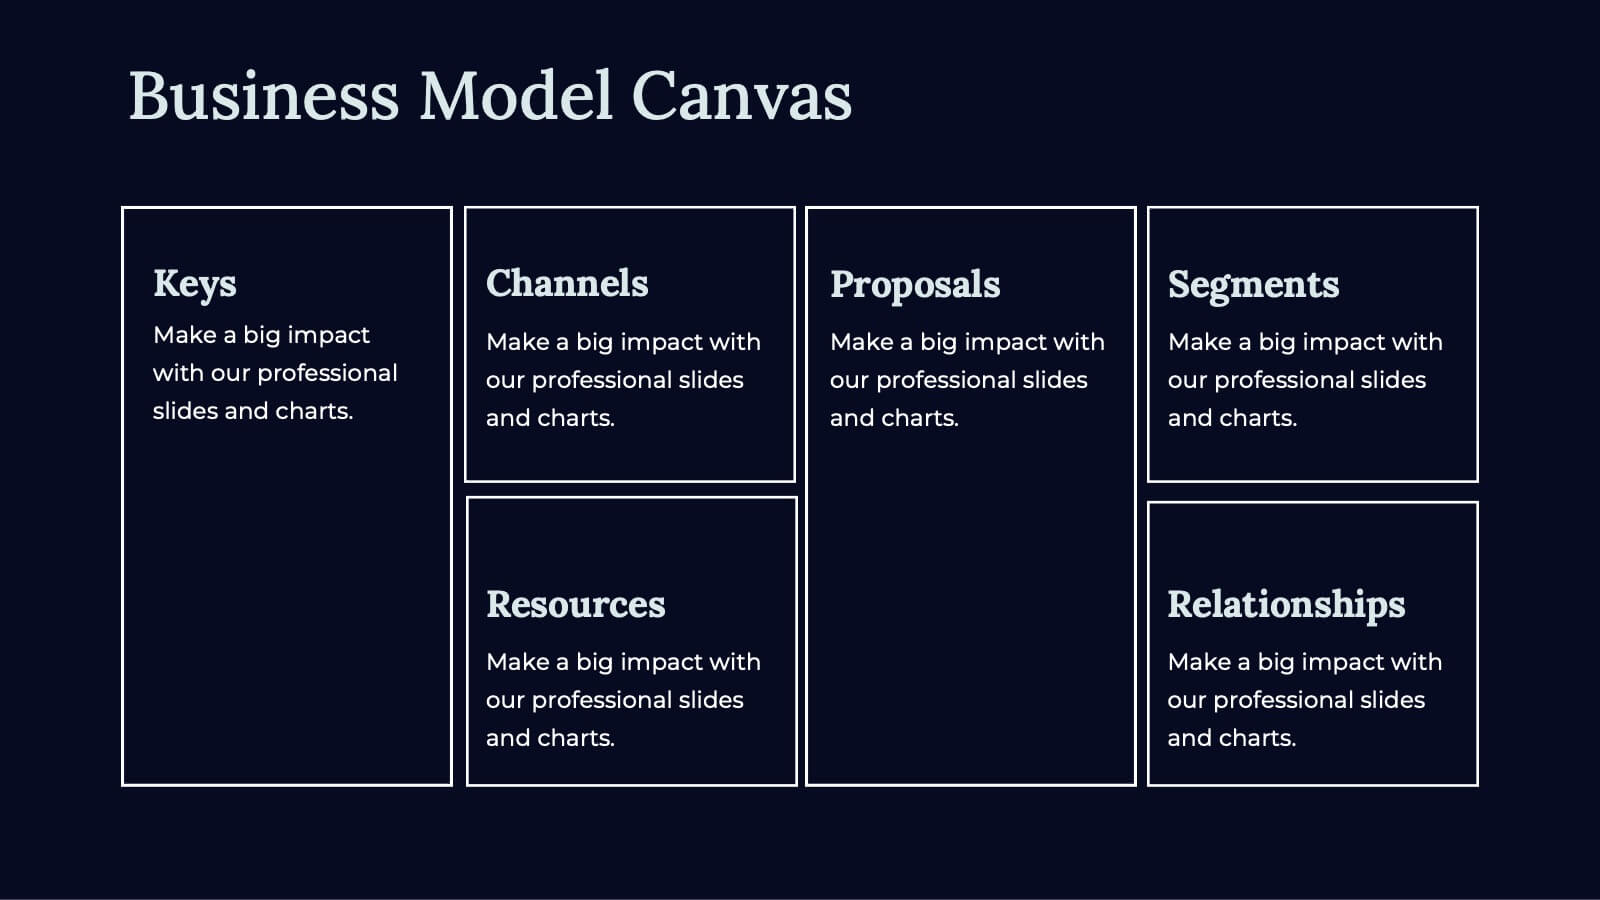
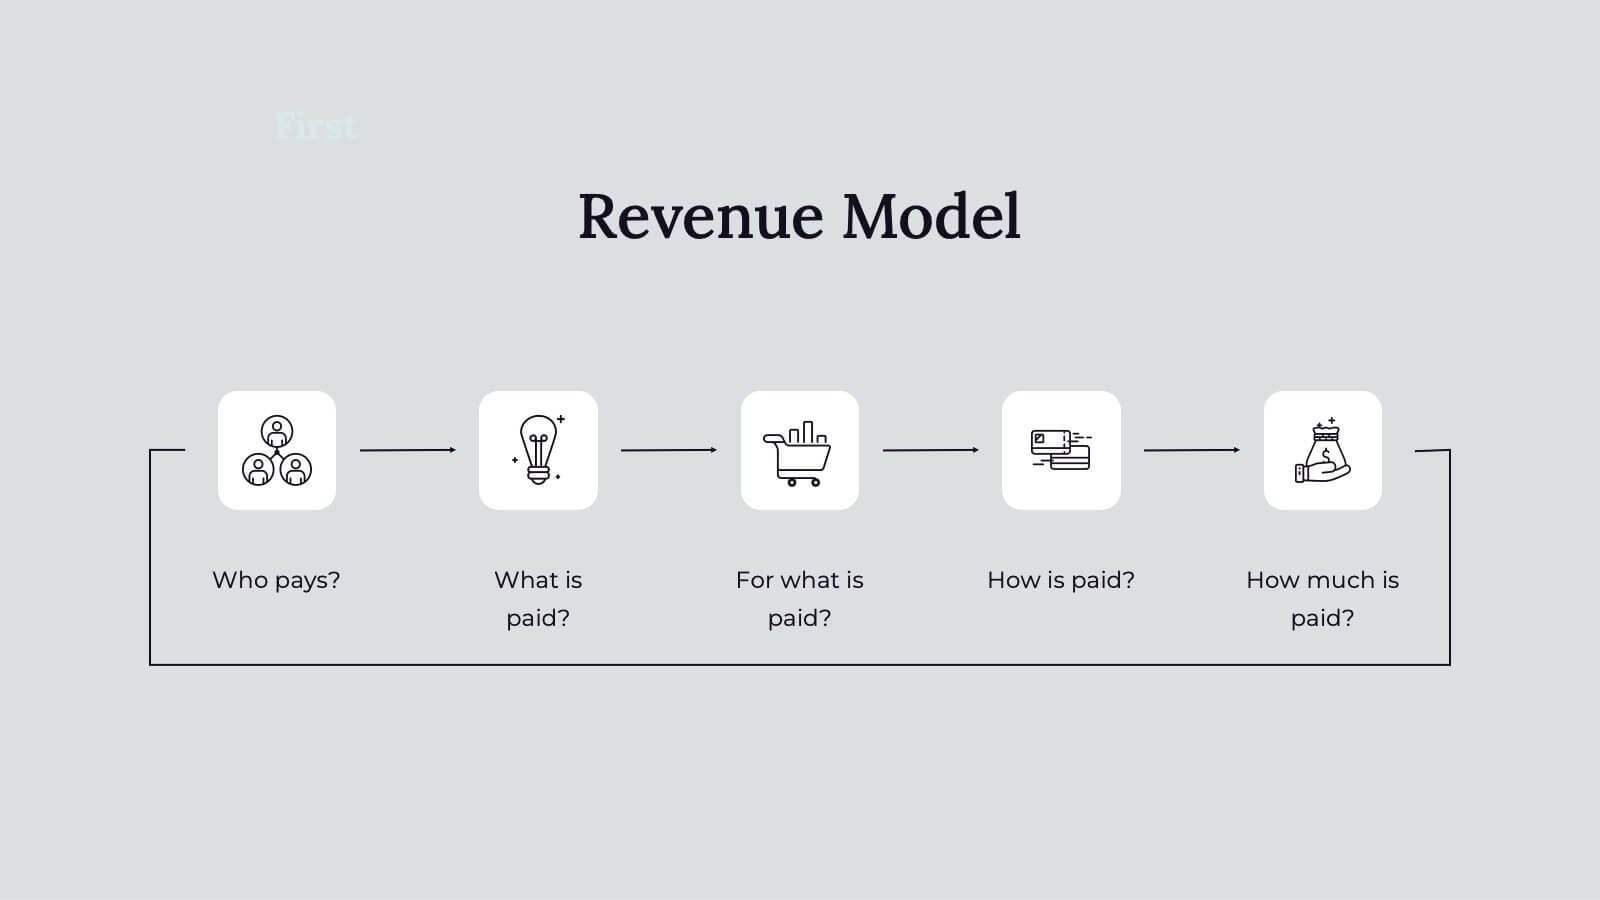
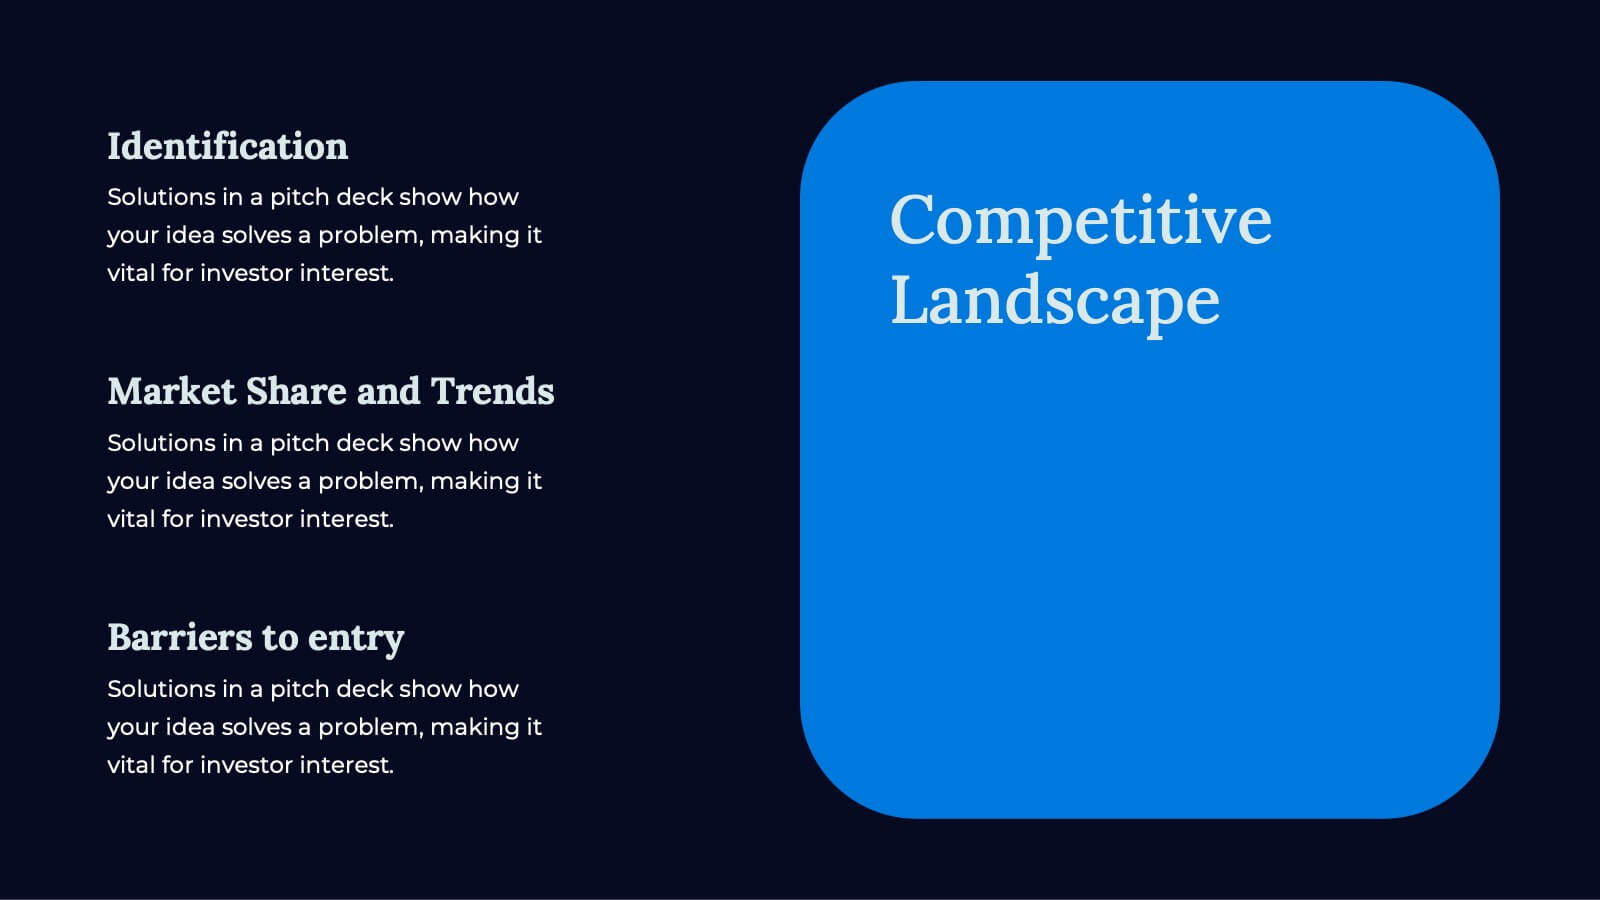
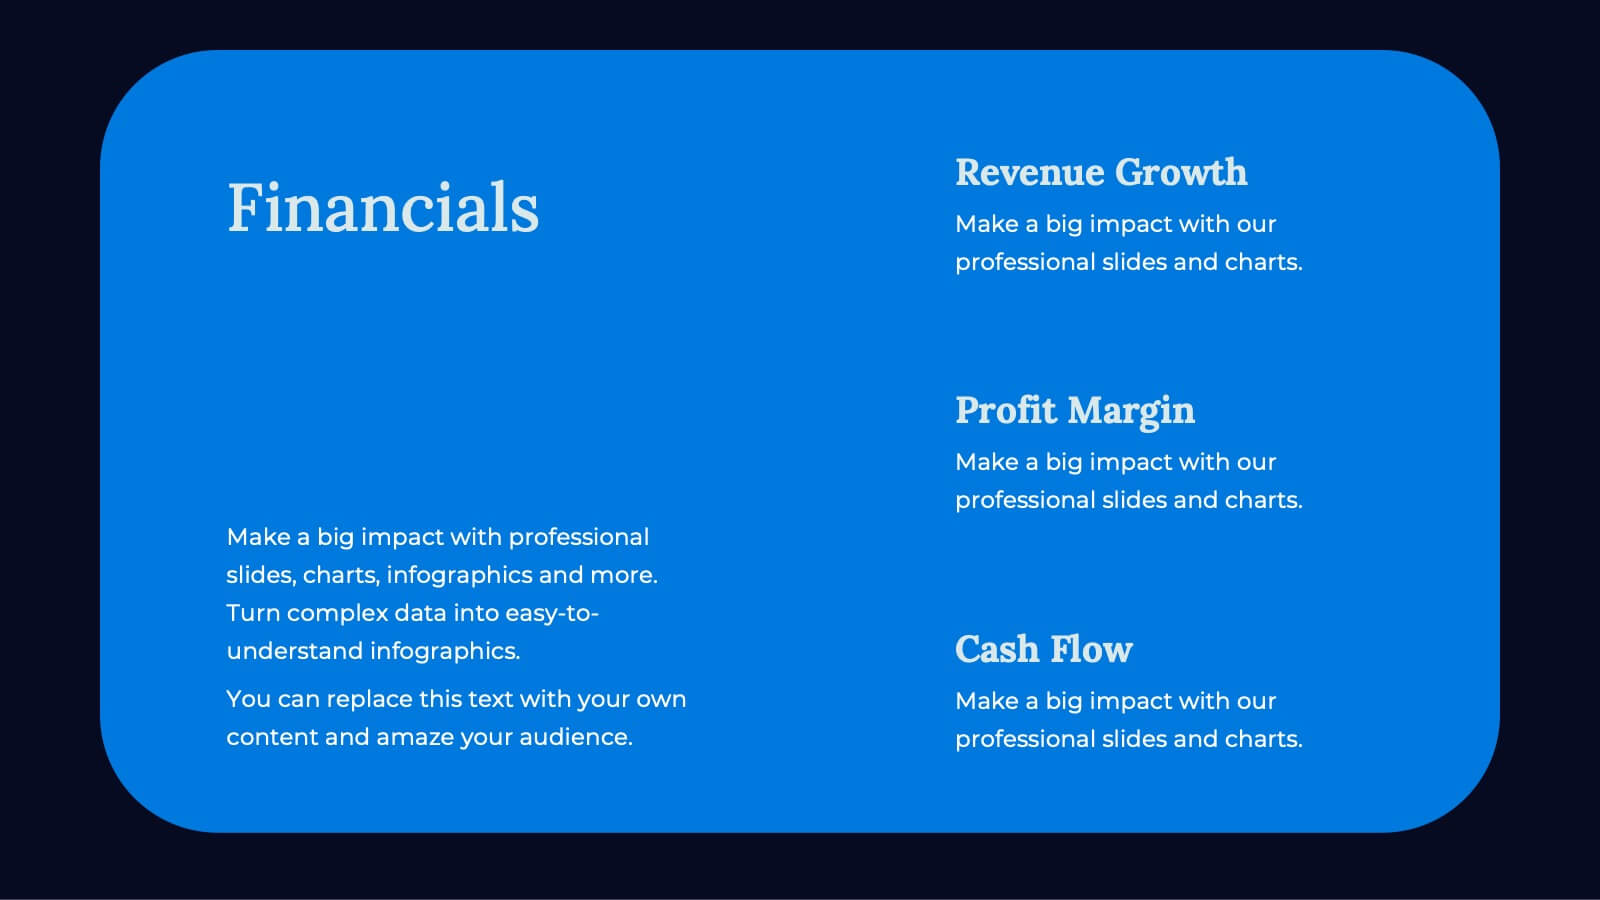
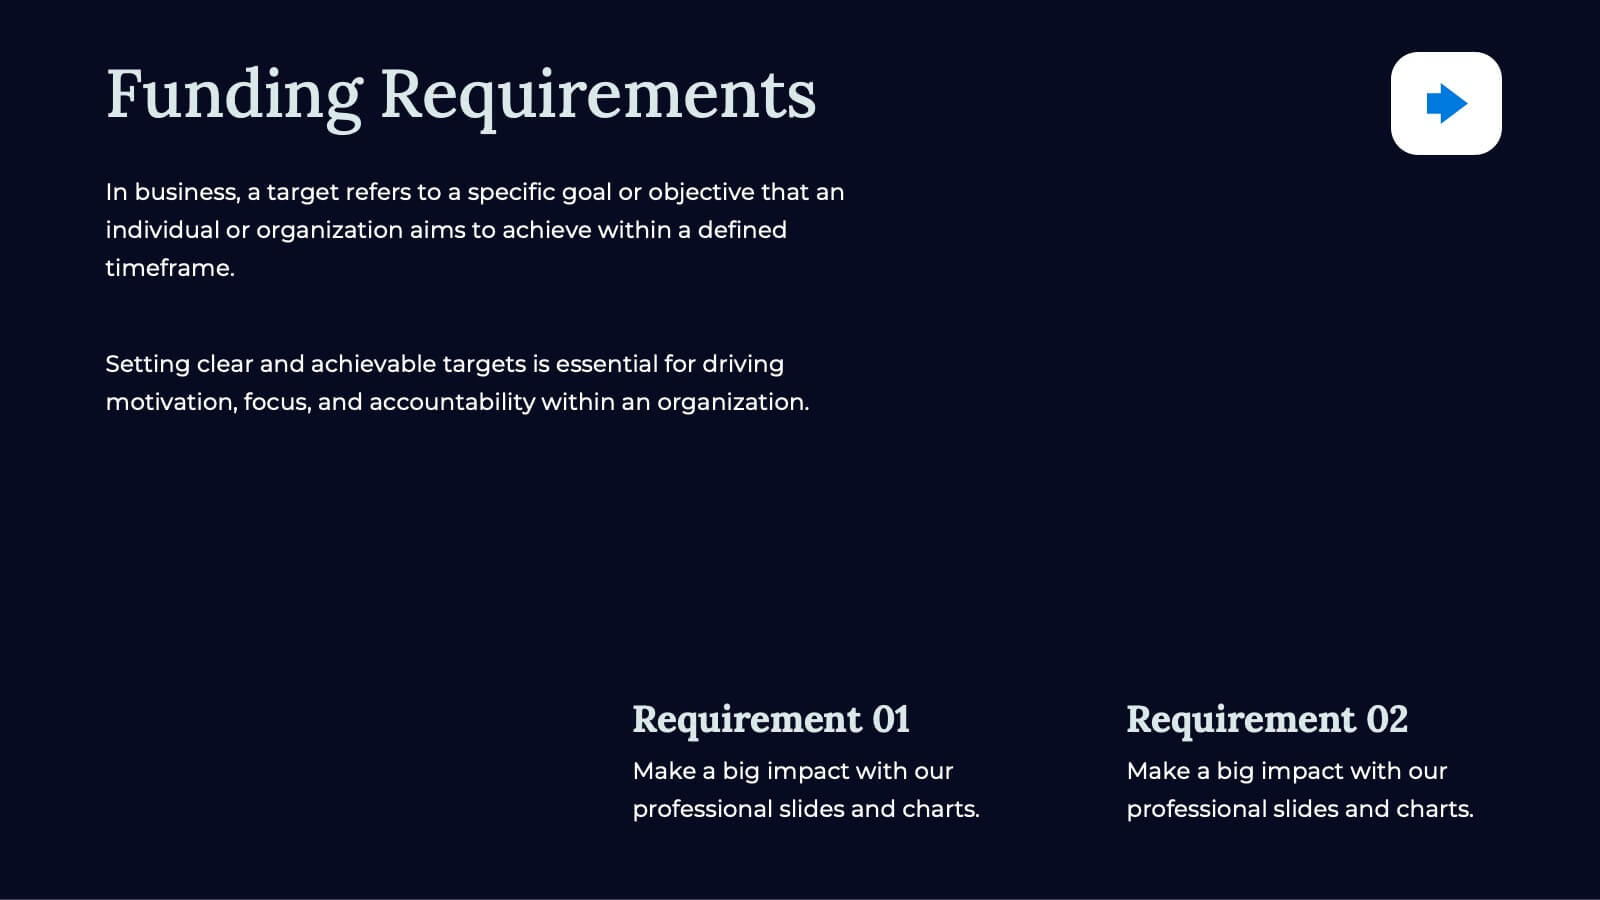
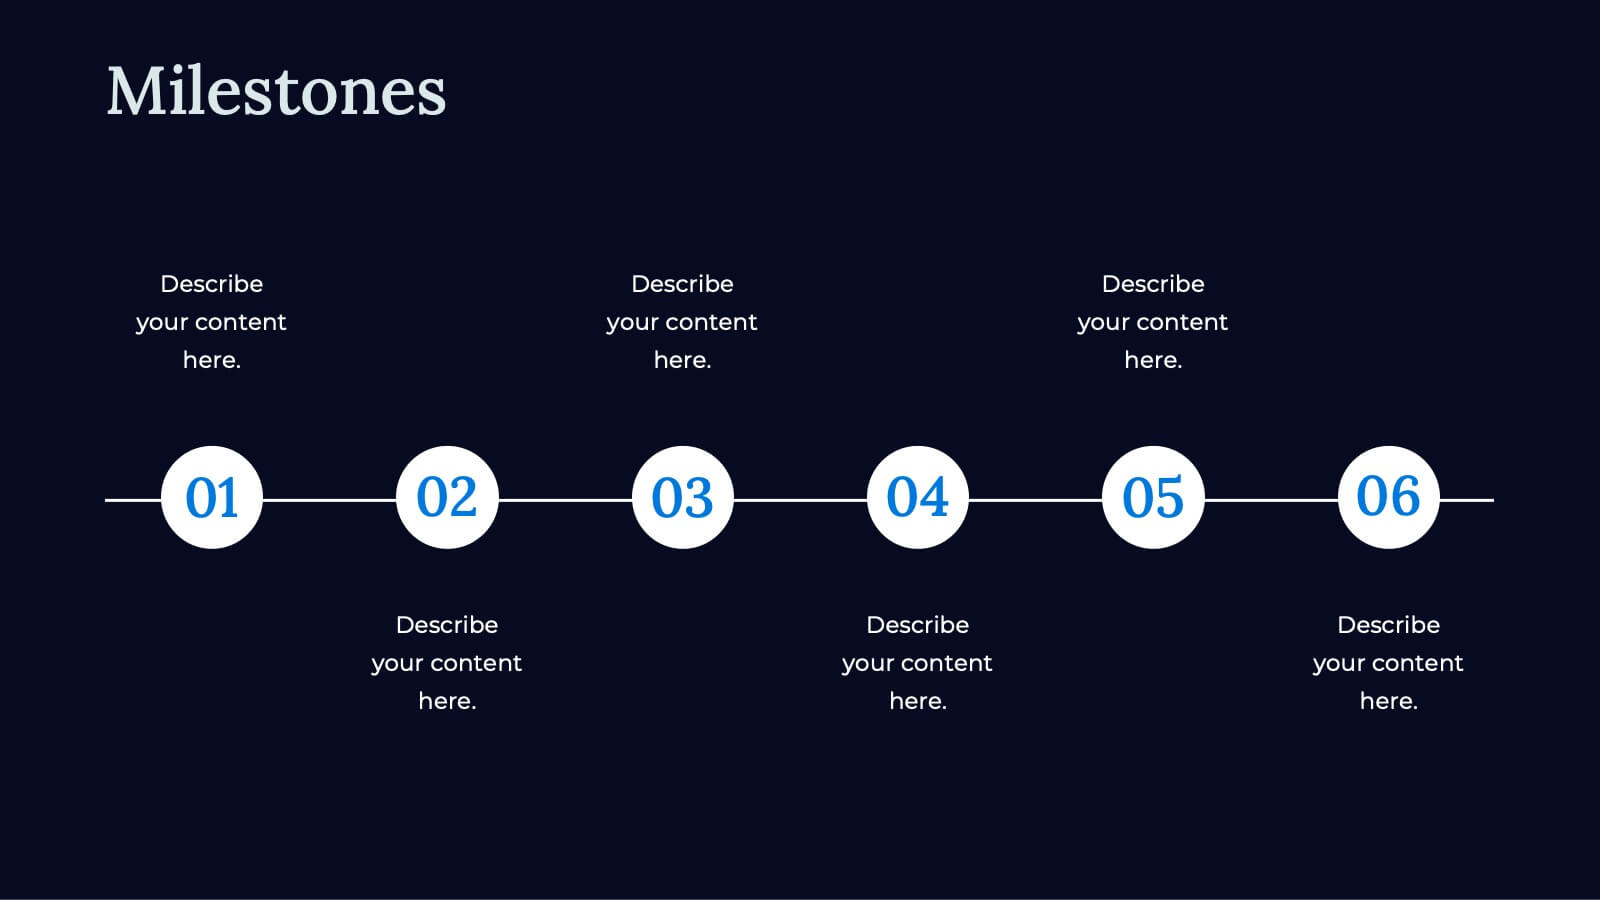
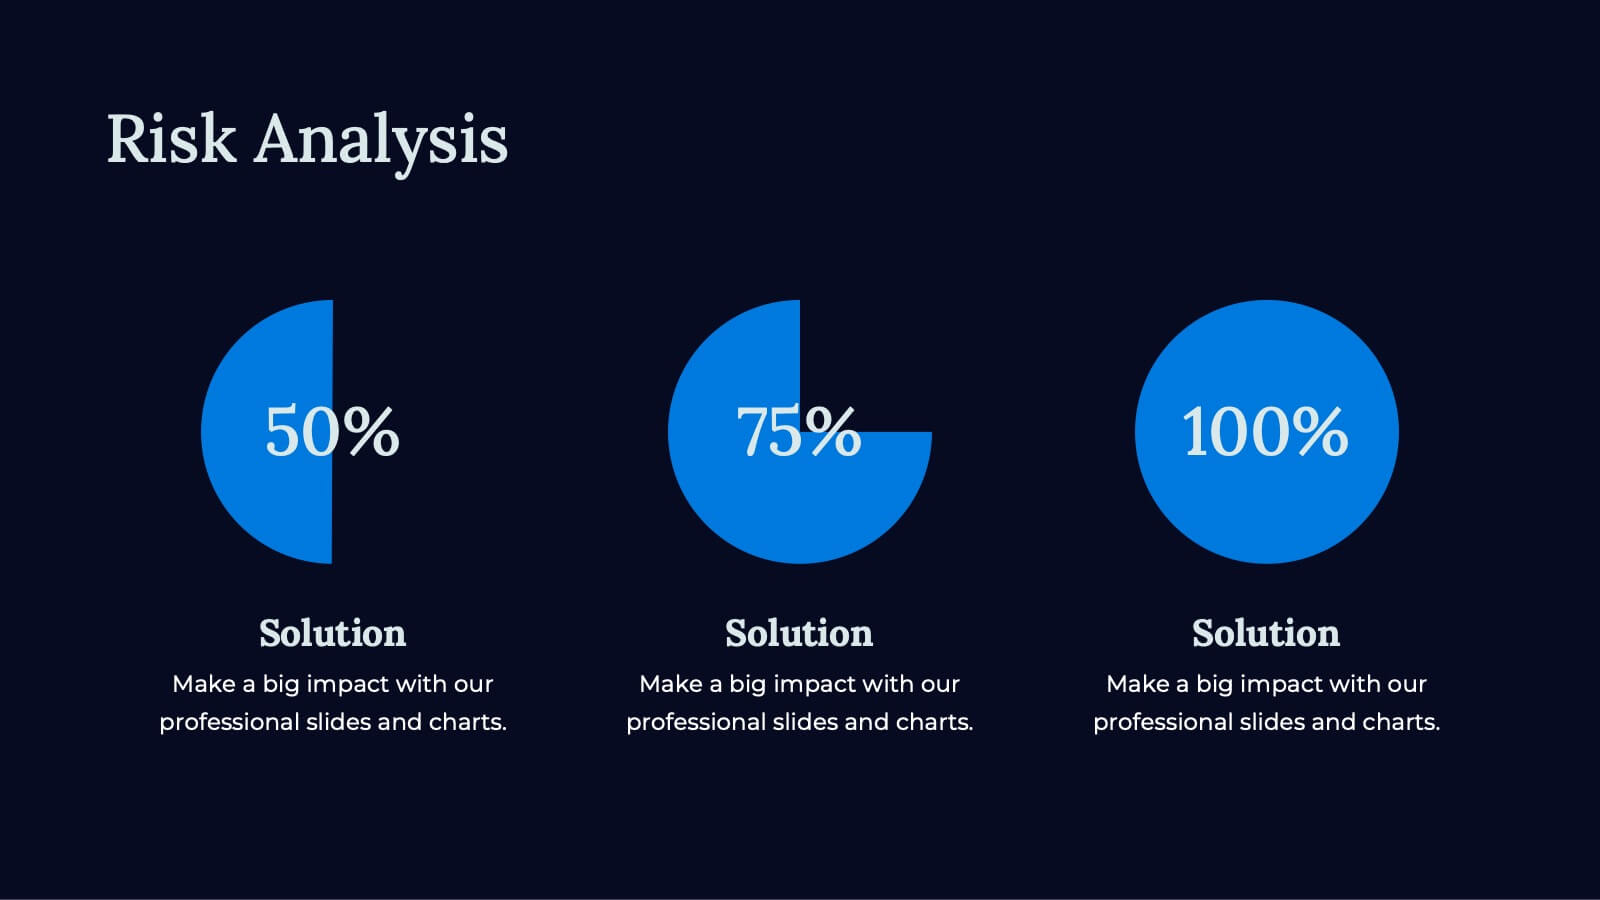
Apex Business Idea Pitch Deck Presentation
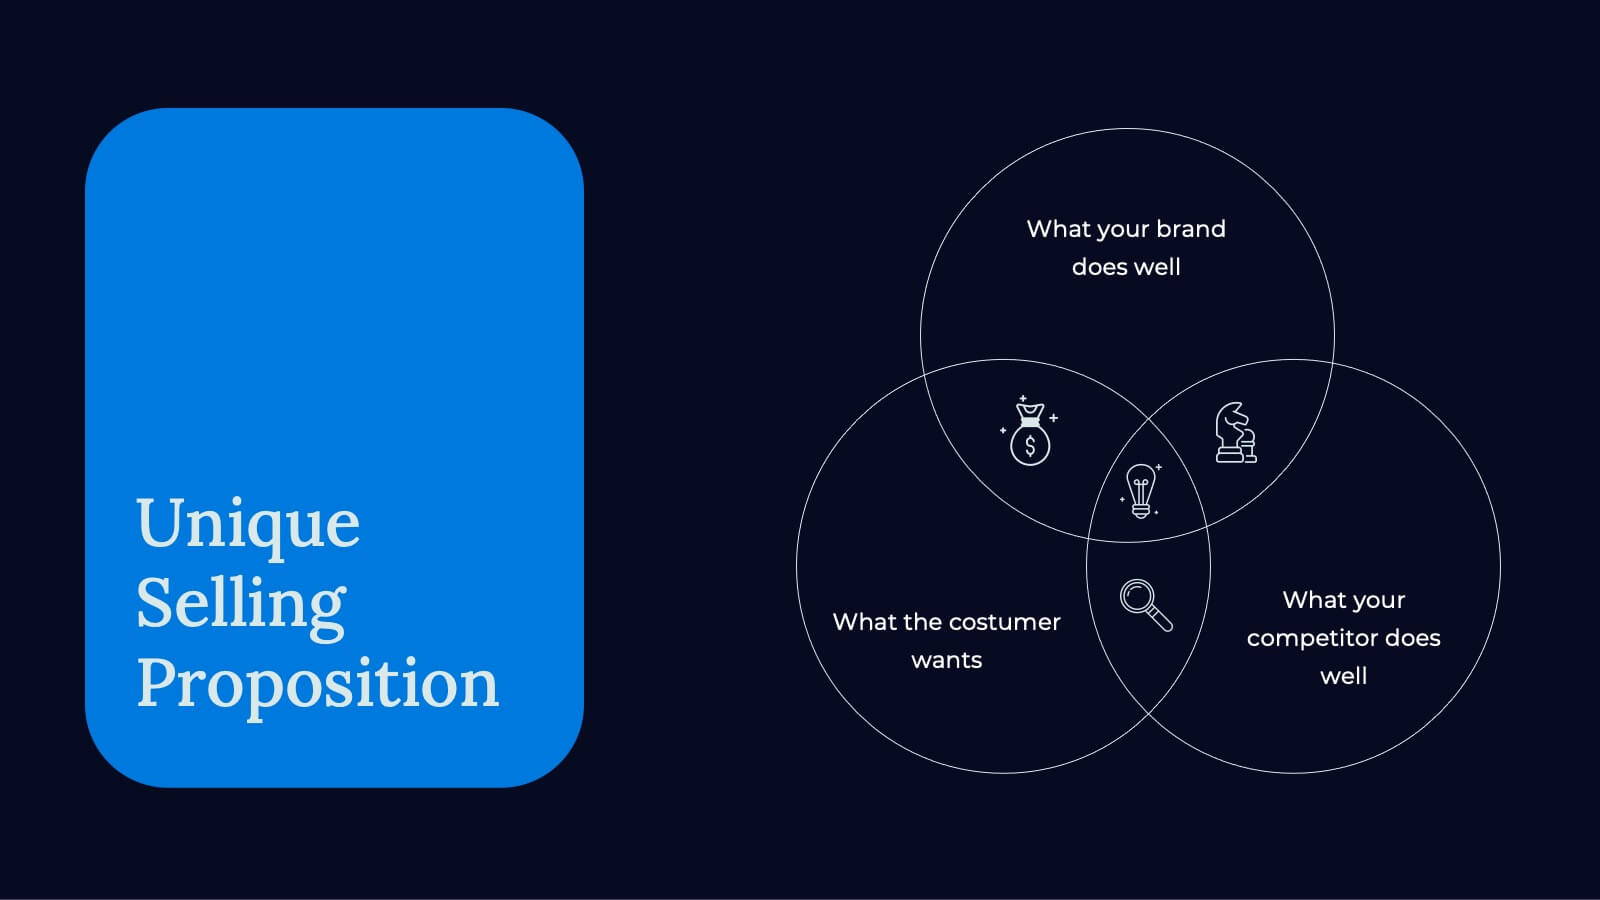
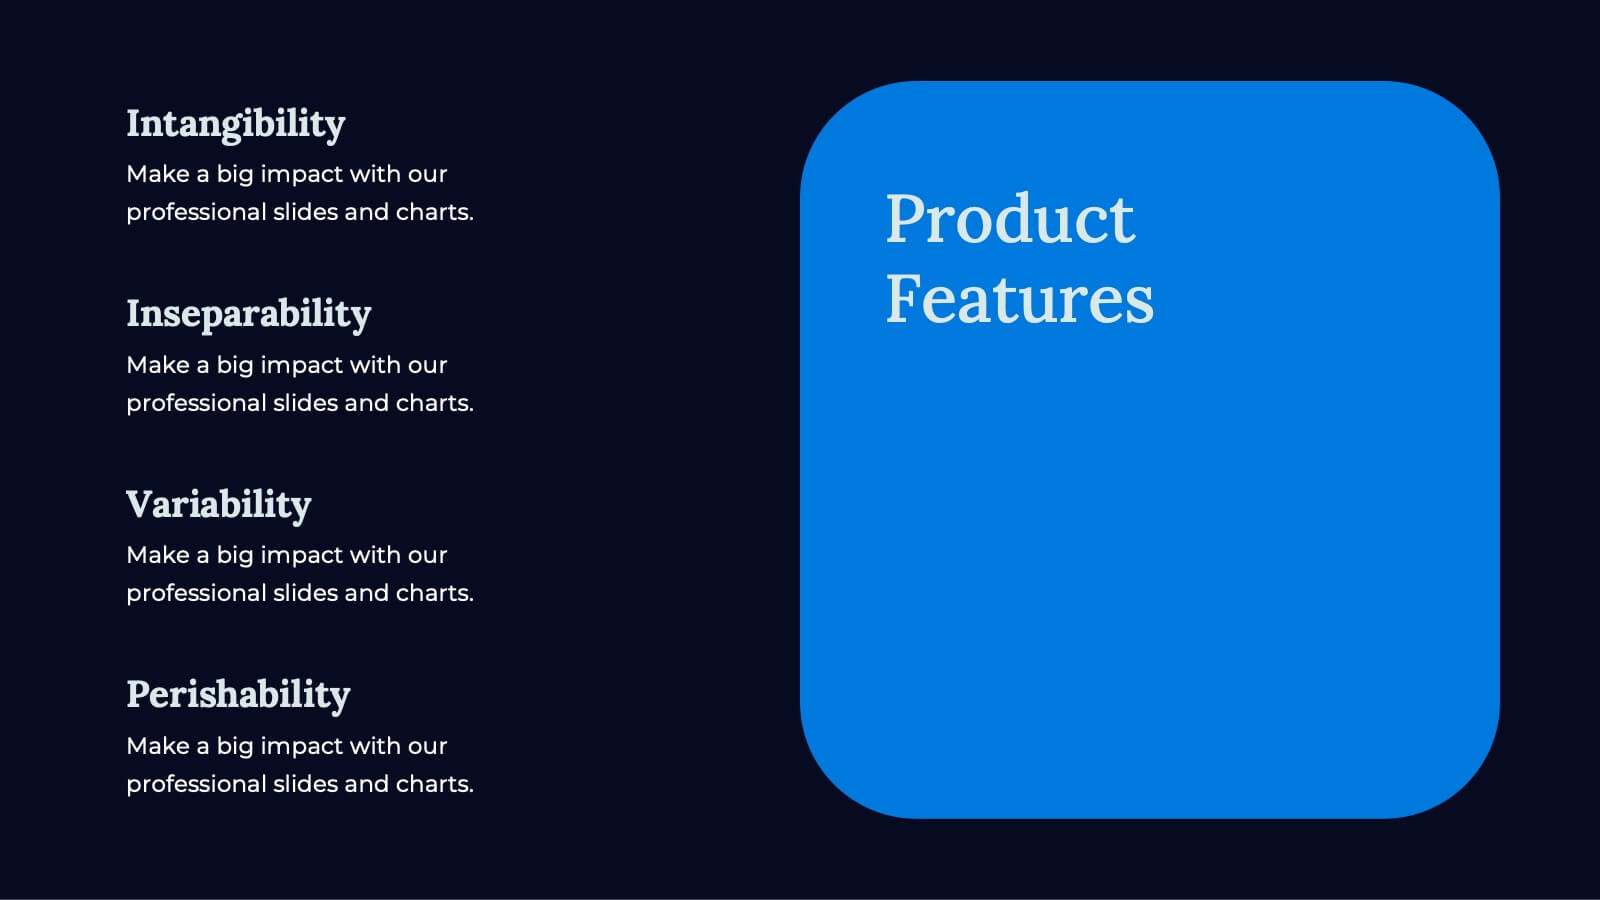
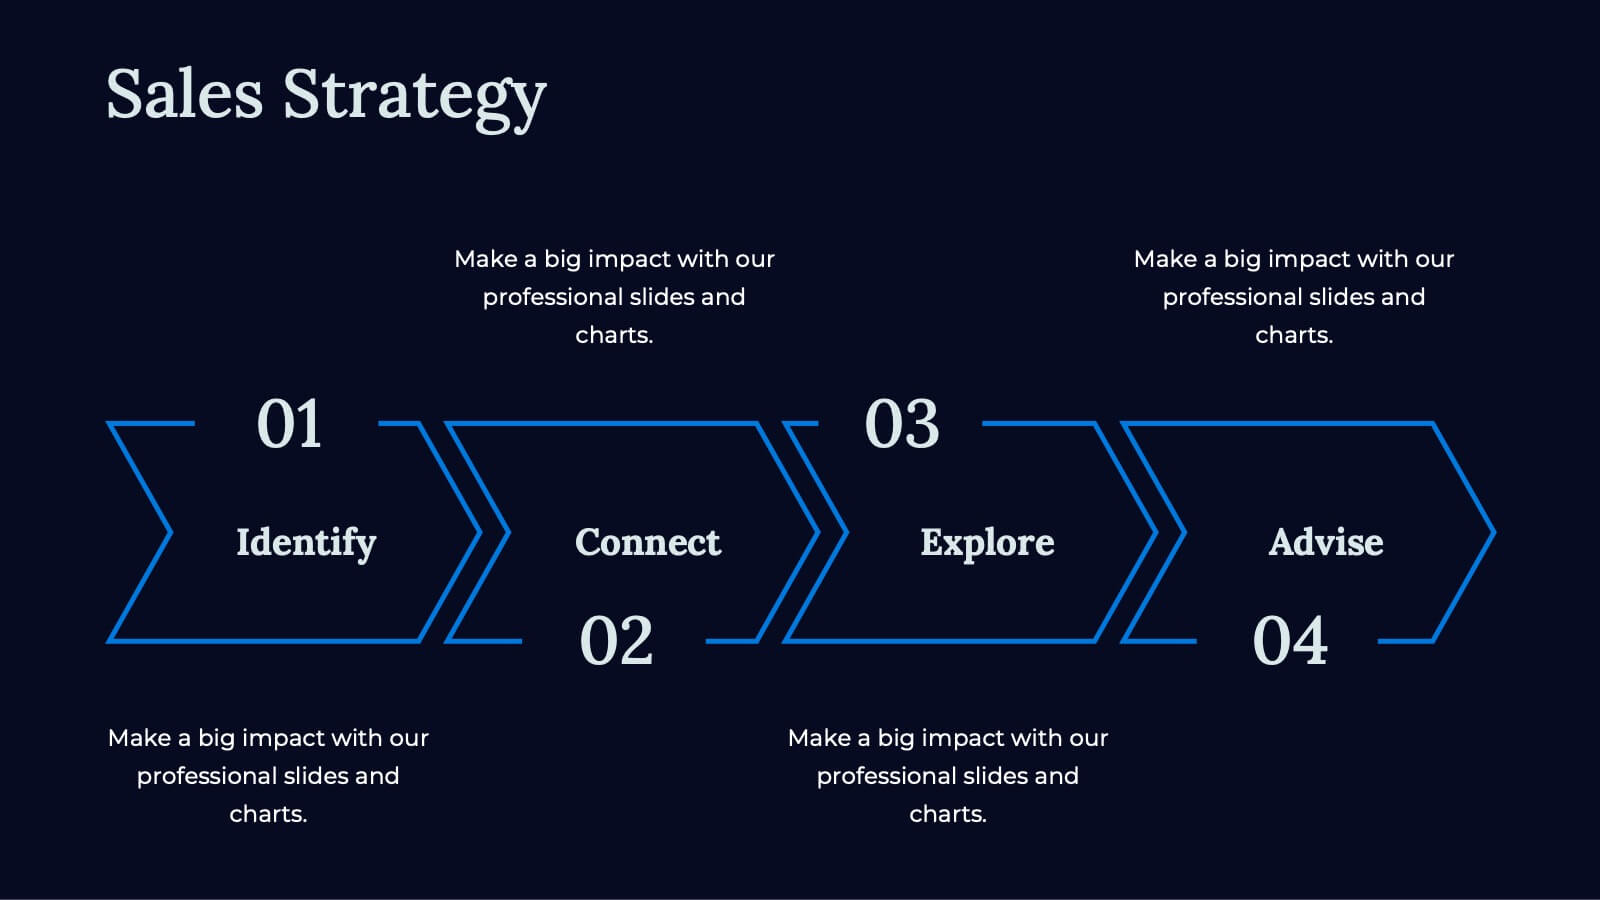
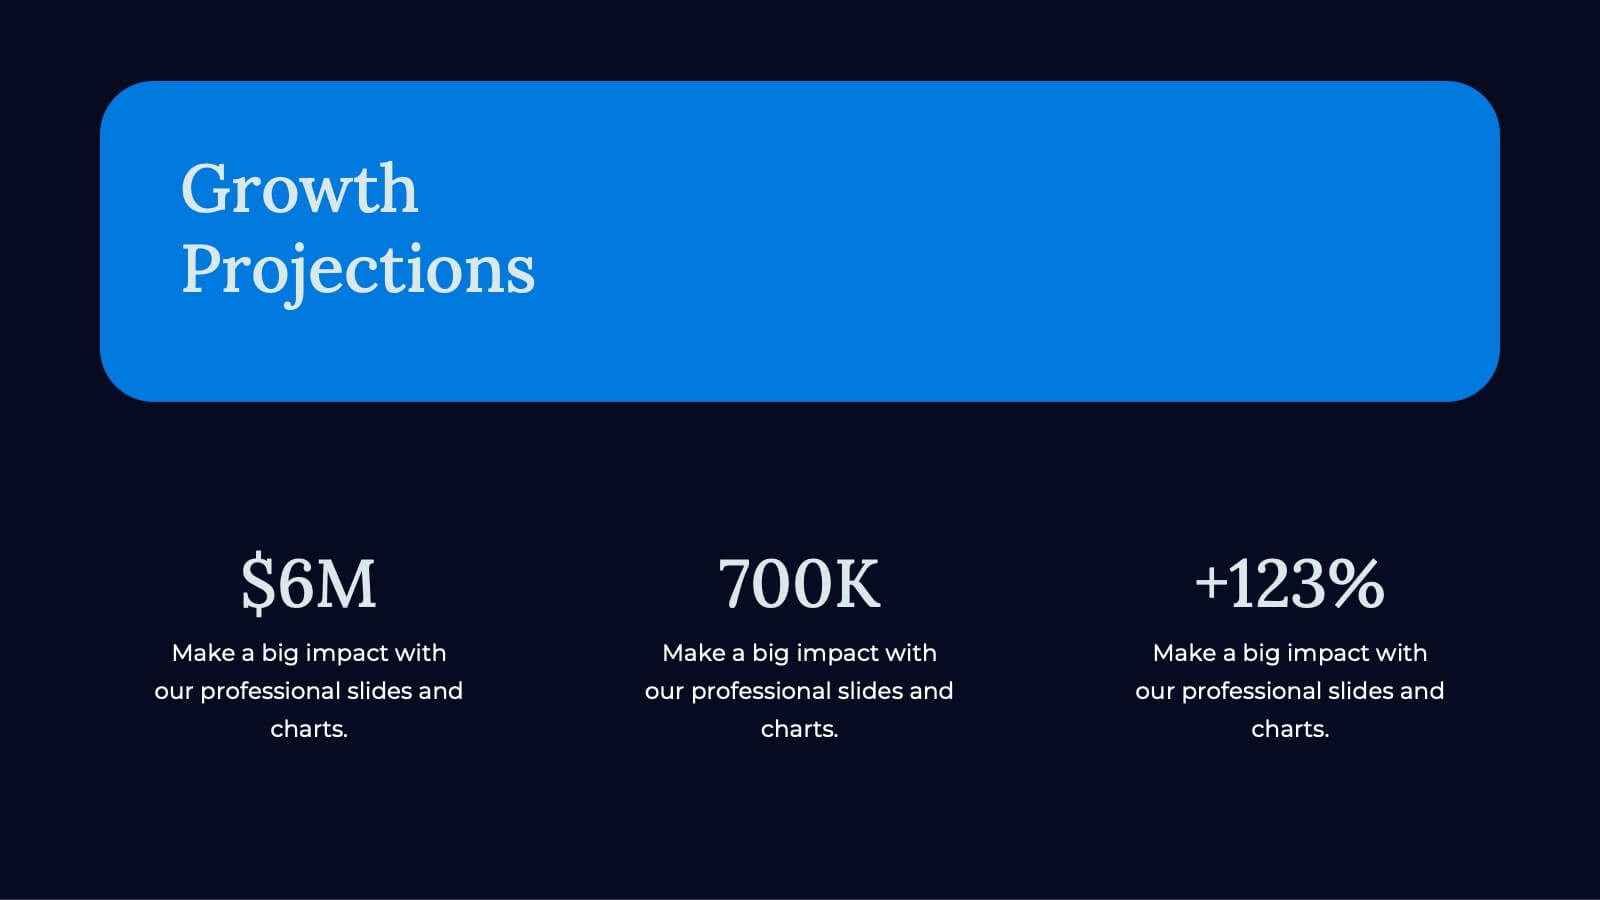
Craft powerful business pitch decks with this sleek template. Present your company overview, problem statement, solutions, and market opportunity. Showcase your business model, revenue model, competitive landscape, and unique selling proposition. Perfect for highlighting financials, growth projections, and funding requirements. Compatible with PowerPoint, Keynote, and Google Slides. Impress investors and stakeholders with clear, concise, and visually appealing presentations.


8 slides
Project Milestones and Deliverables Presentation
Visualize your project’s journey with this step-by-step milestone timeline—ideal for tracking key phases, task ownership, or delivery checkpoints. The diagonal path connects colorful icons and editable text blocks, helping teams align on objectives and timelines. Compatible with PowerPoint, Keynote, and Google Slides.


6 slides
Business Framework Strategy Presentation
Dive into strategic planning with our Business Framework Strategy presentation template. This design brilliantly visualizes the essentials of business frameworks, guiding users through critical insights with a visually appealing, color-coded process. Ideal for strategists and planners, it offers a streamlined way to present complex information effectively. Compatible with PowerPoint, Keynote, and Google Slides, this template is a versatile tool for delivering impactful business strategies.


10 slides
Body System Educational Overview Presentation
Dive into anatomy with a slide that makes learning the human body visual, clear, and interactive. This educational overview breaks down key body systems into simple, labeled sections—perfect for classroom teaching, medical training, or health awareness campaigns. Fully editable and compatible with PowerPoint, Keynote, and Google Slides for seamless customization.


5 slides
Annual Achievements and Highlights Presentation
Celebrate your progress with the Annual Achievements and Highlights Presentation. This timeline-style layout guides viewers along a visual path of milestones year by year. Each pin represents a key accomplishment, backed by icons and editable text for context. Perfect for end-of-year reviews or company retrospectives. Compatible with PowerPoint, Google Slides, and Canva.


6 slides
Amortization Schedule Infographic
An amortization schedule is a detailed table that outlines the repayment of a loan over time. This infographic can be a helpful way to visually explain the repayment schedule of a loan or mortgage. Divide it into sections, including an introduction, explanation of terms, example calculations, and key takeaways. Compatible with Powerpoint, Keynote, and Google Slides. Use icons or visuals to represent loan-related concepts, such as a house for mortgages, a money bag for payments, or a graph for interest rates. The line graphs included can show the decreasing principal balance over time, with interest and principal portions highlighted.


20 slides
Ascent Design Strategy Proposal Presentation
A minimalist and sleek template ideal for presenting design strategy and development. Includes sections for design brief, audience insights, concept development, design elements, prototyping, and feedback. Suitable for design professionals to showcase visual direction and project timelines. Fully customizable in PowerPoint, Keynote, and Google Slides for versatile presentations.


7 slides
Data Governance Infographic
Navigate the world of data management with our governance infographic. Painted in a thoughtful blend of orange, white, and blue, this template simplifies the multifaceted realm of data governance for its viewers. Perfectly tailored for IT professionals, data analysts, business strategists, and educators, it breaks down the key components of data governance in a visually compelling manner. Enriched with custom graphics, icons, and dedicated image placeholders, this tool can transform any presentation into a memorable one. And with compatibility spanning PowerPoint, Keynote, and Google Slides, it’s designed for universal appeal.


5 slides
Visual Mind Connections Bubble Chart
Present interconnected ideas with clarity using the Visual Mind Connections Bubble Chart Presentation. This diagram helps map key points around a central concept, making it perfect for brainstorming, strategy sessions, or educational content. Easy to customize in PowerPoint, Keynote, or Google Slides. Ideal for teams, coaches, and presenters.


24 slides
Petricor UX Strategy Plan Presentation
This UX Strategy Presentation offers a structured approach to user experience design, covering key aspects such as user research, wireframing, prototyping, and usability guidelines. With sections on branding, responsive design, and accessibility, this template is ideal for UX professionals. Fully editable and compatible with PowerPoint, Keynote, and Google Slides.


3 slides
Service and Product Benefits Overview Presentation
Clearly contrast key features with the Service and Product Benefits Overview Presentation. This modern split-layout design helps you showcase differences between service offerings and tangible products in a clean, side-by-side format. Use it to highlight value propositions, customer benefits, or decision-making factors. Fully editable and compatible with PowerPoint, Keynote, and Google Slides.


7 slides
Decision Process Infographic Presentation
A Structured Decision Process is crucial for individuals and organizations to make informed and effective decisions. This is a flexible template that allows you to create your presentation using PowerPoint, Google Slides or Keynote. It includes decision illustrations so that you have everything you need to explain the decision and to present the pros and cons of each option. With a stylish design and eye-catching elements you can use this infographic for presentations of any kind. For promoting a new product or service, making recommendations or simply to explain your next steps and decisions.


26 slides
Wedding Planner Company Profile Presentation
A wedding planner company is a specialized service provider that assists couples in planning, organizing, and coordinating their wedding day. This beautiful template is tailored for wedding planning companies looking to showcase their services and expertise. With this presentation, wedding planners can present their company's unique offerings, experience, and past successful events in an engaging and elegant manner. This presentation features an elegant and romantic design that reflects the essence of weddings. It incorporates soft colors, floral patterns, and beautiful imagery to create a sophisticated and enchanting atmosphere.


21 slides
Eidora Qualitative Research Findings Presentation
Present your research findings with confidence using this professional and stylish presentation template. Covering key sections like objectives, methodology, data analysis, and recommendations, it helps you communicate complex information with clarity and impact. Perfect for academic or business use. Compatible with PowerPoint, Keynote, and Google Slides for easy customization.