


Features
- 21 Unique Slides
- Fully editable and easy to edit in Microsoft Powerpoint, Keynote and Google Slides
- 16:9 widescreen layout
- Clean and professional designs
- Export to JPG, PDF or send by email


Do you have any questions?
Recommend


27 slides
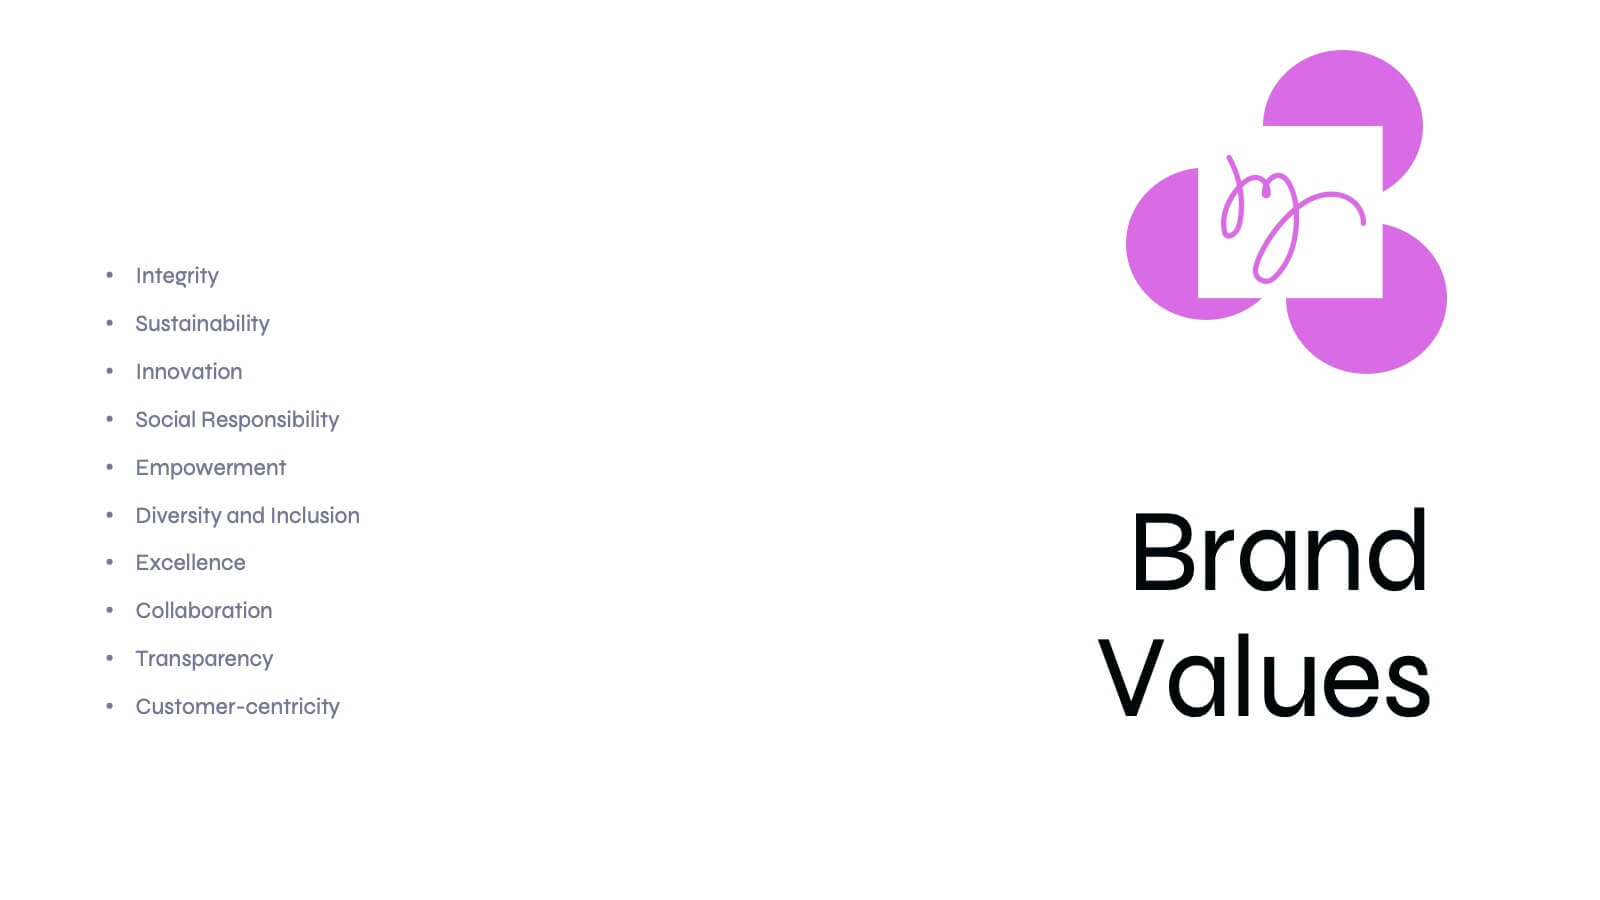
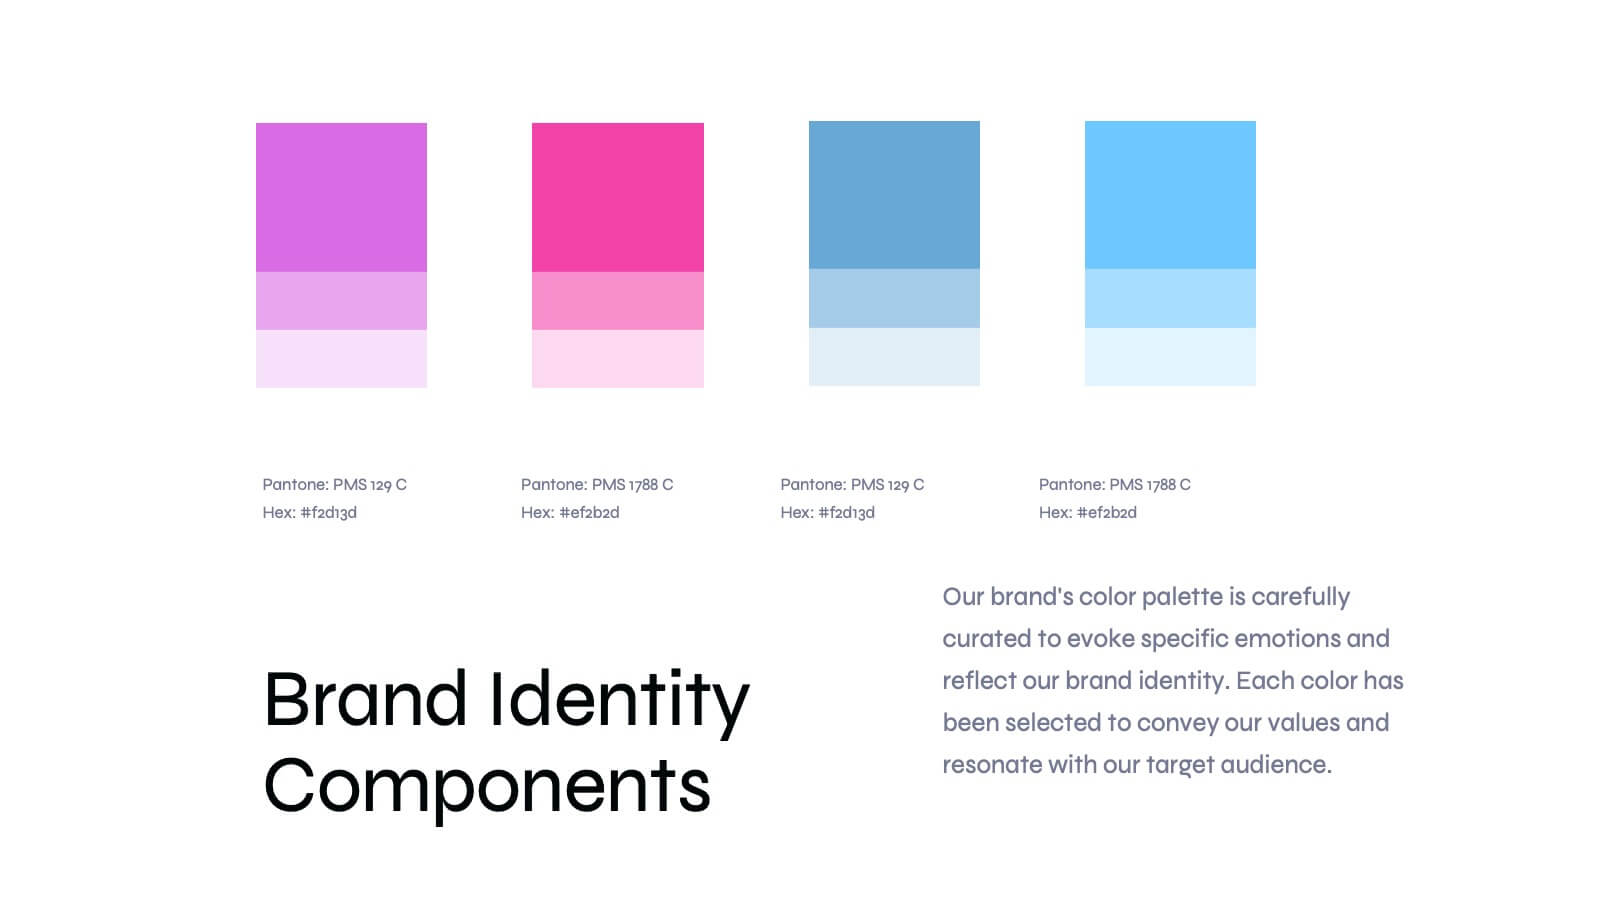
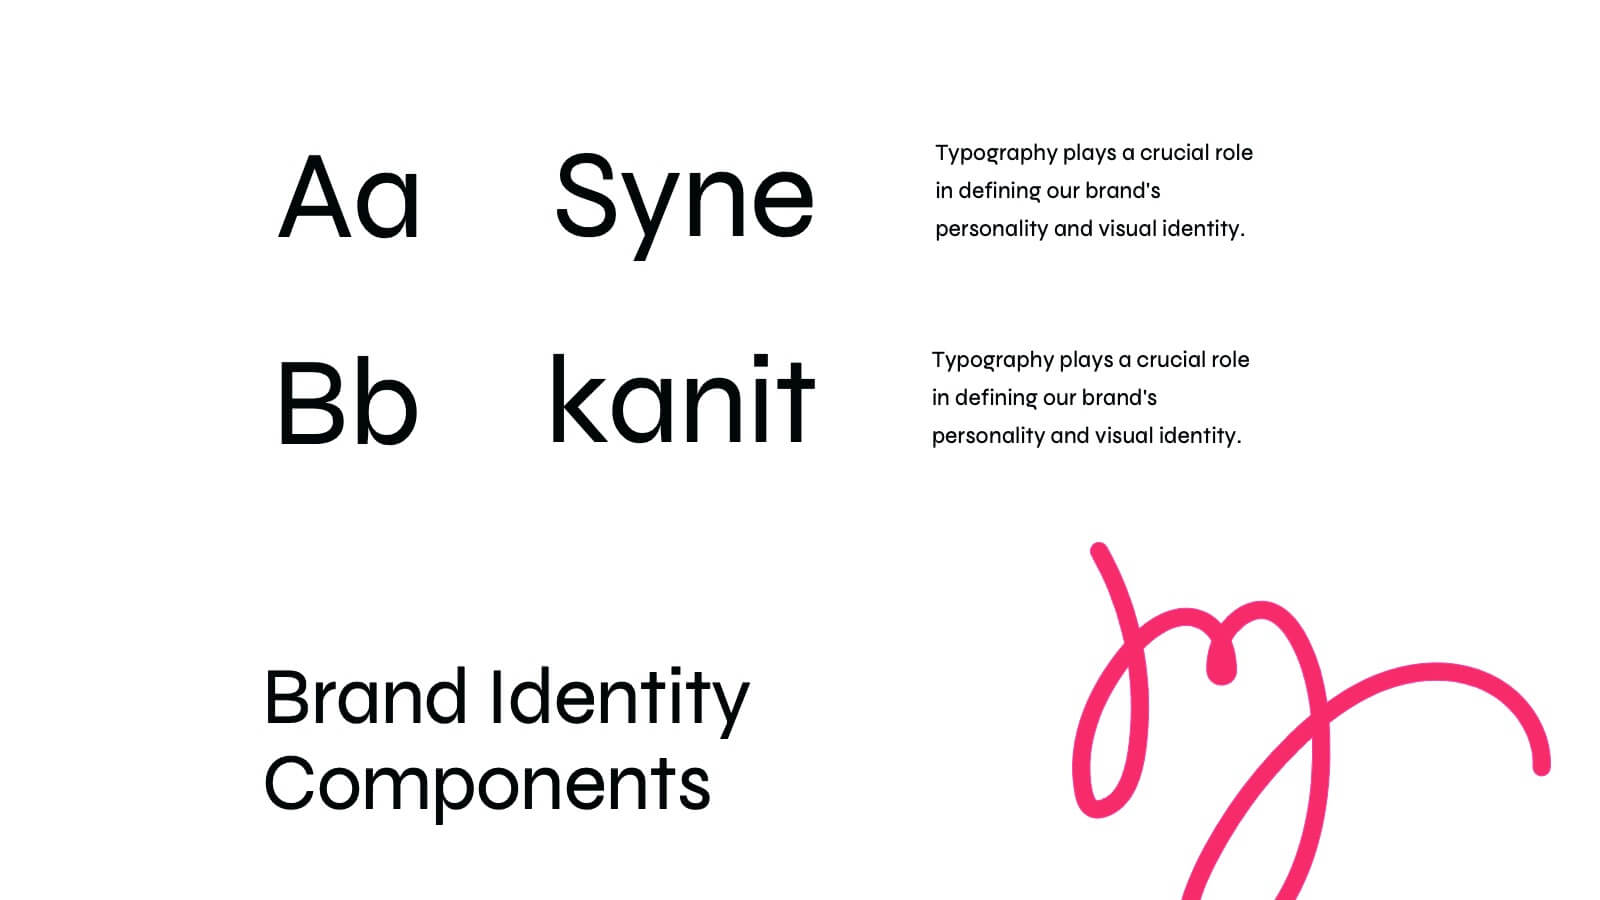
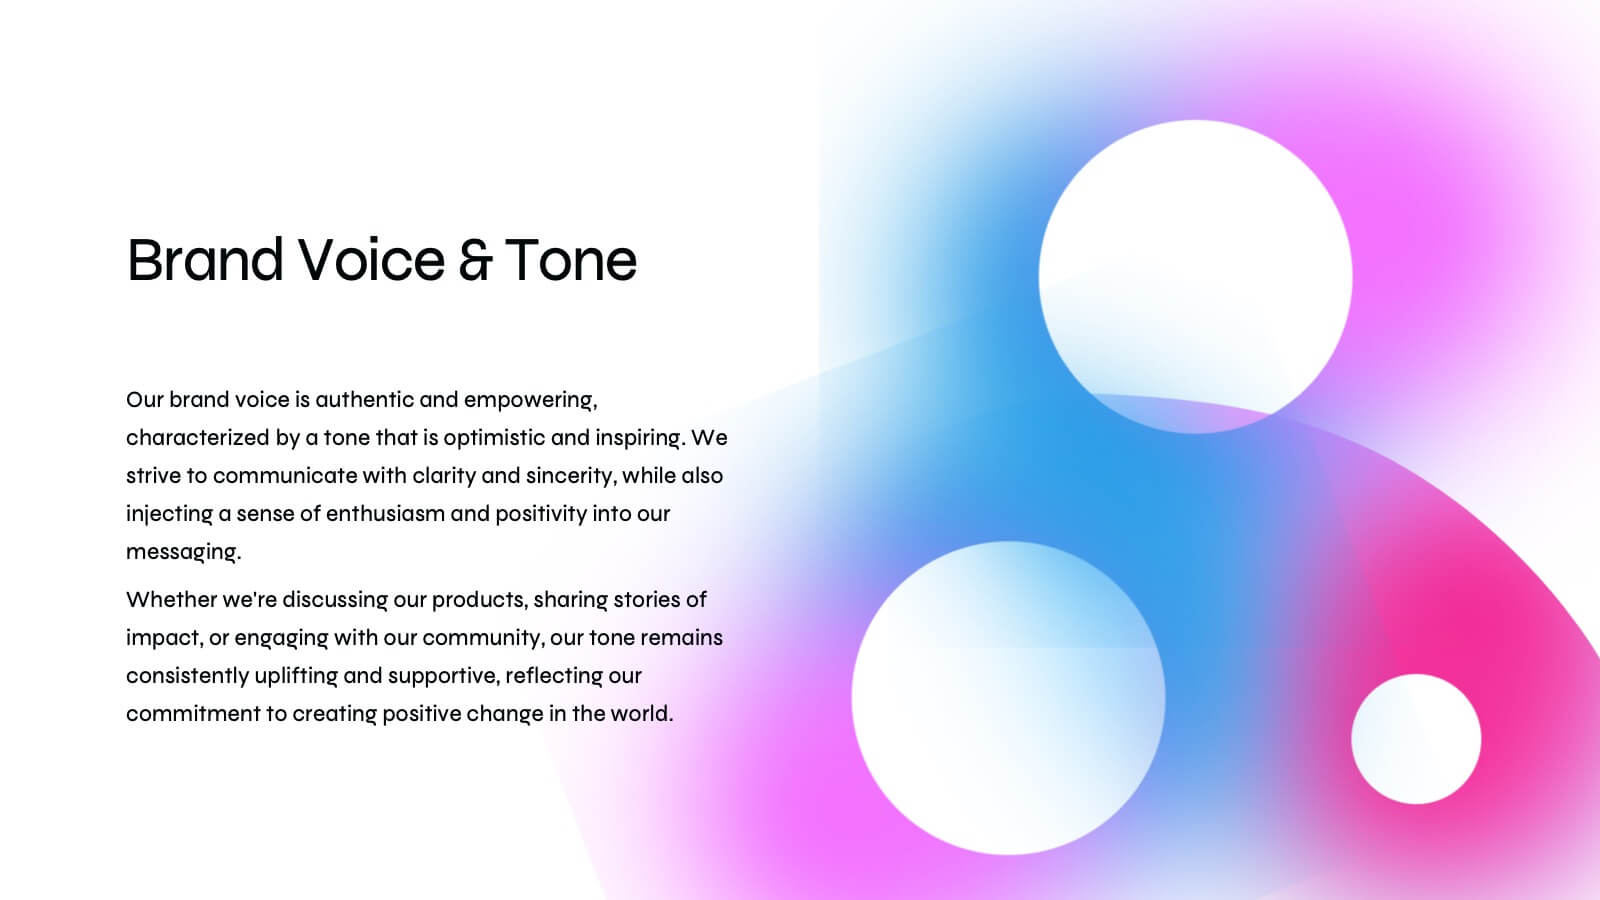
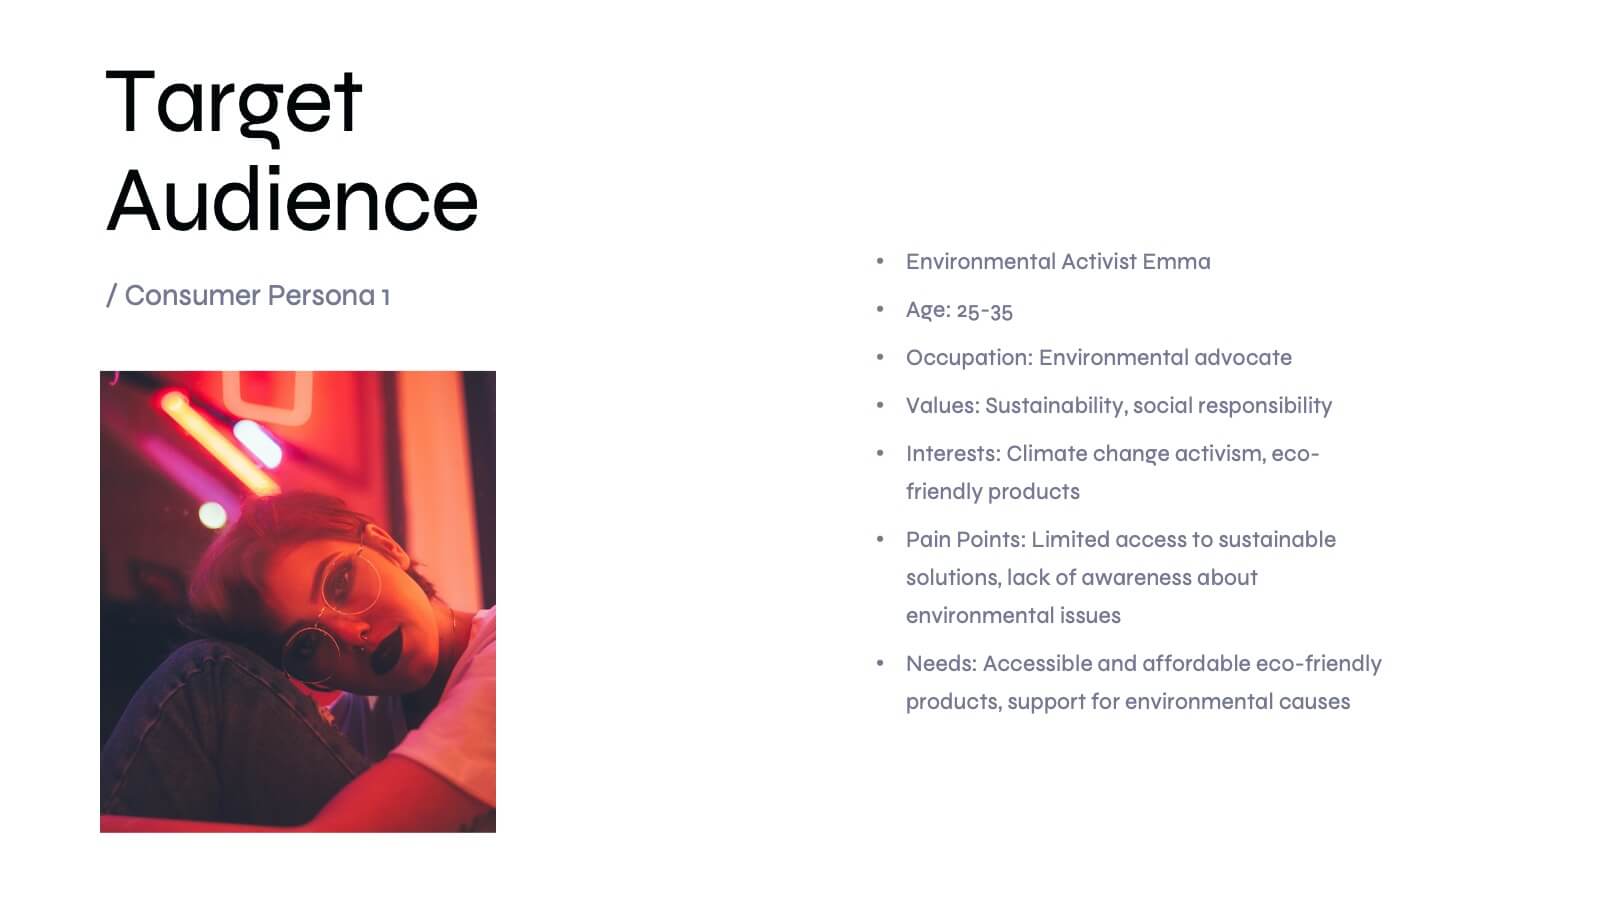
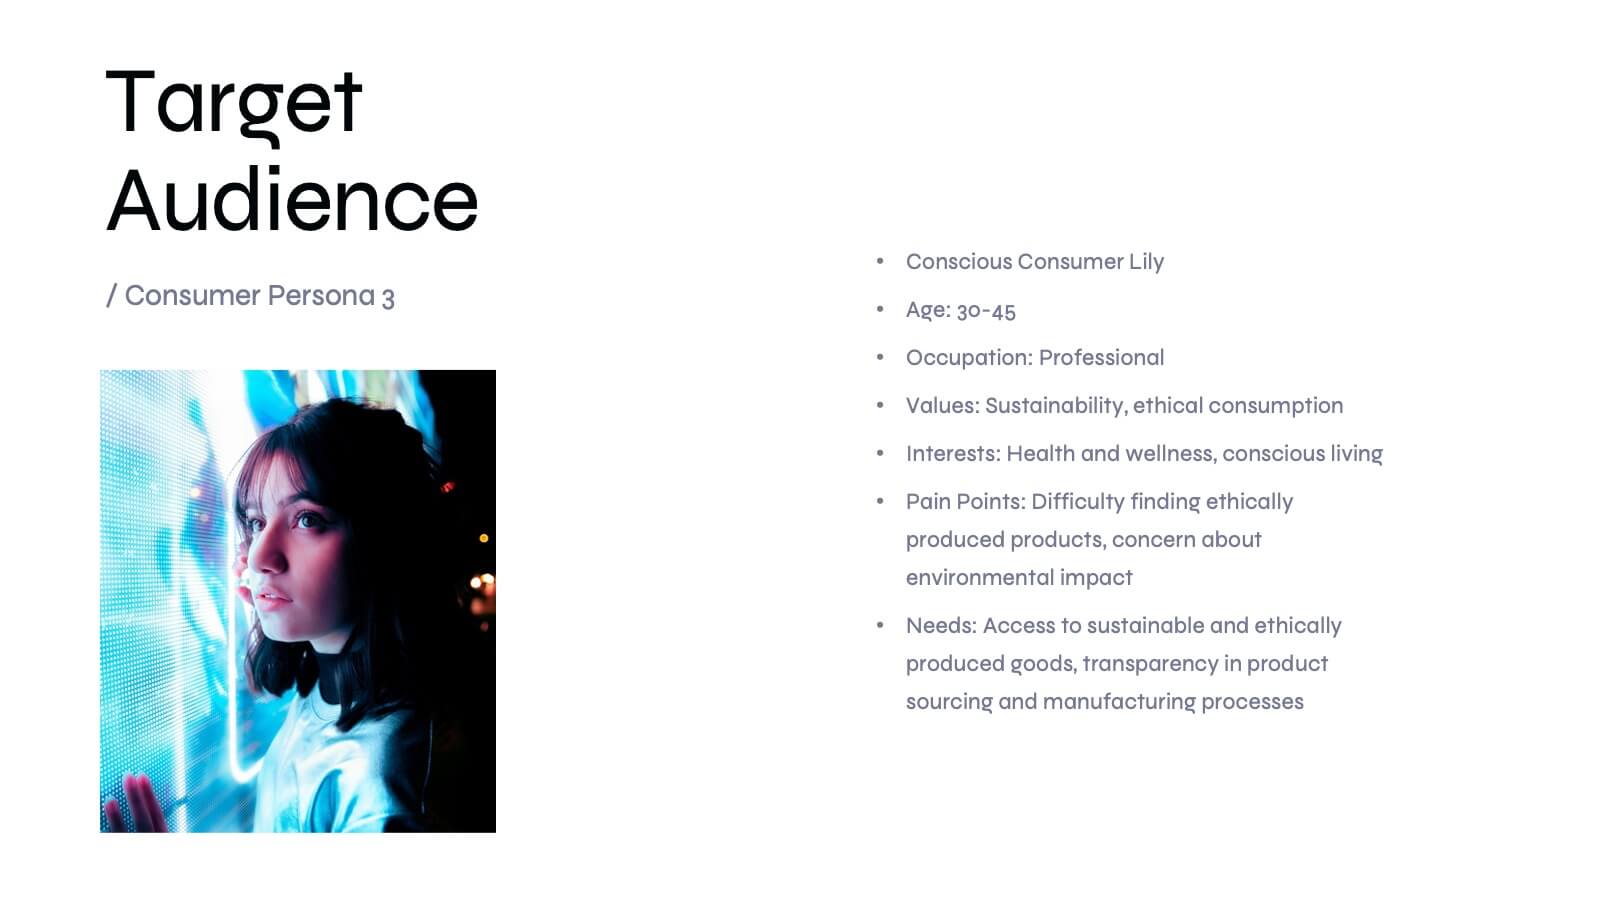
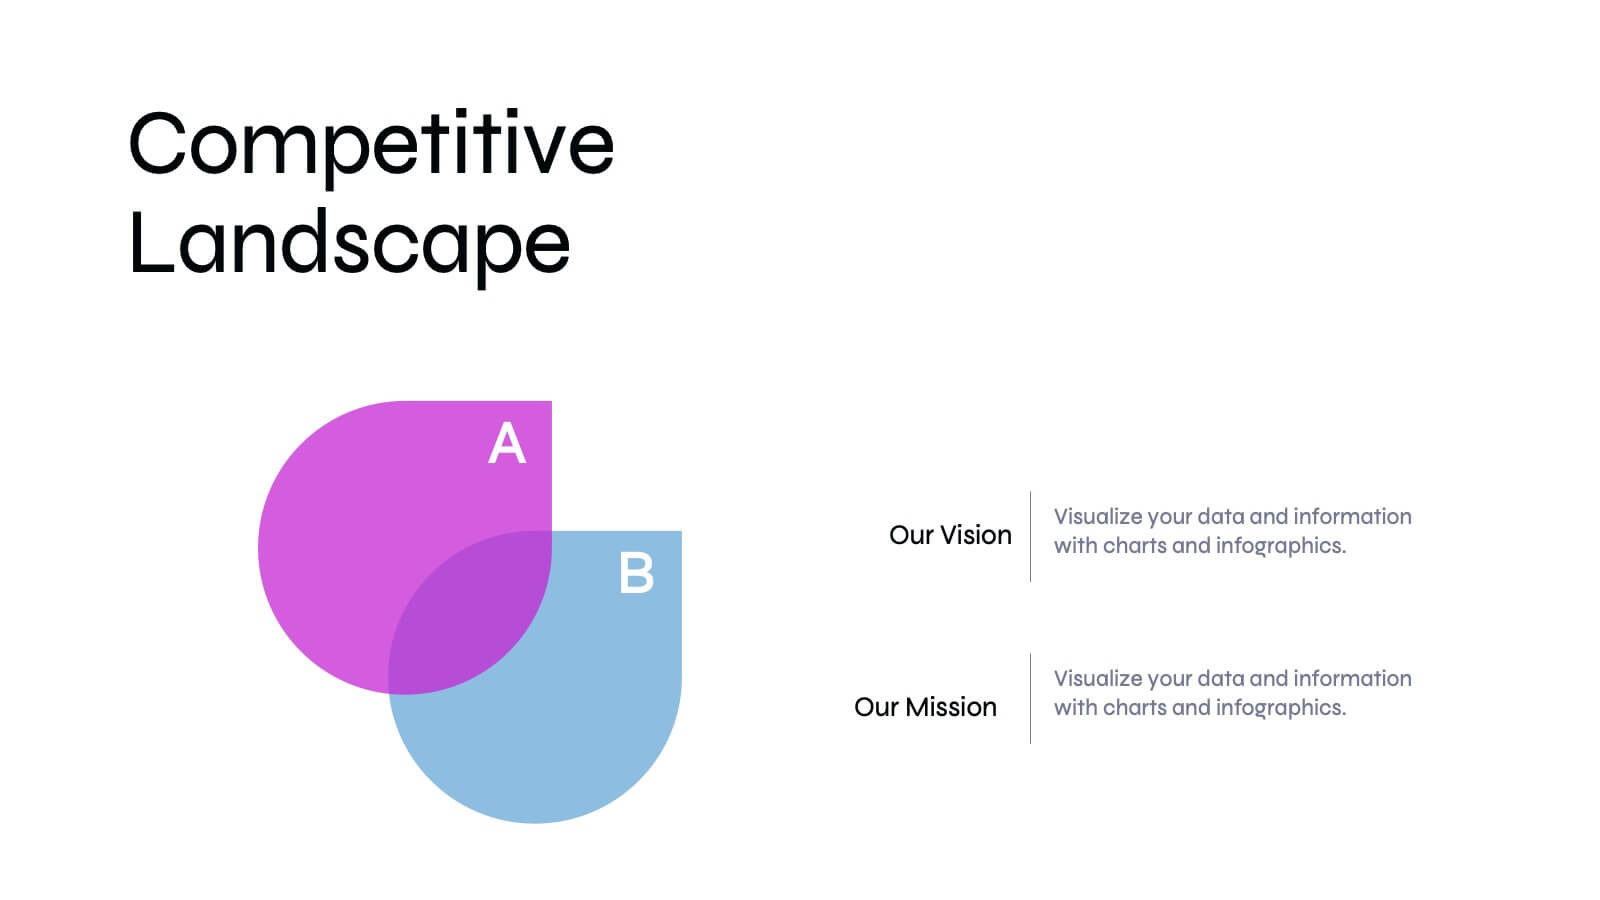
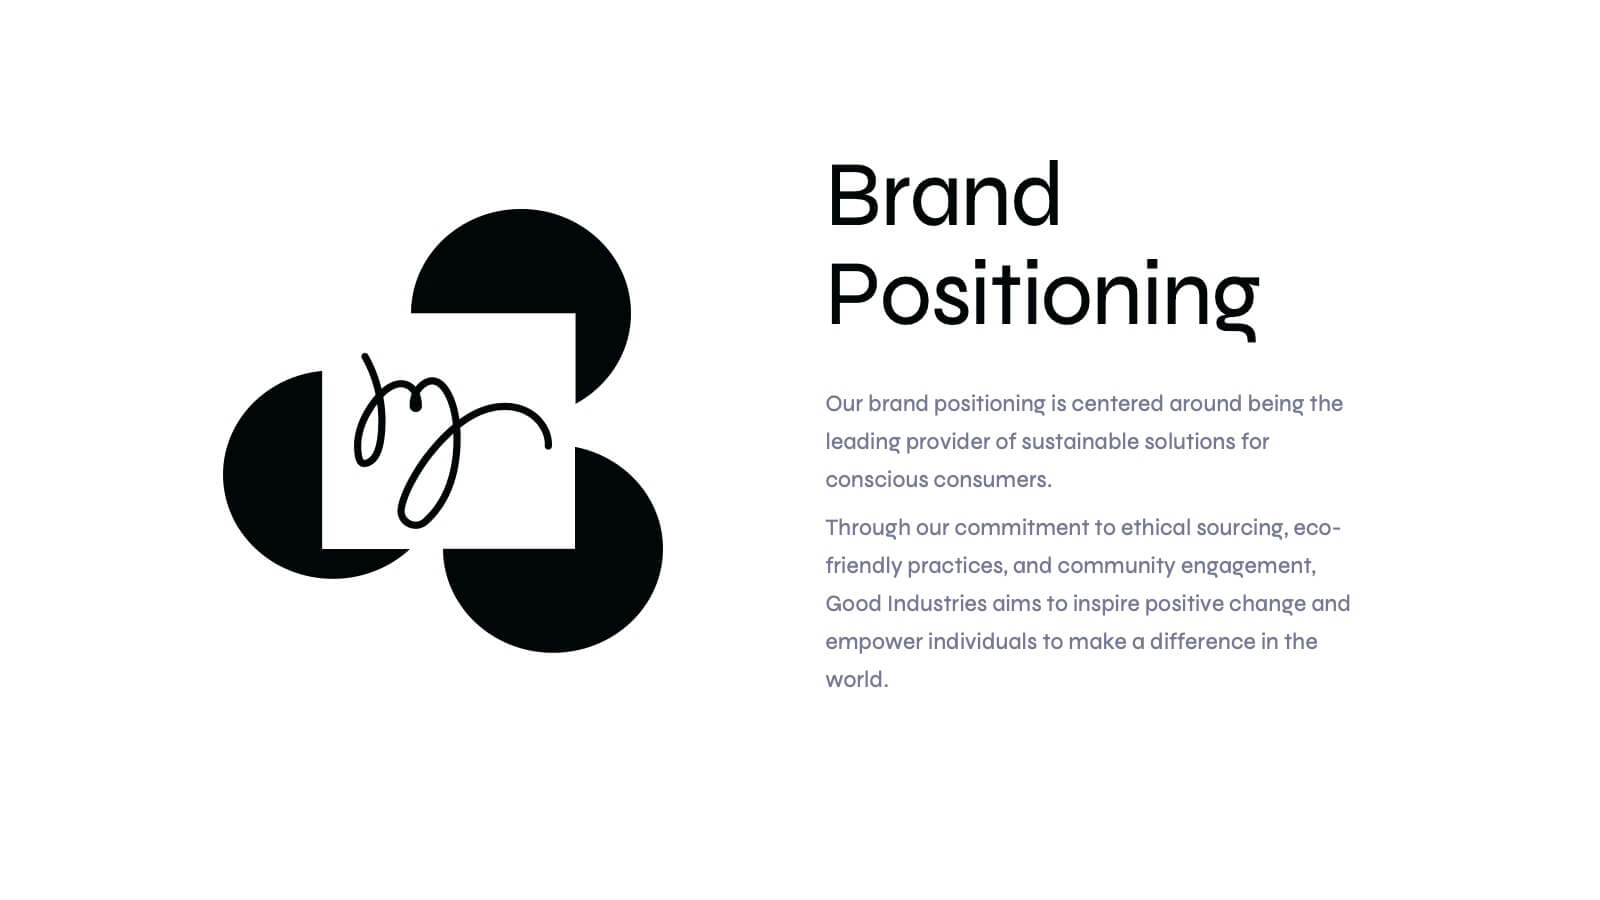
Basilisk Brand Guidelines Proposal Presentation
Present your brand strategy effectively with this modern brand guidelines proposal template! It includes sections for brand vision, values, identity, and market analysis. Fully customizable and compatible with PowerPoint, Keynote, and Google Slides, it’s perfect for showcasing your brand's identity and ensuring consistency across all platforms.


5 slides
User Experience Survey Findings Presentation
Present key insights from your user research in a clean and impactful way with this survey findings slide. Designed to highlight percentages and categories clearly, it helps your audience quickly understand what users value most. Ideal for UX reports and product feedback reviews. Fully compatible with PowerPoint, Keynote, and Google Slides.


10 slides
Home Office Scenes and Teamwork Presentation
Capture the modern remote work environment with this clean and visual layout. Featuring an illustrated home office scene on one side and four color-coded percentage blocks with text on the other, this template is ideal for presenting team productivity metrics, remote collaboration stats, or flexible work insights. Fully customizable in PowerPoint, Keynote, and Google Slides to match your brand.


4 slides
Island Nations & Business Opportunity Map Presentation
Spotlight key business opportunities across island nations with the Island Nations & Business Opportunity Map Presentation. This slide includes a world map with customizable markers and labels, ideal for showcasing strategic locations, growth markets, or project hubs. Easy to edit in Canva, PowerPoint, and Google Slides to match your brand.


4 slides
IT Network Infrastructure
Simplify the complexity of your digital ecosystem with this IT Network Infrastructure presentation. Designed to visualize connectivity, servers, and system architecture, this layout is perfect for IT teams, consultants, and tech-focused reports. Fully editable in PowerPoint, Keynote, and Google Slides for seamless integration into your workflow.


26 slides
The Impact of 5G Technology Presentation
Step into the future with this insightful presentation on the impact of 5G technology. Covering key areas like faster connectivity, IoT advancements, industry applications, and potential challenges, this template helps you break down complex concepts with clarity. Fully customizable and compatible with PowerPoint, Keynote, and Google Slides for a seamless presentation experience.


5 slides
Root Cause Business Problem Slide
Uncover the foundation of complex challenges with this tree-inspired slide—perfect for visualizing root causes behind business problems. Showcase contributing factors at each root to guide effective solutions. Fully editable in PowerPoint, Keynote, and Google Slides.


3 slides
Transportation Services Workflow Presentation
Showcase your delivery process with clarity. This template tracks each transportation step—from port to truck to doorstep—with minimal, modern visuals and editable callouts. It’s perfect for workflow overviews, operations planning, or client onboarding. Use it in PowerPoint, Keynote, or Google Slides without losing style or structure.


4 slides
Key Pillar Infographic Slide Presentation
Make your ideas stand tall with this modern pillar-themed infographic layout. Perfect for illustrating strategies, business foundations, or organizational principles, it transforms complex data into visually clear, structured visuals. Fully editable and compatible with PowerPoint, Keynote, and Google Slides for professional and easy-to-customize presentations.


10 slides
Data Security and Privacy Measures Presentation
Illustrate your protection protocols clearly with the Data Security and Privacy Measures presentation slide. Featuring a smartphone icon secured with lock, shield, and magnifying glass elements, this layout is ideal for communicating encryption policies, access controls, and compliance steps. Fully editable in PowerPoint, Keynote, and Google Slides.


22 slides
Glidebeam Content Marketing Pitch Deck Presentation
Capture your audience’s attention and showcase your marketing strategy with confidence using this polished and thoughtfully designed marketing pitch deck. It covers key elements like company history, target audience, competitive landscape, financial highlights, and growth strategies. Ideal for pitches or meetings, it’s compatible with PowerPoint, Keynote, and Google Slides.
5 slides
Performance Tracking via Dashboard Widgets Presentation
Visualize performance at a glance with the Performance Tracking via Dashboard Widgets Presentation. This slide layout blends progress tiles, bar charts, and dynamic line graphs to display key metrics over time. Ideal for showcasing reseller performance, goal progress, or trend comparisons in one compact dashboard view. Fully editable in PowerPoint, Google Slides, Keynote, and Canva


6 slides
Executive Summary Slide Deck Presentation
Kick off your message with a slide that instantly pulls everything together in a clean, engaging flow. This presentation helps you highlight key insights, outline major updates, and present essential takeaways with clarity and structure. Ideal for meetings, reports, and leadership briefs. Fully compatible with PowerPoint, Keynote, and Google Slides.


20 slides
Solar Beam Sales Proposal Presentation
Supercharge your sales presentation with the Solar Beam Sales Proposal template! This vibrant and dynamic template is designed to capture attention and drive home your key points with flair. Start with a bold introduction, then seamlessly guide your audience through your company overview, product/service details, and target market analysis. Highlight your sales objectives, showcase your team, and provide compelling customer testimonials. With dedicated slides for pricing strategies, sales collateral, and performance metrics, you’ll have all the tools you need to make a persuasive pitch. The template also includes sections for discussing future opportunities, action plans, and a Q&A session to address any final questions. Its modern, professional design ensures that your proposal stands out in any setting. Fully customizable and compatible with PowerPoint, Keynote, and Google Slides, this template is your go-to for creating impactful sales presentations that leave a lasting impression.


34 slides
Dragon Startup
Introducing our Dragon Start-up Template! This template is designed with a vibrant and energetic yellow color palette, perfect to convey a sense of optimism, creativity, and innovation. It features customizable slides that are specifically tailored for start-up presentations. The slides included cover various aspects of your pitch deck, such as company overview, problem statement, solution description, market analysis, business model, financial projections, and more. Each slide in this template is designed with a dynamic layout, featuring eye-catching yellow accents that add a sense of energy and excitement to your presentation.


10 slides
Corporate Framework and Structure Presentation
Clearly define your corporate framework and structure with this professional infographic template. Ideal for executives, team leaders, and project managers, this slide visually organizes organizational hierarchy, roles, and key responsibilities in a clean and structured layout. Fully editable in PowerPoint, Keynote, and Google Slides, allowing seamless customization for your company's needs.


6 slides
Business Process Checklist Overview Presentation
Simplify your workflow presentations with the Business Process Checklist Overview Presentation. This circular layout is ideal for outlining five sequential or cyclical steps in a business process, featuring icon-labeled checkpoints and editable titles. Each step is visually marked with subtle checkmarks, making it perfect for status tracking, task progression, or implementation plans. Clean, professional, and fully customizable in PowerPoint, Keynote, and Google Slides.