


Features
- 8 Unique slides
- Fully editable and easy to edit in Microsoft Powerpoint, Keynote and Google Slides
- 16:9 widescreen layout
- Clean and professional designs
- Export to JPG, PDF or send by email


Do you have any questions?
Recommend


5 slides
User Experience Empathy Map Strategy Presentation
Step into the user’s mindset with the User Experience Empathy Map Strategy Presentation. This template helps you visualize your audience’s thoughts, feelings, behaviors, and perceptions using a structured empathy map format. Ideal for UX workshops, customer journey analysis, or product design strategy sessions. Fully customizable in PowerPoint, Keynote, Canva, and Google Slides.


5 slides
Modern Medical Case Study Presentation
Step into a clean, modern layout designed to make complex medical insights easy to follow and visually engaging. This presentation helps you explain case details, patient data, and clinical outcomes with clarity and structure. Ideal for healthcare professionals, it’s fully compatible with PowerPoint, Keynote, and Google Slides.


2 slides
Startup Company Profile Introduction Presentation
Make a bold first impression with the Startup Company Profile Introduction Presentation. This modern, vibrant layout is perfect for introducing your startup’s mission, values, and services. With eye-catching visuals and clean structure, it’s fully customizable in Canva, PowerPoint, or Google Slides—making it easy to tailor for pitches or internal use.


7 slides
Environment United States Map Infographic
An Environment United States Map refers to a map that displays various environmental aspects or features across the United States. This template is a powerful tool for visualizing sustainability initiatives and environmental data across the diverse landscapes of the United States. With a combination of insightful graphics, this template enables you to present a compelling narrative about the nation's environmental efforts. This Infographic is a call to action to protect and preserve our planet, highlighting the efforts that are shaping a more sustainable and harmonious coexistence with nature.


5 slides
User Experience Customer Path Map
Visualize the full customer journey with the User Experience Customer Path Map Presentation. This engaging slide illustrates five key touchpoints in the user experience cycle using a connected flow design with bold icons and captions. Perfect for mapping onboarding steps, product interactions, or decision-making stages. Fully editable in PowerPoint, Keynote, and Google Slides.


6 slides
Project Overview and Key Takeaways Presentation
Summarize your project outcomes with clarity and impact using this Project Overview and Key Takeaways slide. Featuring a clean layout with a dedicated section for a brief overview and key metrics, plus four hexagonal milestones for your main insights. Perfect for wrap-up reports, client updates, or stakeholder reviews. Fully editable in PowerPoint, Keynote, and Google Slides.


6 slides
Big Data Analytics Business Presentation
Analyze and visualize data-driven insights with the Big Data Analytics Business infographic. Designed with a central magnifying glass layout, this template highlights key metrics, trends, and processes in data analytics. Fully customizable and compatible with PowerPoint, Keynote, and Google Slides.


5 slides
Enterprise IT System Design Presentation
Create a professional Enterprise IT System Design presentation with this structured diagram. Ideal for showcasing IT infrastructure, system architecture, data flow, and integration strategies, this fully customizable template is compatible with PowerPoint, Keynote, and Google Slides.


5 slides
Modern Tech Stack Overview Presentation
Showcase your technology architecture with this Modern Tech Stack Overview. Featuring a robotic hand and circular layout, it’s ideal for product demos, software architecture, or developer briefings. Designed for PowerPoint, Keynote, and Google Slides, this deck makes complex tech structures easy to understand and visually engaging for modern audiences.


21 slides
Auster Financial Report Presentation
Present financial insights with clarity using this comprehensive report template. Highlight key metrics, performance, project progress, competitor analysis, and strategic initiatives. Includes sections for team productivity, market trends, goals, and recommendations. Perfect for business reviews and updates. Fully customizable for PowerPoint, Keynote, and Google Slides.


7 slides
Time Management Infographic Presentation Template
Time management skills are important in all aspects of life, not just work. Mastering time management allows you to get everything that you want out of your day. This time management template is the perfect tool to help you stay productive. Keep track of tasks, create a schedule and organize time where you need it most. Use this template to build a database of your weekly tasks, daily activities and recurring tasks that can be easily structured in a clock view. This time management template Is compatible with Powerpoint, Keynote, and Google Slides, so you can use it on any device.


23 slides
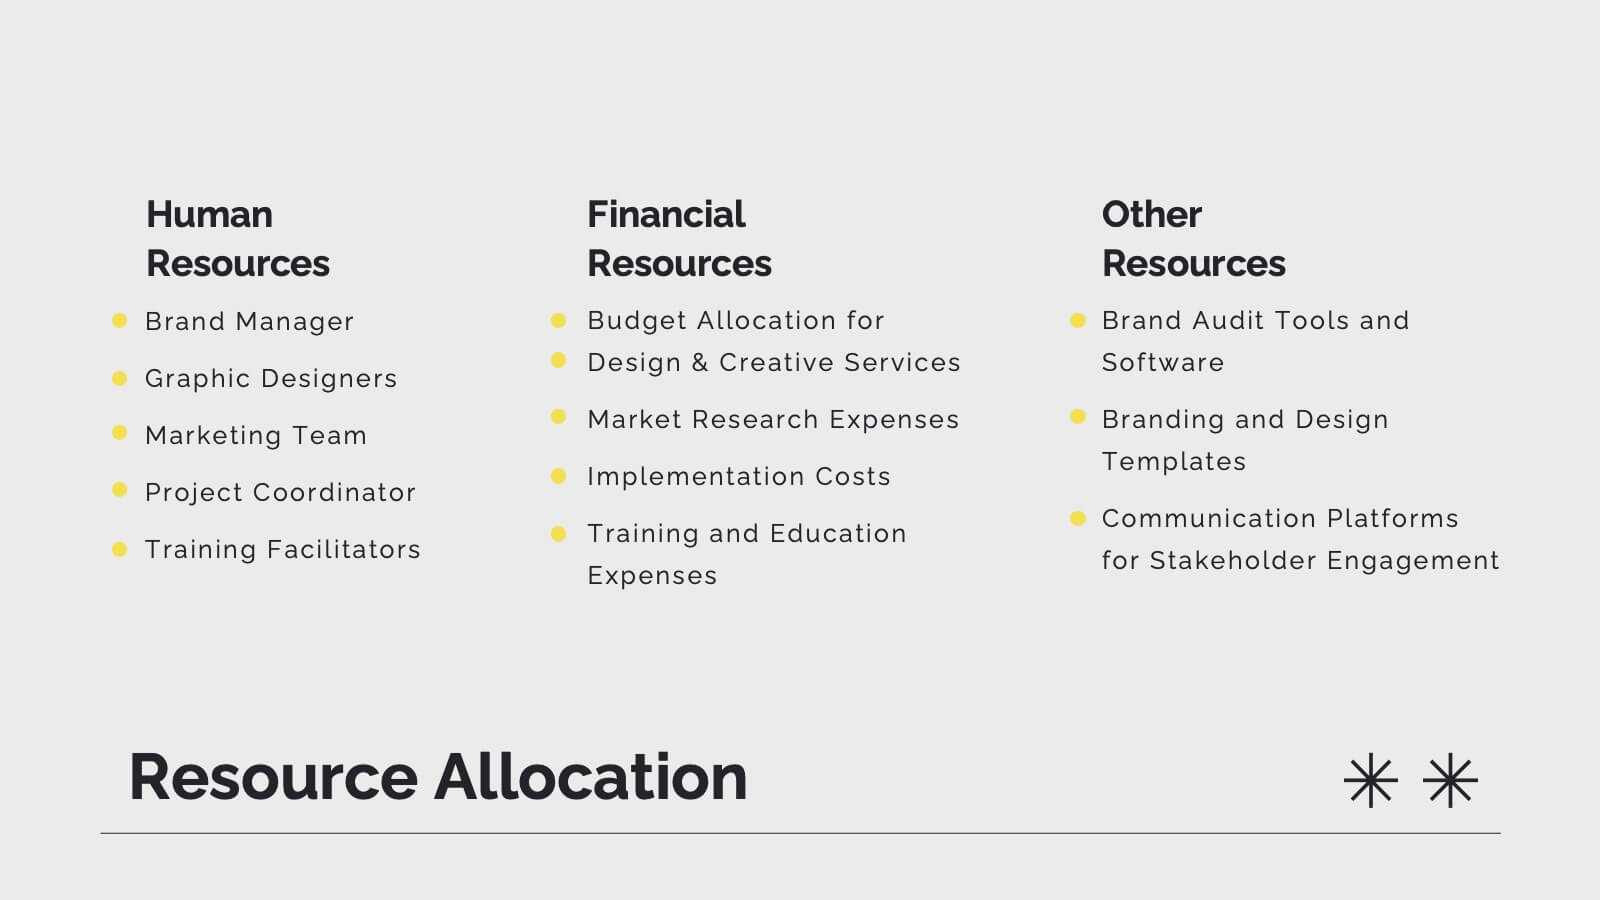
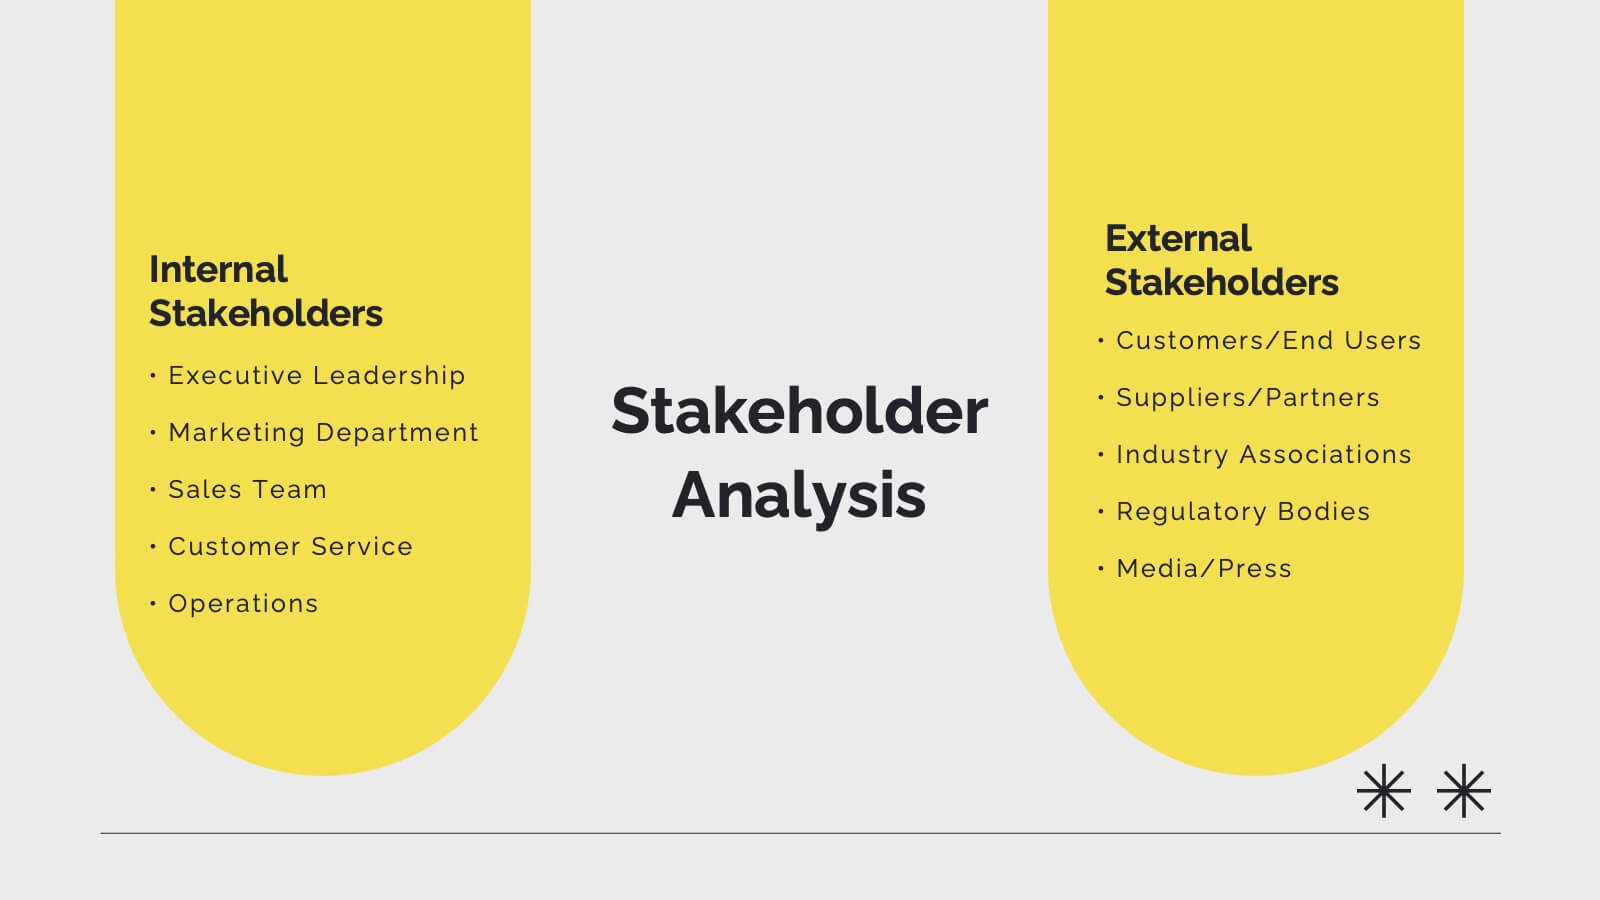
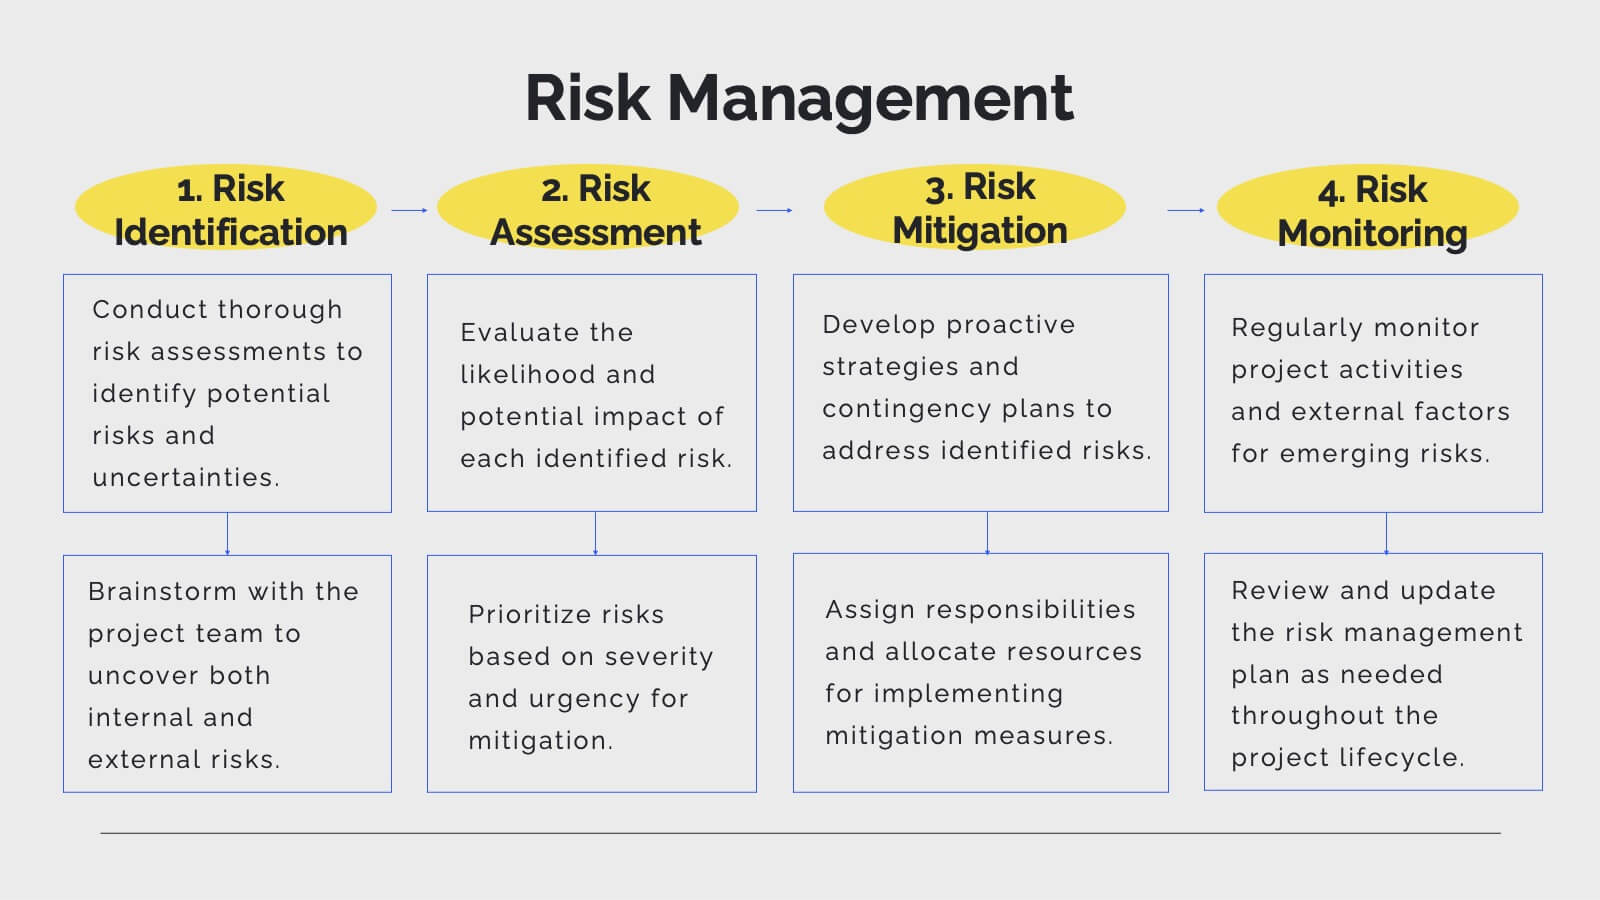
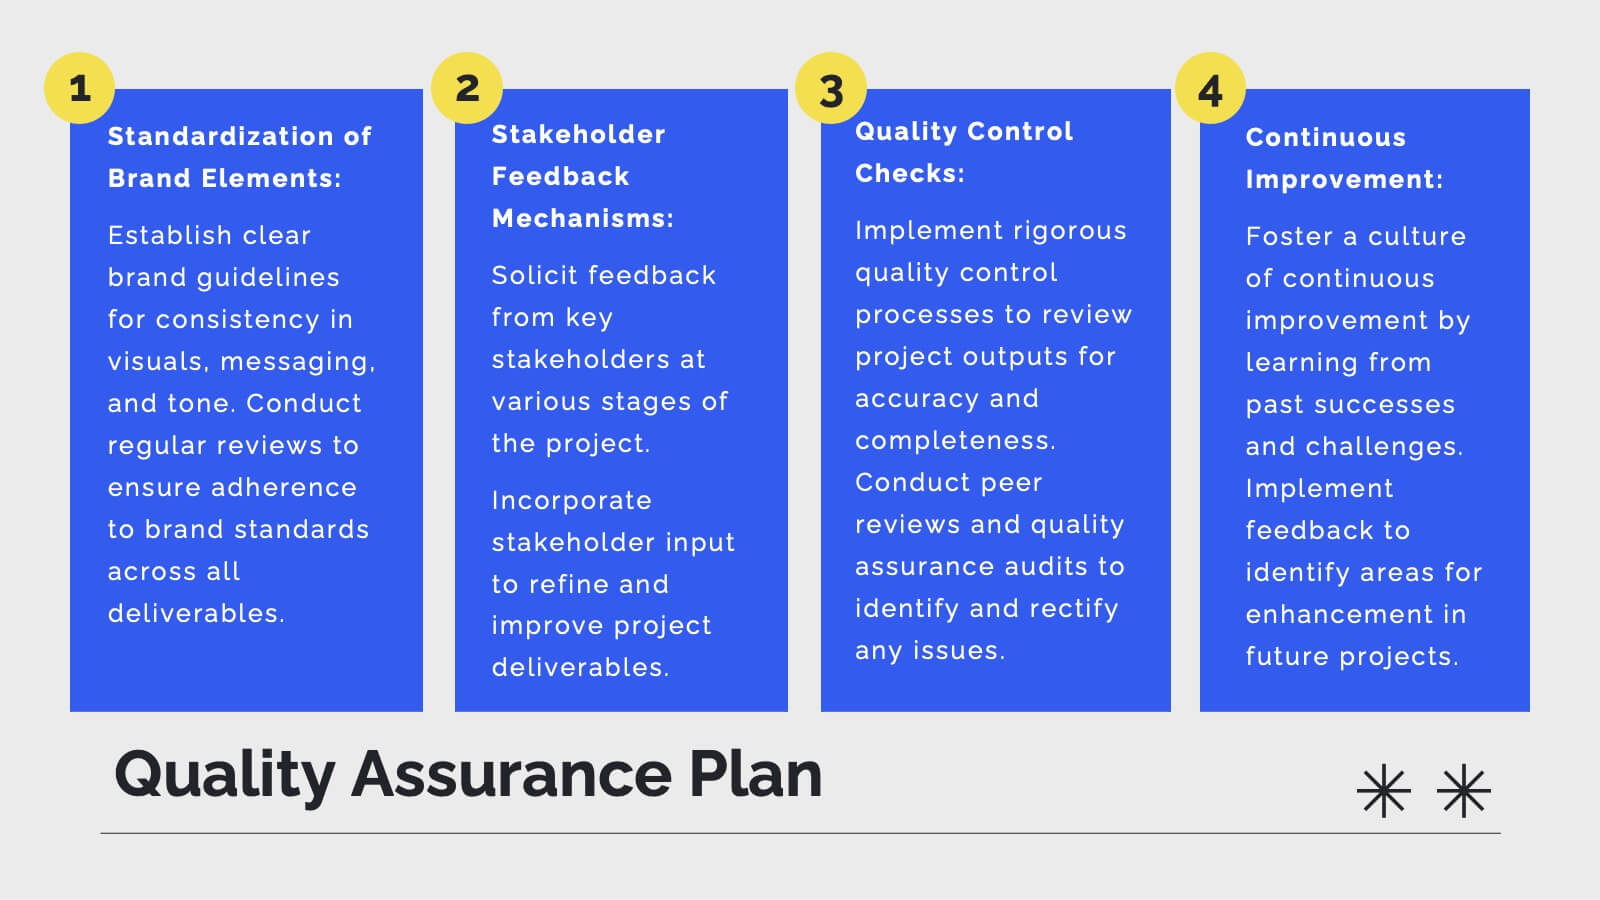
Starbloom Corporate Strategy Report Presentation
This Corporate Strategy Report Presentation Template provides a sleek and professional layout to present business insights, market opportunities, and strategic goals. It covers essential aspects like SWOT analysis, financial performance, risk management, and future outlook, making it perfect for corporate reports and investor briefings. Fully editable in PowerPoint, Keynote, and Google Slides.


6 slides
Consumer Decision Infographic
Consumer decision-making refers to the process through which individuals make choices about purchasing goods or services. This infographic template visually represents the process that consumers go through when making purchasing decisions. This template can be used to serve as a valuable tool to help your audience understand the steps consumers go through before making a purchase. This infographic is designed to provide insights for businesses to tailor their marketing strategies accordingly. Fully customizable and compatible with Powerpoint, Keynote, and Google Slides. Include statistics and data to highlight trends in consumer behavior.


10 slides
Financial Investment Portfolio Presentation
The "Financial Investment Portfolio" templates use a visually appealing mix of arrow and coin icons to represent different aspects of financial portfolios. Each slide varies slightly in color palette and layout but maintains a consistent theme that effectively uses symbols to emphasize key financial concepts or data points. These designs are excellent for presentations aimed at illustrating investment strategies, portfolio distributions, or financial growth, providing both clarity and aesthetic appeal to the information presented.


6 slides
Wireless Connectivity with 5G Benefits Presentation
Unlock the power of next-gen wireless connectivity with this sleek, signal-inspired infographic. Ideal for showcasing 5G benefits, this layout visualizes five key advantages in a clear, modern design. Perfect for tech briefings, strategic updates, or educational overviews. Fully compatible with PowerPoint, Keynote, and Google Slides for easy customization.


21 slides
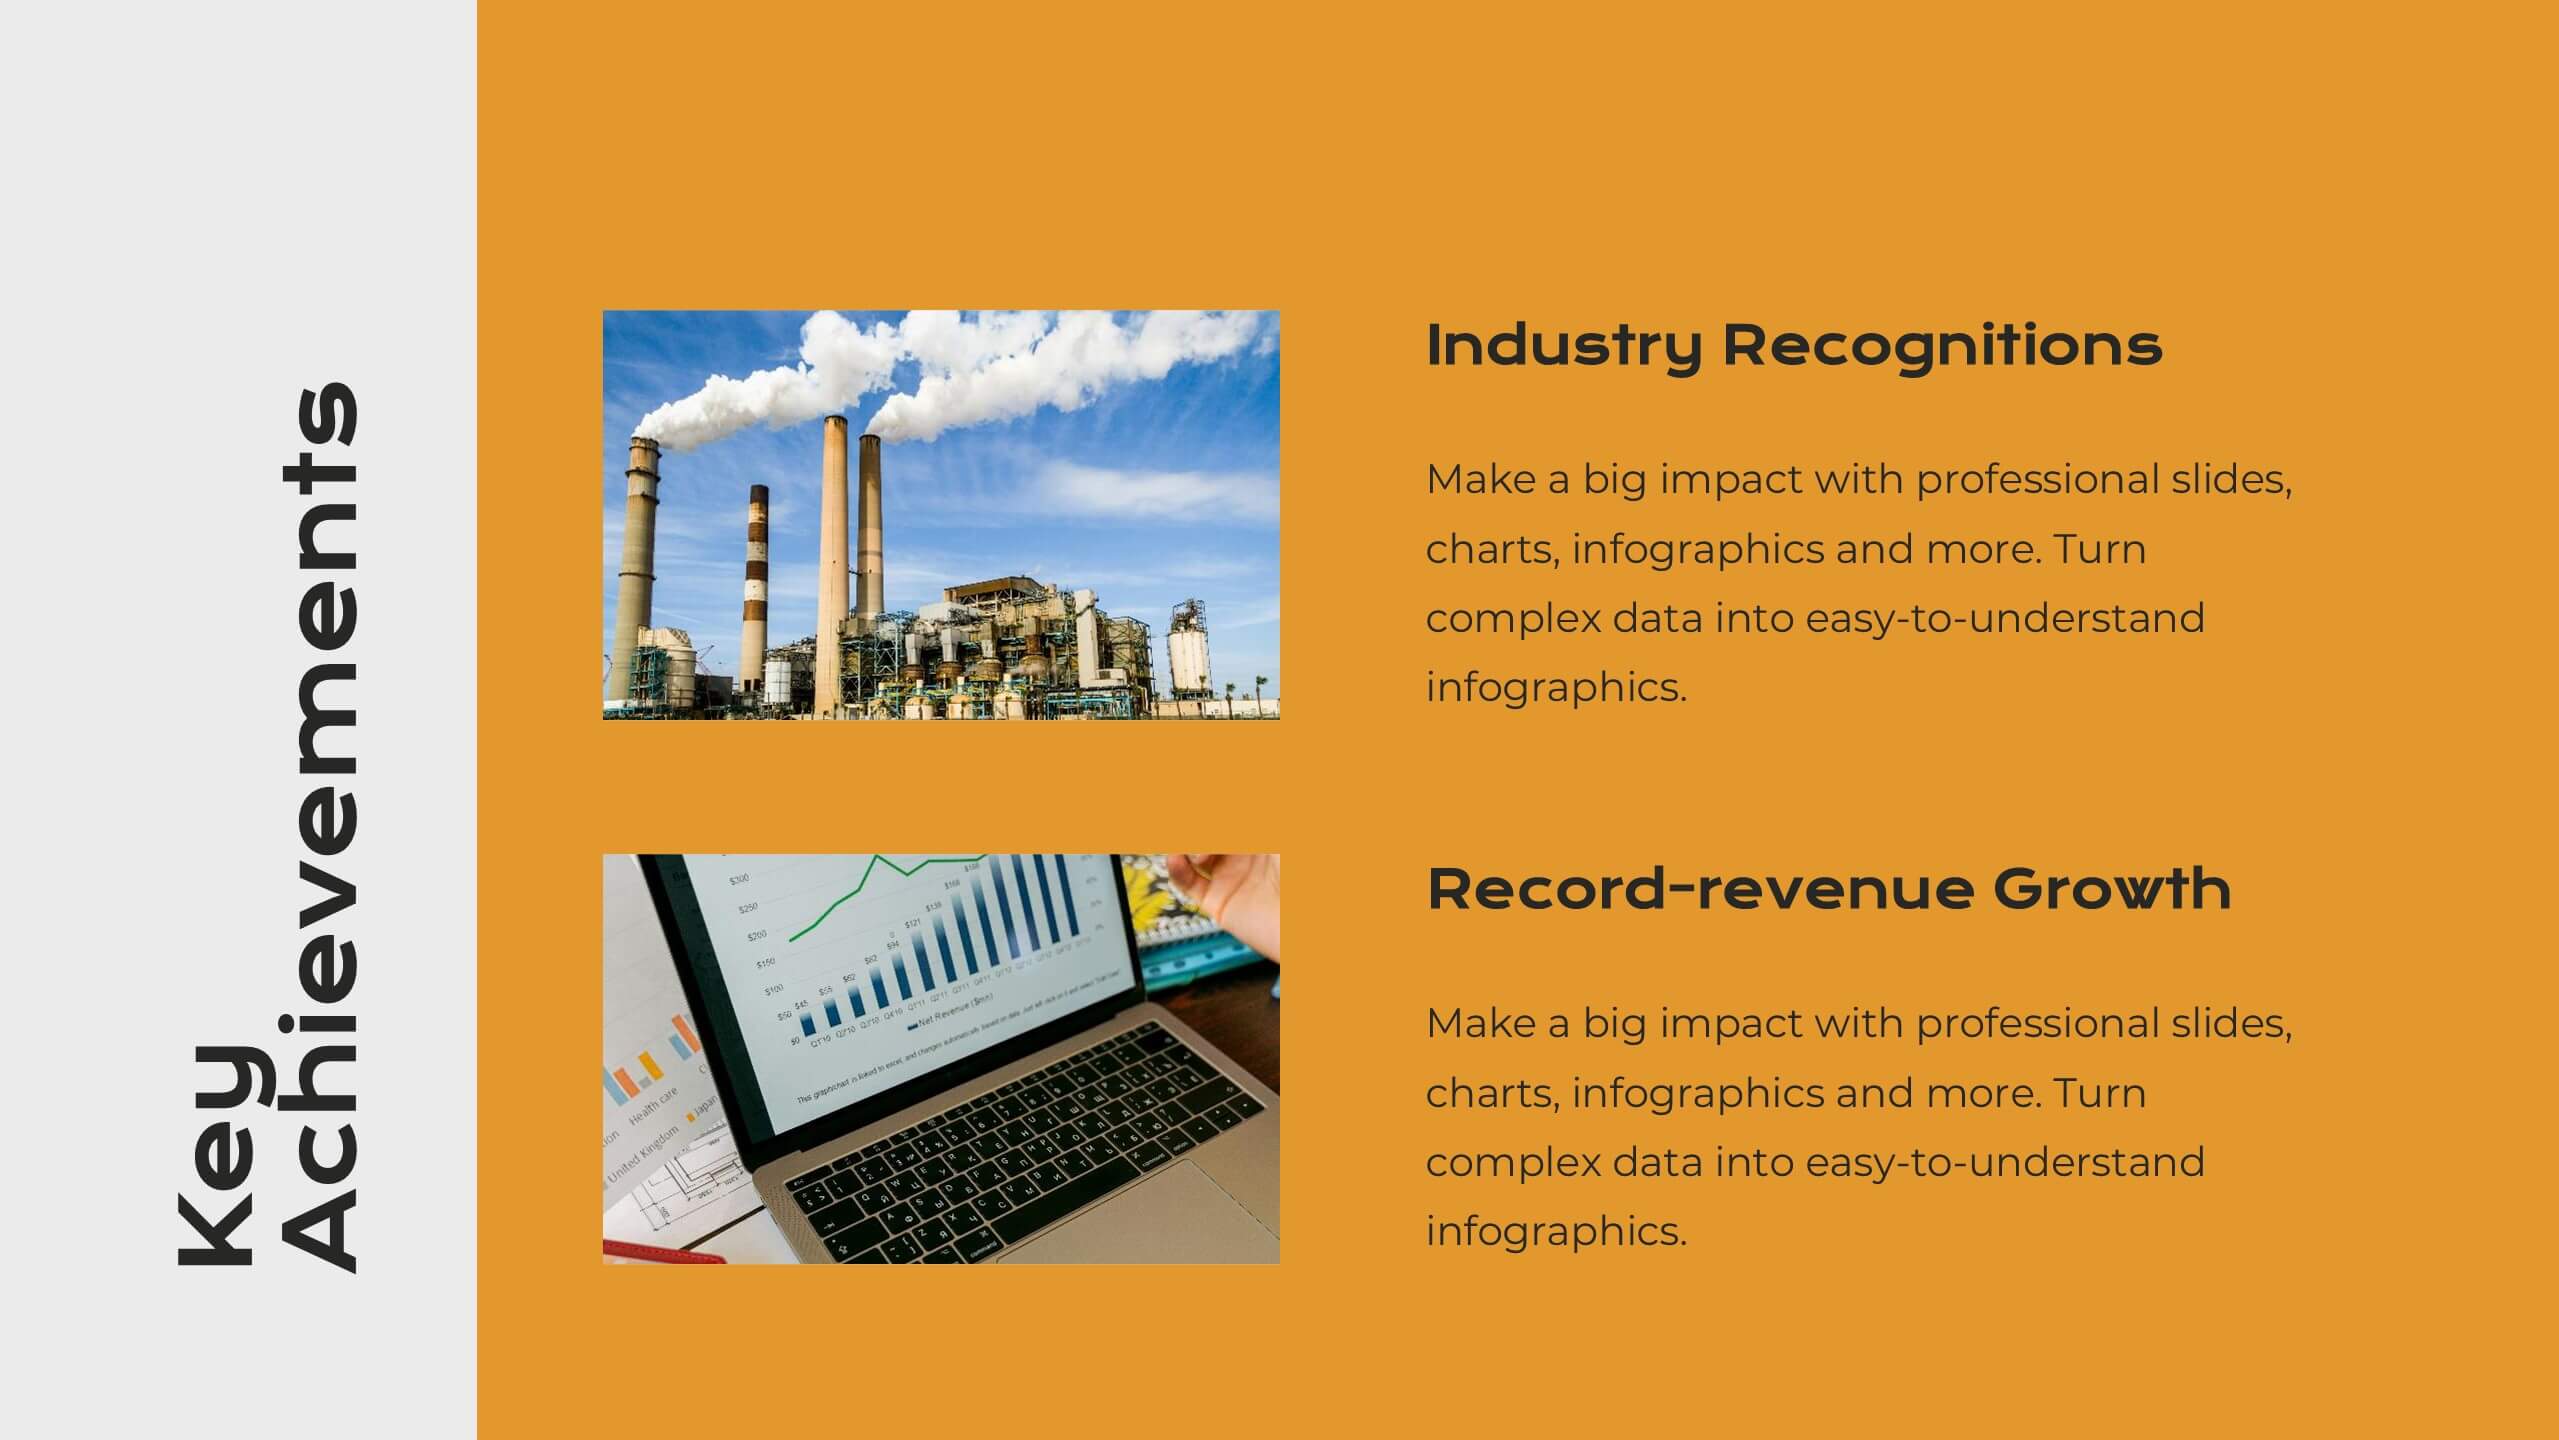
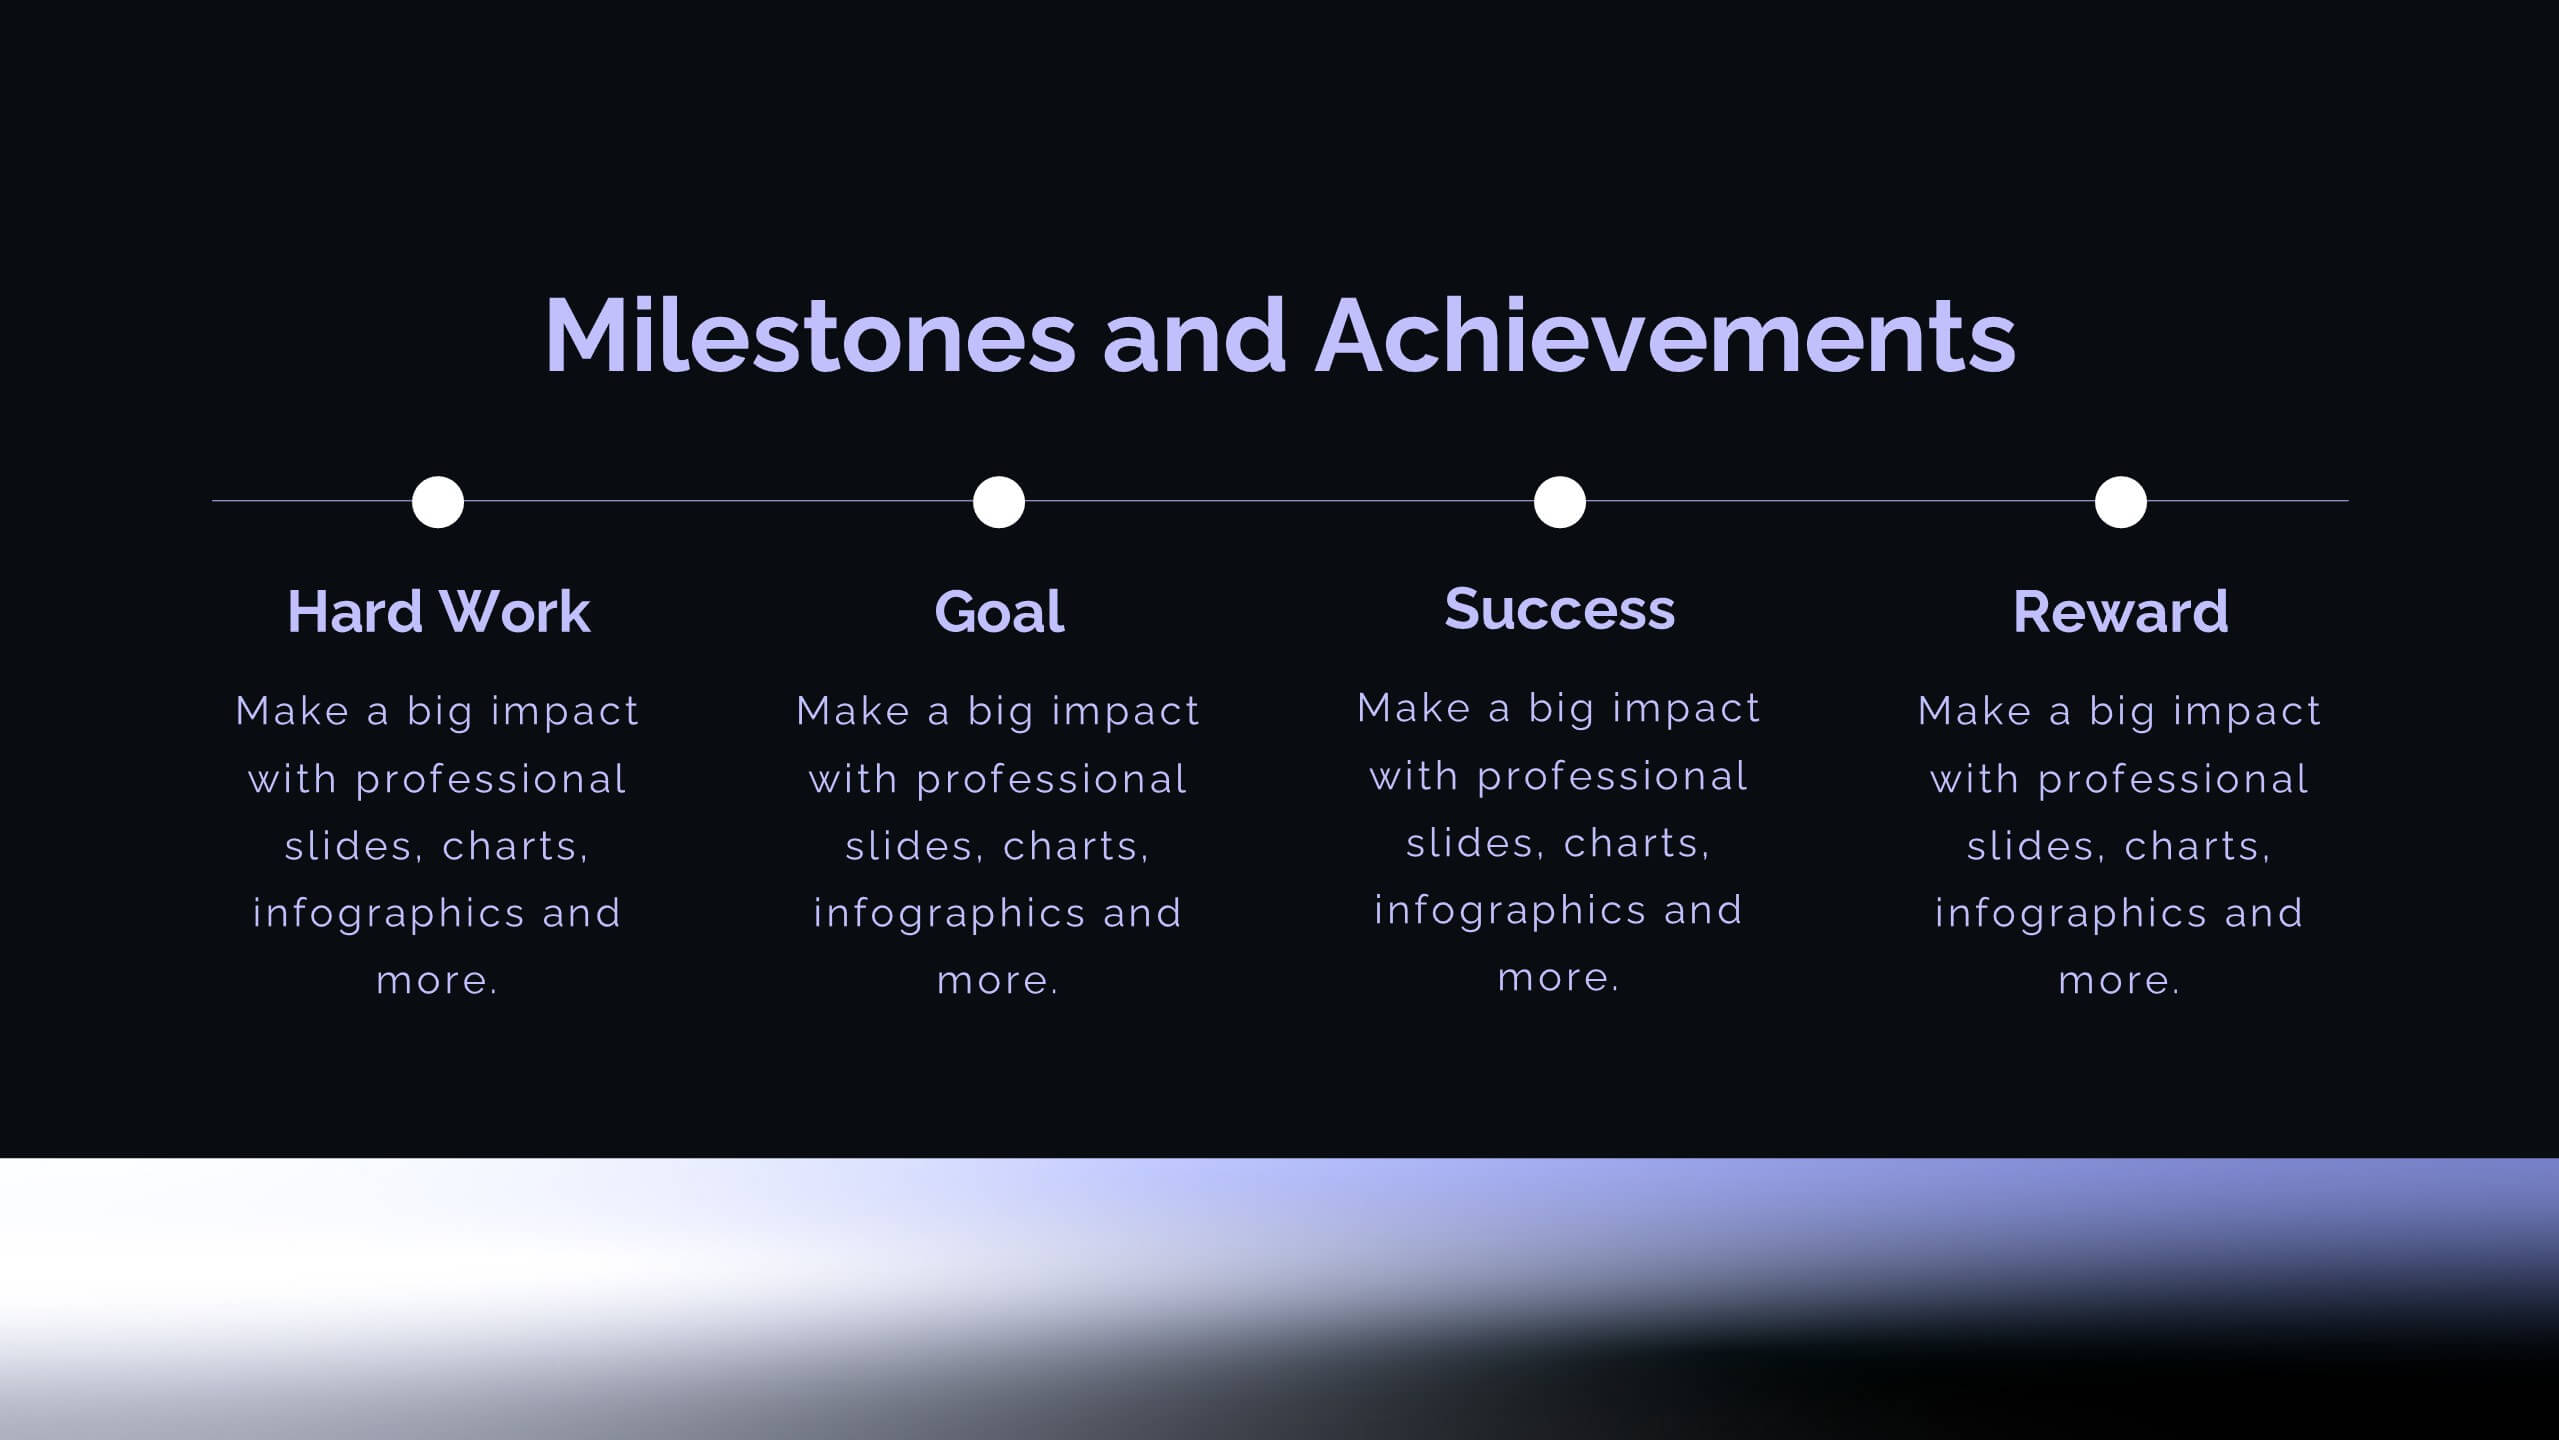
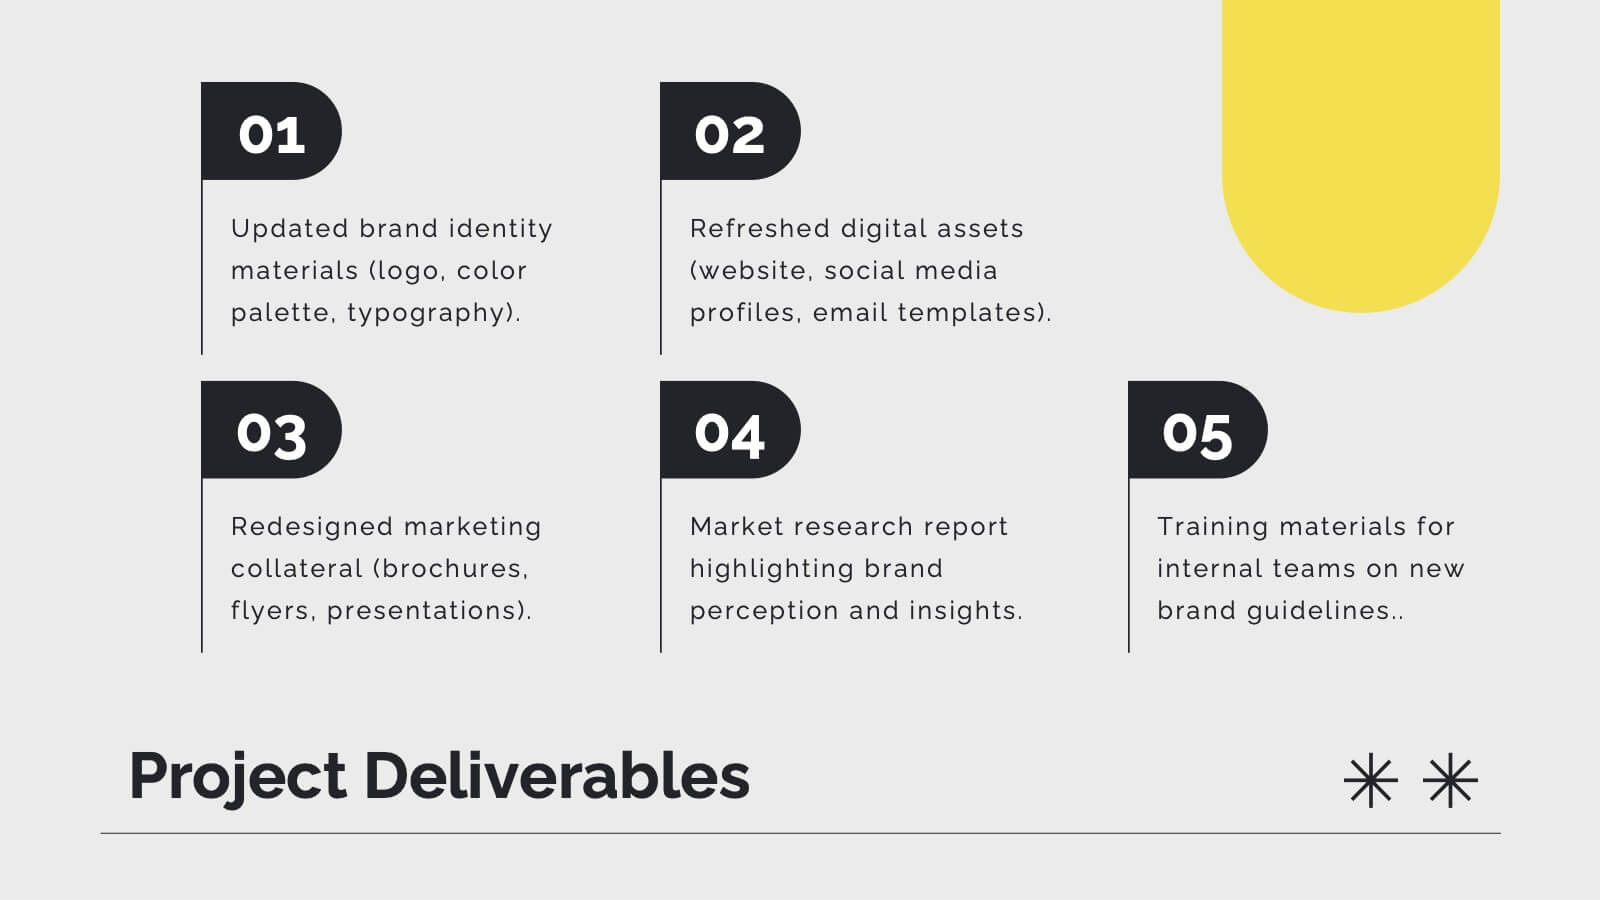
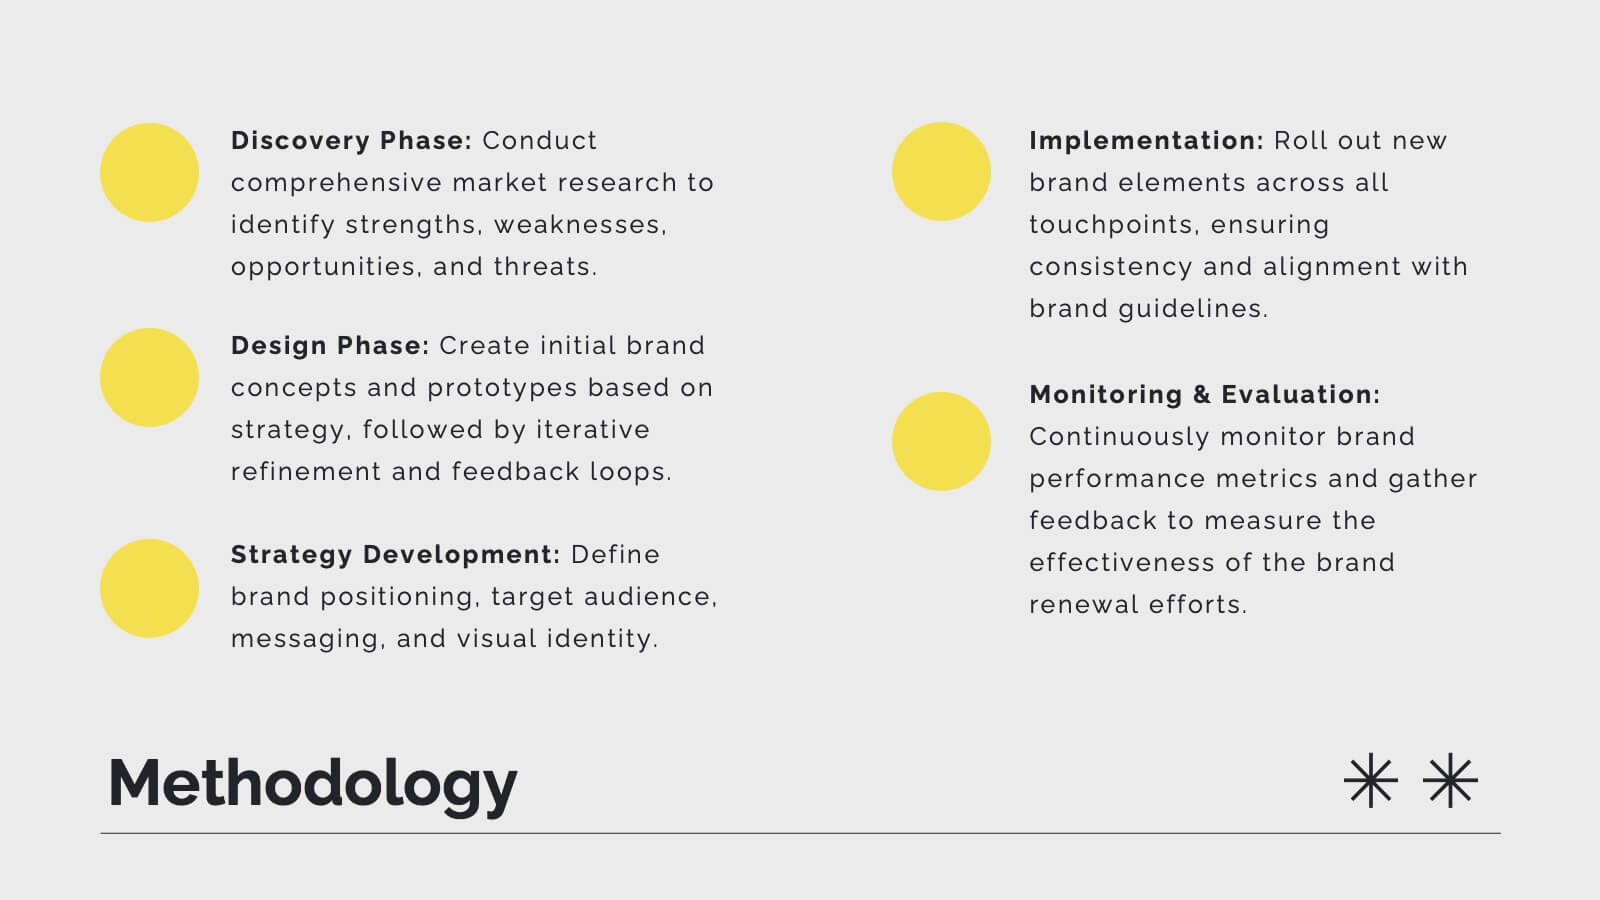
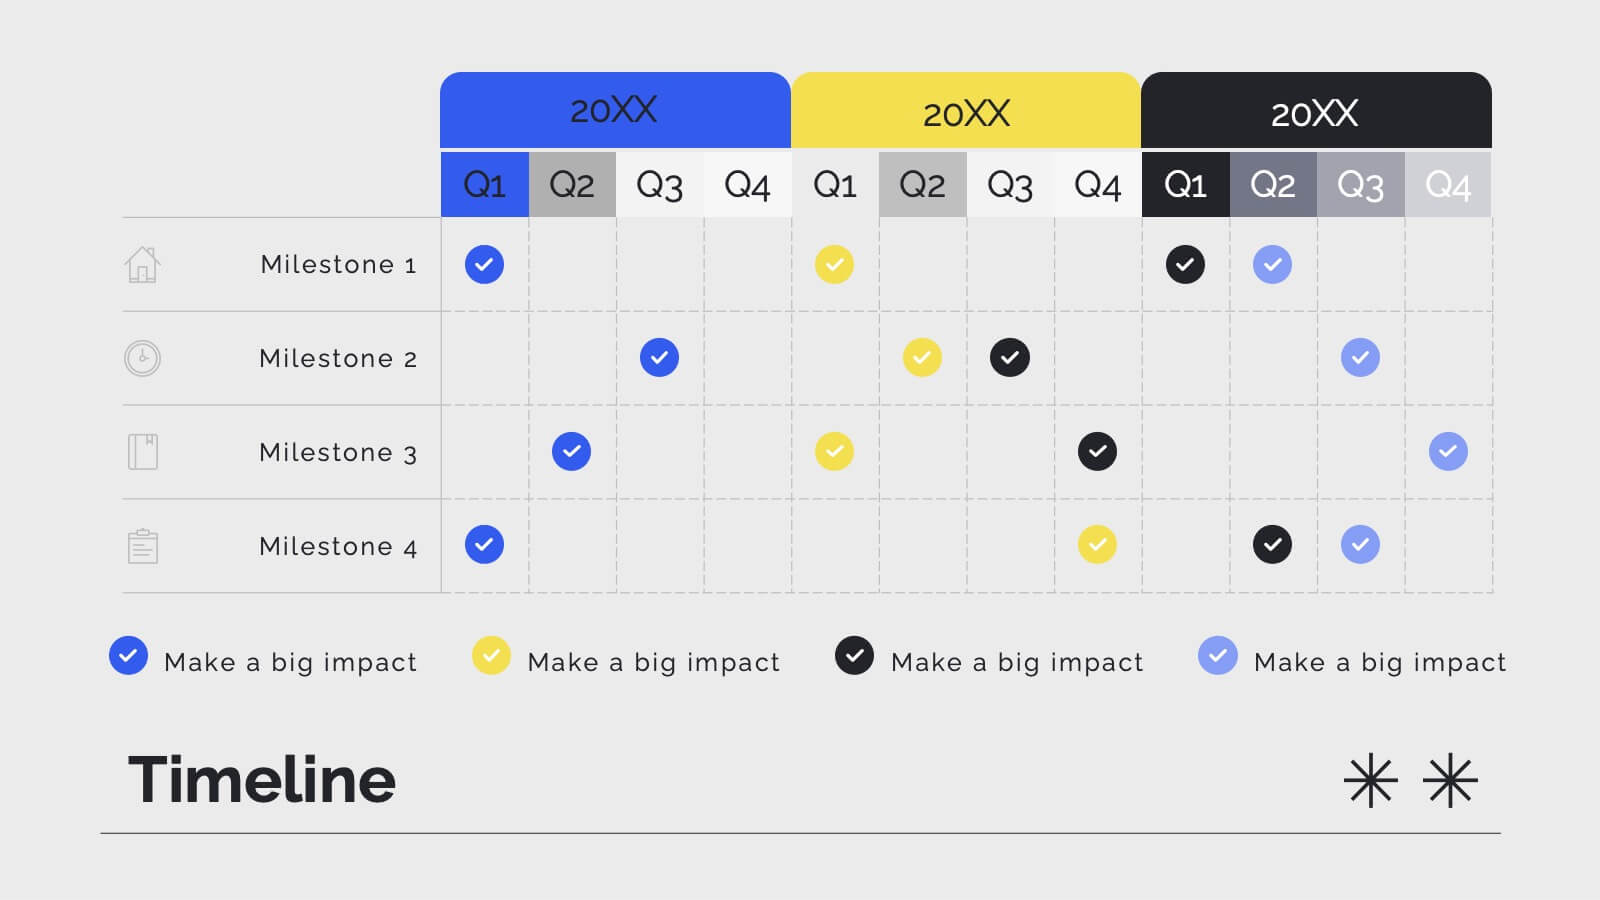
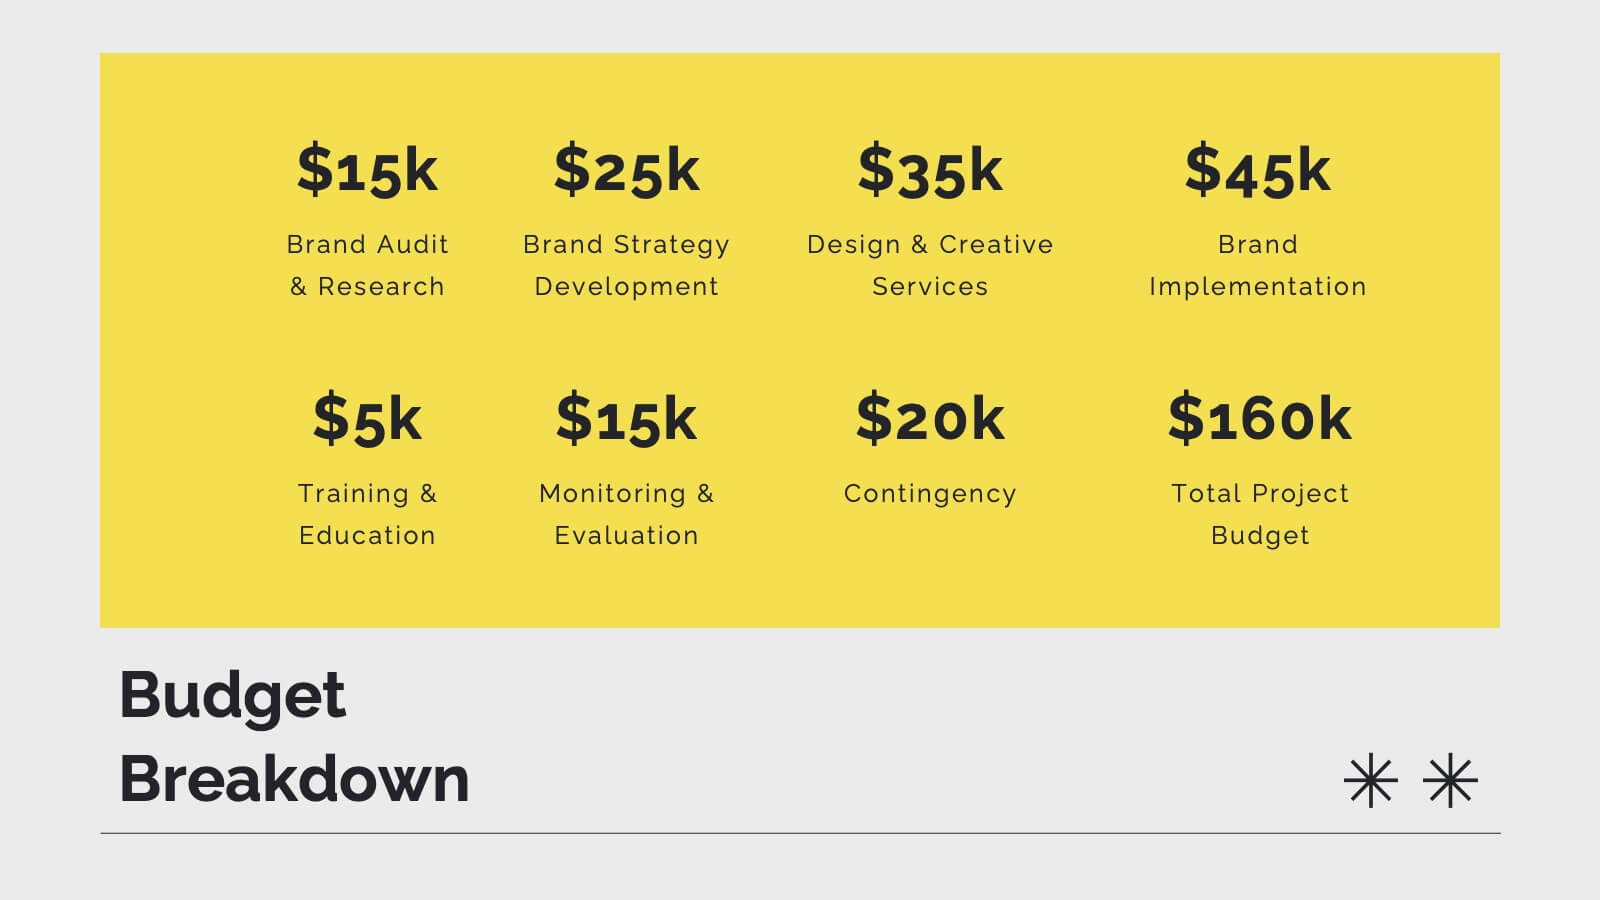
Pulse Project Management Plan Presentation
Streamline your project management with this vibrant template. It covers project overview, objectives, deliverables, methodology, timeline, budget, and risk management. Perfect for clear and engaging presentations. Compatible with PowerPoint, Keynote, and Google Slides for seamless customization.


12 slides
Project Completion Checklist
Streamline project tracking with this clean and functional project completion checklist slide. Ideal for task management and progress reporting, it includes editable sections for task descriptions, process stages, current status, and additional notes. With toggles like “In Process,” “On Hold,” “Complete,” and “Overdue,” this layout is perfect for keeping teams aligned. Fully editable in PowerPoint, Keynote, and Google Slides.