


Features
- 10 Unique Slides
- Fully editable and easy to edit in Microsoft Powerpoint, Keynote and Google Slides
- 16:9 widescreen layout
- Clean and professional designs
- Export to JPG, PDF or send by email


Do you have any questions?
Recommend


4 slides
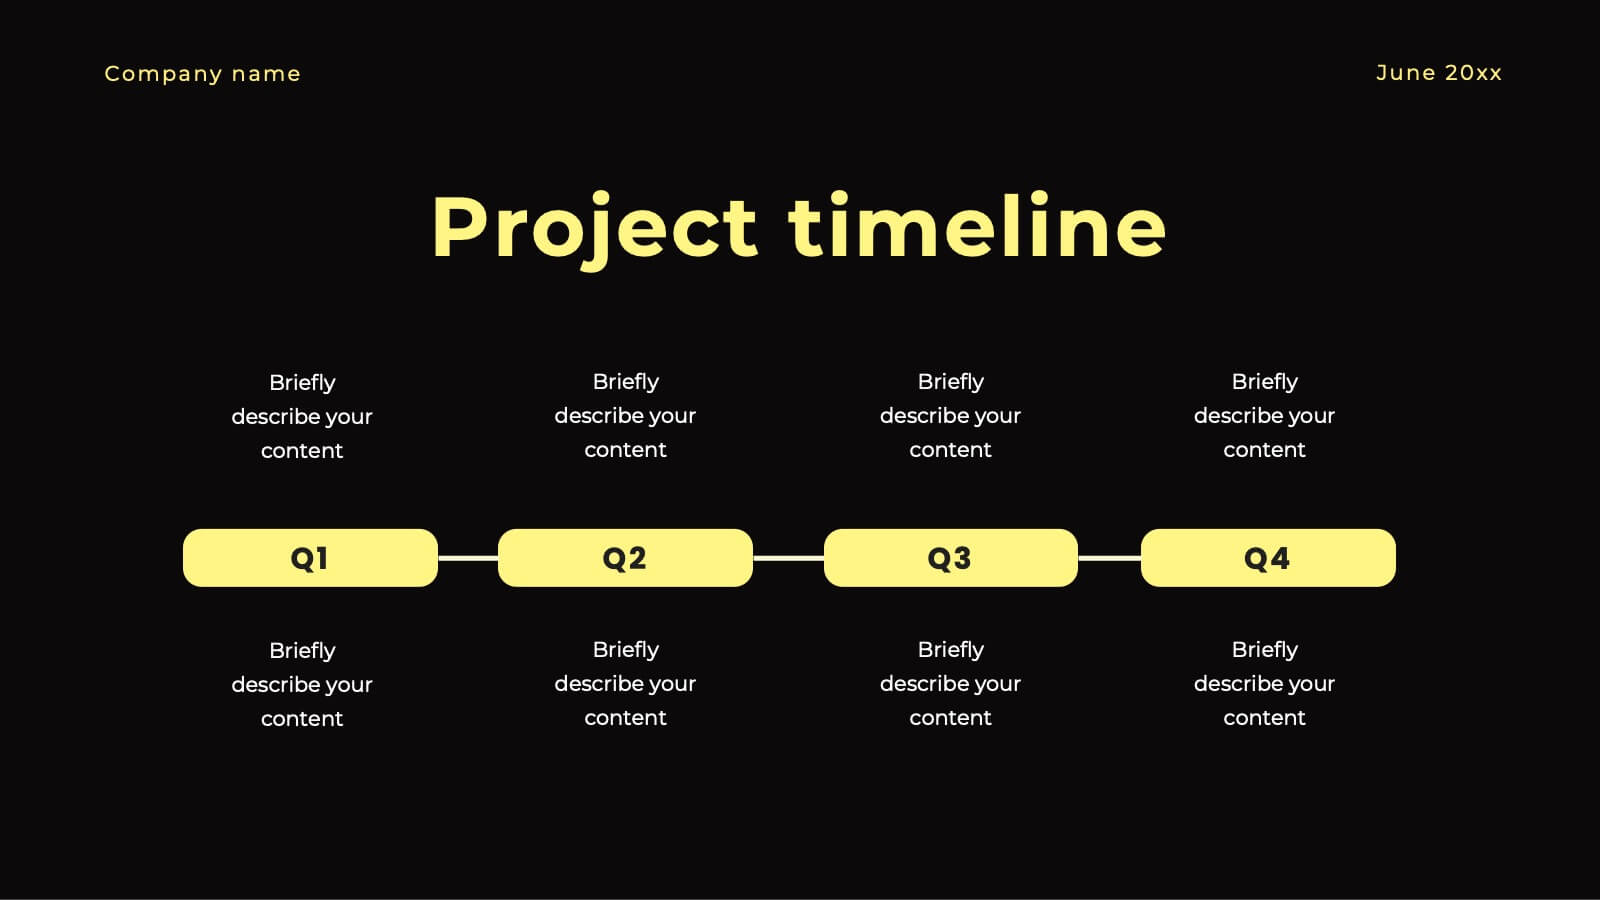
Project Milestone Path Roadmap Presentation
Bring your project plan to life with a clean, colorful layout that makes every milestone easy to follow across each quarter. This presentation helps you organize tasks, timelines, and progress in a clear visual path that supports smarter planning and team alignment. Fully compatible with PowerPoint, Keynote, and Google Slides.


6 slides
TAM SAM SOM Market Infographic
TAM, SAM, and SOM are terms used in business and marketing to represent different levels of market potential and segmentation. This Infographic is a visual representation that explains the concepts of Total Addressable Market (TAM), Serviceable Available Market (SAM), and Serviceable Obtainable Market (SOM) in the context of business and market analysis. This template will encourage your audience to share this infographic to help make informed decisions about market strategies and growth potential. Compatible with Powerpoint, Keynote, and Google Slides. Summarize the benefits of the TAM SAM SOM in market analysis concepts.


5 slides
Country Data Mapping in South America Presentation
Present data with impact using the Country Data Mapping in South America Presentation. This clean, professional slide highlights key statistics across up to five countries using labeled connectors, icons, and a gradient-based map. Ideal for showcasing regional growth, KPIs, or operational breakdowns across South America. Fully editable and compatible with PowerPoint, Keynote, Google Slides, and Canva.


4 slides
Business Case Study Analysis Presentation
Showcase your business success story with this engaging case study analysis template! Designed to highlight key insights, solutions, and results, it’s ideal for presenting data-driven strategies with clarity. Fully customizable and visually compelling, this template works seamlessly with PowerPoint, Keynote, and Google Slides for professional, high-impact presentations.


5 slides
Business Insight Iceberg Presentation
Visualize surface-level data and deeper insights with the Business Insight Iceberg Presentation. Perfect for showcasing organizational structure, decision-making layers, or strategy breakdowns. Each editable layer helps communicate complexity clearly and effectively. Fully compatible with PowerPoint, Keynote, and Google Slides—ideal for professionals, analysts, and educators aiming for clarity and impact.


20 slides
Unity Sales Proposal Presentation
Boost your sales strategy with this comprehensive sales proposal template! Perfect for outlining objectives, processes, and customer value propositions. Ideal for sales teams aiming to close deals and impress clients. Compatible with PowerPoint, Keynote, and Google Slides, this template ensures your sales presentations are clear, persuasive, and professional. Drive your sales success today!


2 slides
Business Self-Introduction Presentation
Introduce yourself with confidence using this Business Self-Introduction Slide. Perfect for networking, team meetings, and professional presentations, this template features a modern layout with a dynamic photo cutout, engaging visuals, and structured text areas. Fully customizable for PowerPoint, Keynote, and Google Slides, you can adjust colors, fonts, and content to reflect your personal or business identity.


4 slides
Investment Analysis Finance Presentation
Target your financial insights with this Investment Analysis Finance Presentation. Designed with a bold bullseye diagram and four labeled pointers, this slide helps communicate core focus areas, ROI, risk zones, or asset distribution. Ideal for pitch decks, portfolio reviews, and financial reports. Fully editable in PowerPoint, Keynote, and Google Slides—perfect for analysts, investors, and finance professionals.


20 slides
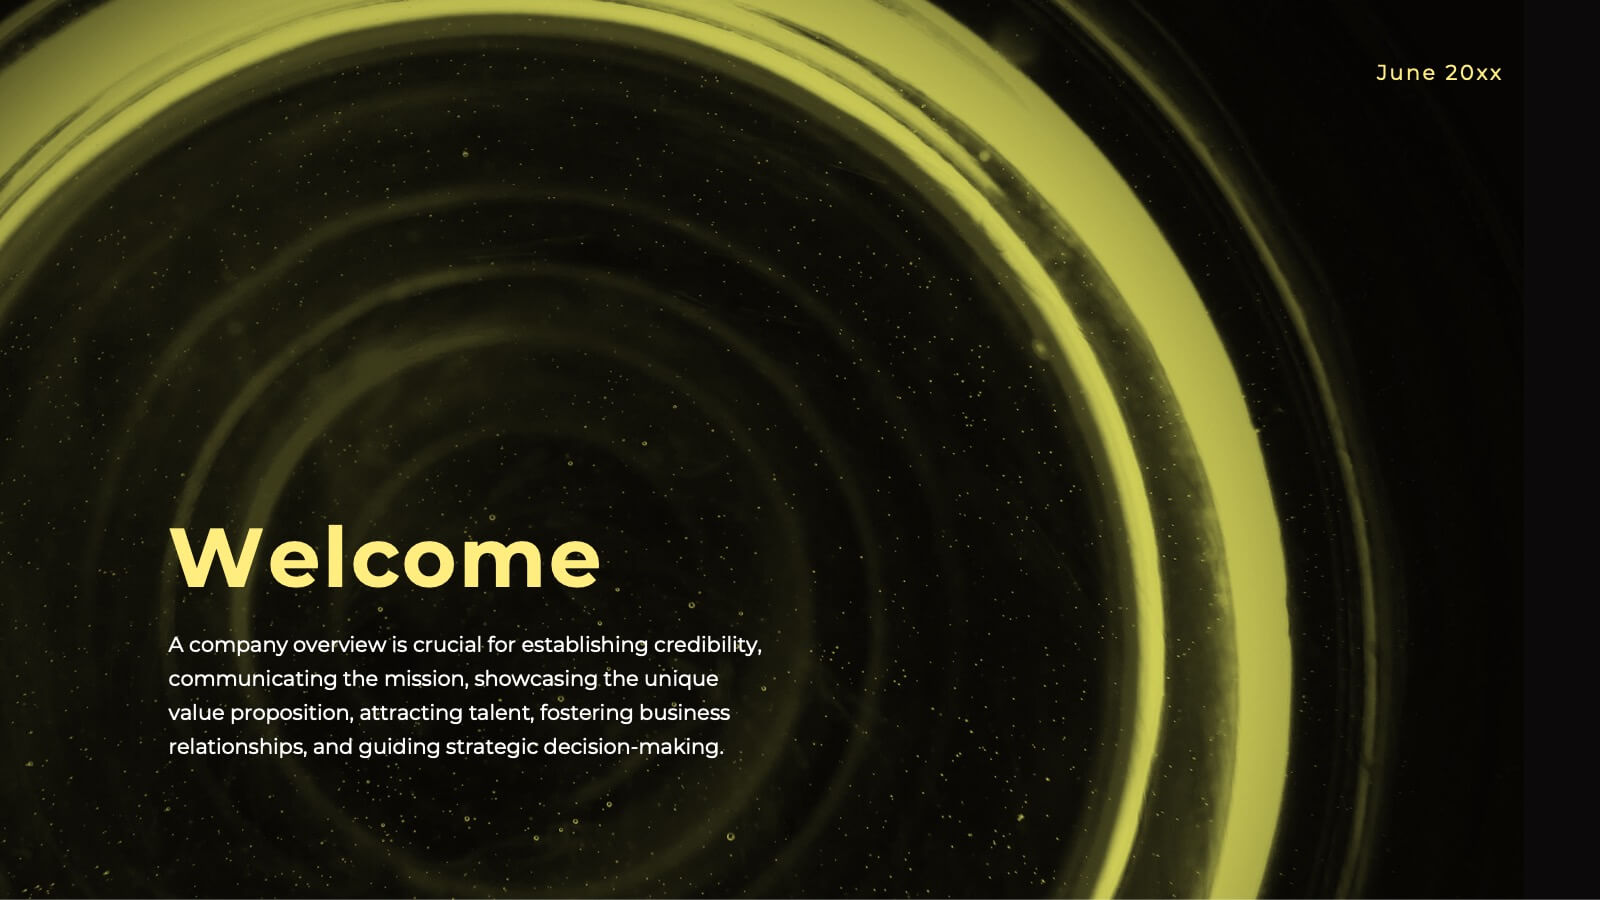
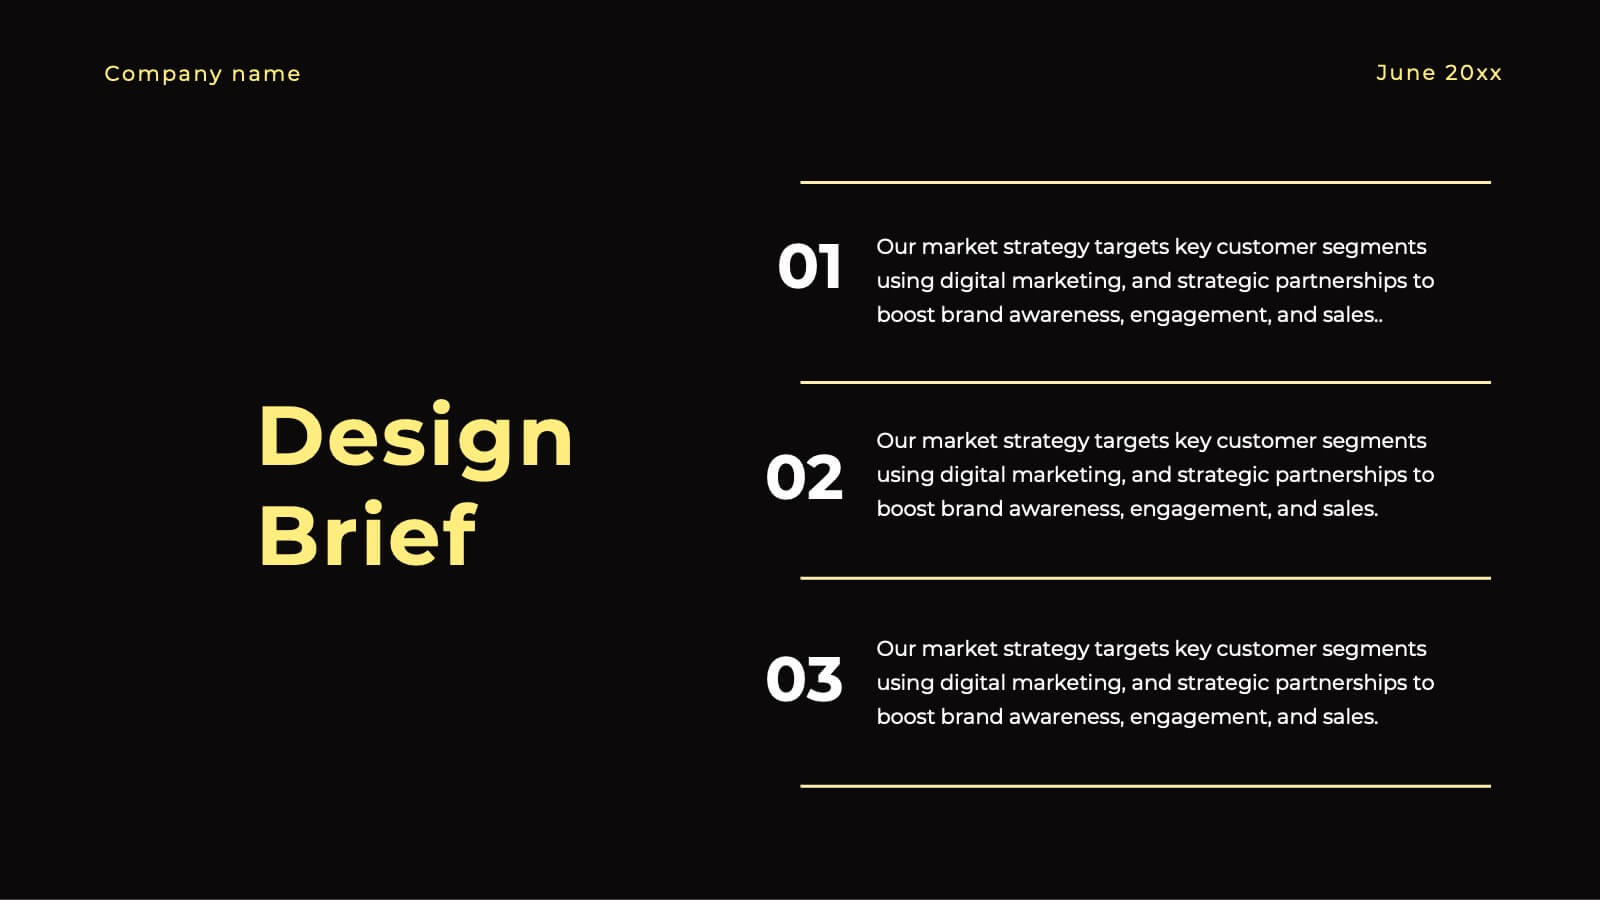
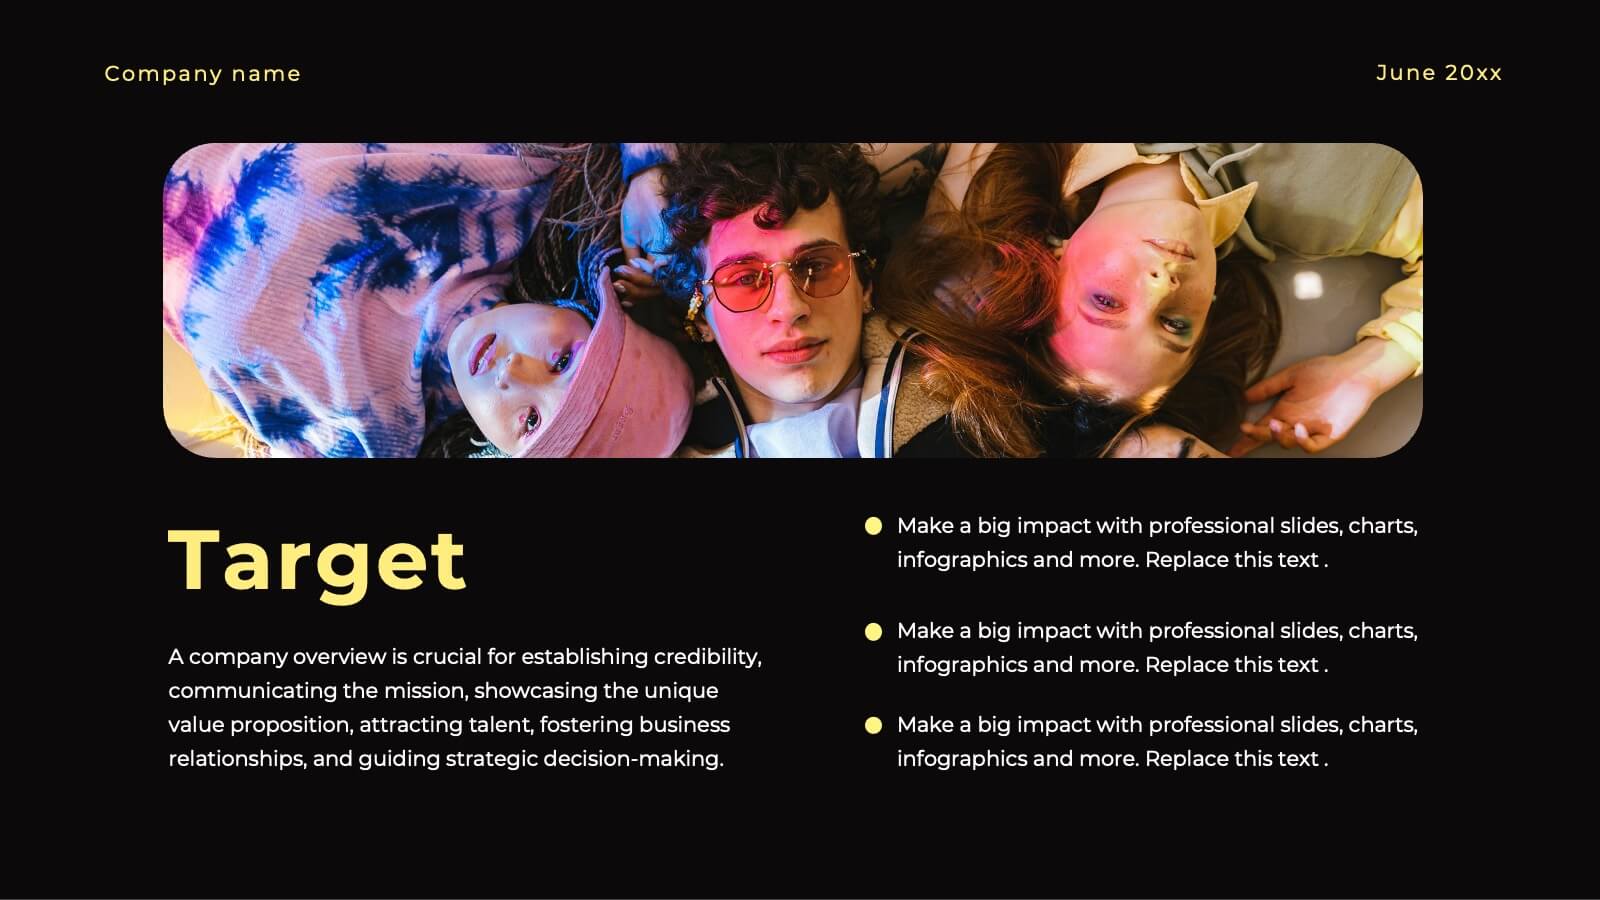
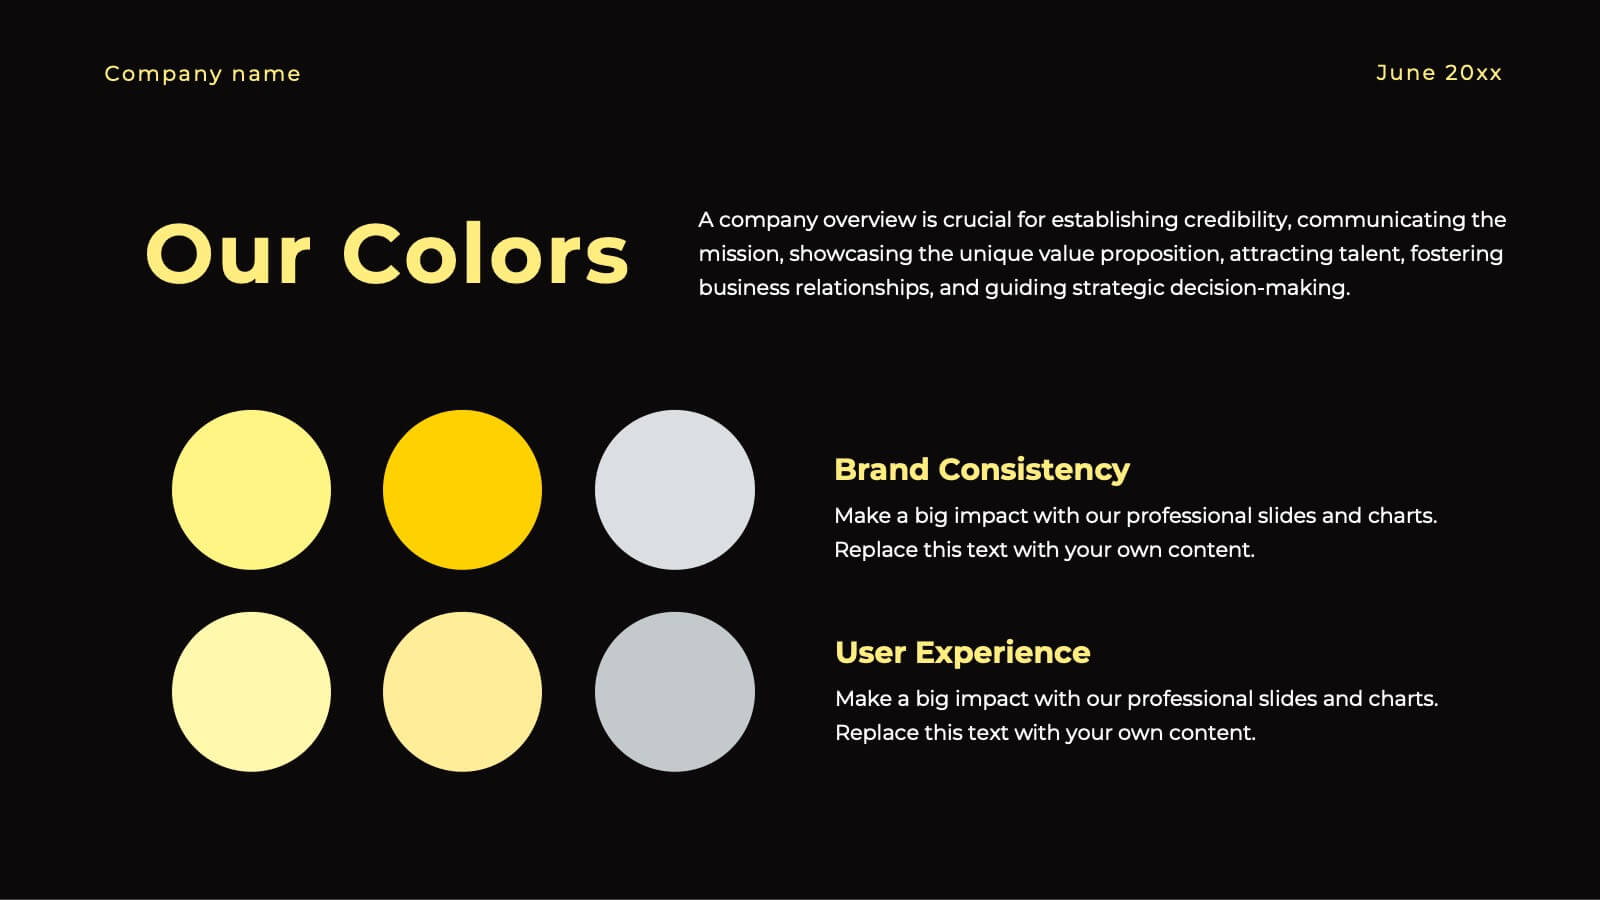
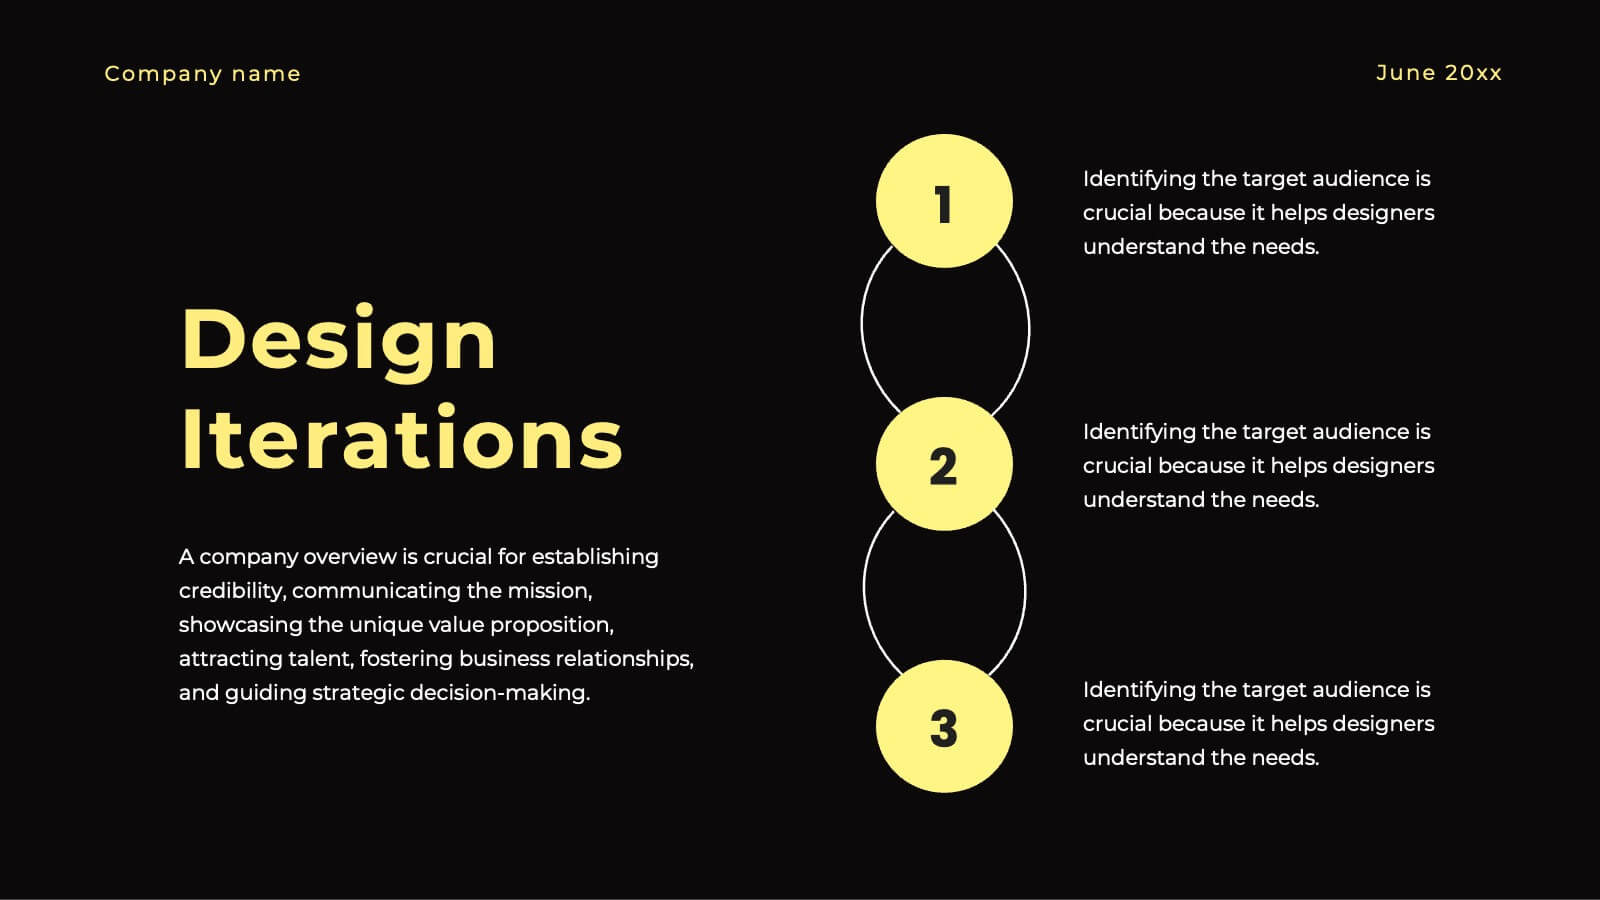
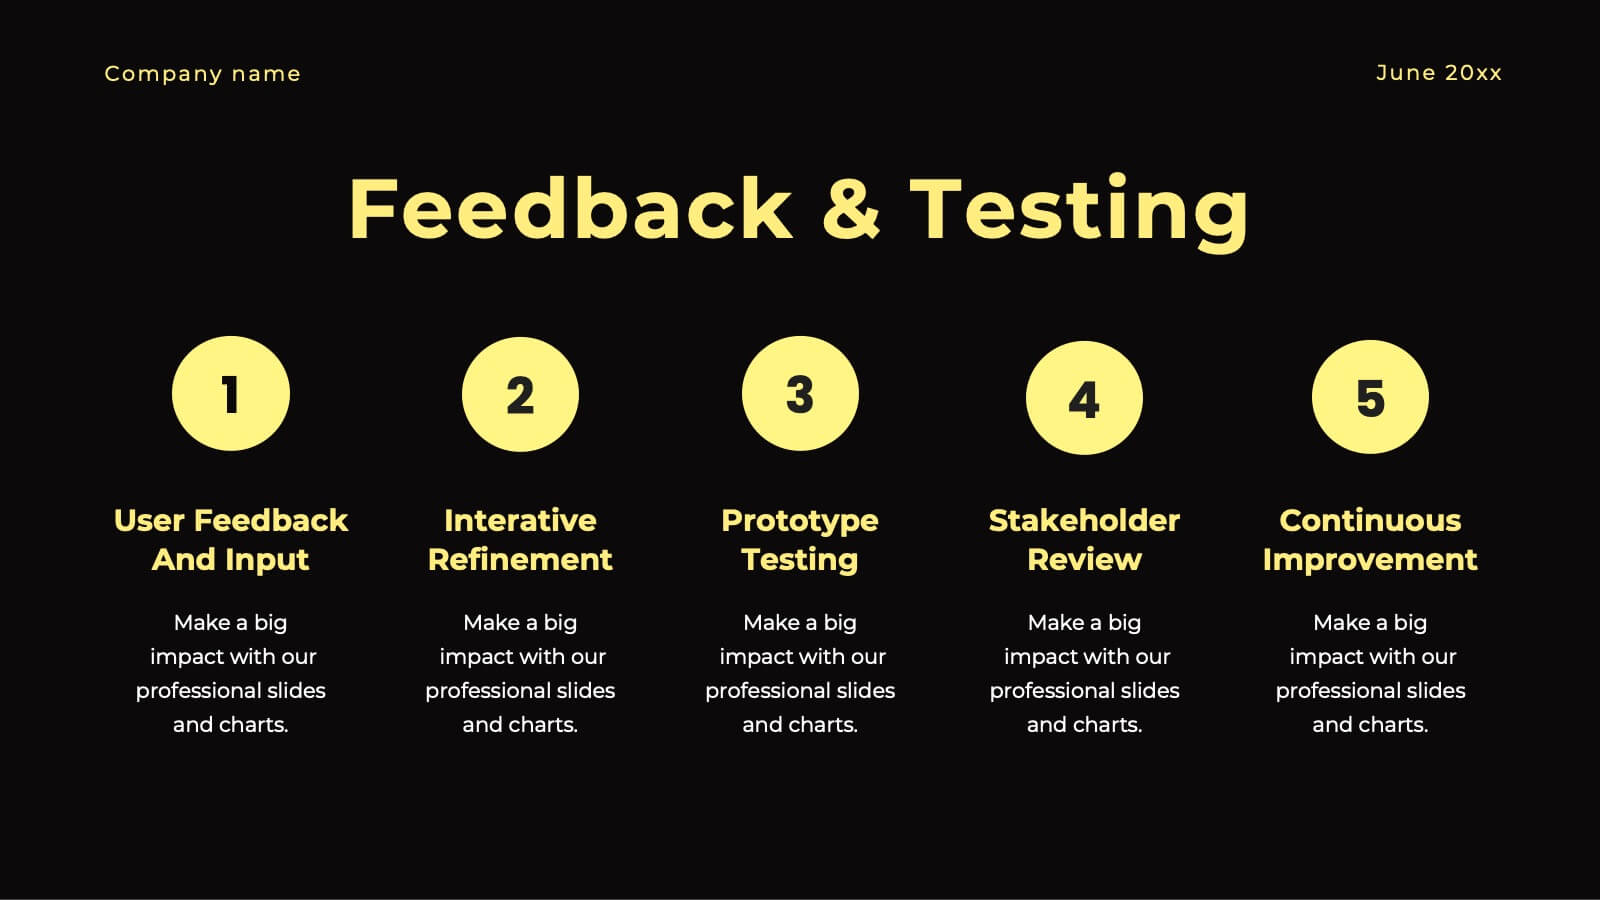
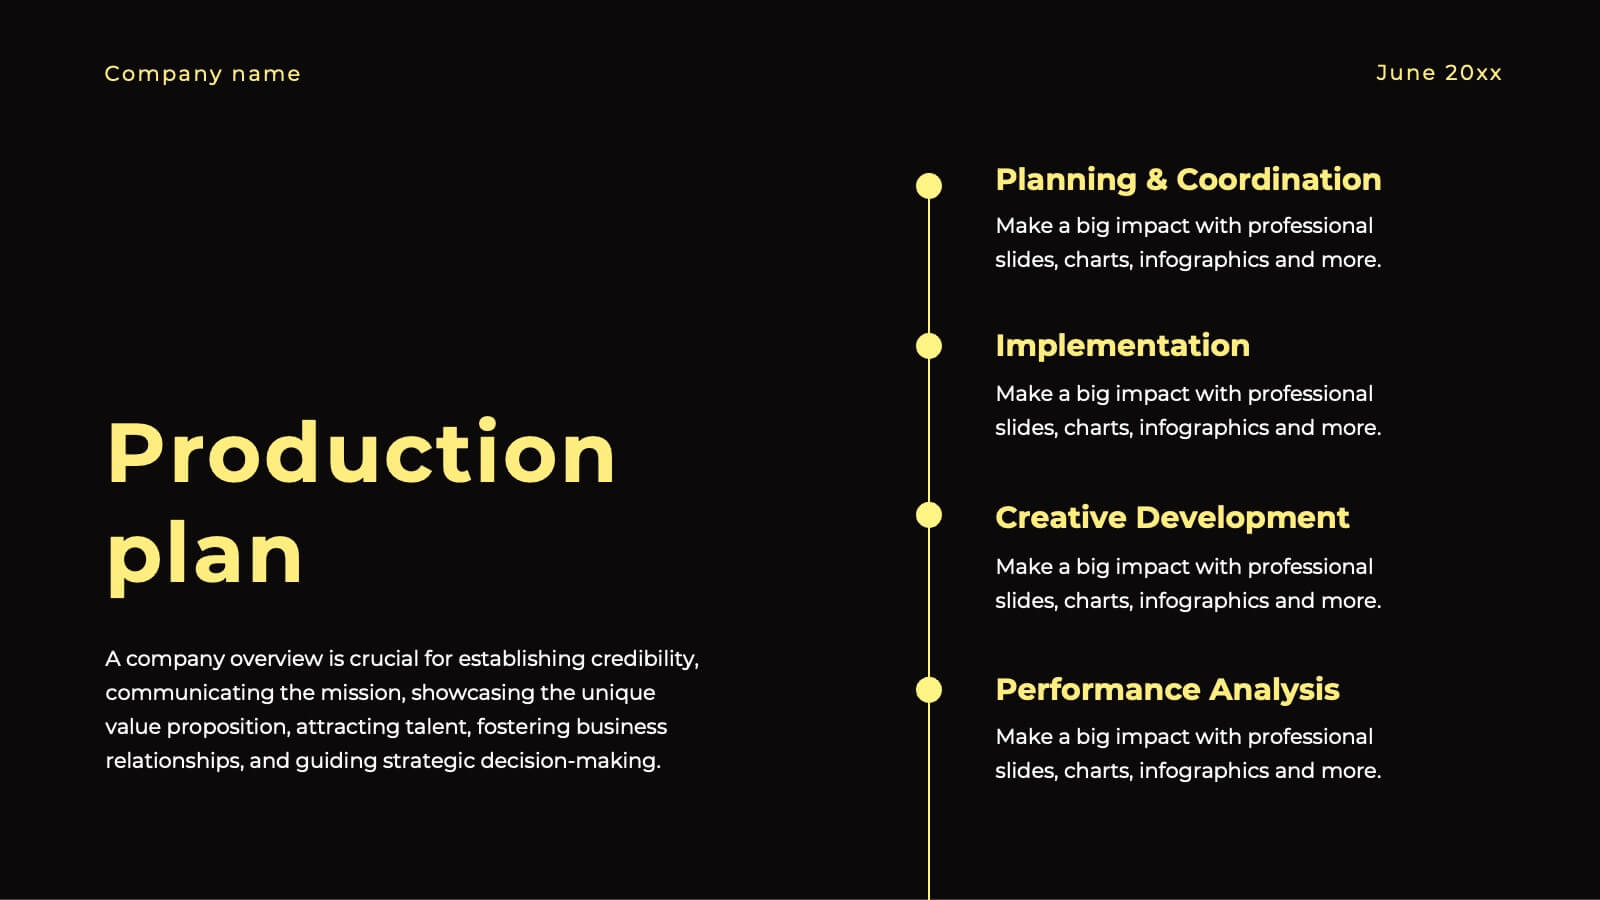
Ignite Creative Design Report Presentation
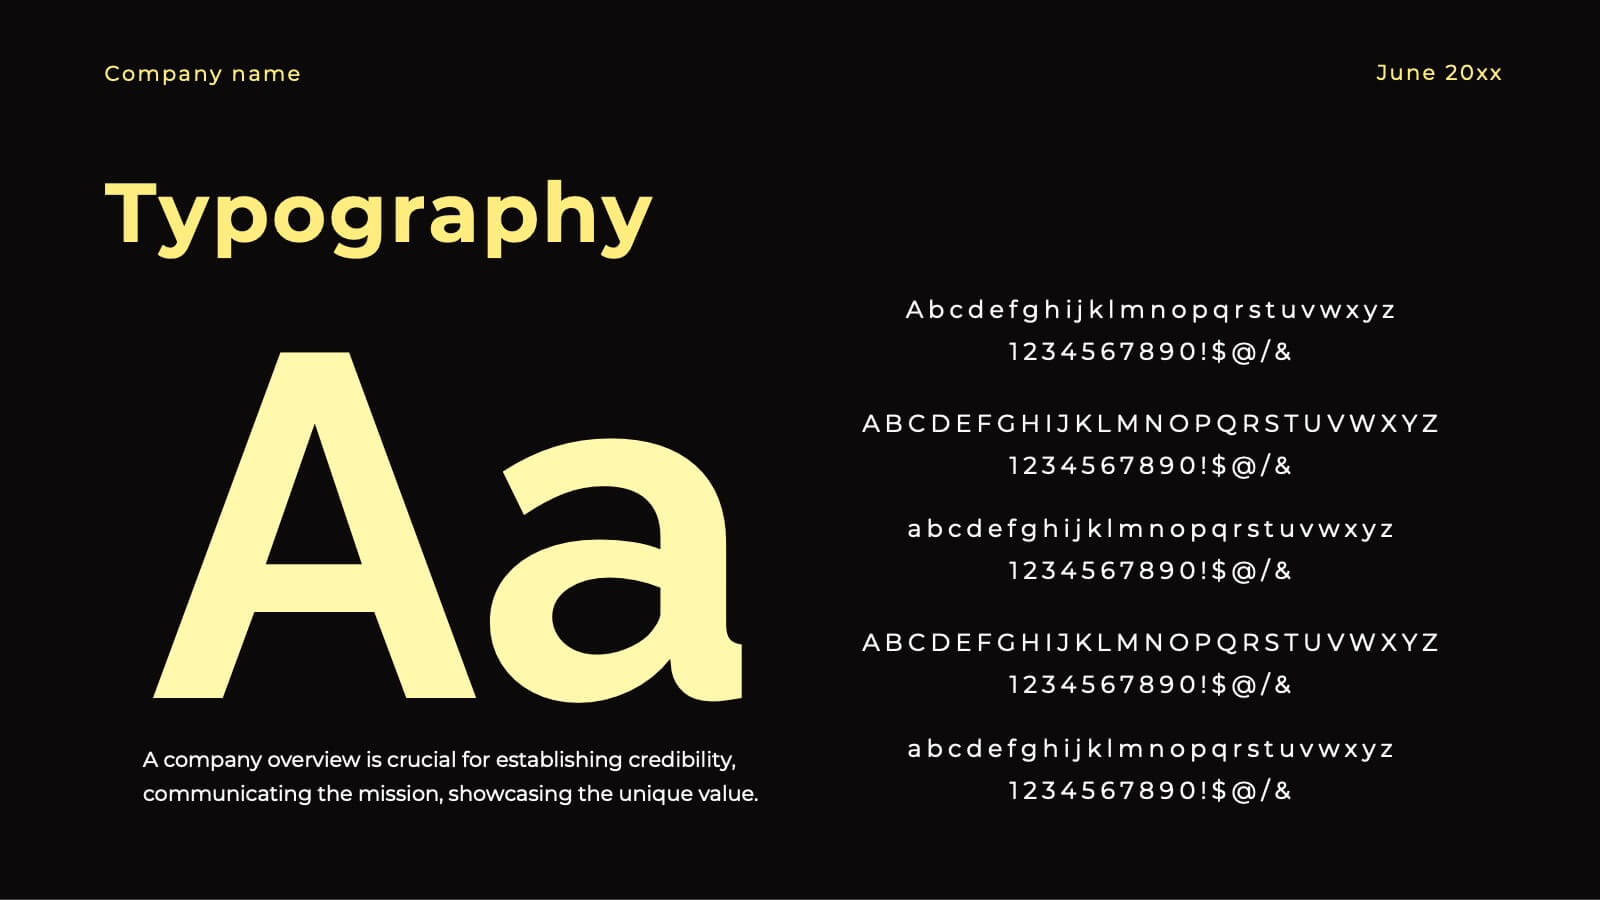
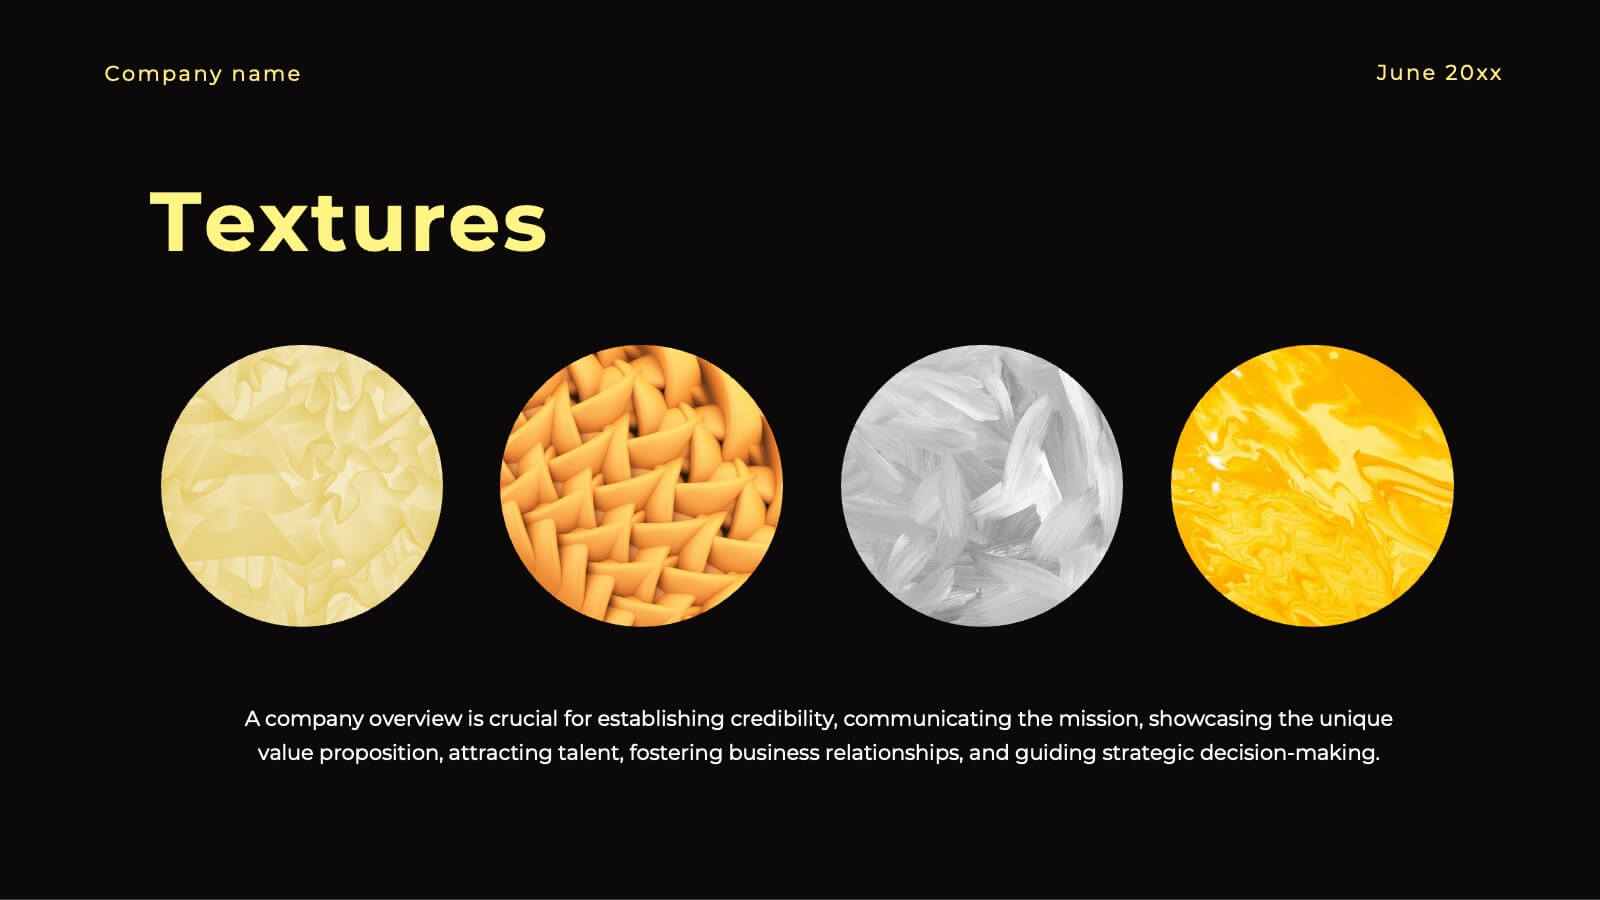
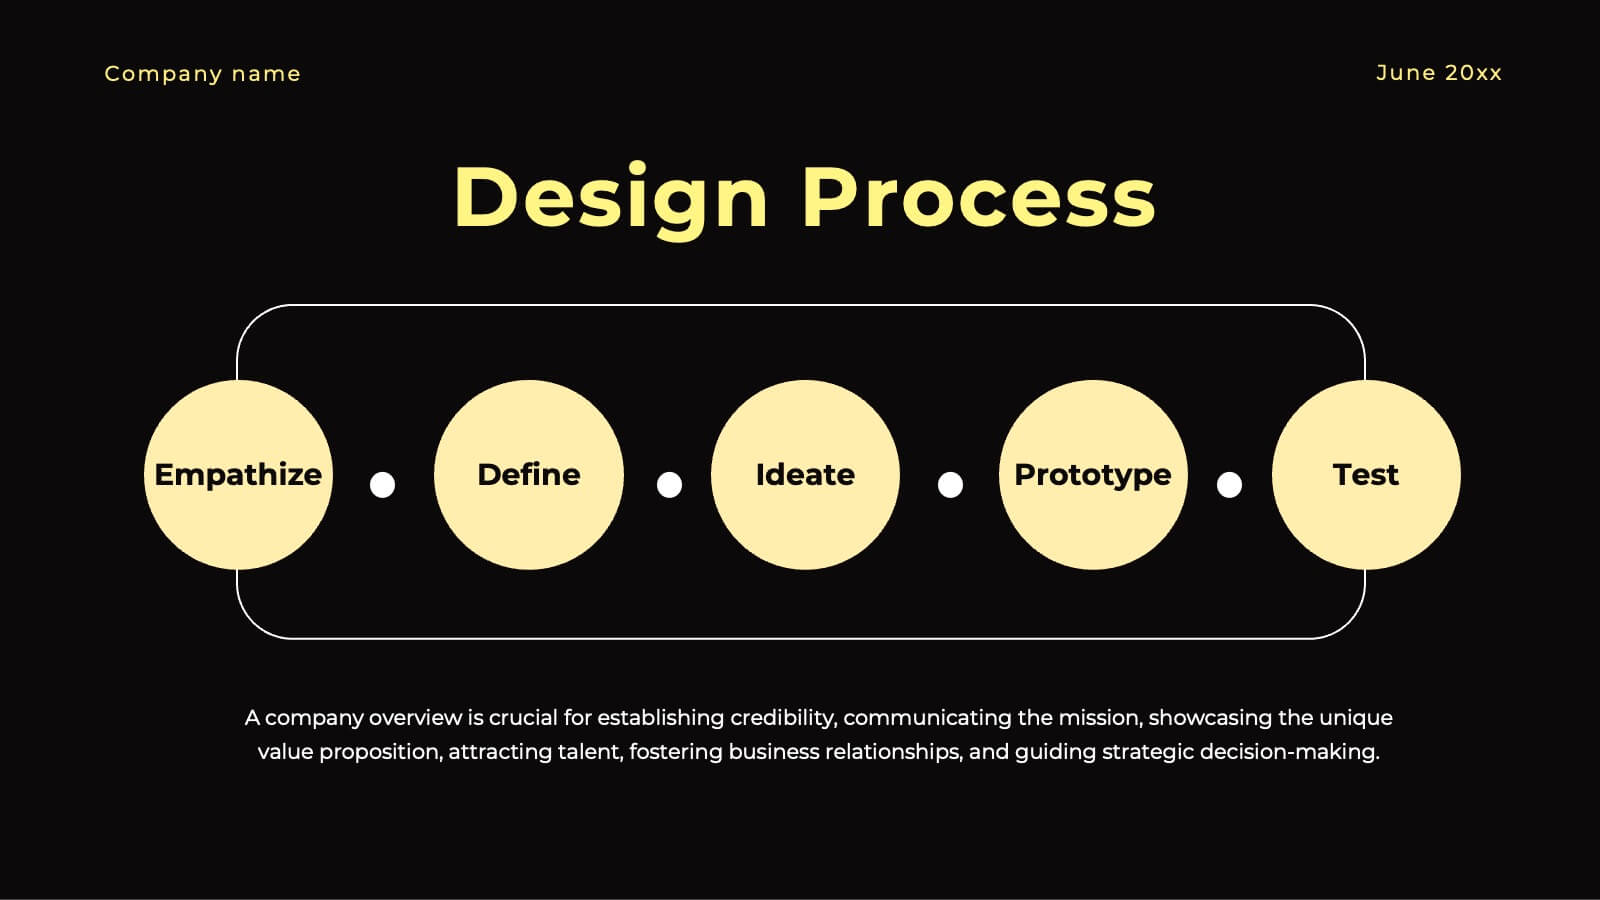
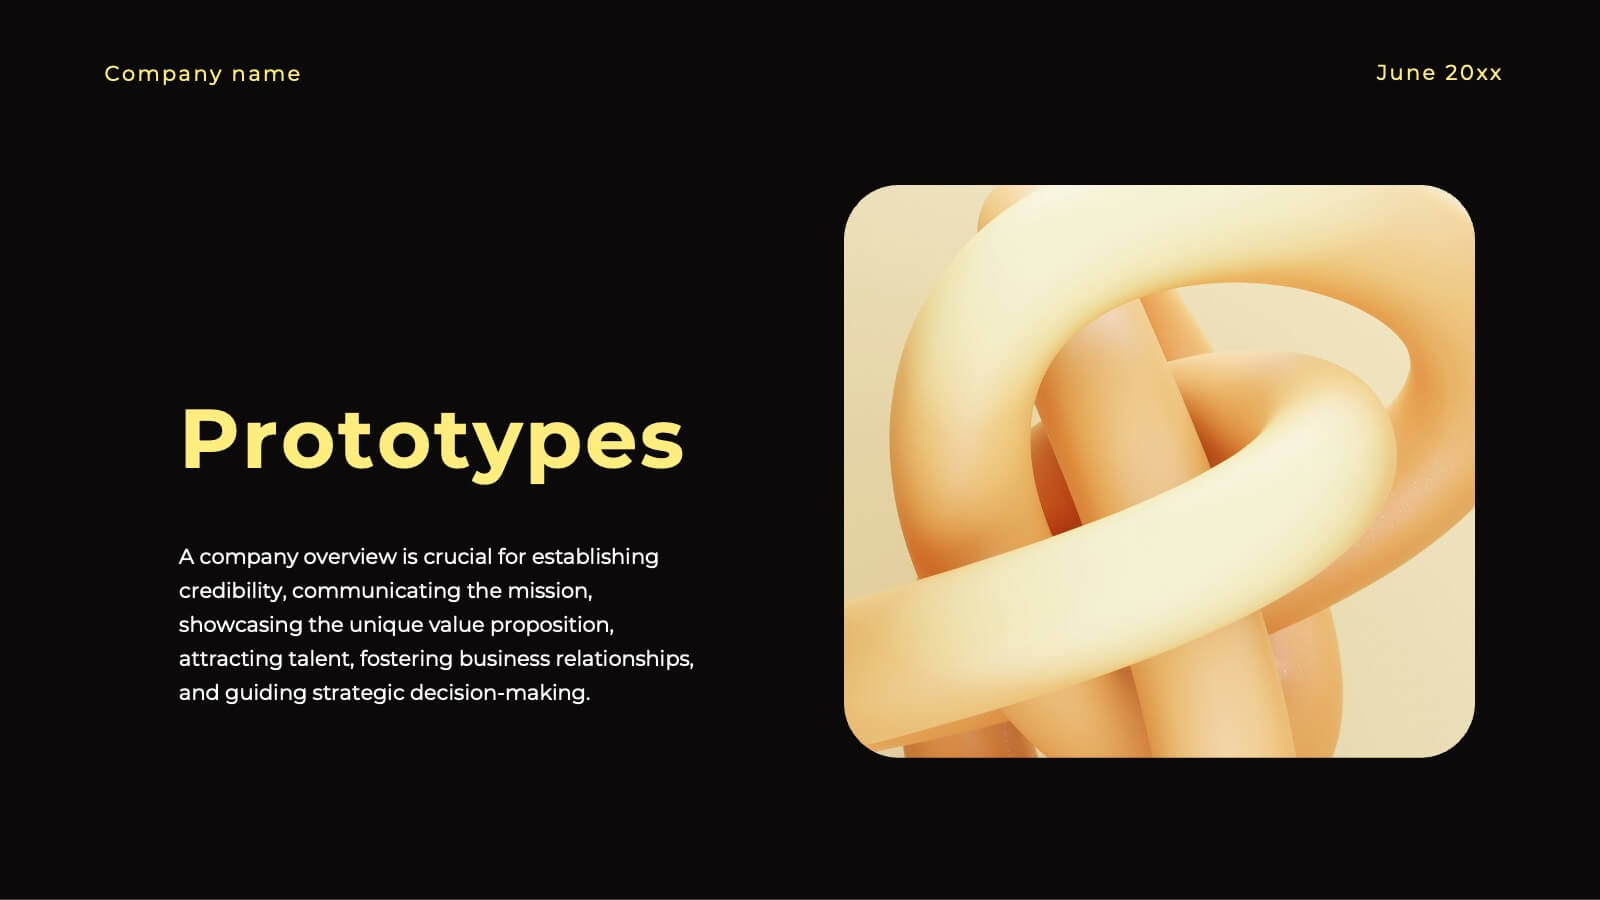
Unleash your creativity with this stunning design presentation template! Perfect for showcasing concept development, design processes, and final prototypes, it includes slides for typography, color palettes, and project timelines. Captivate your audience with sleek visuals and detailed content. Compatible with PowerPoint, Keynote, and Google Slides for seamless presentations on any platform.


5 slides
Environment Preservation Infographics
Environment preservation refers to the protection, conservation, and sustainable management of natural resources and ecosystems to maintain their integrity and ensure their long-term viability. These vertical infographics are designed to raise awareness about the current environmental challenges and inspire individuals and communities to take action to protect and conserve the environment. It can be used in presentations, workshops, educational campaigns, and sustainability initiatives to inspire individuals, organizations, and communities to take steps towards a more sustainable and resilient future. Compatible with Powerpoint, Keynote, and google Slides.


5 slides
Empowered Leadership and Influence Strategy
Showcase impactful leadership journeys with the Empowered Leadership and Influence Strategy Presentation. This slide features a bold mountain-style layout that symbolizes growth, with five colorful peaks representing key leadership steps or principles. Perfect for professional development workshops, executive coaching, or team-building presentations. Fully editable and compatible with PowerPoint, Keynote, and Google Slides.


6 slides
Risk Prevention and Security Measures Presentation
Enhance your safety strategy with this professional infographic slide. Designed to highlight five key risk and security areas, it features a clean, diamond layout with icon-based callouts. Ideal for business continuity plans, risk assessments, or compliance reports. Fully editable in PowerPoint, Keynote, and Google Slides.


21 slides
Auster Financial Report Presentation
Present financial insights with clarity using this comprehensive report template. Highlight key metrics, performance, project progress, competitor analysis, and strategic initiatives. Includes sections for team productivity, market trends, goals, and recommendations. Perfect for business reviews and updates. Fully customizable for PowerPoint, Keynote, and Google Slides.


8 slides
Corporate Annual Summary Report Presentation
Visualize your company's yearly progress with the Corporate Annual Summary Report Presentation. This professional template highlights quarterly results using progress circles and percentage data, making it easy to track key milestones and performance. Perfect for board meetings and stakeholder reports. Fully editable in Canva, PowerPoint, and Google Slides.


20 slides
Mythion Business Idea Pitch Deck Presentation
Communicate your business vision with clarity and impact using this comprehensive pitch deck presentation template. Perfect for entrepreneurs, startups, and innovators, this template is designed to help you effectively present your idea to investors, stakeholders, or partners. Cover every essential aspect of your business journey with slides dedicated to the problem statement, solutions, market overview, and target audience. Showcase your business model, revenue projections, and unique selling proposition with visually appealing layouts. Highlight your marketing strategy, growth projections, and funding requirements to build a strong, persuasive case. Fully customizable and compatible with PowerPoint, Google Slides, and Keynote, this template allows you to tailor each slide to suit your business identity and goals. Whether you're pitching a new idea or seeking investment, this template ensures you present with professionalism and confidence.


6 slides
Executive Summary Marketing Infographic
An executive summary is a concise overview of a longer document, report, or proposal, designed to provide readers with a quick understanding of the main points and key takeaways. This infographic template provides a concise and visually appealing overview of a marketing plan, campaign, or strategy. This condenses key information into a format that is easy to understand and presents the most important highlights for decision-makers. This template is a valuable tool to quickly convey the main points and benefits of a document, allowing readers to make informed decisions about whether to delve deeper into the details.


6 slides
South America Biome Map Infographics
Explore our adaptable South America Biome Map infographic template, a powerful resource for visualizing the diverse ecosystems found across the South American continent. This template is fully compatible with popular presentation software such as PowerPoint, Keynote, and Google Slides, enabling you to easily customize it to suit your specific needs. The South America Biome Map infographic template serves as a flexible canvas for illustrating information about various biomes, including rainforests, grasslands, deserts, and more. Whether you're an educator, environmental enthusiast, or simply intrigued by South America's ecology, this template offers an intuitive platform to create informative presentations and educational materials. Impress your audience with this SEO-optimized South America Biome Map infographic template, expertly designed for clarity and user-friendliness. Customize it to showcase the unique features and biodiversity of South America's biomes, making it an invaluable tool for your projects and presentations. Get started on crafting your personalized infographic today!