


Features
- 6 Unique slides
- Fully editable and easy to edit in Microsoft Powerpoint, Keynote and Google Slides
- 16:9 widescreen layout
- Clean and professional designs
- Export to JPG, PDF or send by email


Do you have any questions?
Recommend


5 slides
Employee Onboarding HR Presentation
Start your presentation with energy and clarity using this clean, engaging slide designed to simplify every step of the onboarding journey. It helps explain employee integration, training stages, and team alignment in a way that feels intuitive and visually organized. Fully compatible with PowerPoint, Keynote, and Google Slides.


5 slides
Poaching Facts Infographics
Poaching refers to the illegal hunting, capturing, or killing of wildlife, typically for profit or personal gain. These compelling and informative infographic templates are designed to shed light on the issue of poaching and its impact on wildlife and ecosystems. They present key facts, statistics, and illustrations to raise awareness about the seriousness of poaching and the need for conservation efforts. By increasing awareness and understanding of the poaching crisis, these templates contribute to the collective efforts in protecting our precious wildlife and preserving the natural world.


4 slides
Watercolor Style Infographic Presentation
Bring an artistic flair to your data storytelling with this Watercolor Style Infographic Presentation. Featuring elegant, hand-painted flower visuals labeled A–D, this template is perfect for showcasing ideas in a soft, organic, and creative way. Ideal for branding presentations, product highlights, or educational content. Compatible with PowerPoint, Keynote, and Google Slides. Fully customizable and easy to use.


3 slides
Short-Term and Long-Term Action Goals Presentation
Plan with purpose using the Short-Term and Long-Term Action Goals Presentation. This clear, side-by-side layout helps you organize initiatives by timeframe—perfect for project planning, strategy roadmaps, or goal tracking. Fully editable in Canva, PowerPoint, and Google Slides for easy customization across teams and presentations.


8 slides
Success Strategy Triangle Presentation
Craft a winning strategy with the Success Strategy Triangle template. This structured design helps visualize key business components in a step-by-step format, making it ideal for growth planning, decision-making, and performance analysis. Fully customizable and easy to use, it’s compatible with PowerPoint, Keynote, and Google Slides for seamless integration.


26 slides
Textures Company Profile Black Presentation
A company profile is a concise document that provides an overview of a business, its history, products or services, achievements, mission, vision, values, and other relevant information. This presentation template is designed for businesses to showcase their brand identity and services in an elegant and professional manner. With a dominant black color theme, this presentation exudes a sense of modernity and class, making it perfect for businesses in various industries. Introduce your company's history, mission, and values in a concise and compelling manner. Utilize the clean and clear typography to maintain a professional and sophisticated look.


6 slides
Aviation Center Infographic
An aviation center refers to a facility or institution that is dedicated to activities related to aviation, which includes the design, development, manufacturing, maintenance, operation, and training associated with aircraft and aerospace technology. This engaging infographic template provides a concise and visually appealing overview of an aviation center's facilities, services, and offerings. This infographic plays a vital role in advancing the aviation industry, conducting research, offering training, and providing resources for aviation professionals and enthusiasts. This is the perfect template to encourage potential pilots and aviation enthusiasts.


5 slides
Marketing Sales Funnel Presentation
Watch your customer journey come to life with a clean, visual flow that makes each stage easy to understand at a glance. This presentation breaks down your funnel into clear steps, helping you explain conversions, behaviors, and strategy with confidence. Fully compatible with PowerPoint, Keynote, and Google Slides.


24 slides
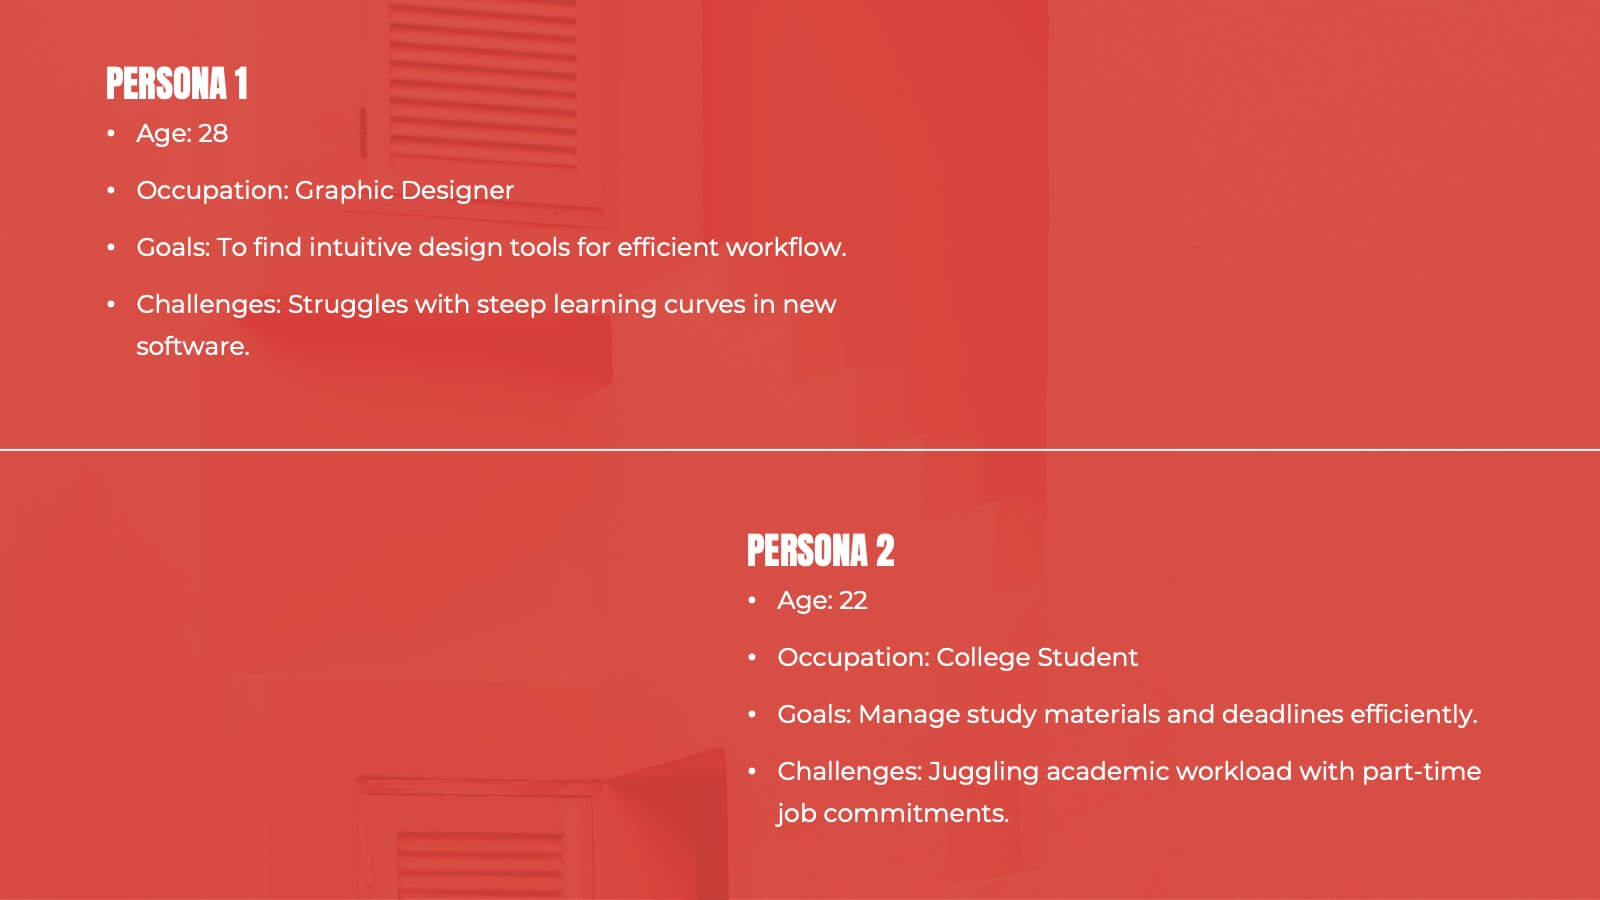
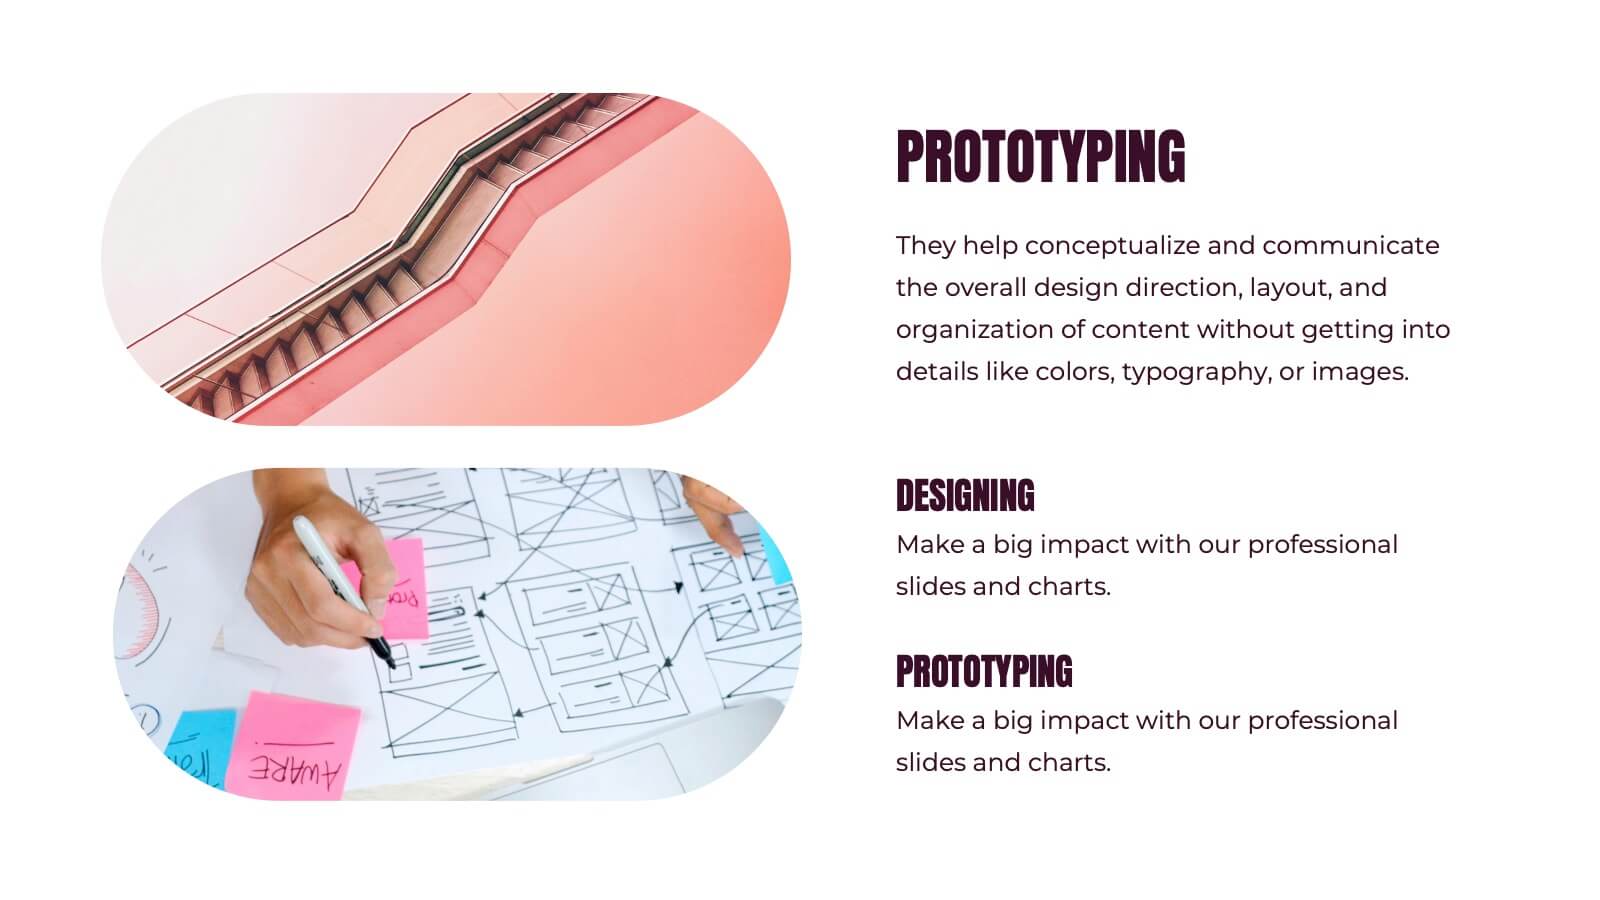
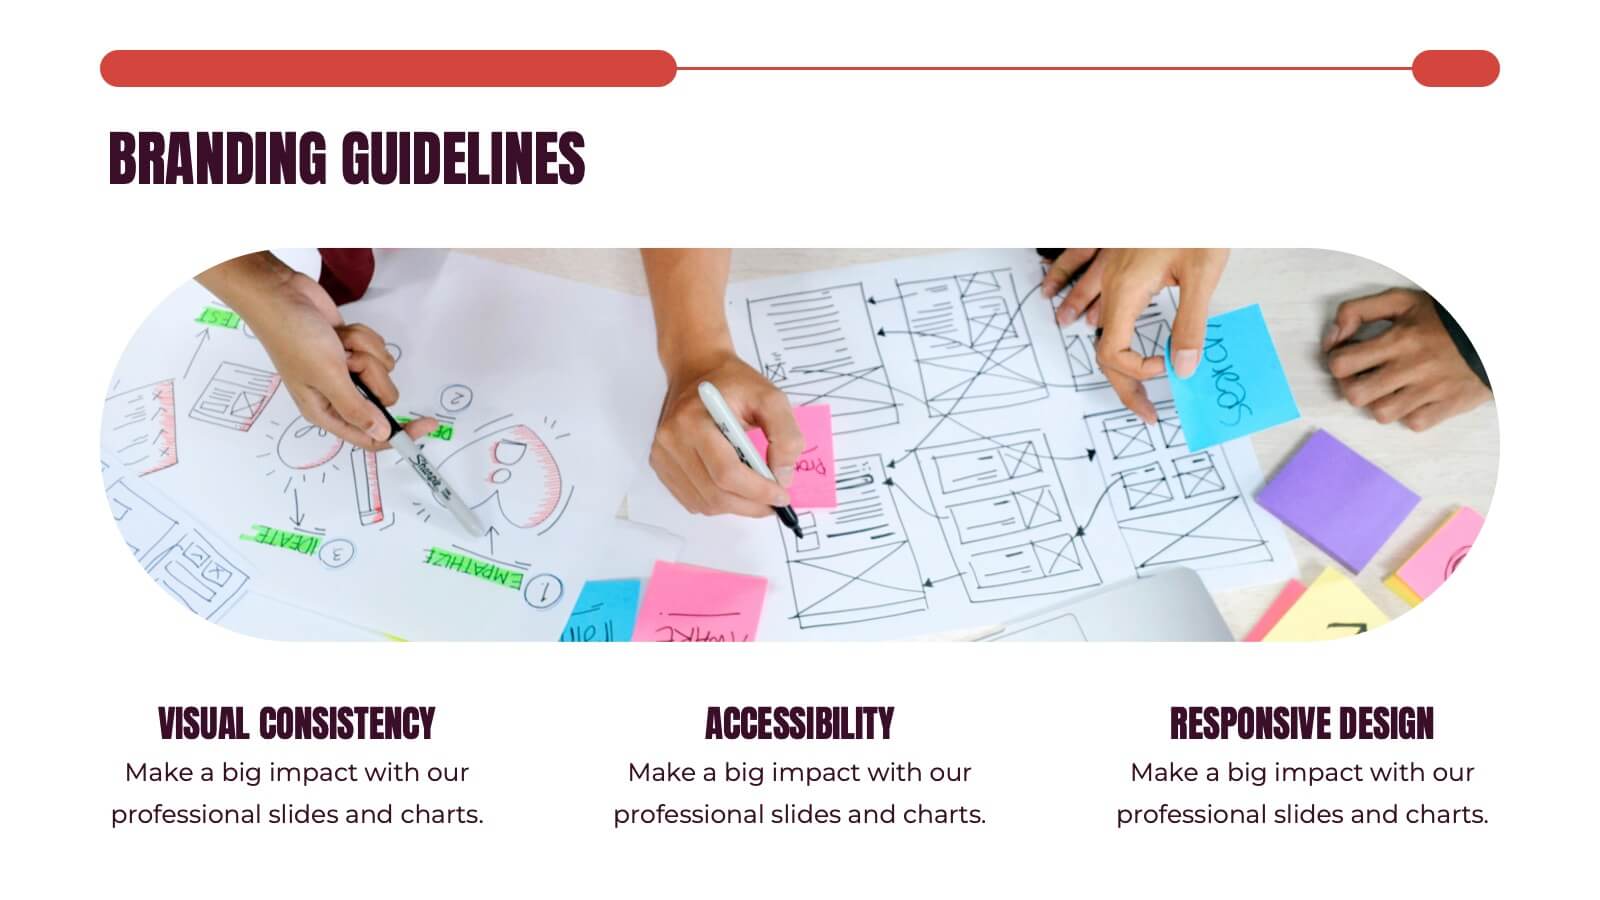
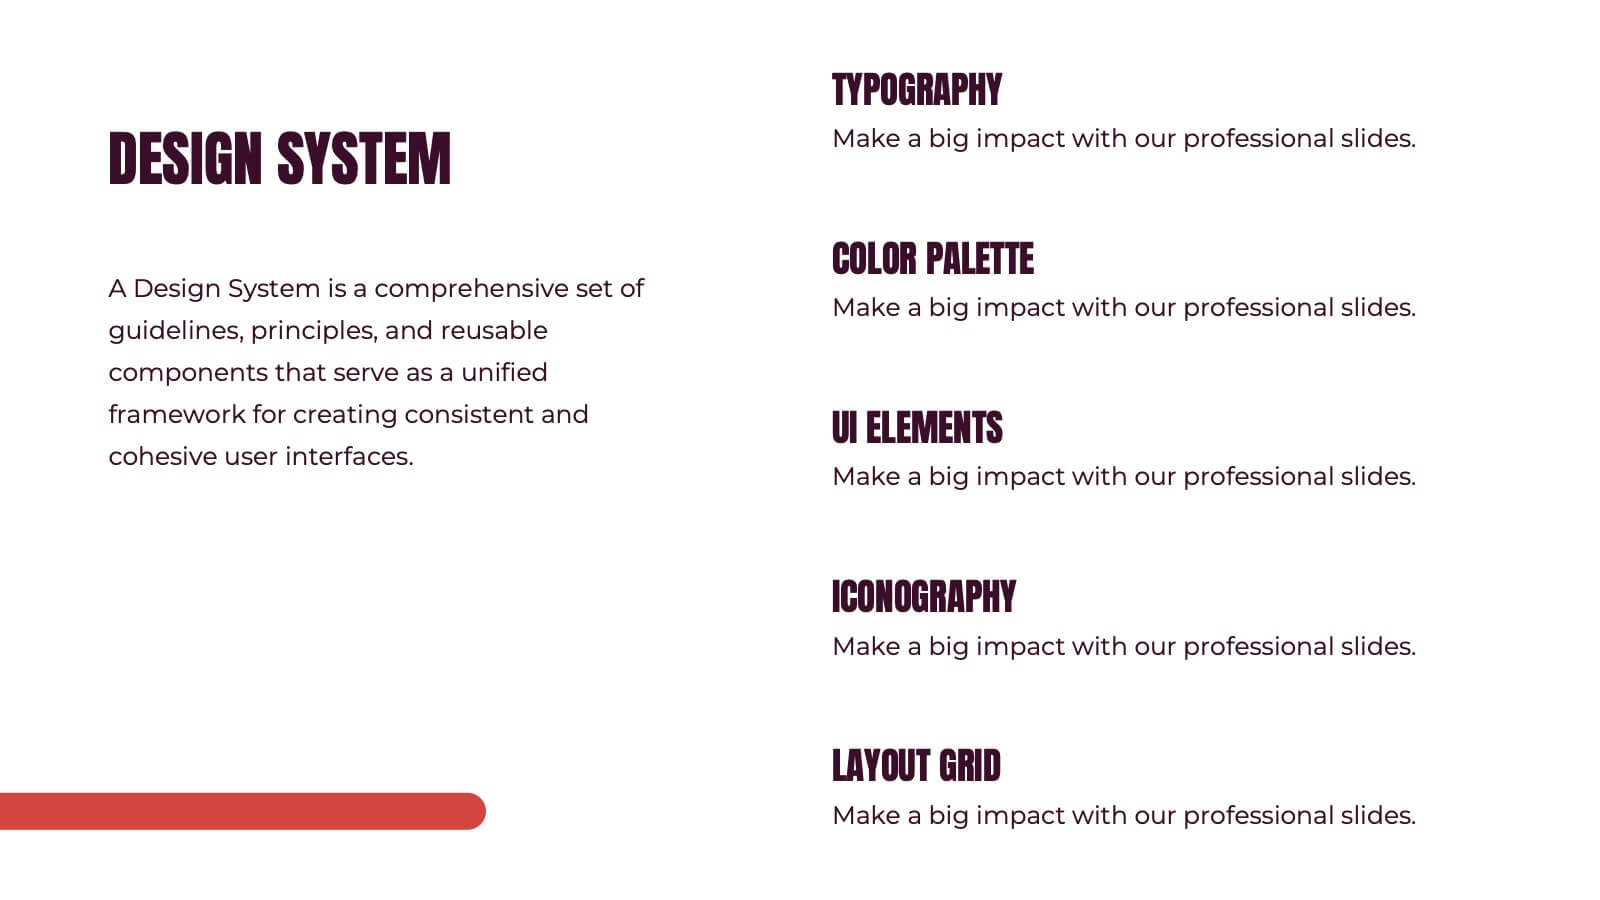
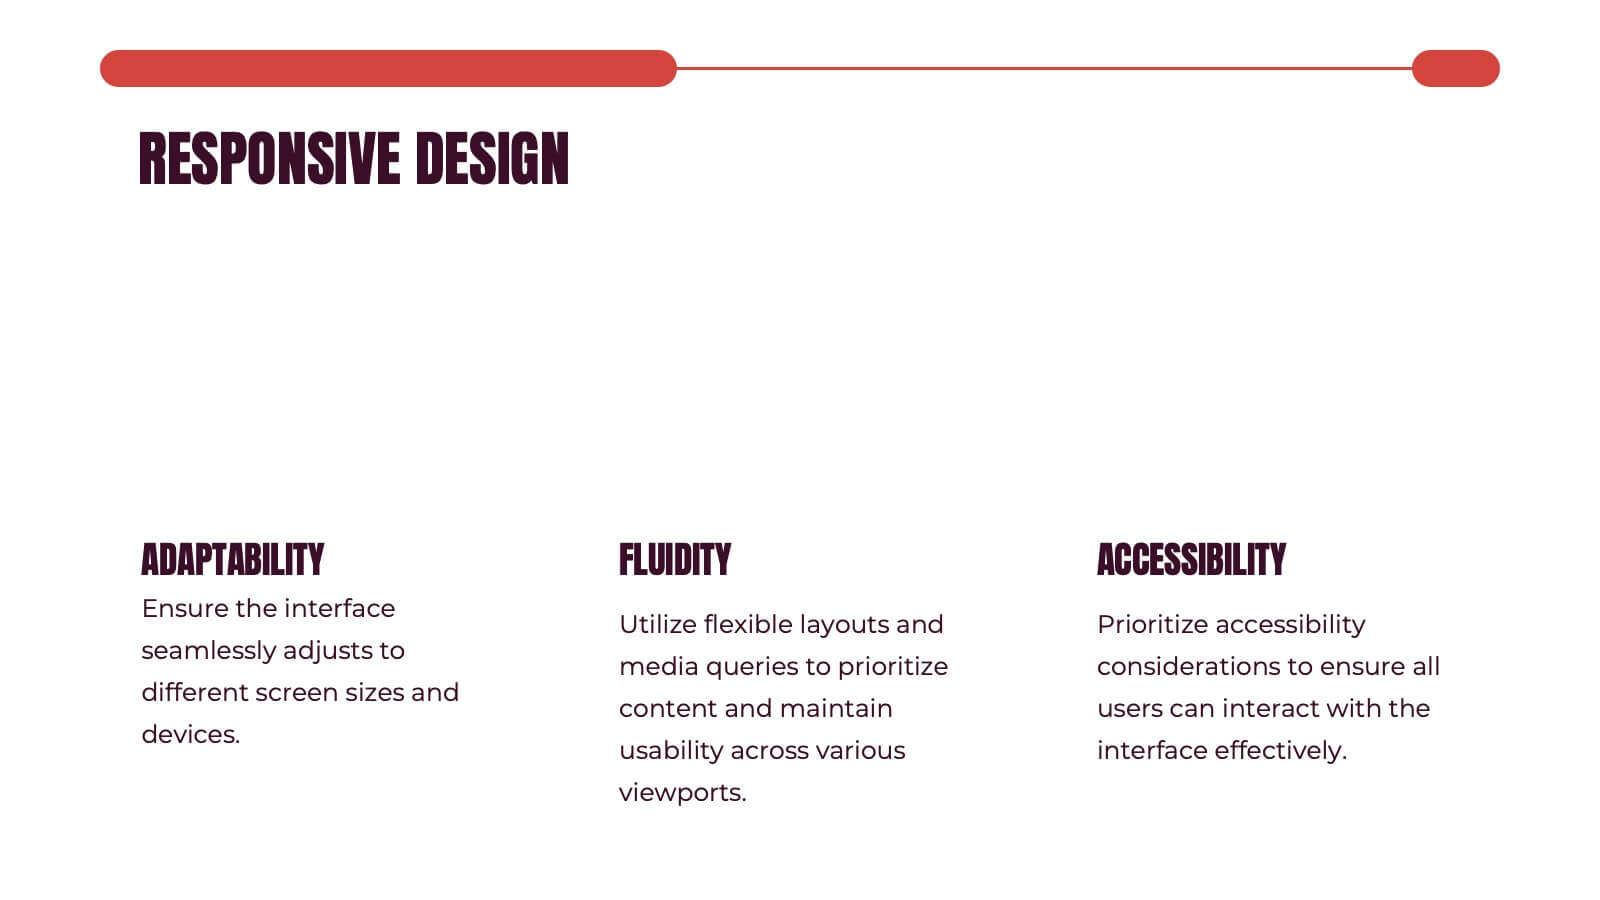
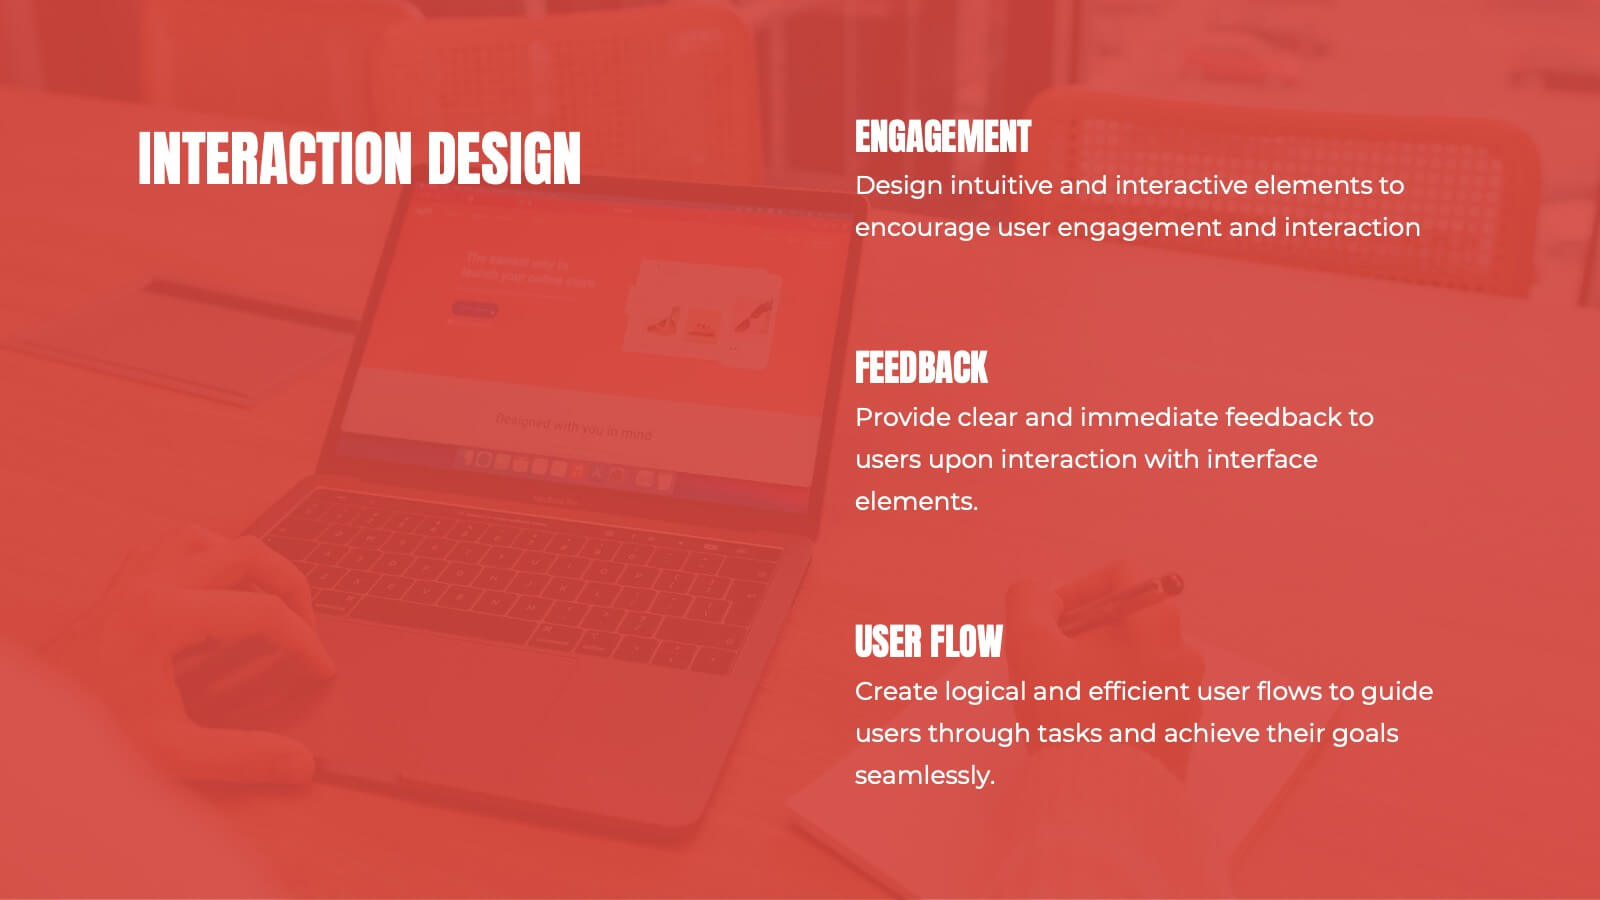
Kismet UX Design Presentation
Dive into the world of design with this stunning presentation template! Perfect for explaining user experience concepts, this template covers everything from wireframes to prototyping. It's designed to captivate your audience with visually engaging slides and clear, concise information. Compatible with PowerPoint, Keynote, and Google Slides for effortless use across platforms.


6 slides
Professional Business Plan Presentation
Make every idea count with a clean, professional presentation that helps you communicate your business strategy clearly and confidently. Ideal for showcasing goals, market insights, and performance plans, it delivers structure with style. Fully compatible with PowerPoint, Keynote, and Google Slides for easy customization and seamless presentation design.


20 slides
Firelight Design Portfolio Presentation
This Design Portfolio Presentation Template offers a bold and modern layout to showcase your creative projects, services, and achievements. It features sections for project highlights, awards, client testimonials, and pricing, making it perfect for freelancers and agencies. Fully customizable in PowerPoint, Keynote, and Google Slides.


5 slides
Scrum Methodology for Product Development Presentation
Visualize each phase of your product development lifecycle using this Scrum methodology diagram. Highlight team roles, sprint cycles, and delivery steps with clear, color-coded sections. Ideal for Agile coaches, product managers, and tech teams. Fully editable in PowerPoint, Keynote, and Google Slides to align with your project planning needs.


7 slides
Oceania Map Infographic Presentation Template
The Oceania Map is a geographical region comprising Australasia, Melanesia, Micronesia and Polynesia. The largest landmass of Oceania is Australia. Oceania's borders differ slightly from country to country, but its boundaries are mostly defined by the waters surrounding its many islands. This Oceania map template is the first step to creating an engaging and informative map. It features the entire continent, surrounding islands, and sub-regions. The white background makes it easy to fill out with your colorful content. This template is suitable for school projects or business presentations.


6 slides
Six Sigma DMAIC Cycle Overview Presentation
Present each phase of the DMAIC methodology with the Six Sigma DMAIC Cycle Overview Presentation. This clean and professional layout walks through Define, Measure, Analyze, Improve, and Control in a clear, easy-to-follow structure. Perfect for Six Sigma professionals, quality managers, and operational teams. Fully editable in Canva, PowerPoint, Keynote, and Google Slides.


7 slides
Customer Thank You Infographic
Elevate your expressions of gratitude with this sophisticated collection, designed to blend elegance with heartfelt thanks. Each piece in this set is crafted with meticulous attention to detail, featuring a mix of subtle color palettes, elegant typography, and beautifully arranged visual elements to enhance the sincerity of your message. Choose from a variety of designs, ranging from minimalist to more richly layered compositions, each providing a unique way to communicate appreciation. These designs can be customized to suit any occasion, making them perfect for expressing professional thanks to clients, customers, or partners. Ideal for use across both digital and physical mediums, this collection helps ensure that your messages not only convey thanks but also resonate deeply with recipients, strengthening relationships and leaving a memorable impression.


20 slides
Ashen Sales Proposal Presentation
The Sales Proposal Presentation Template is designed to help you showcase your sales strategy effectively. With 20 fully customizable slides, it covers key areas such as market analysis, sales objectives, pricing strategy, and future opportunities. Ideal for professionals, it’s compatible with PowerPoint, Keynote, and Google Slides.


4 slides
Creative Brush Stroke Theme Design Presentation
Bring a bold, artistic flair to your presentation with this Creative Brush Stroke Theme Design. Featuring layered paint-like strokes in vibrant tones, this layout blends creativity with clarity—perfect for design pitches, brainstorming sessions, or visual storytelling. Fully customizable in PowerPoint, Google Slides, and Canva for seamless editing.